Gigabyte U4 UD laptop review: Lightweight with a lot of potential that goes to waste at times
With the U4 UD, Gigabyte presents an interesting subnotebook with a 14-inch Full HD display and Windows 11 in the price range below 1,000 Euros (~$1,120). One of its unique qualities is the still relatively new Intel Core i7-1195G7, which we have only seen in one review sample so far. There's no dedicated graphics solution, and the on-board Intel Iris Xe Graphics G7 96EUs GPU is used instead. In addition, the manufacturer equips the device with 16 GB of DDR4 RAM and a solid selection of ports.
We compare the Gigabyte U4 UD with the slightly more expensive MSI Prestige 14 Evo A11MO-026US that has the same CPU/GPU combination. Furthermore, the HP Envy 13-ba1475ng with the slightly weaker i7-1165G7 and the dedicated GeForce MX450 graphics card as well as the Dell Inspiron 13 5301-0D0XN with the even weaker i5-1135G7/Iris Xe G7 80EUs combination, both of which belong to the same price range, have also been added to the mix. In terms of battery life, the LG Gram 14Z90P-G.AA79G endurance prodigy with the i7-1165G7 and the Iris Xe G7 96EUs is the toughest competitor.
Possible contenders in comparison
Rating | Date | Model | Weight | Height | Size | Resolution | Price |
|---|---|---|---|---|---|---|---|
| 84.4 % v7 (old) | 11 / 2021 | Gigabyte U4 UD i7-1195G7, Iris Xe G7 96EUs | 958 g | 17 mm | 14.00" | 1920x1080 | |
| 85.3 % v7 (old) | 08 / 2021 | MSI Prestige 14 Evo A11MO-026US i7-1195G7, Iris Xe G7 96EUs | 1.2 kg | 16 mm | 14.00" | 1920x1080 | |
| 83.8 % v7 (old) | 07 / 2021 | Dell Inspiron 13 5301-0D0XN i5-1135G7, Iris Xe G7 80EUs | 1.1 kg | 16 mm | 13.30" | 1920x1080 | |
| 88.3 % v7 (old) | 05 / 2021 | LG Gram 14Z90P-G.AA79G i7-1165G7, Iris Xe G7 96EUs | 967 g | 16.8 mm | 14.00" | 1920x1200 | |
| 85.3 % v7 (old) | 05 / 2021 | HP Envy 13-ba1475ng i7-1165G7, GeForce MX450 | 1.3 kg | 17 mm | 13.30" | 1920x1080 |
Very light subnotebook housed in a sober and robust aluminum case
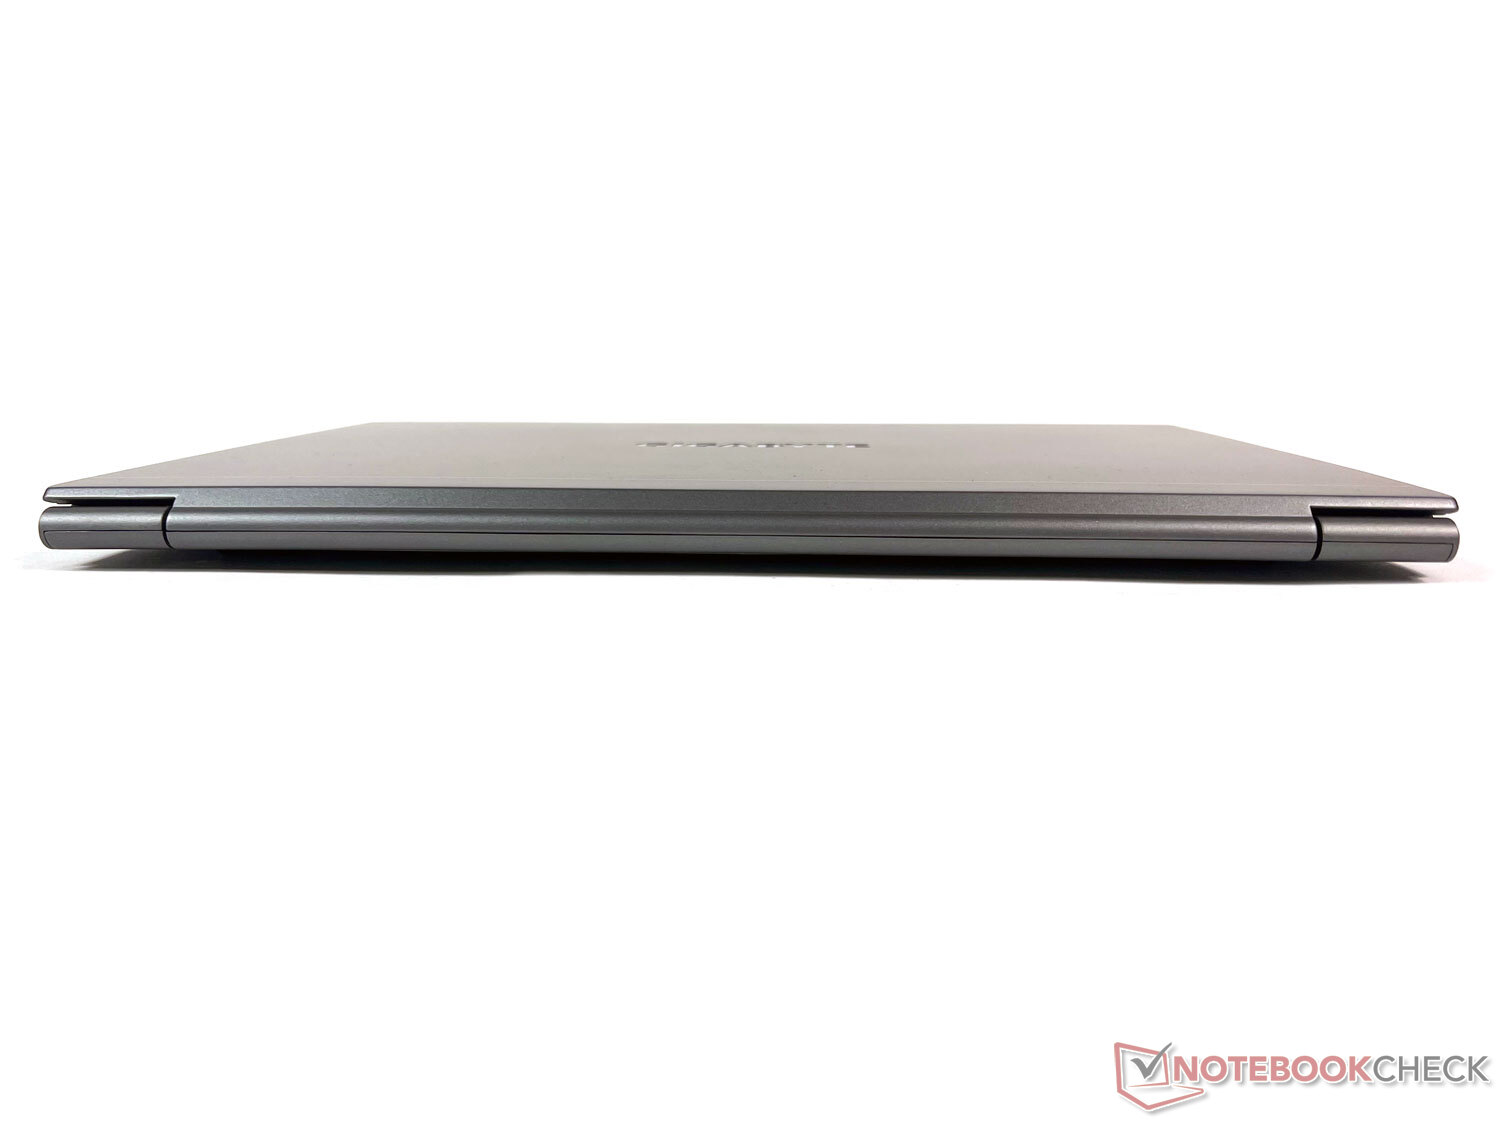
The Gigabyte U4 UD is housed in a modestly designed aluminum case that leaves a respectable and high-quality impression. The device offers sufficient resistance to torsion for it to be carried around even when being held only from a corner. It also complies with the MIL-STD 810G military standard, which means that the device is protected against vibrations, extreme temperatures, and humidity.
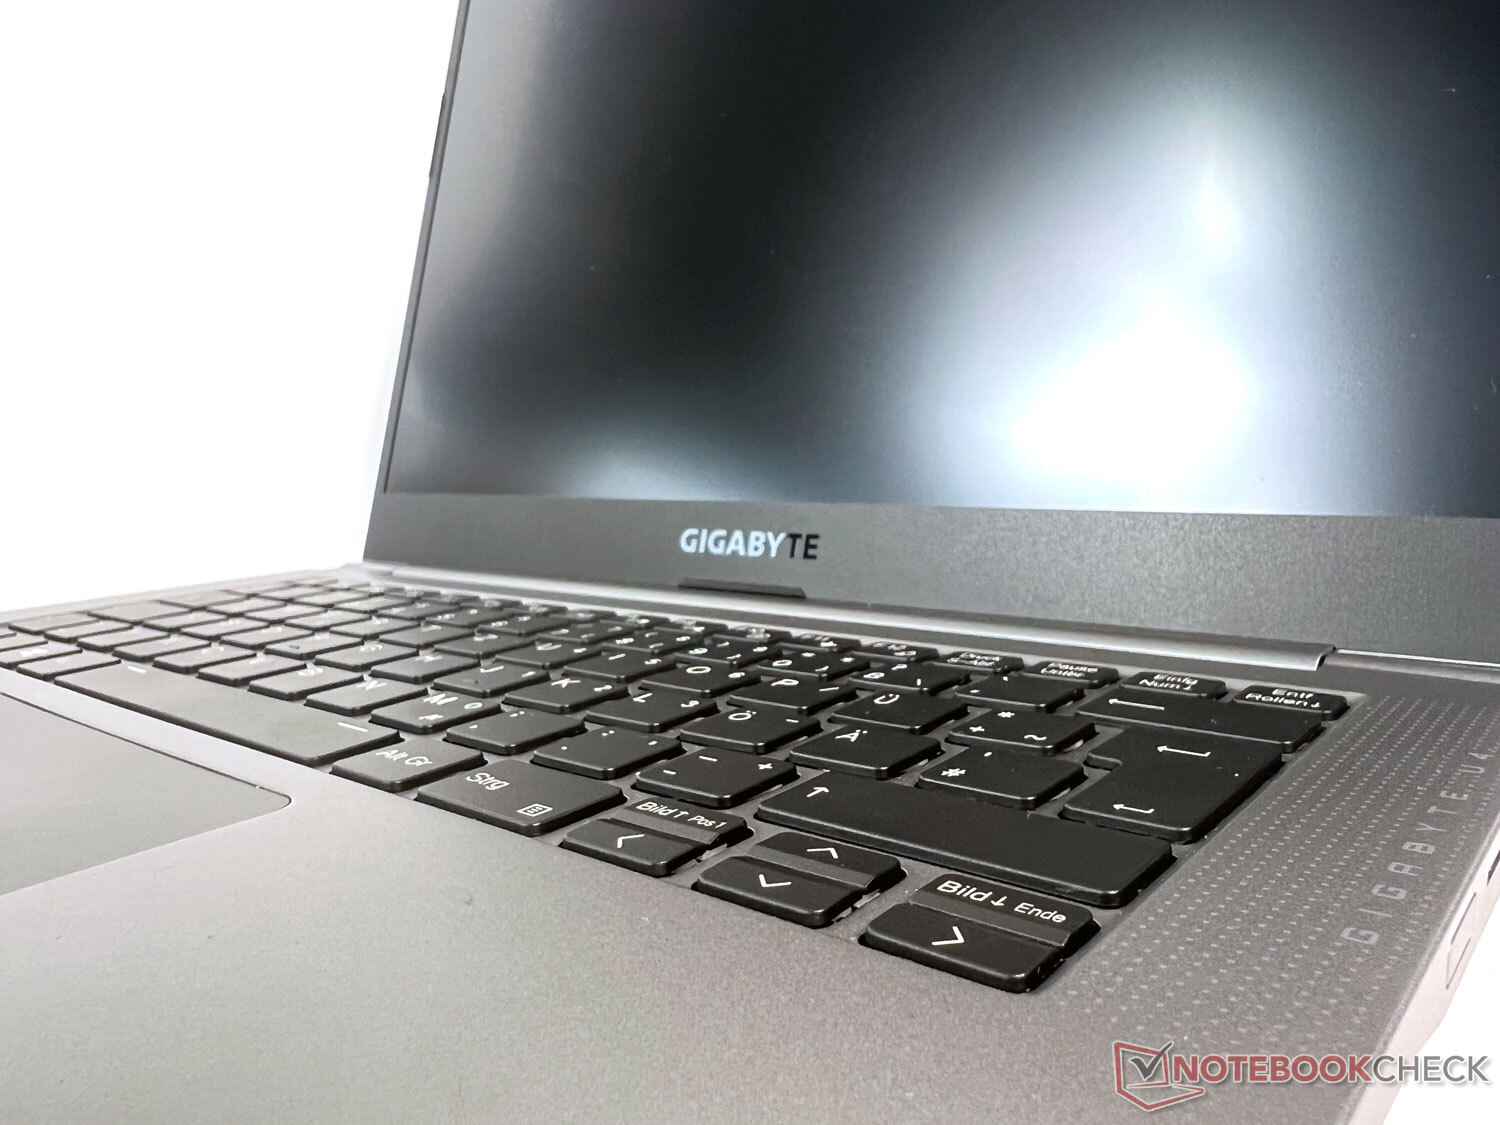
The hinges are so stiff that the opened display barely experiences any wobbling or swaying. However, the device can only be opened with one hand using a lot of skill, which is also due to the low weight.
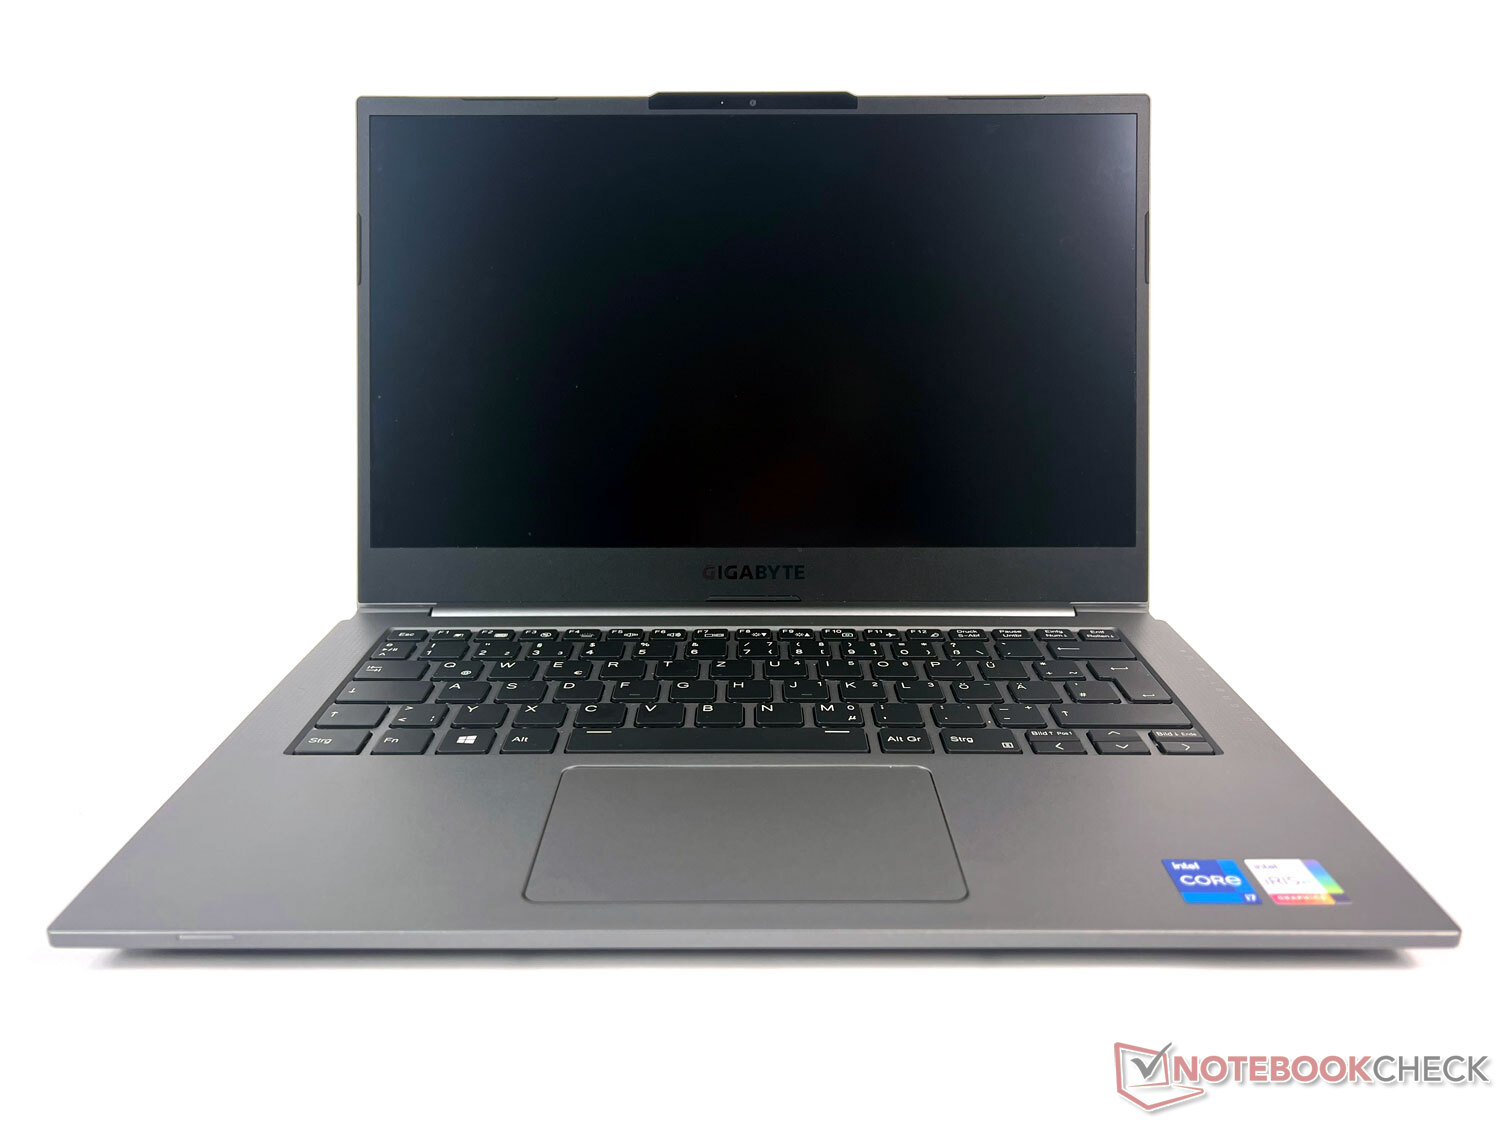
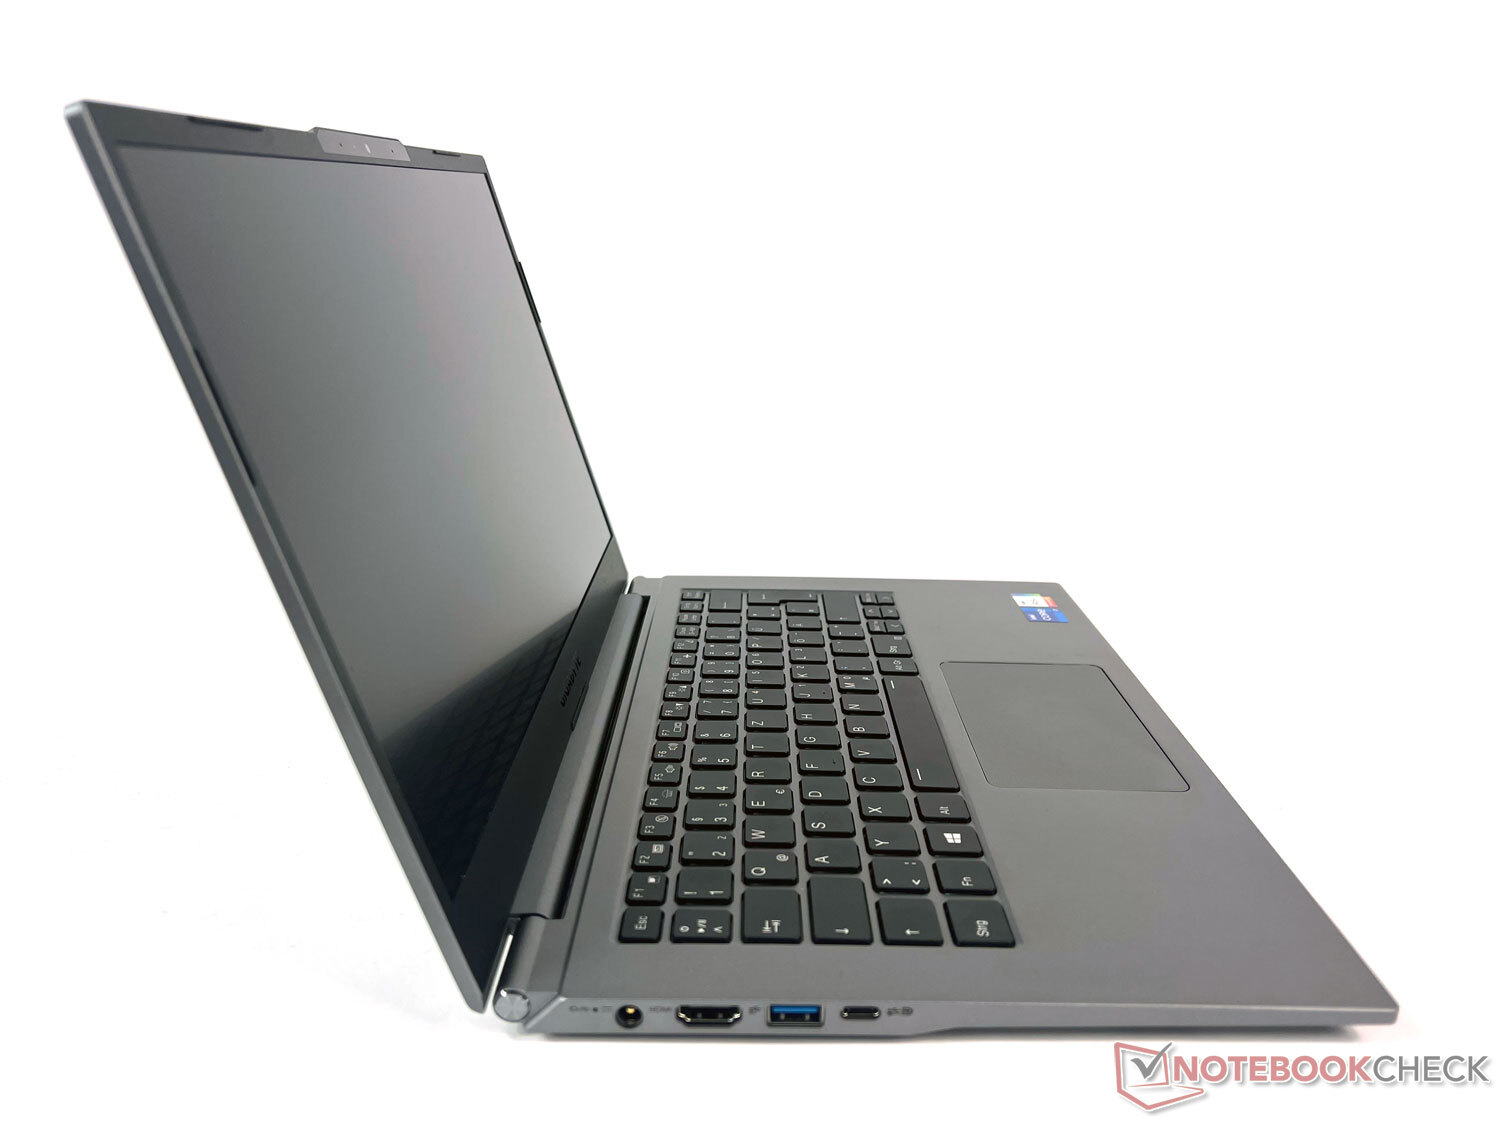
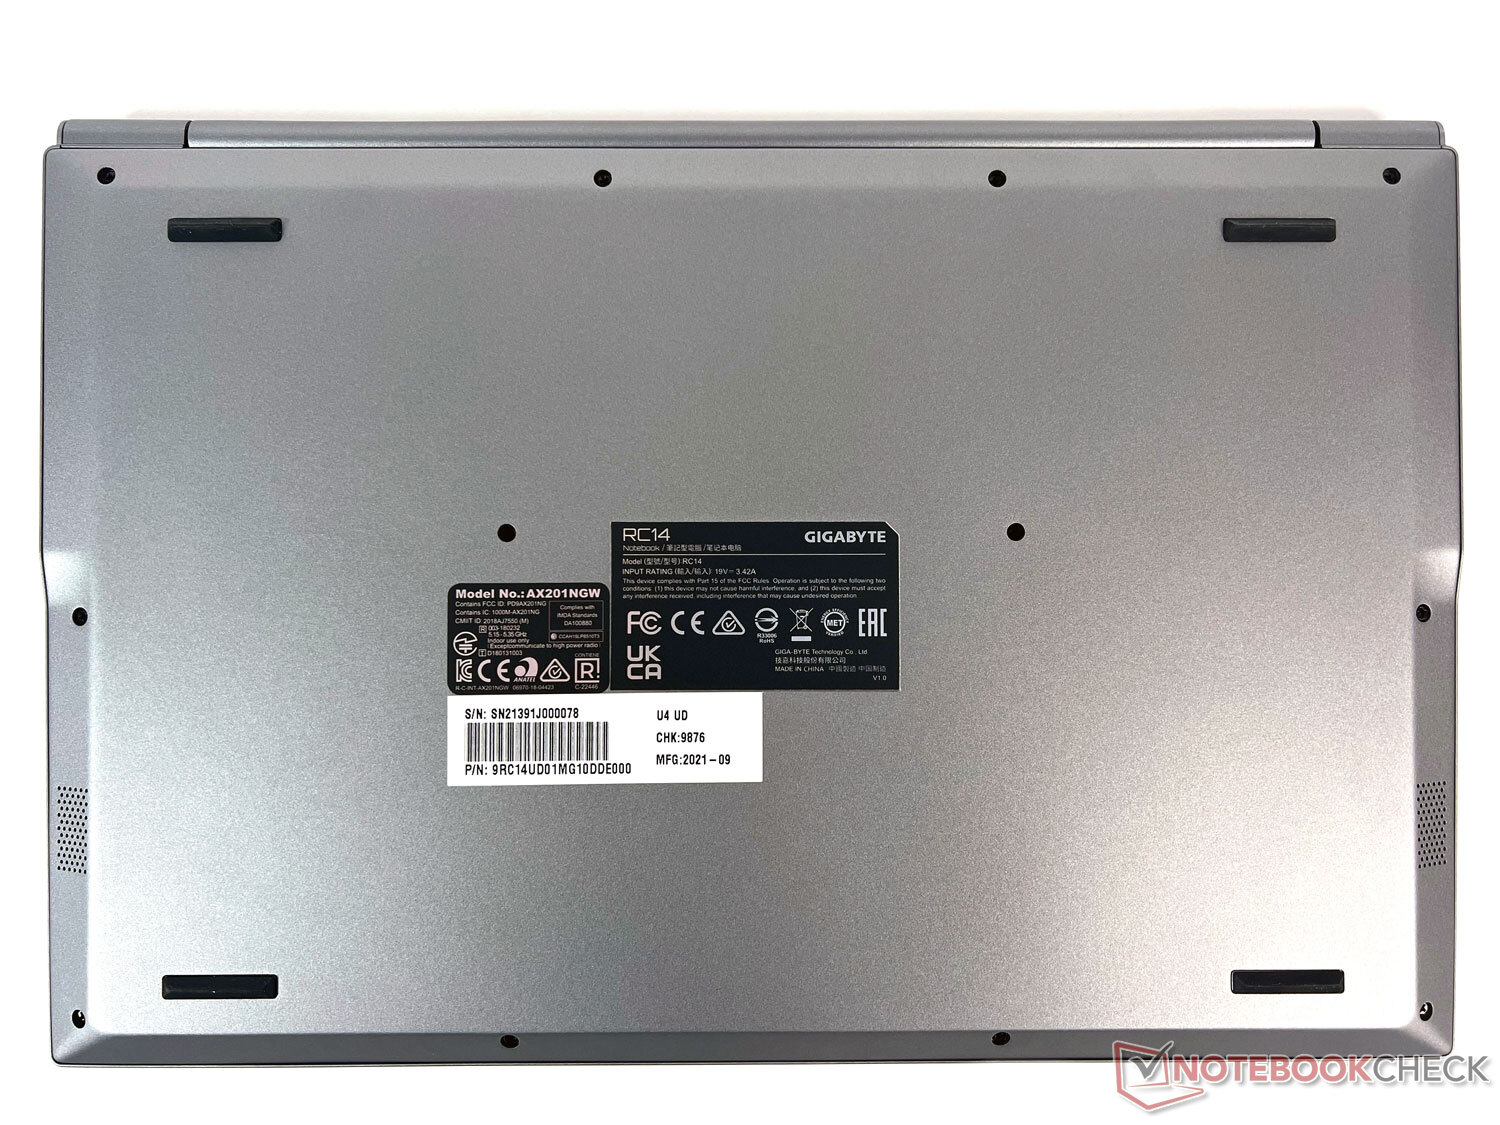
At just under one kilogram, the Gigabyte U4 UD is the lightest laptop in this comparison field, just ahead of the LG Gram 14Z90P. This is quite remarkable, since there are also some 13.3-inch models. The 14-incher is the biggest device in terms of width by a few millimeters, but it can keep up very well with the other subnotebooks when it comes to depth and thickness in particular. Overall, it's a pretty compact and, above all, a particularly light travel companion.
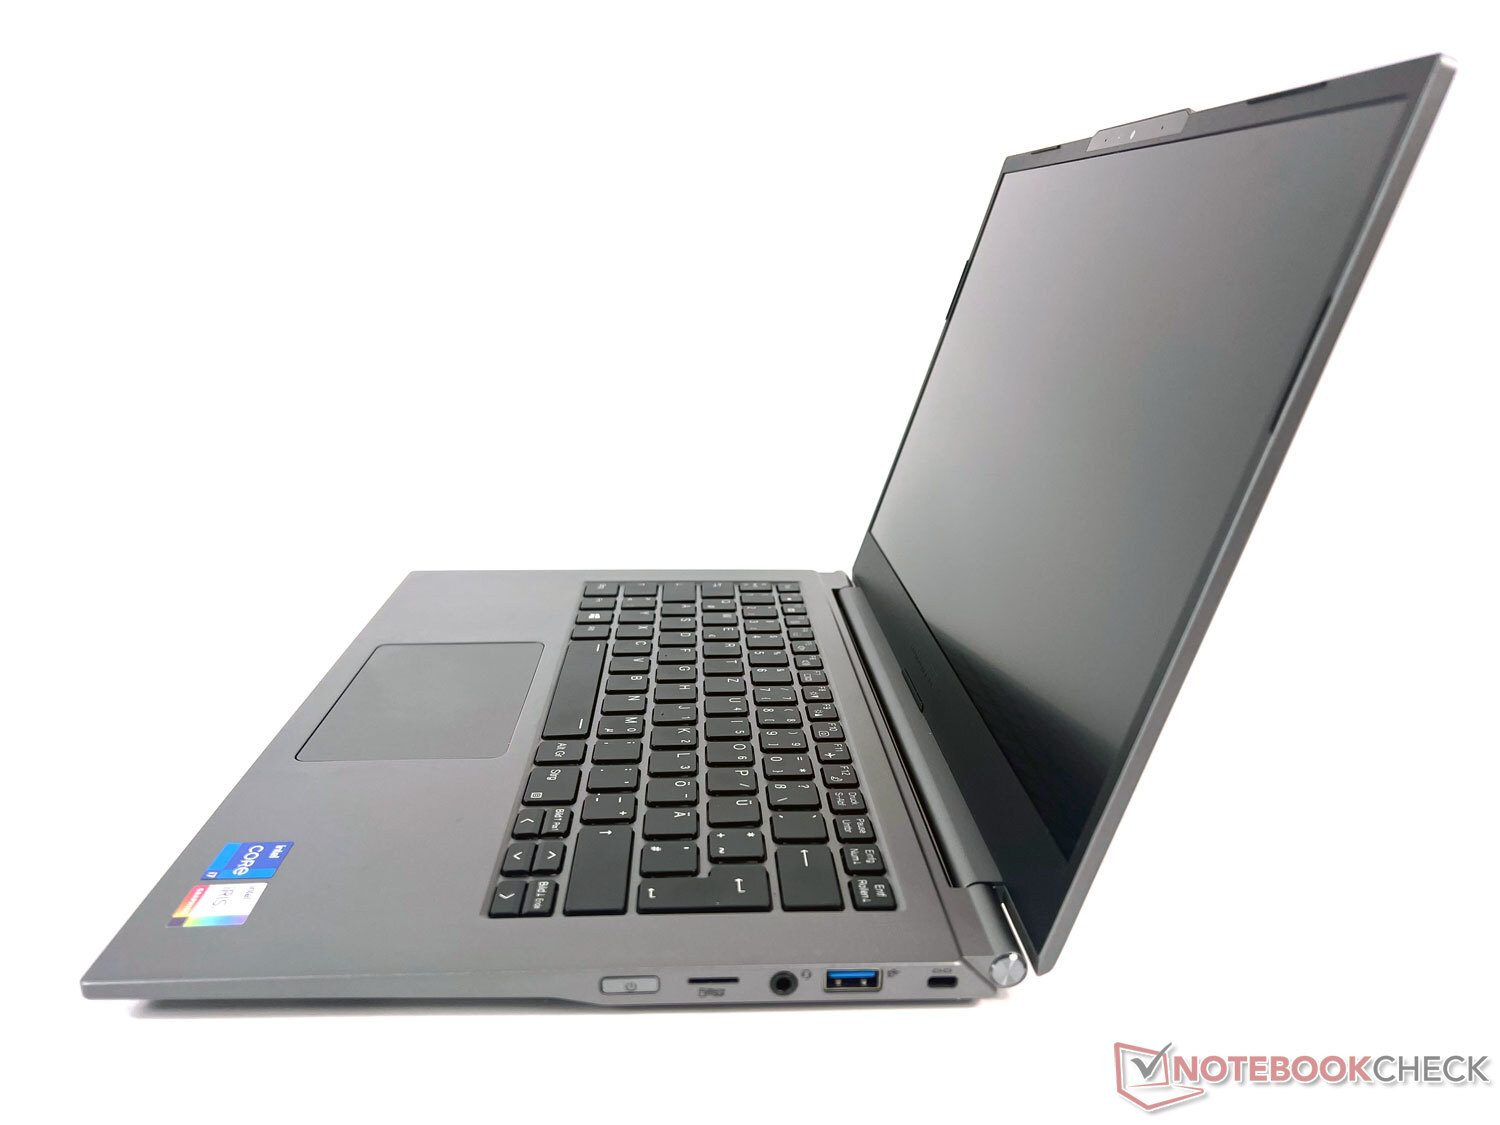
Connectivity: Thunderbolt 4 and high data rates
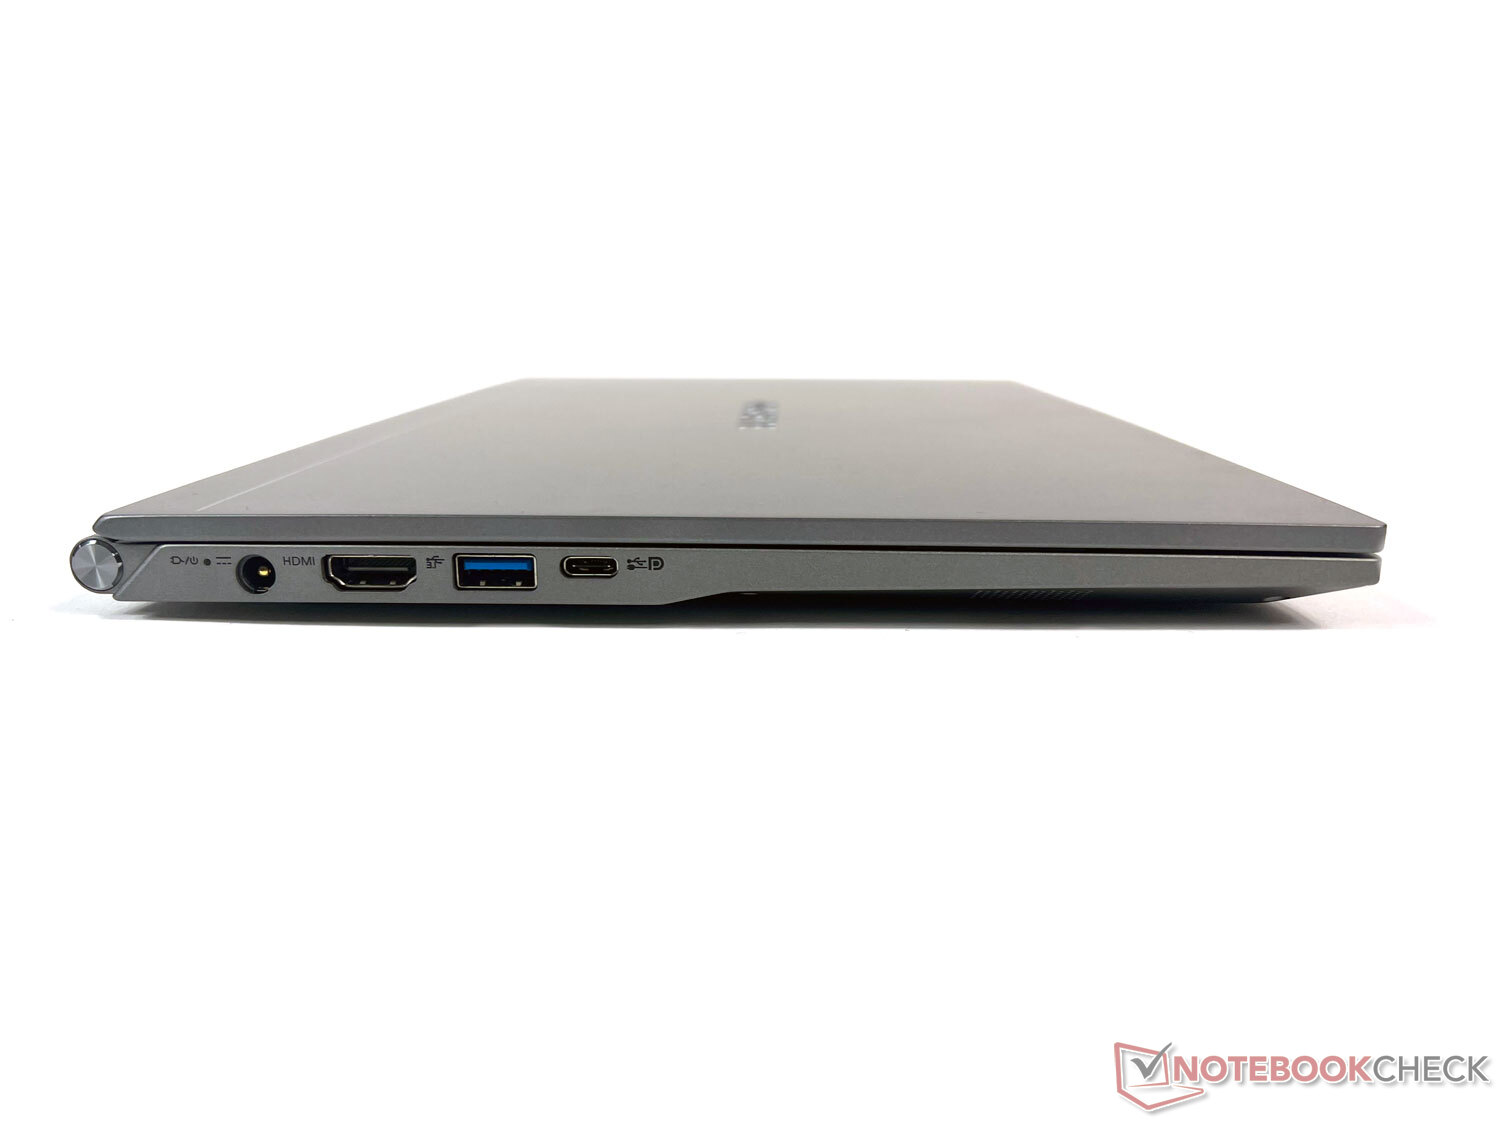
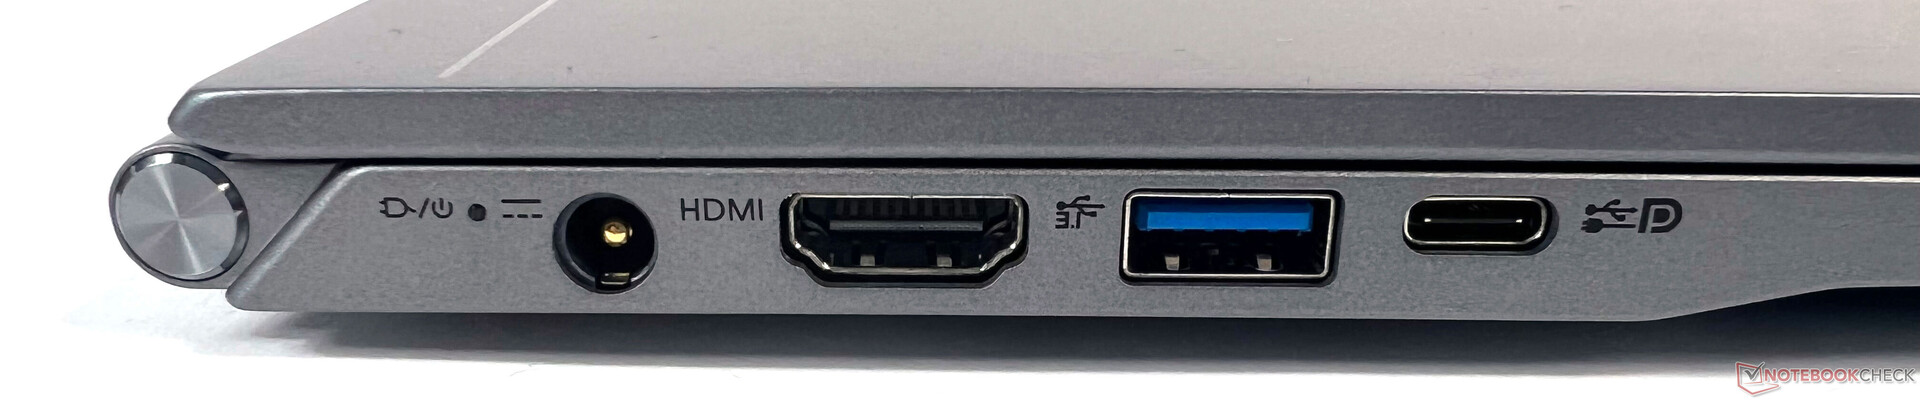
Without a doubt, the Gigabyte U4 UD is above all a compact office and multimedia laptop that also looks good on the desk or sofa apart from when you're traveling. The port configuration, which is distributed across the left and right sides of the device, is in line with this as well.
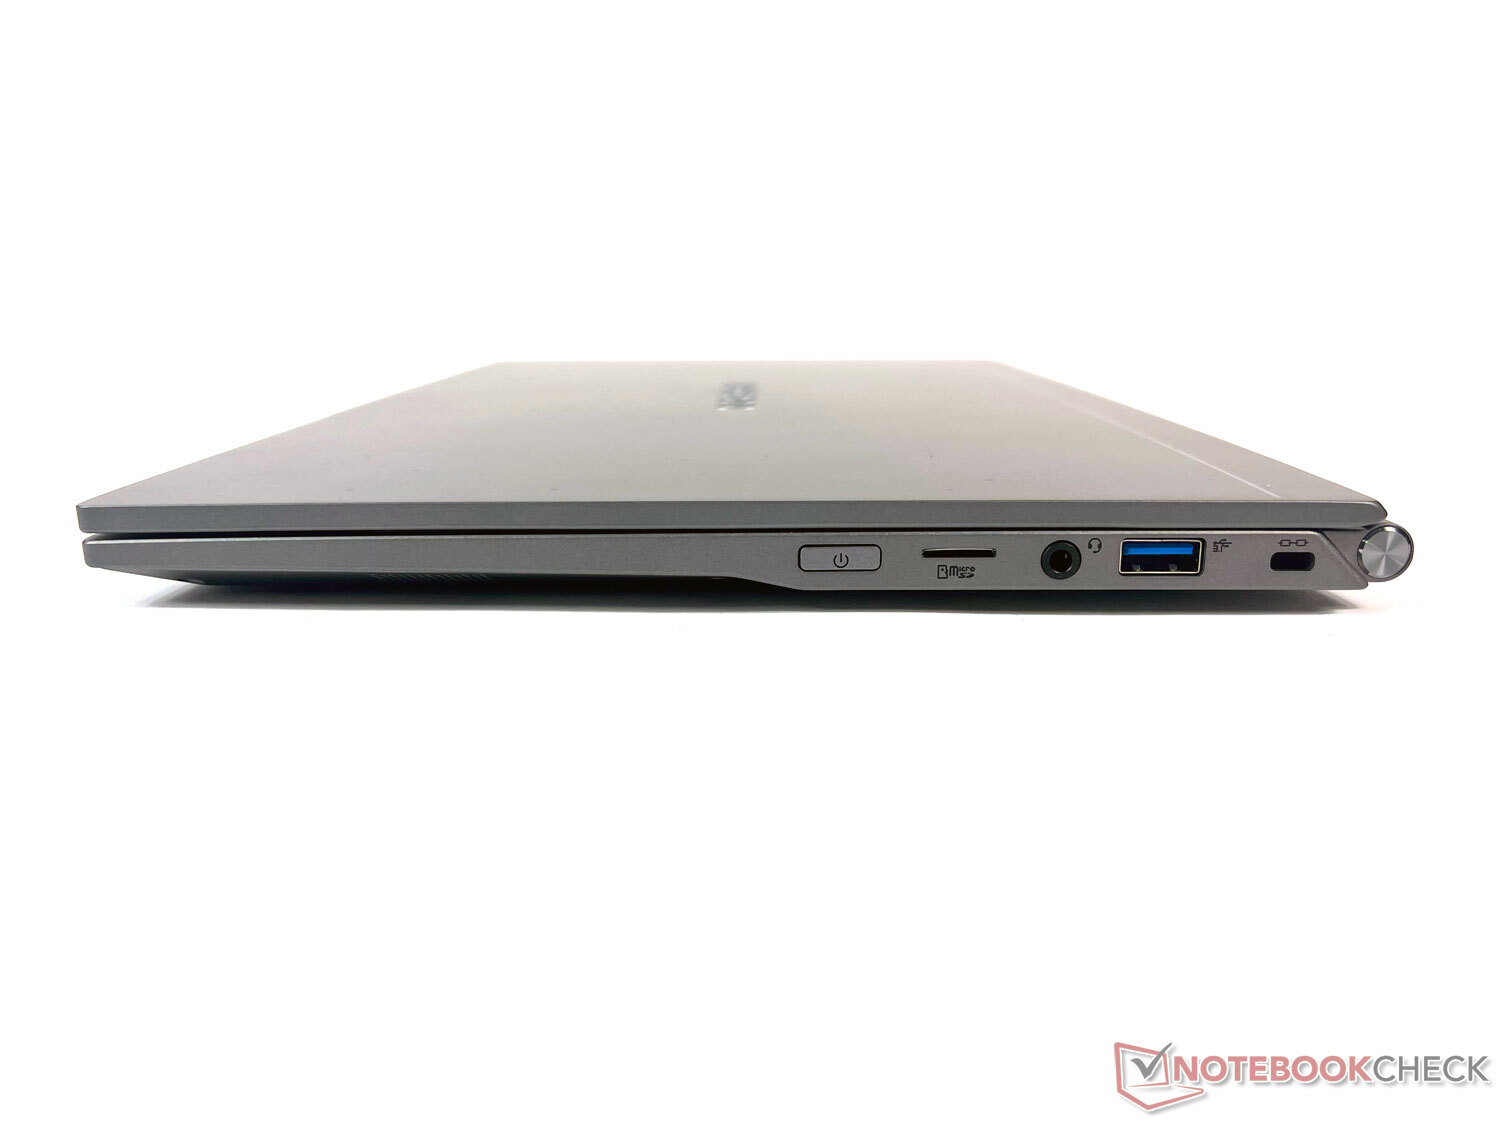
External monitors can be connected using either the Thunderbolt 4 or HDMI 2.0 ports. There's a USB-A port on each side (one USB 3.2 Gen 1 port and one Gen 2 port), but unfortunately, there's only a USB-C port on the left. In addition, the ports are positioned relatively close to each other, so that a slightly thicker USB Type-A stick connected on the left side could very well block the Thunderbolt/USB-C port.
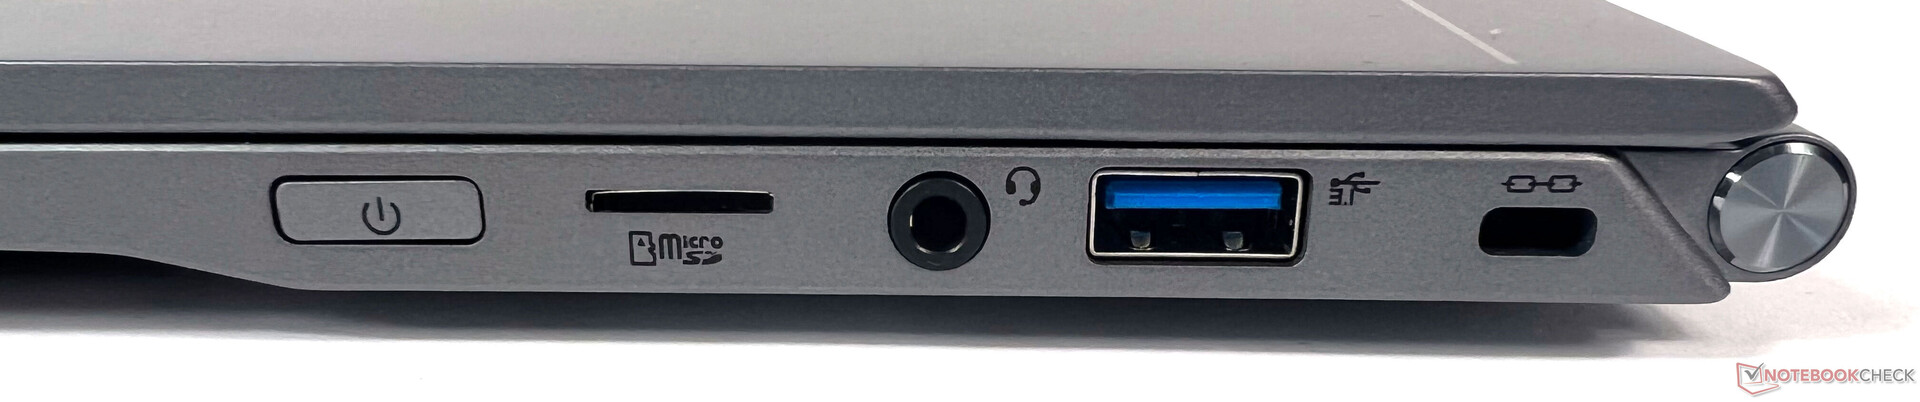
SD card reader
The card reader, which unfortunately only supports microSD and not SD cards, performs decently in our test of the Gigabyte U4 UD. When copying photos in JPG format with a 128 GB AV PRO microSD V60 test card, it shows the best performance. In the reading test with a 1 GB file, the card reader is still fast enough for second place, just behind the LG Gram, but also above the subnotebook average.
| SD Card Reader | |
| average JPG Copy Test (av. of 3 runs) | |
| Gigabyte U4 UD (AV PRO microSD 128 GB V60) | |
| LG Gram 14Z90P-G.AA79G (Toshiba Exceria Pro M501 microSDXC 64GB) | |
| HP Envy 13-ba1475ng (AV Pro V60) | |
| Average of class Subnotebook (23.7 - 188, n=9, last 2 years) | |
| Dell Inspiron 13 5301-0D0XN (Toshiba Exceria Pro M501 microSDXC 64GB) | |
| maximum AS SSD Seq Read Test (1GB) | |
| Average of class Subnotebook (24.9 - 195, n=8, last 2 years) | |
| LG Gram 14Z90P-G.AA79G (Toshiba Exceria Pro M501 microSDXC 64GB) | |
| Gigabyte U4 UD (AV PRO microSD 128 GB V60) | |
| HP Envy 13-ba1475ng (AV Pro V60) | |
| Dell Inspiron 13 5301-0D0XN (Toshiba Exceria Pro M501 microSDXC 64GB) | |
Communication
The device also performs similarly in our Wi-Fi test. It takes a clear lead when it comes to sending data. However, it only manages third place when receiving data, but the data rates are still above the average of the AX201 Wi-Fi module.
Webcam
In contrast, the HD camera, which unfortunately can't be blocked with a mechanical shutter, only shows mediocre results. The average DeltaE of 20 is almost twice as high as in the HP Envy 13, meaning that the webcam isn't very accurate when it comes to capturing colors. The image is relatively dull overall, but it's sufficient for common tasks like video calls - just like the dual-array microphone.


Security
Besides a Kensington lock port, the Gigabyte U4 UD features firmware-based TPM and supports the Intel Platform Trust Technology (Intel PTT). A fingerprint sensor is not available, unfortunately.
Accessories
Gigabyte only includes a 65-watt power adapter weighing a good 200 grams with the laptop. No other special accessories for the U4 are included - and there aren't any optional ones, either.
Maintenance
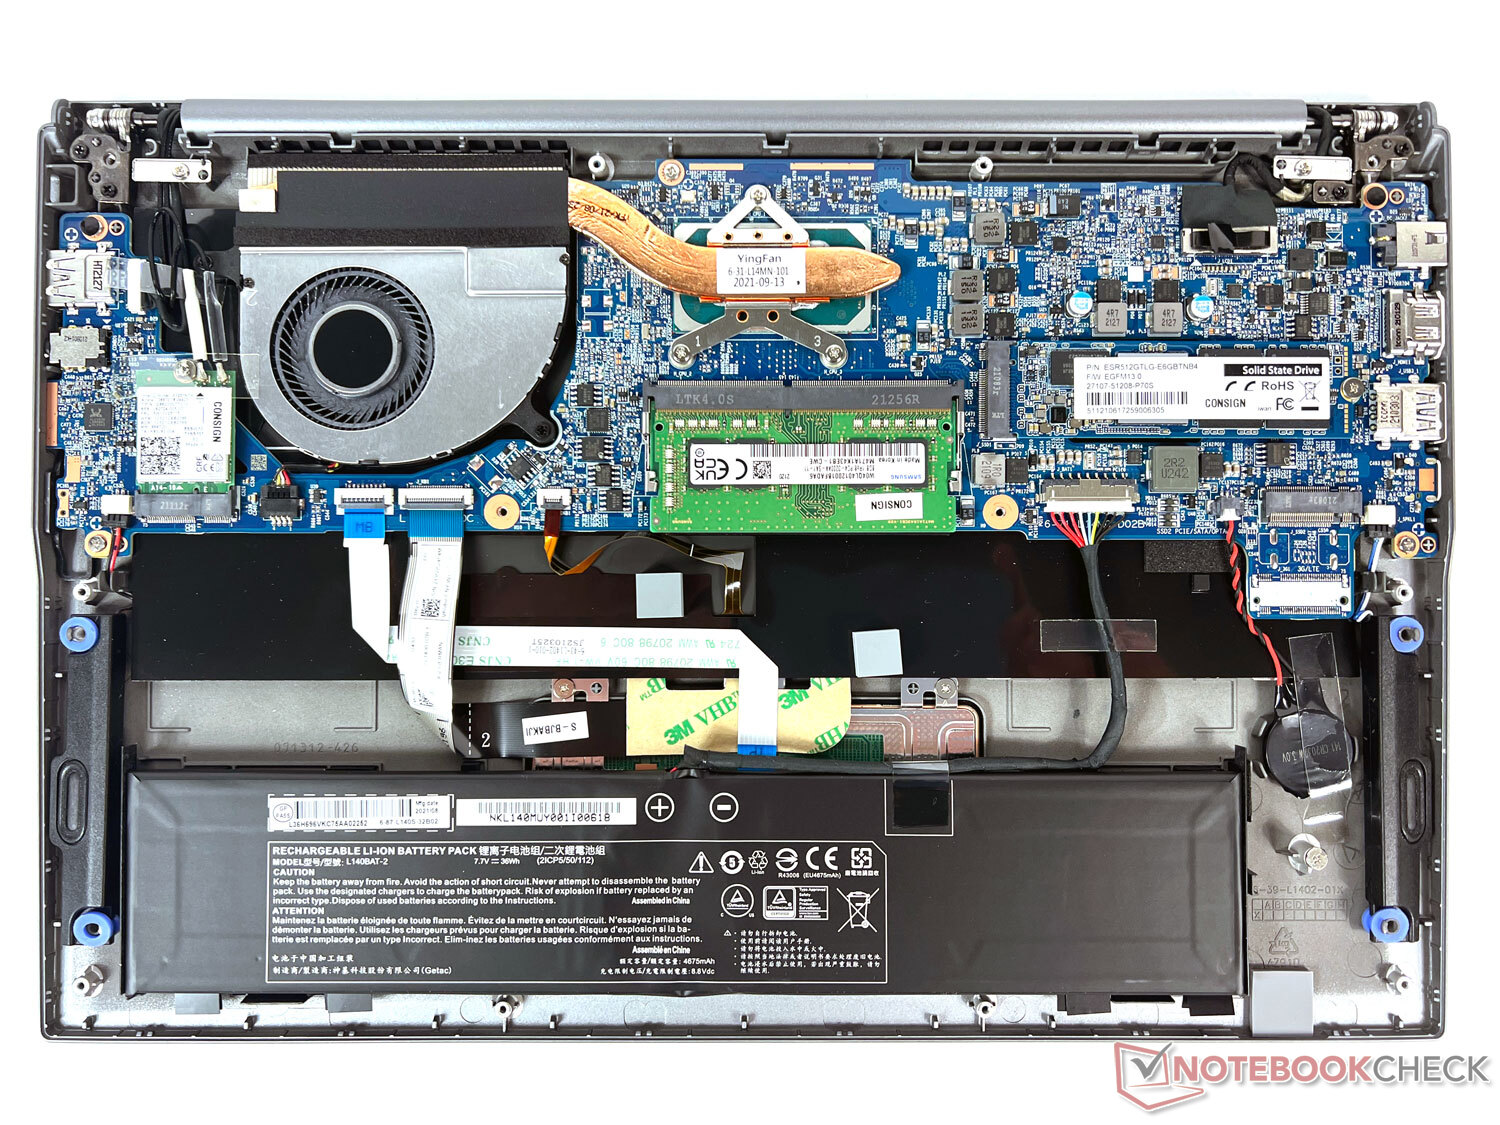
Twelve tiny screws block the way into the interior. Once these have been removed, 8 of the 16 GB of DDR4-3200 RAM can be replaced, but not expanded. The other 8 GB of RAM are soldered. In addition, there are two M.2 SSD slots (1x PCIe 4.0, 1x PCIe 3.0), so that another M.2 SSD can be installed.
Warranty
Gigabyte itself offers a 12-month warranty on the battery. All other cases are covered by the retailer warranty, which is 24 months in Germany.
Input devices: The keyboard offers many additional functions between "F1" and "F12"
Keyboard
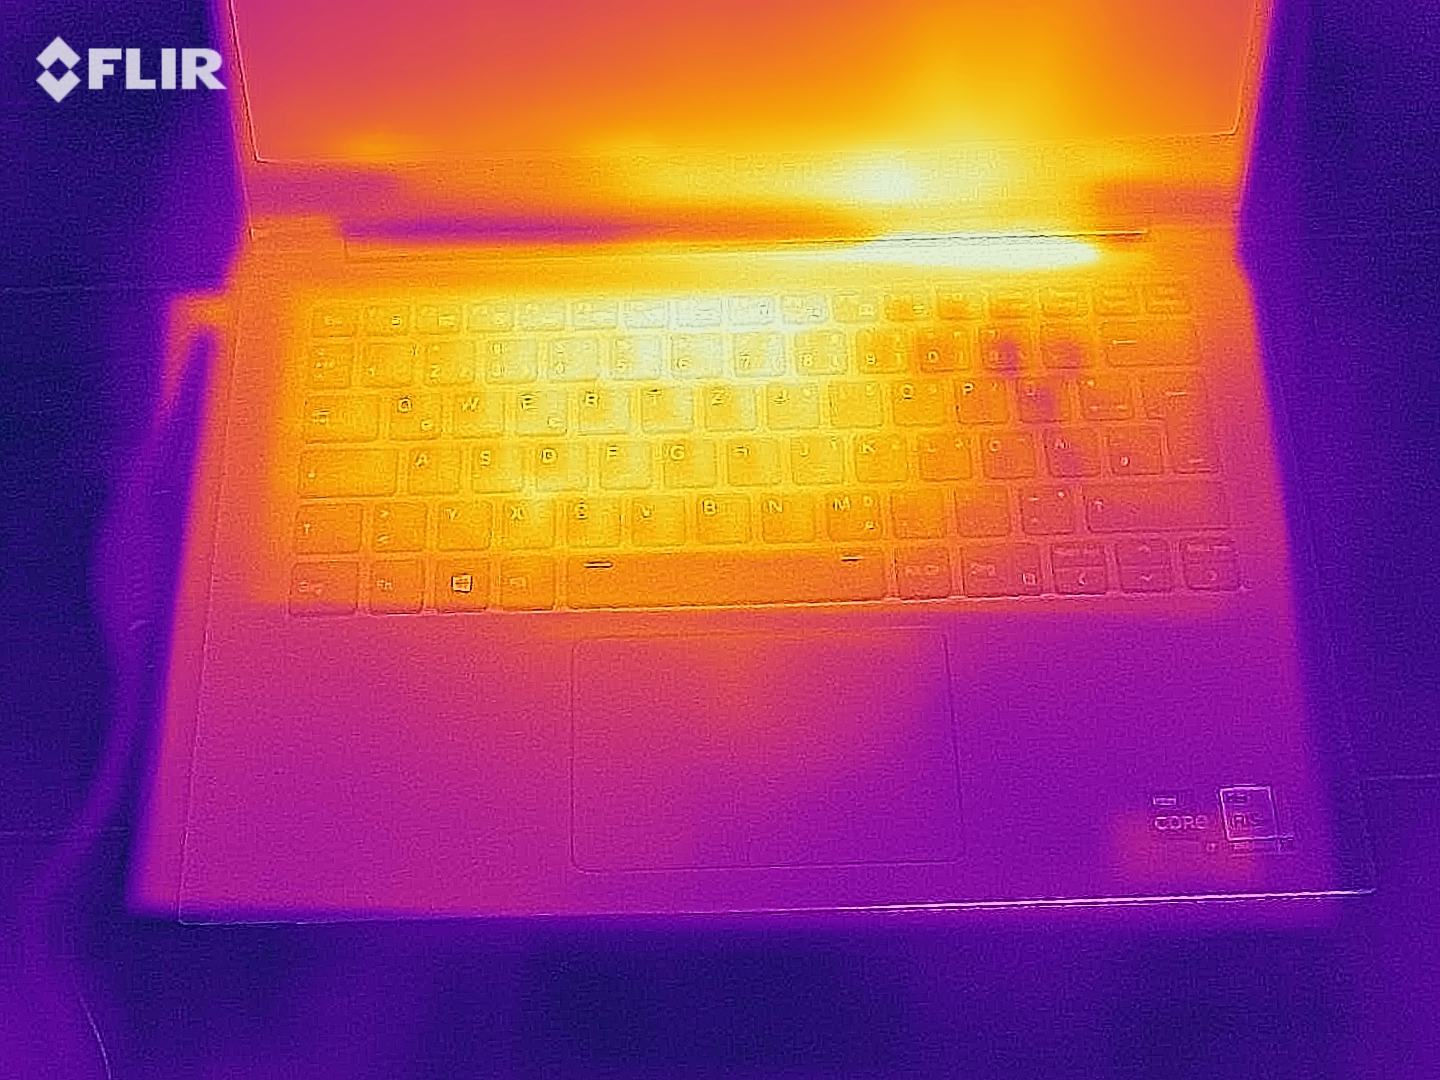
Since the left and right borders are only about 2 cm thin, Gigabyte manages to fit a solidly sized keyboard into the U4 despite the compact 14-inch case. The individual keys are around 1.5 x 1.5 cm, and they can be typed on easily with average-sized male hands.
As a result, a familiar and swift typing speed is established quite quickly, which is accompanied by a pleasingly quiet background noise. Only the space bar (as in many other laptops), which is a bit clattery, stands out in terms of noise, especially when typing quickly.
The individual keys are also easy to see in the dark thanks to the backlight that can be adjusted to 5 levels in the Control Center. The brightness can also be regulated using the "F4" key as an option. Many other functions, such as managing external monitor settings, turning the display and webcam on or off, and more, can be conveniently controlled by using the "F1" to "F12" keys.
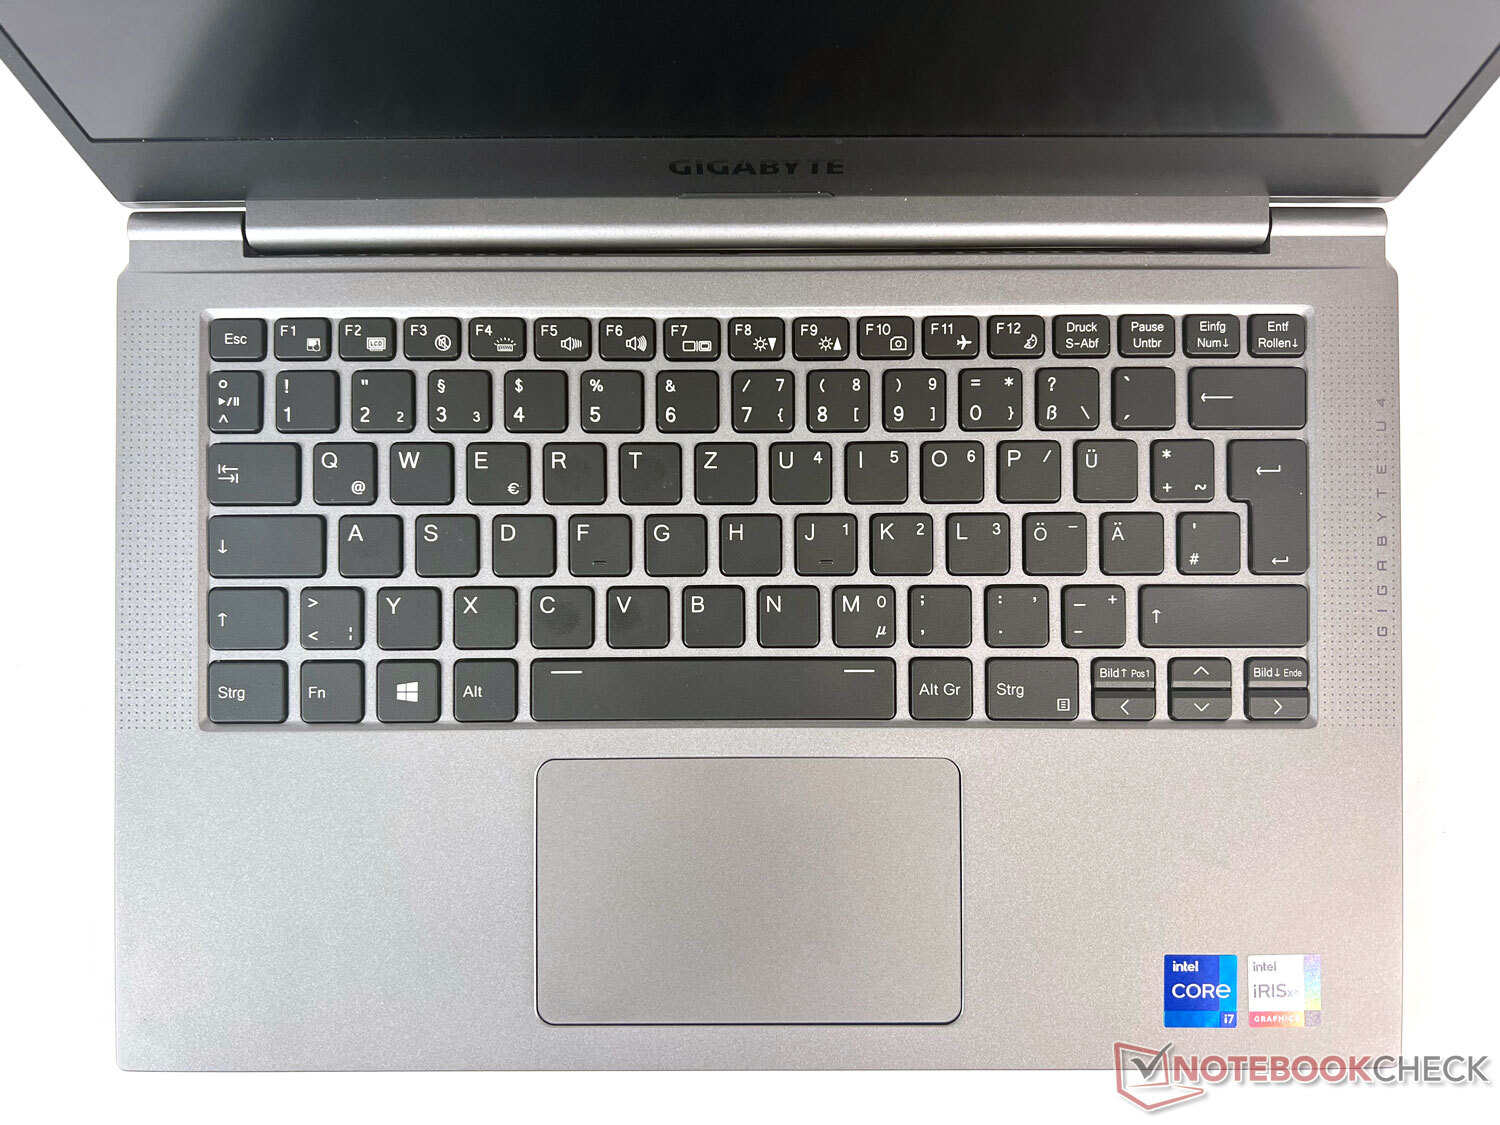
Touchpad
The 10.5 x 6.5 cm touchpad is centered below the keyboard. It has a comfortable, smooth feel, and the usual two click areas at the bottom border. These aren't separated in terms of haptics, nor are they particularly quiet when used. However, the mouse cursor can definitely be navigated across the screen smoothly and without issues.
The bright display is an enjoyable aspect in our laptop review
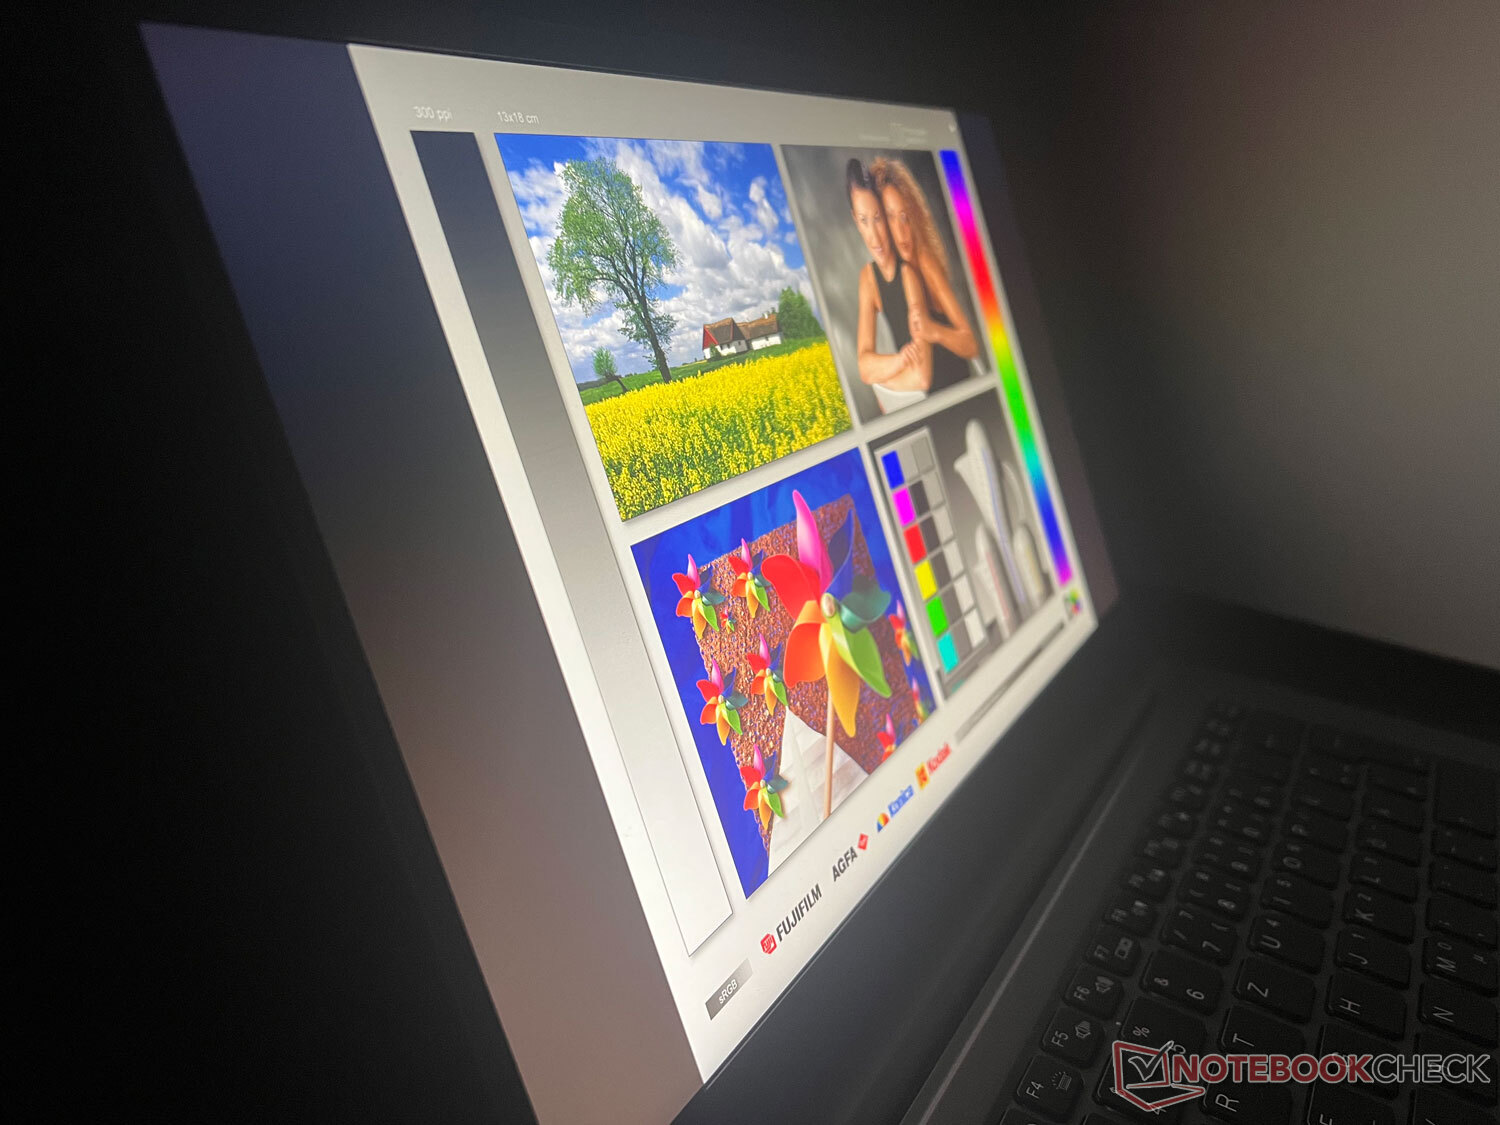
Gigabyte has installed a 14-inch matte IPS display from Chi Mei in the U4. It has a resolution of Full HD, which corresponds to 1920x1080 pixels. The refresh rate is the usual for non-gaming devices, namely 60 Hz.
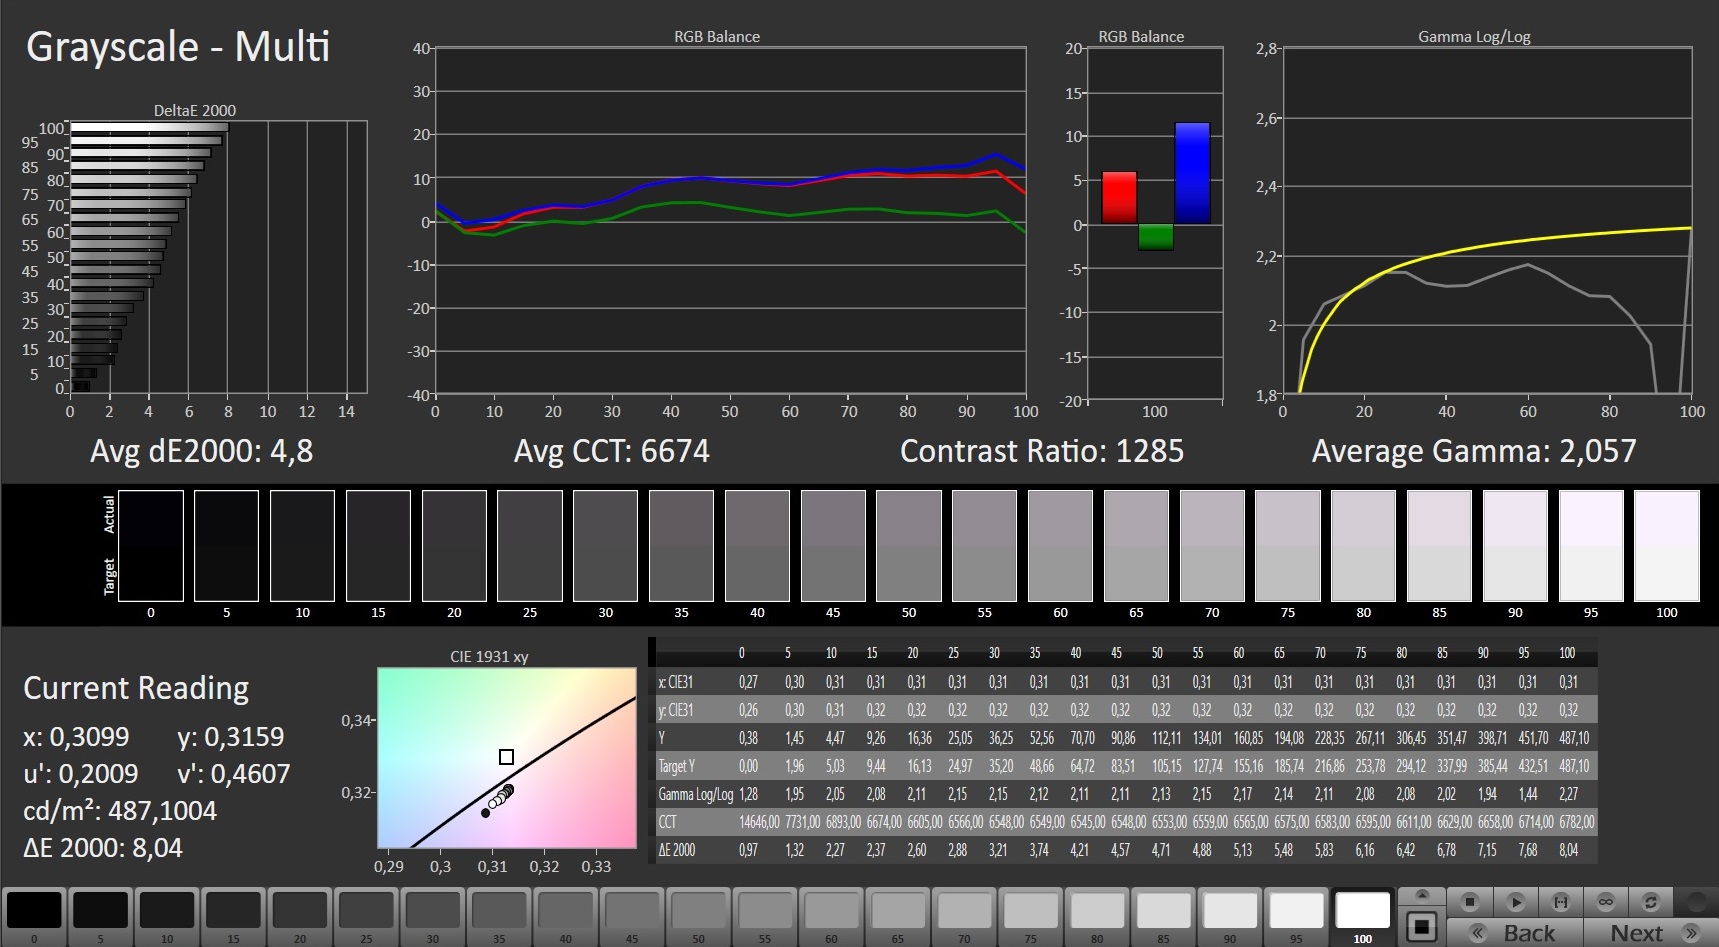
The display scores very well in many measurements. Among other factors, it offers the brightest image with an average of 426 cd/m². However, the brightness distribution could be a bit more uniform, according to the measurements.
The Gigabyte U4 shows weaknesses when it comes to its black level, and the contrast ratio also lags slightly behind that of competitors. In return, the panel provides the lowest average response times.
| |||||||||||||||||||||||||
Brightness Distribution: 87 %
Center on Battery: 463 cd/m²
Contrast: 1218:1 (Black: 0.38 cd/m²)
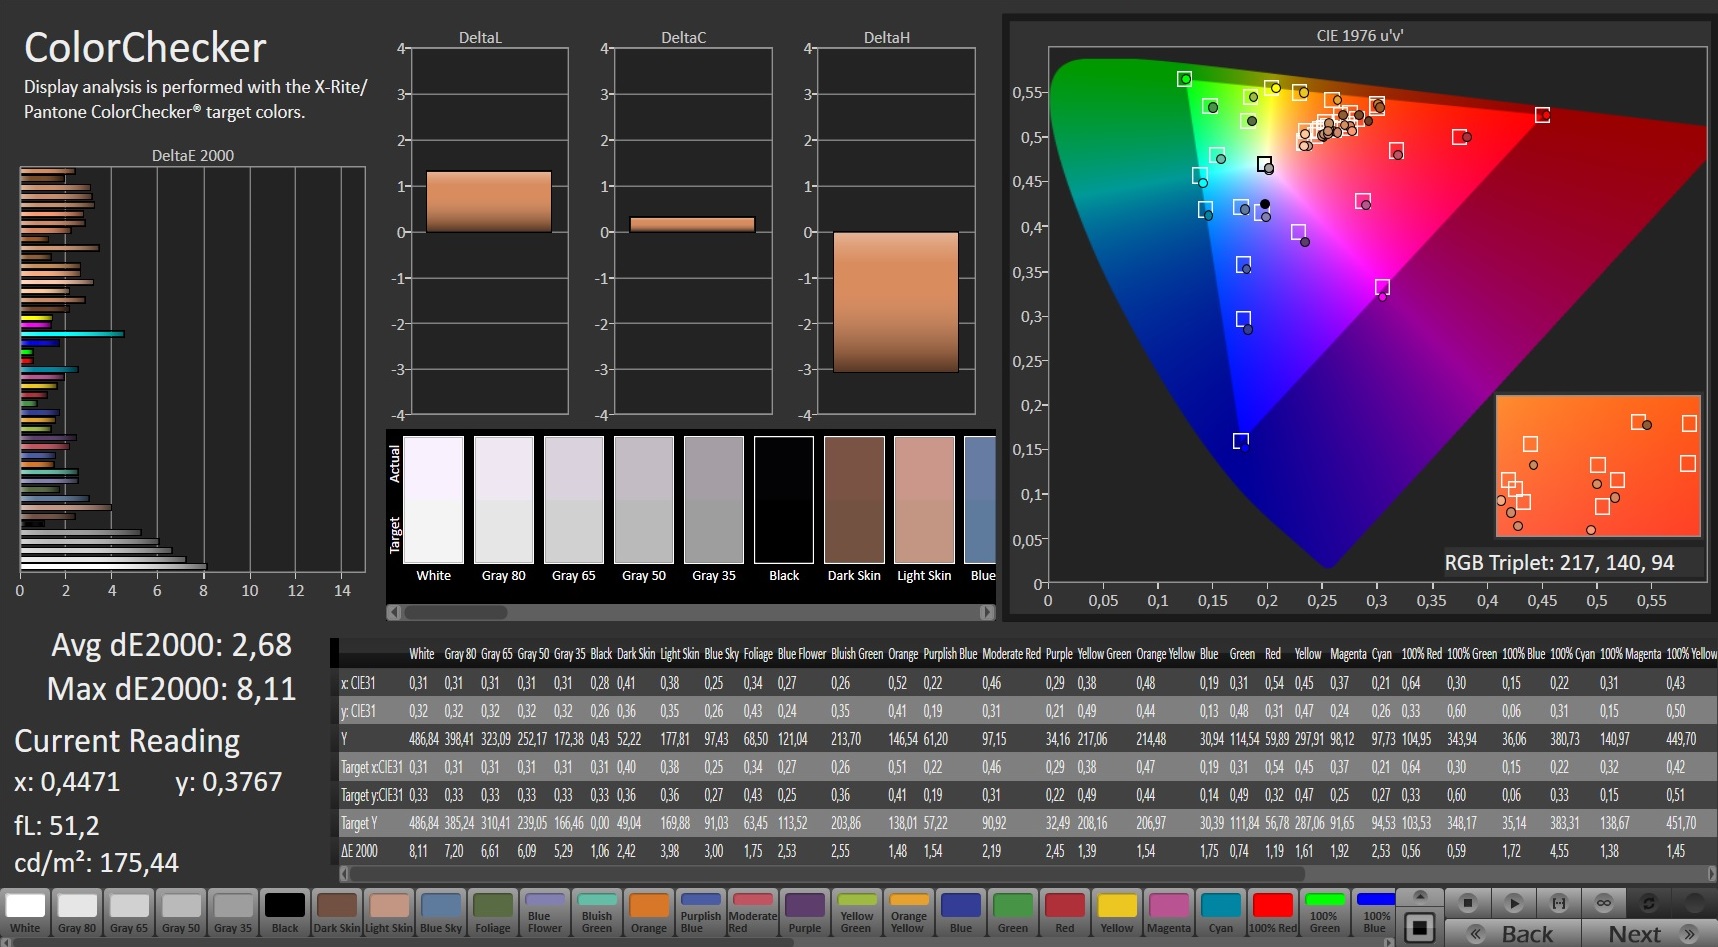
ΔE ColorChecker Calman: 2.68 | ∀{0.5-29.43 Ø4.71}
calibrated: 0.81
ΔE Greyscale Calman: 4.8 | ∀{0.09-98 Ø4.96}
66.9% AdobeRGB 1998 (Argyll 3D)
97.1% sRGB (Argyll 3D)
65.4% Display P3 (Argyll 3D)
Gamma: 2.057
CCT: 6674 K
| Gigabyte U4 UD Chi Mei N140HCE-EN2, IPS, 1920x1080, 14" | MSI Prestige 14 Evo A11MO-026US B140HAN06.2, IPS, 1920x1080, 14" | Dell Inspiron 13 5301-0D0XN InfoVision M133NWF4 R0, IPS, 1920x1080, 13.3" | LG Gram 14Z90P-G.AA79G LG Display LP140WU1-SPA1, IPS, 1920x1200, 14" | HP Envy 13-ba1475ng CMN139D, IPS, 1920x1080, 13.3" | |
|---|---|---|---|---|---|
| Display | 5% | -2% | 27% | 1% | |
| Display P3 Coverage (%) | 65.4 | 70.3 7% | 97.6 49% | 66.4 2% | |
| sRGB Coverage (%) | 97.1 | 99.2 2% | 98.1 1% | 99.9 3% | 97.6 1% |
| AdobeRGB 1998 Coverage (%) | 66.9 | 71.5 7% | 63.4 -5% | 85.3 28% | 67.5 1% |
| Response Times | -84% | -22% | -33% | -81% | |
| Response Time Grey 50% / Grey 80% * (ms) | 35.6 ? | 59.6 ? -67% | 37 ? -4% | 45 ? -26% | 66 ? -85% |
| Response Time Black / White * (ms) | 16.4 ? | 32.8 ? -100% | 23 ? -40% | 23 ? -40% | 28.8 ? -76% |
| PWM Frequency (Hz) | 1000 ? | 26040 ? | |||
| Screen | -0% | 2% | -23% | 7% | |
| Brightness middle (cd/m²) | 463 | 306 -34% | 302 -35% | 352 -24% | 423 -9% |
| Brightness (cd/m²) | 426 | 299 -30% | 289 -32% | 332 -22% | 405 -5% |
| Brightness Distribution (%) | 87 | 92 6% | 88 1% | 91 5% | 83 -5% |
| Black Level * (cd/m²) | 0.38 | 0.18 53% | 0.22 42% | 0.22 42% | 0.23 39% |
| Contrast (:1) | 1218 | 1700 40% | 1373 13% | 1600 31% | 1839 51% |
| Colorchecker dE 2000 * | 2.68 | 2.8 -4% | 3.35 -25% | 2.89 -8% | 3.2 -19% |
| Colorchecker dE 2000 max. * | 8.11 | 6.2 24% | 5.27 35% | 4.66 43% | 5.8 28% |
| Colorchecker dE 2000 calibrated * | 0.81 | 1.3 -60% | 2.7 -233% | 1 -23% | |
| Greyscale dE 2000 * | 4.8 | 4.6 4% | 4.07 15% | 6.9 -44% | 4.7 2% |
| Gamma | 2.057 107% | 2.26 97% | 2.17 101% | 2.34 94% | 1.99 111% |
| CCT | 6674 97% | 6420 101% | 7084 92% | 7904 82% | 6362 102% |
| Color Space (Percent of AdobeRGB 1998) (%) | 63 | 76 | 61.9 | ||
| Color Space (Percent of sRGB) (%) | 98 | 100 | 97.5 | ||
| Total Average (Program / Settings) | -26% /
-11% | -7% /
-3% | -10% /
-14% | -24% /
-7% |
* ... smaller is better
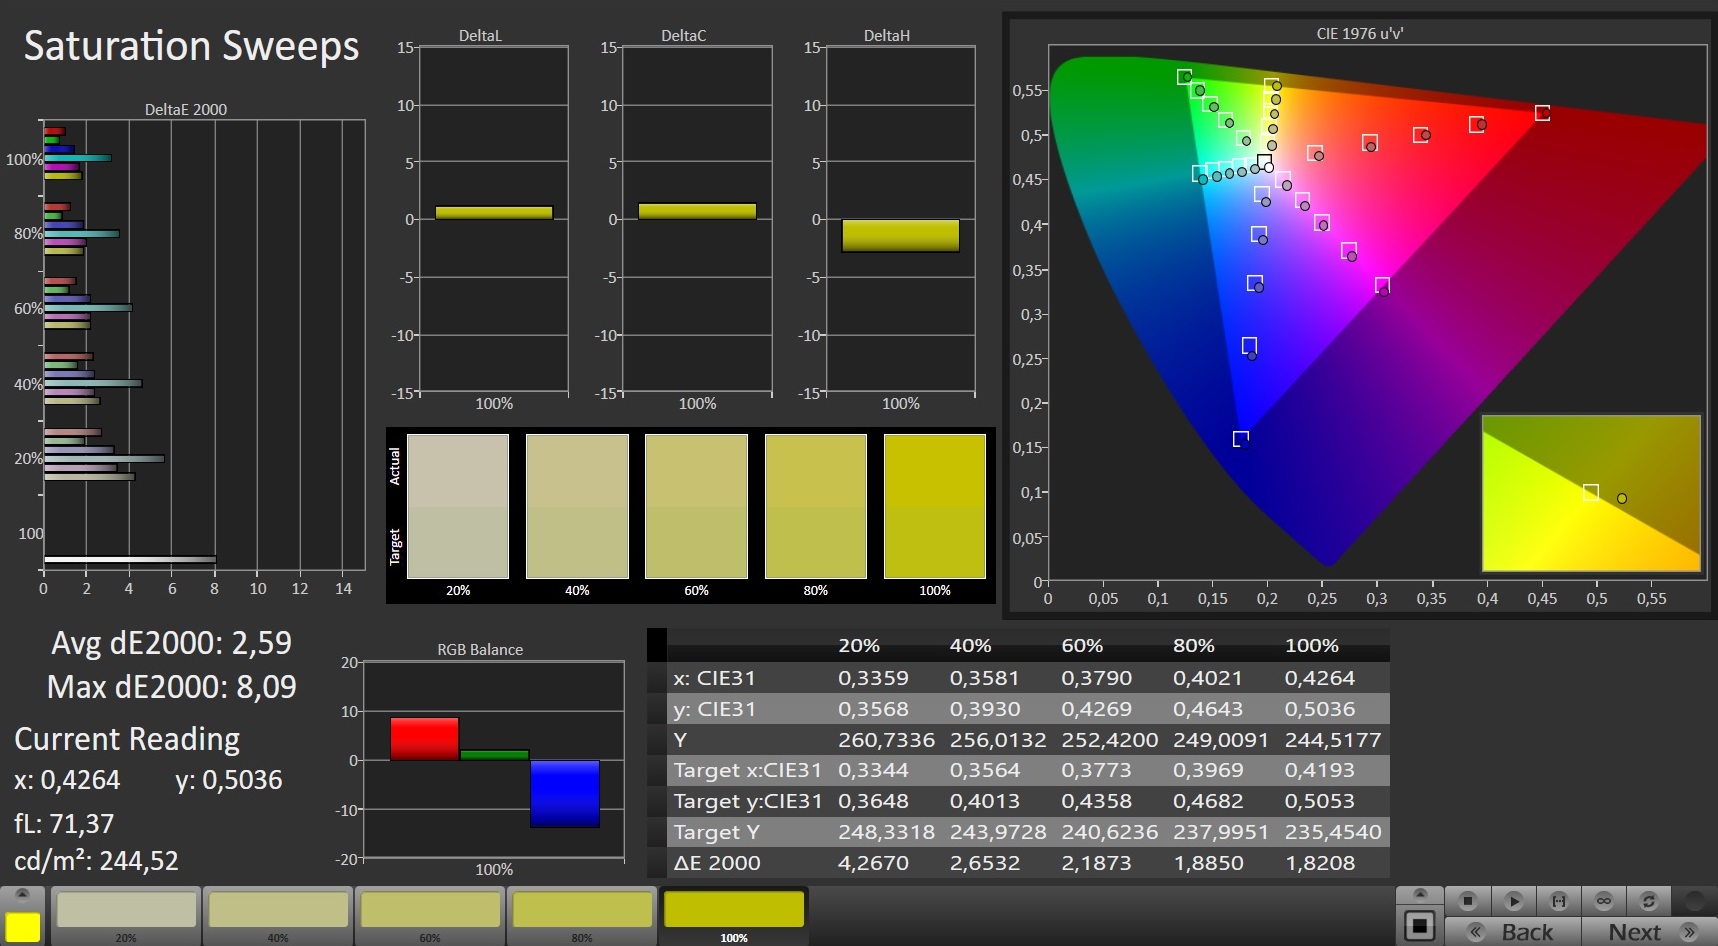
The display covers the sRGB color space by almost 100%, but only about 67% of the AdobeRGB and 65% of the P3 color spaces is covered. This makes the device less suitable for professional graphics editing. However, this is usually not among the common application purposes of subnotebooks like this one.
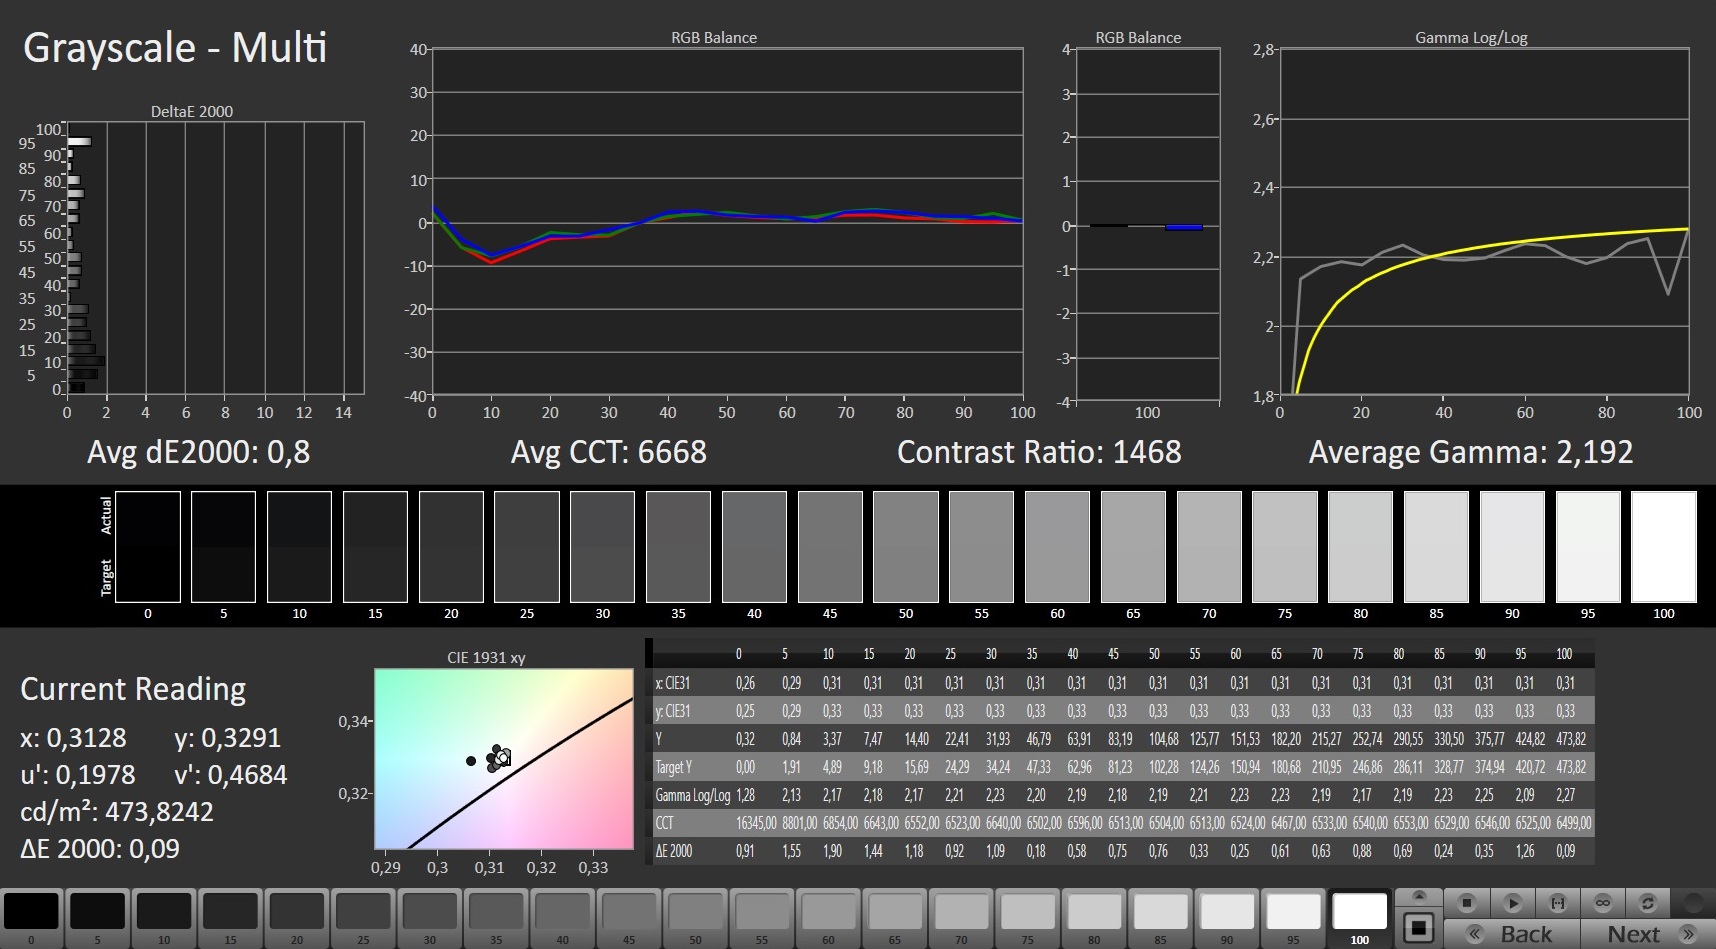
The average color deviation is good out of the box, but it can be reduced considerably by calibration (DeltaE values of 2.68 and 0.81, respectively).
The matte and very bright display as well as the high viewing-angle stability of IPS technology make the Gigabyte U4 UD ideally suited for outdoor use. The screen's legibility doesn't suffer even on sunny days.
Display Response Times
| ↔ Response Time Black to White | ||
|---|---|---|
| 16.4 ms ... rise ↗ and fall ↘ combined | ↗ 6.4 ms rise | 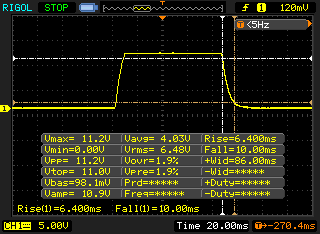 |
| ↘ 10 ms fall | ||
| The screen shows good response rates in our tests, but may be too slow for competitive gamers. In comparison, all tested devices range from 0.1 (minimum) to 240 (maximum) ms. » 38 % of all devices are better. This means that the measured response time is better than the average of all tested devices (19.8 ms). | ||
| ↔ Response Time 50% Grey to 80% Grey | ||
| 35.6 ms ... rise ↗ and fall ↘ combined | ↗ 17.6 ms rise | 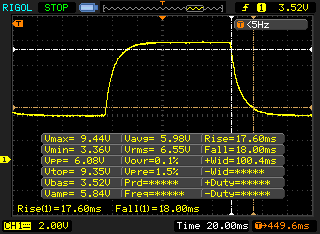 |
| ↘ 18 ms fall | ||
| The screen shows slow response rates in our tests and will be unsatisfactory for gamers. In comparison, all tested devices range from 0.165 (minimum) to 636 (maximum) ms. » 50 % of all devices are better. This means that the measured response time is worse than the average of all tested devices (30.9 ms). | ||
Screen Flickering / PWM (Pulse-Width Modulation)
| Screen flickering / PWM not detected | 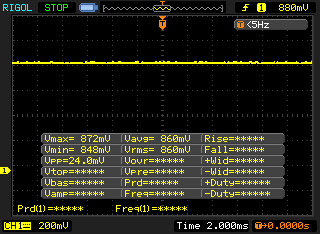 | ||
In comparison: 52 % of all tested devices do not use PWM to dim the display. If PWM was detected, an average of 7741 (minimum: 5 - maximum: 343500) Hz was measured. | |||
Performance: The Gigabyte U4 doesn't make full use of its powerful CPU
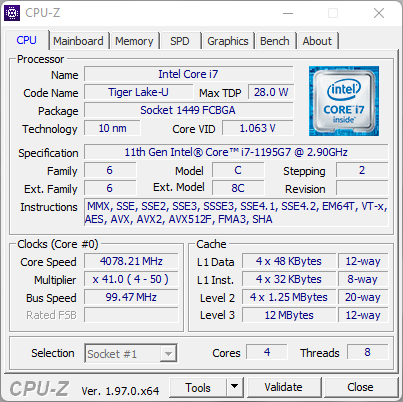
As stated earlier, our review unit is equipped with the Intel Core i7-1195G7, its Intel Iris Xe Graphics G7 96EUs integrated GPU, and 16 GB of DDR4-3200 RAM in dual-channel mode. Gigabyte doesn't currently offer alternative versions of the U4 besides the UD configuration.
In contrast to some other measurements, we conducted the benchmarks using the Performance Mode found in the Control Center 3.0 software. If the Multimedia Mode is selected here, the device suffers significant speed losses in many performance tests.
Processor
The Core i7-1195G7 was only introduced in the middle of this year. Although it's still based on the now outdated Tiger Lake architecture, this is a refresh. Thanks to the 10nm+ manufacturing process, it's particularly frugal, but it still achieves up to 5 GHz for an individual core in Boost mode.
The maximum base clock speed is 3.9 GHz (28-watt TDP). Our long-term measurements revealed that Gigabyte supplies the CPU with about 13 watts (PL1) to 46 watts (PL2). This is considerably less compared to the 36 to 64 watts with which MSI supplies the Prestige 14 Evo.
This is also reflected in the performance rates in the different benchmarks. The U4 can't keep up with its competitor equipped with the same CPU by far. In some measurements, it doesn't even reach the values of the less powerful Intel Core i7-1165G7 found in the HP Envy 13. In most cases, though, it can at least hold its ground against the competitors with the slower processors. The performance in the Cinebench R15 Multi endurance test remains constant, albeit not very high. When the power adapter is not plugged in, the CPU's performance drops by about 15% to 20%.
Cinebench R15 Multi endurance test
* ... smaller is better
AIDA64: FP32 Ray-Trace | FPU Julia | CPU SHA3 | CPU Queen | FPU SinJulia | FPU Mandel | CPU AES | CPU ZLib | FP64 Ray-Trace | CPU PhotoWorxx
| Performance rating | |
| Average of class Subnotebook | |
| Gigabyte U4 UD | |
| LG Gram 14Z90P-G.AA79G | |
| Average Intel Core i7-1195G7 | |
| Dell Inspiron 13 5301-0D0XN | |
| HP Envy 13-ba1475ng | |
| MSI Prestige 14 Evo A11MO-026US -9! | |
| AIDA64 / FP32 Ray-Trace | |
| Average of class Subnotebook (1135 - 32888, n=57, last 2 years) | |
| Gigabyte U4 UD | |
| Average Intel Core i7-1195G7 (4378 - 7361, n=9) | |
| HP Envy 13-ba1475ng | |
| Dell Inspiron 13 5301-0D0XN | |
| LG Gram 14Z90P-G.AA79G | |
| AIDA64 / FPU Julia | |
| Average of class Subnotebook (5218 - 123315, n=57, last 2 years) | |
| Average Intel Core i7-1195G7 (20576 - 30422, n=9) | |
| Gigabyte U4 UD | |
| HP Envy 13-ba1475ng | |
| Dell Inspiron 13 5301-0D0XN | |
| LG Gram 14Z90P-G.AA79G | |
| AIDA64 / CPU SHA3 | |
| Average of class Subnotebook (444 - 5287, n=57, last 2 years) | |
| Gigabyte U4 UD | |
| Average Intel Core i7-1195G7 (1310 - 2026, n=9) | |
| HP Envy 13-ba1475ng | |
| LG Gram 14Z90P-G.AA79G | |
| Dell Inspiron 13 5301-0D0XN | |
| AIDA64 / CPU Queen | |
| Average of class Subnotebook (10579 - 95002, n=47, last 2 years) | |
| Gigabyte U4 UD | |
| HP Envy 13-ba1475ng | |
| Average Intel Core i7-1195G7 (38530 - 56262, n=9) | |
| LG Gram 14Z90P-G.AA79G | |
| Dell Inspiron 13 5301-0D0XN | |
| AIDA64 / FPU SinJulia | |
| Average of class Subnotebook (744 - 18418, n=57, last 2 years) | |
| Average Intel Core i7-1195G7 (3209 - 4937, n=9) | |
| Gigabyte U4 UD | |
| Dell Inspiron 13 5301-0D0XN | |
| LG Gram 14Z90P-G.AA79G | |
| HP Envy 13-ba1475ng | |
| AIDA64 / FPU Mandel | |
| Average of class Subnotebook (3341 - 65433, n=57, last 2 years) | |
| Gigabyte U4 UD | |
| Average Intel Core i7-1195G7 (12142 - 18123, n=9) | |
| HP Envy 13-ba1475ng | |
| Dell Inspiron 13 5301-0D0XN | |
| LG Gram 14Z90P-G.AA79G | |
| AIDA64 / CPU AES | |
| Gigabyte U4 UD | |
| Average Intel Core i7-1195G7 (30854 - 70936, n=9) | |
| HP Envy 13-ba1475ng | |
| Dell Inspiron 13 5301-0D0XN | |
| LG Gram 14Z90P-G.AA79G | |
| Average of class Subnotebook (638 - 96917, n=57, last 2 years) | |
| AIDA64 / CPU ZLib | |
| Average of class Subnotebook (164.9 - 1379, n=57, last 2 years) | |
| Gigabyte U4 UD | |
| Average Intel Core i7-1195G7 (231 - 399, n=10) | |
| HP Envy 13-ba1475ng | |
| Dell Inspiron 13 5301-0D0XN | |
| LG Gram 14Z90P-G.AA79G | |
| MSI Prestige 14 Evo A11MO-026US | |
| AIDA64 / FP64 Ray-Trace | |
| Average of class Subnotebook (610 - 17495, n=57, last 2 years) | |
| Gigabyte U4 UD | |
| Average Intel Core i7-1195G7 (2300 - 3949, n=9) | |
| HP Envy 13-ba1475ng | |
| Dell Inspiron 13 5301-0D0XN | |
| LG Gram 14Z90P-G.AA79G | |
| AIDA64 / CPU PhotoWorxx | |
| Average of class Subnotebook (6569 - 85600, n=57, last 2 years) | |
| LG Gram 14Z90P-G.AA79G | |
| Dell Inspiron 13 5301-0D0XN | |
| HP Envy 13-ba1475ng | |
| Average Intel Core i7-1195G7 (13455 - 35235, n=9) | |
| Gigabyte U4 UD | |
System performance
Based on the CPU benchmarks, the device isn't able to fully utilize the processor's performance when it comes to system performance, either. However, since the CPU is inherently powerful compared to the subnotebook average and the comparison devices, it's still sufficient for a midfield ranking and a smooth system performance that is perfectly adequate for everyday use.
| PCMark 10 / Score | |
| Average of class Subnotebook (4920 - 9939, n=46, last 2 years) | |
| MSI Prestige 14 Evo A11MO-026US | |
| Average Intel Core i7-1195G7, Intel Iris Xe Graphics G7 96EUs (5067 - 5406, n=6) | |
| HP Envy 13-ba1475ng | |
| Gigabyte U4 UD | |
| LG Gram 14Z90P-G.AA79G | |
| Dell Inspiron 13 5301-0D0XN | |
| PCMark 10 / Essentials | |
| MSI Prestige 14 Evo A11MO-026US | |
| Average Intel Core i7-1195G7, Intel Iris Xe Graphics G7 96EUs (10156 - 10614, n=6) | |
| Average of class Subnotebook (8552 - 11646, n=46, last 2 years) | |
| LG Gram 14Z90P-G.AA79G | |
| Gigabyte U4 UD | |
| Dell Inspiron 13 5301-0D0XN | |
| HP Envy 13-ba1475ng | |
| PCMark 10 / Productivity | |
| Average of class Subnotebook (5435 - 16606, n=46, last 2 years) | |
| HP Envy 13-ba1475ng | |
| Average Intel Core i7-1195G7, Intel Iris Xe Graphics G7 96EUs (6637 - 7390, n=6) | |
| LG Gram 14Z90P-G.AA79G | |
| MSI Prestige 14 Evo A11MO-026US | |
| Gigabyte U4 UD | |
| Dell Inspiron 13 5301-0D0XN | |
| PCMark 10 / Digital Content Creation | |
| Average of class Subnotebook (5722 - 13779, n=46, last 2 years) | |
| MSI Prestige 14 Evo A11MO-026US | |
| Gigabyte U4 UD | |
| Average Intel Core i7-1195G7, Intel Iris Xe Graphics G7 96EUs (4737 - 5941, n=6) | |
| HP Envy 13-ba1475ng | |
| LG Gram 14Z90P-G.AA79G | |
| Dell Inspiron 13 5301-0D0XN | |
| PCMark 8 Home Score Accelerated v2 | 5215 points | |
| PCMark 8 Creative Score Accelerated v2 | 7150 points | |
| PCMark 8 Work Score Accelerated v2 | 3269 points | |
| PCMark 10 Score | 5086 points | |
Help | ||
| AIDA64 / Memory Copy | |
| Average of class Subnotebook (14554 - 131023, n=57, last 2 years) | |
| LG Gram 14Z90P-G.AA79G | |
| Dell Inspiron 13 5301-0D0XN | |
| MSI Prestige 14 Evo A11MO-026US | |
| Average Intel Core i7-1195G7 (23332 - 57053, n=10) | |
| Gigabyte U4 UD | |
| HP Envy 13-ba1475ng | |
| AIDA64 / Memory Read | |
| Average of class Subnotebook (15948 - 127174, n=57, last 2 years) | |
| LG Gram 14Z90P-G.AA79G | |
| Dell Inspiron 13 5301-0D0XN | |
| MSI Prestige 14 Evo A11MO-026US | |
| HP Envy 13-ba1475ng | |
| Gigabyte U4 UD | |
| Average Intel Core i7-1195G7 (24068 - 53332, n=10) | |
| AIDA64 / Memory Write | |
| Average of class Subnotebook (15709 - 135141, n=57, last 2 years) | |
| LG Gram 14Z90P-G.AA79G | |
| Dell Inspiron 13 5301-0D0XN | |
| MSI Prestige 14 Evo A11MO-026US | |
| Gigabyte U4 UD | |
| Average Intel Core i7-1195G7 (22151 - 59019, n=10) | |
| HP Envy 13-ba1475ng | |
| AIDA64 / Memory Latency | |
| MSI Prestige 14 Evo A11MO-026US | |
| Average of class Subnotebook (6.1 - 159.9, n=55, last 2 years) | |
| Average Intel Core i7-1195G7 (69.8 - 114.4, n=10) | |
| LG Gram 14Z90P-G.AA79G | |
| Dell Inspiron 13 5301-0D0XN | |
| HP Envy 13-ba1475ng | |
| Gigabyte U4 UD | |
* ... smaller is better
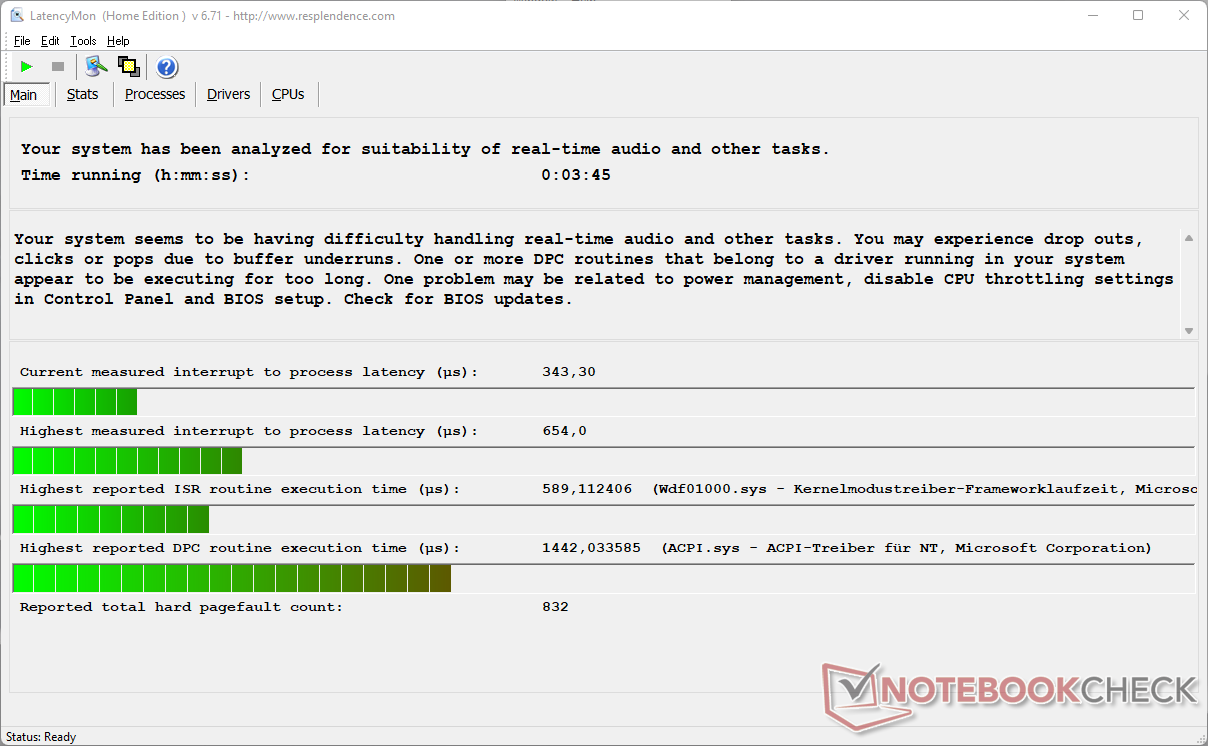
DPC latencies
Irregularities were found in our standardized test procedure for DPC latencies. Although the result is decent, the LatencyMon tool states that real-time audio and similar applications could still experience problems.
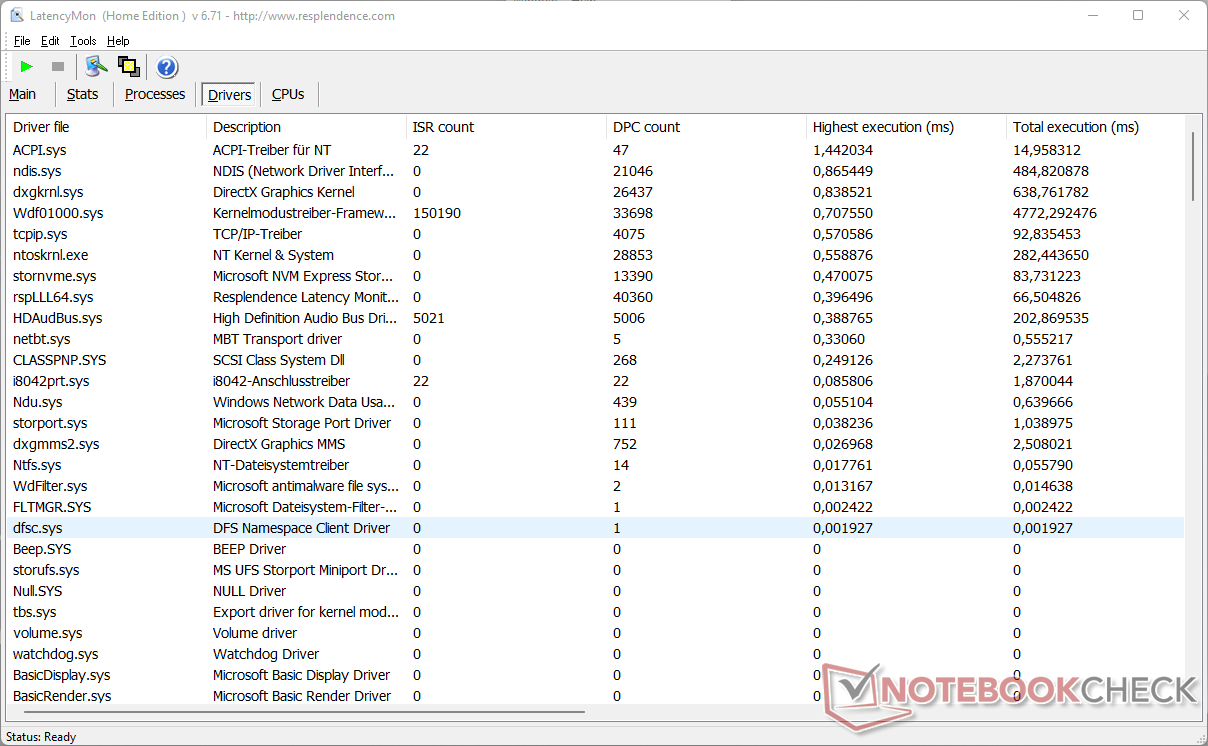
| DPC Latencies / LatencyMon - interrupt to process latency (max), Web, Youtube, Prime95 | |
| MSI Prestige 14 Evo A11MO-026US | |
| LG Gram 14Z90P-G.AA79G | |
| HP Envy 13-ba1475ng | |
| Gigabyte U4 UD | |
| Dell Inspiron 13 5301-0D0XN | |
* ... smaller is better
Storage
While the CPU remains below expectations at times, the built-in SSD with 512 GB of storage space performs well. Thanks to the fast PCIe 4.0 connection, it often ranks among the first three places in our comparison field.
| Drive Performance rating - Percent | |
| MSI Prestige 14 Evo A11MO-026US | |
| Gigabyte U4 UD | |
| Average of class Subnotebook | |
| LG Gram 14Z90P-G.AA79G | |
| Global Average -3 | |
| Dell Inspiron 13 5301-0D0XN | |
| HP Envy 13-ba1475ng | |
* ... smaller is better

Continuous load read: DiskSpd Read Loop, Queue Depth 8
GPU performance
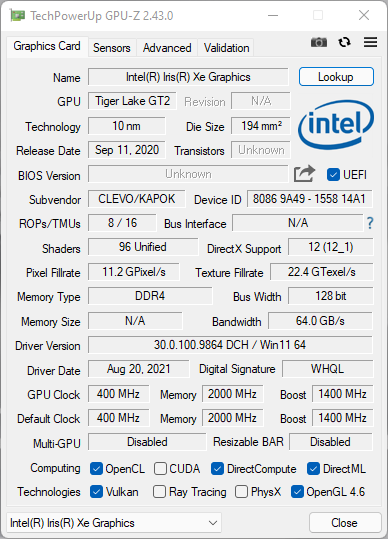
Instead of a dedicated graphics solution, Gigabyte opts for Intel's Iris Xe Graphics G7. The most powerful version of the integrated graphics is installed here with 96 EUs. It guarantees a minimum clock rate of 400 MHz with a peak of up to 1,400 MHz.
Gigabyte also keeps the GPU on a short leash here, resulting in an average graphics performance that is below the average performance of this graphics solution in the various benchmarks. In addition, the U4 is beaten by most other comparison models, some of which are only equipped with the Intel Iris Xe Graphics G7 with 80 EUs. Nevertheless, performance is still sufficient for everyday tasks like streaming high-resolution videos. Performance drops by about 15% on battery power.
| 3DMark 11 Performance | 5977 points | |
| 3DMark Cloud Gate Standard Score | 16356 points | |
| 3DMark Fire Strike Score | 3618 points | |
| 3DMark Time Spy Score | 1522 points | |
Help | ||
Gaming performance
Since the Gigabyte U4 doesn't take advantage of the maximum GPU performance potential, gaming performance also remains below what could be possible, i.e. the GPU average. The device has a duel with the Dell Inspiron 13 for the last places in terms of frame rates in The Witcher 3.
This sounds worse than it is in the end, though. Nearly all tested games ran smoothly at least at the lowest graphics level, many even at medium levels. The Gigabyte U4 is sufficient for the occasional gaming session, which should be enough for a subnotebook. Nevertheless, better performance would have been possible.
The frame rates in The Witcher 3 using the Ultra graphics level aren't only unplayably low, but they also fluctuate significantly. Although the gap to the identically equipped MSI Prestige 14 Evo in terms of CPU and GPU is "only" about 5 fps, this is a considerable increase of 50%.
The Witcher 3 FPS diagram
| low | med. | high | ultra | |
|---|---|---|---|---|
| GTA V (2015) | 82.6 | 65.8 | 17.7 | 6.75 |
| The Witcher 3 (2015) | 70.1 | 44.4 | 21.5 | 10.2 |
| Dota 2 Reborn (2015) | 110 | 71.4 | 43.4 | 41.8 |
| Rise of the Tomb Raider (2016) | 46 | 35.1 | 19.9 | 17.3 |
| X-Plane 11.11 (2018) | 26.8 | 32.9 | 29.6 | |
| Far Cry 5 (2018) | 36 | 18 | 17 | 16 |
| Strange Brigade (2018) | 69.4 | 28 | 23.8 | 19.2 |
| Monster Hunter Stories 2 (2021) | 62.9 | 35.4 | 28.8 |
Emissions: Unexpected fan noise, but pleasingly low temperatures
Fan noise
The Gigabyte U4 UD is actually silent in idle use. However, it gets a bit louder than the rest of the comparison devices under load since it reaches up to 45 decibels.
What we found to be even more significant in the test is that the fan often revs up even when the device isn't actually being used but is simply sitting idle on the desk. That's somewhat annoying. It can be reduced by selecting the Silent Mode in the Control Center 3.0, but this results in performance losses. On the other hand, it's a good thing that we didn't experience any other noise, such as coil whine.
| Gigabyte U4 UD Iris Xe G7 96EUs, i7-1195G7 | MSI Prestige 14 Evo A11MO-026US Iris Xe G7 96EUs, i7-1195G7, Samsung PM9A1 MZVL2512HCJQ | Dell Inspiron 13 5301-0D0XN Iris Xe G7 80EUs, i5-1135G7 | LG Gram 14Z90P-G.AA79G Iris Xe G7 96EUs, i7-1165G7, SK Hynix PC601 1TB HFS001TD9TNG | HP Envy 13-ba1475ng GeForce MX450, i7-1165G7, Intel SSD 660p SSDPEKNW512G8 | |
|---|---|---|---|---|---|
| Noise | 4% | -5% | 11% | 2% | |
| off / environment * (dB) | 24 | 24.3 -1% | 26 -8% | 26 -8% | 24.6 -3% |
| Idle Minimum * (dB) | 24 | 24.3 -1% | 26 -8% | 26 -8% | 24.6 -3% |
| Idle Average * (dB) | 32 | 26.9 16% | 27.5 14% | 26 19% | 24.6 23% |
| Idle Maximum * (dB) | 33 | 28.8 13% | 36.4 -10% | 26 21% | 30.2 8% |
| Load Average * (dB) | 34 | 36.8 -8% | 41.6 -22% | 30.5 10% | 39.9 -17% |
| Witcher 3 ultra * (dB) | 42 | ||||
| Load Maximum * (dB) | 45 | 43.7 3% | 41.8 7% | 30.5 32% | 43.4 4% |
* ... smaller is better
Noise level
| Idle |
| 24 / 32 / 33 dB(A) |
| Load |
| 34 / 45 dB(A) |
 | ||
30 dB silent 40 dB(A) audible 50 dB(A) loud |
||
min: | ||
Temperature
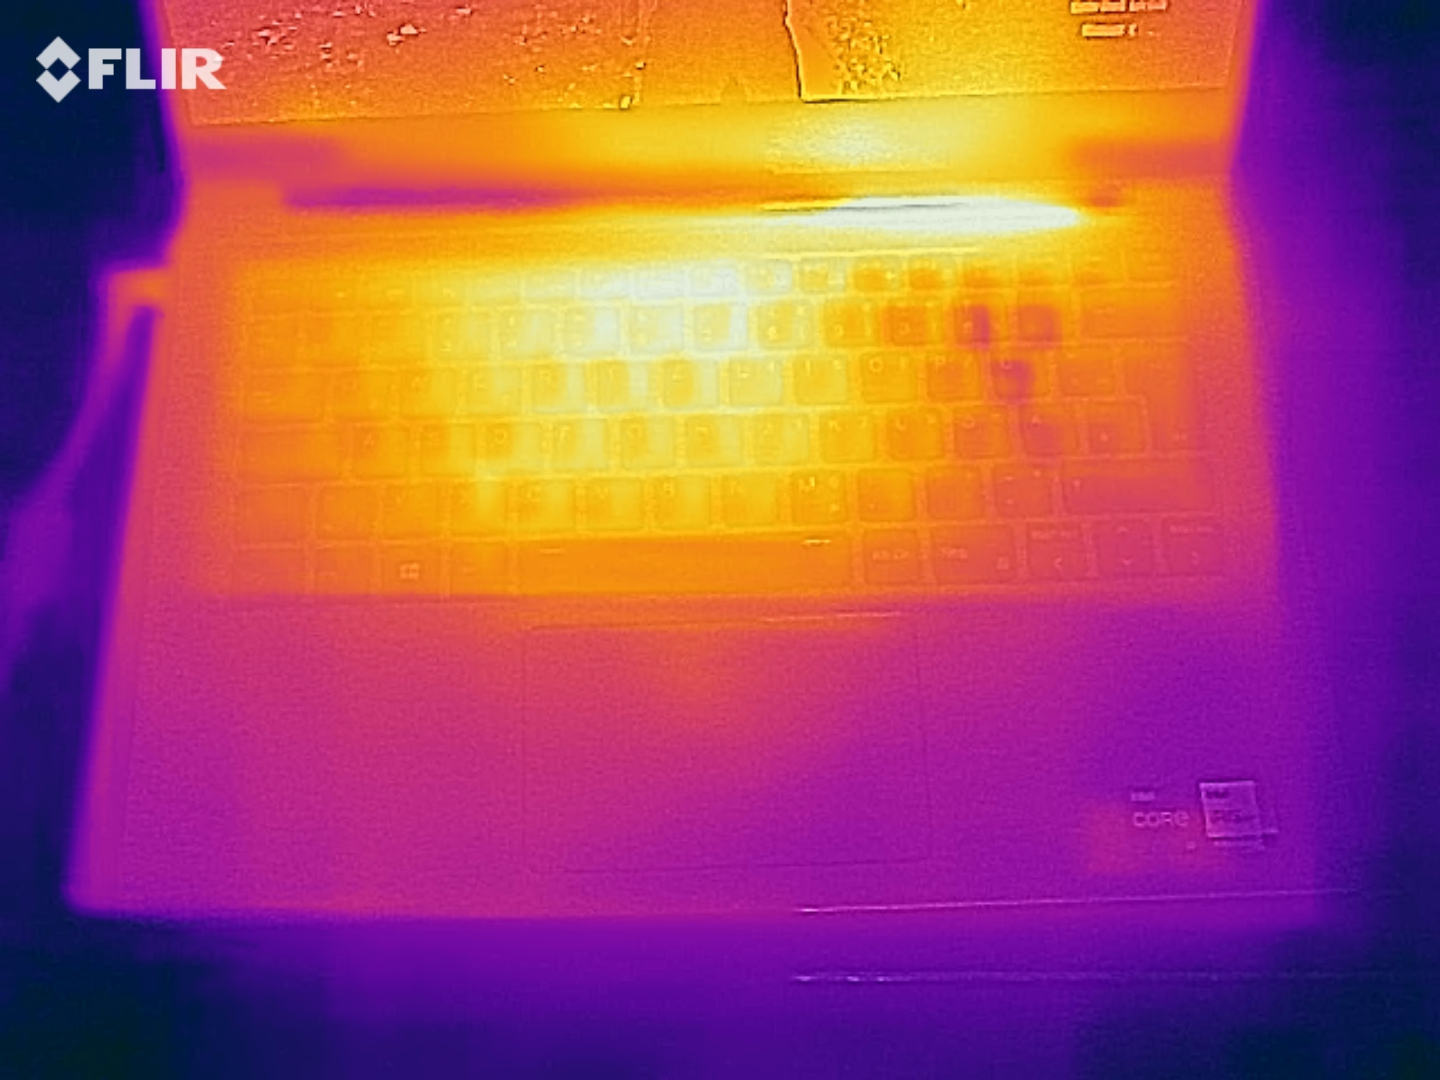
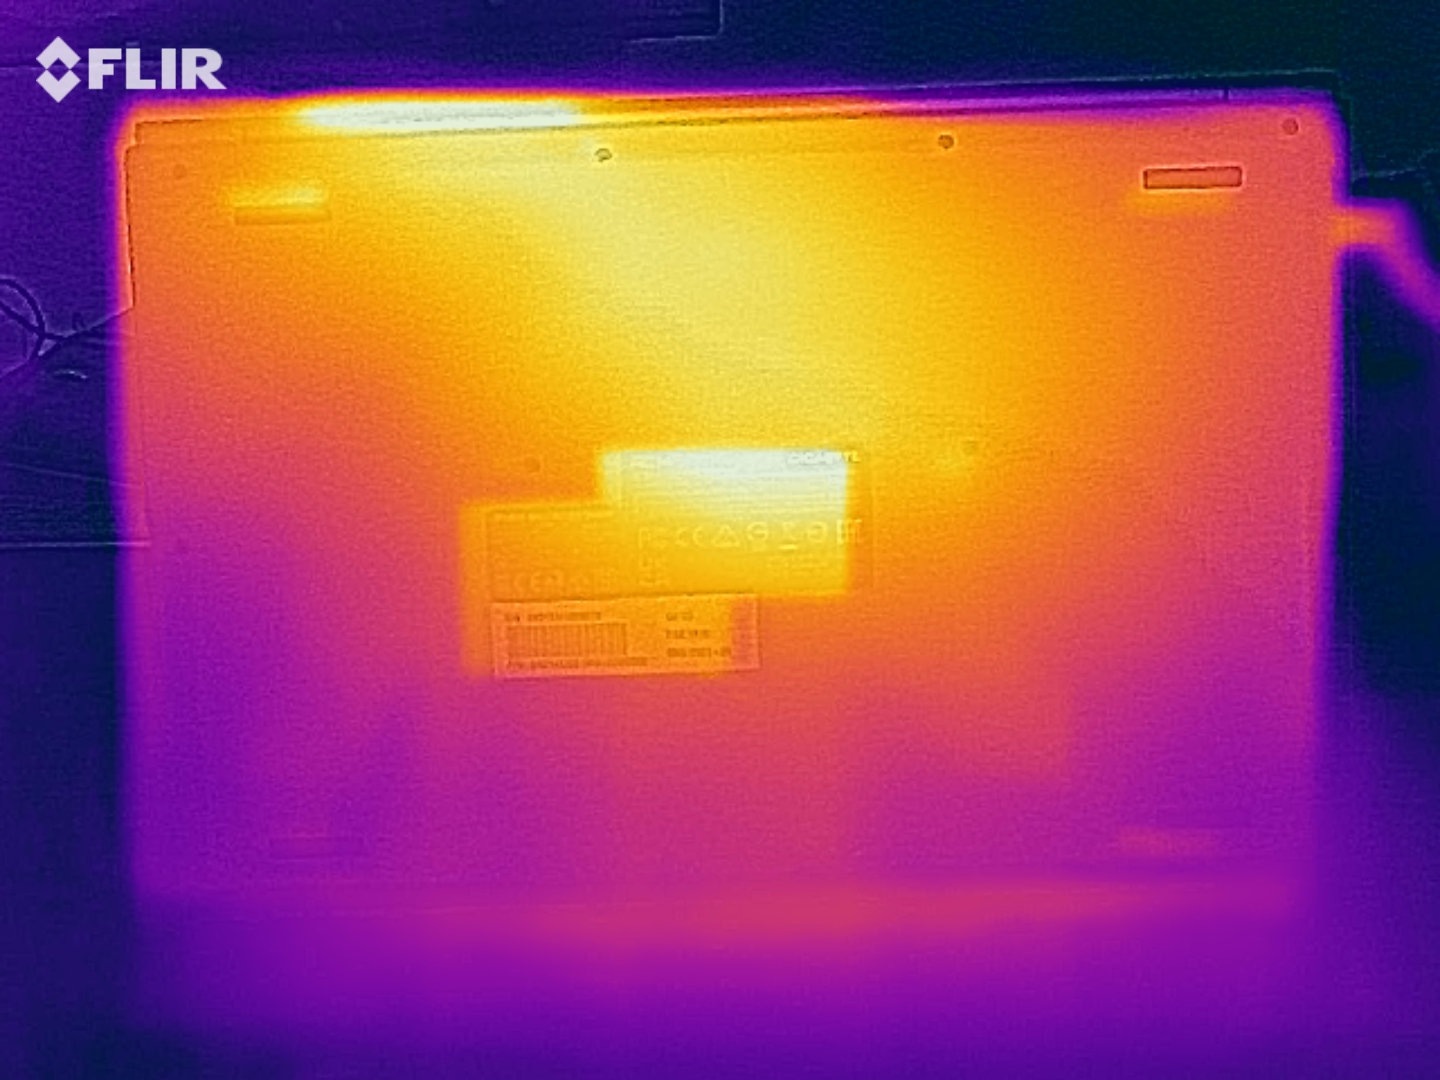
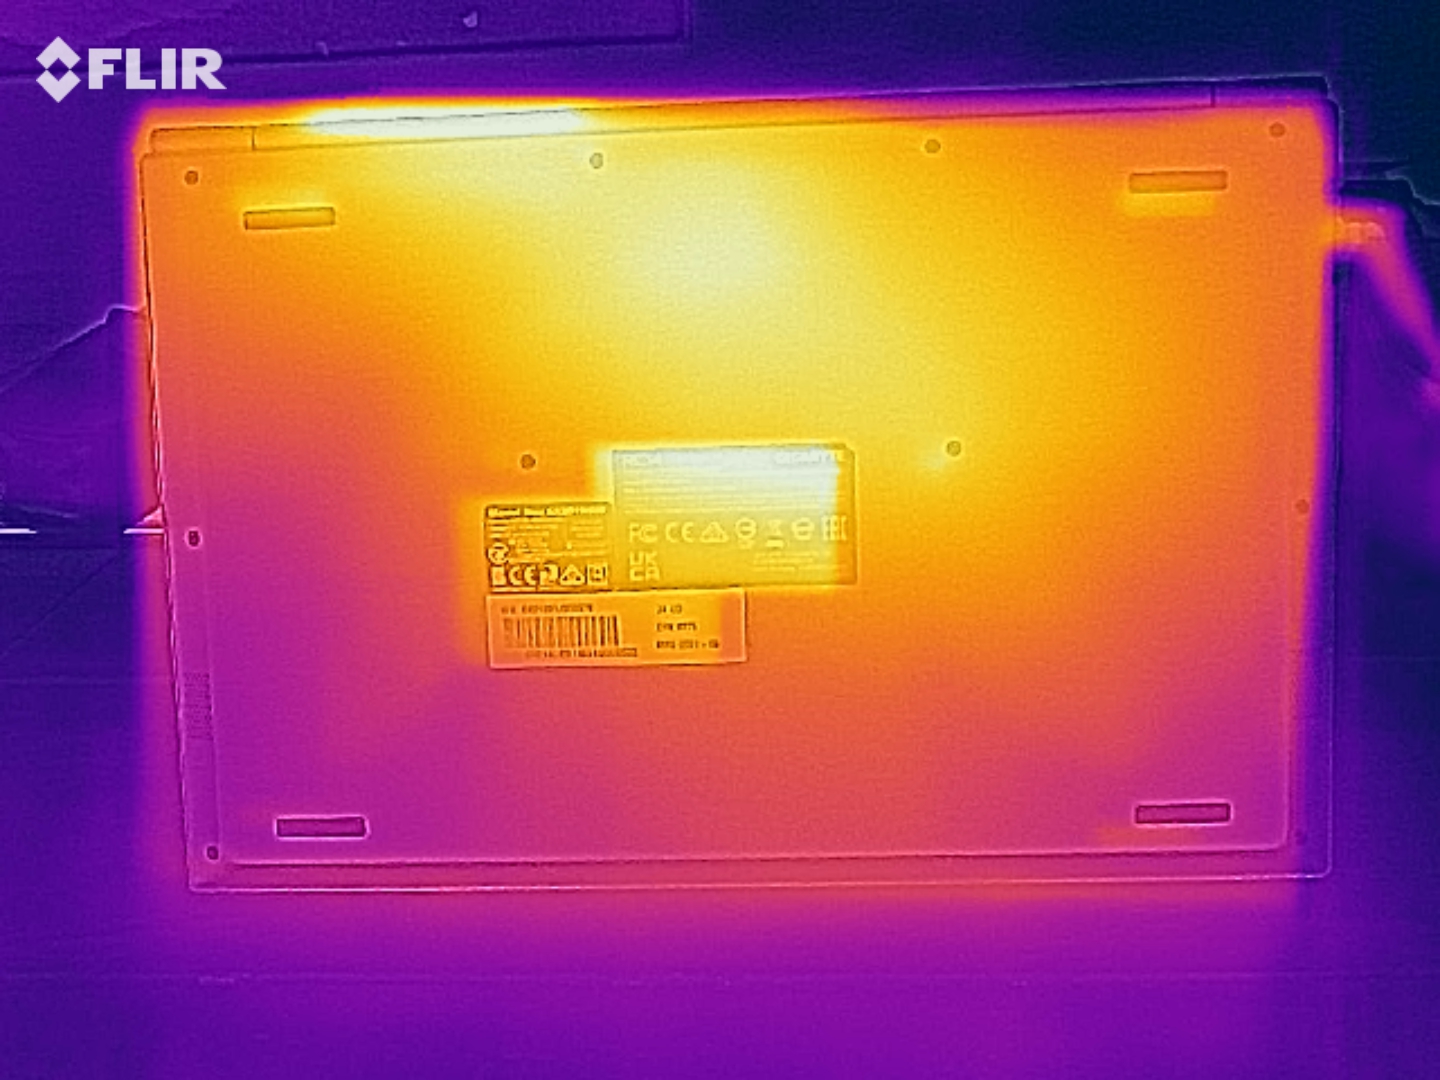
The device's temperature remains constantly below 30 °C (~86 °F) in idle usage. The palm rest area is barely warmer than room temperature. Under load, the values increase by a maximum of 10 °C, so that peak values of only 37 °C (~98.6 °F) are reached. In short: The Gigabyte U4 UD remains pleasantly cool.
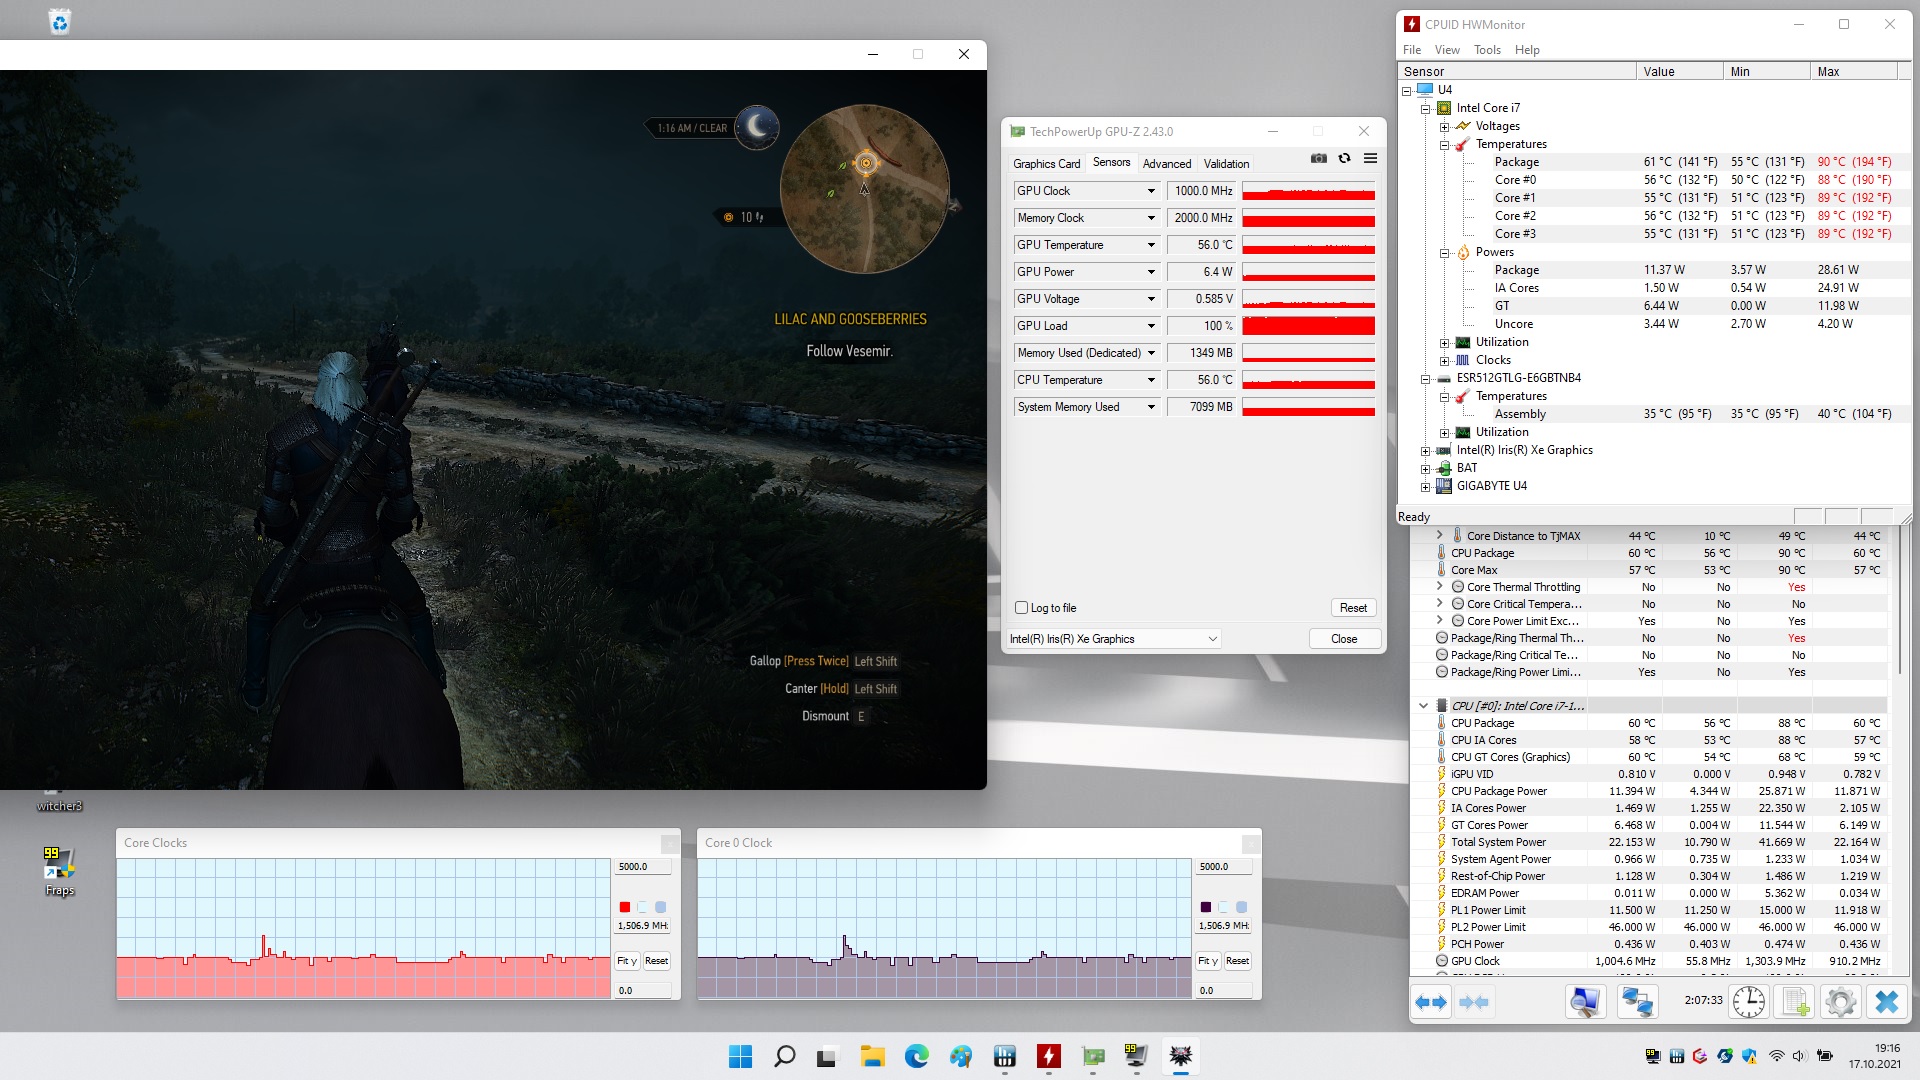
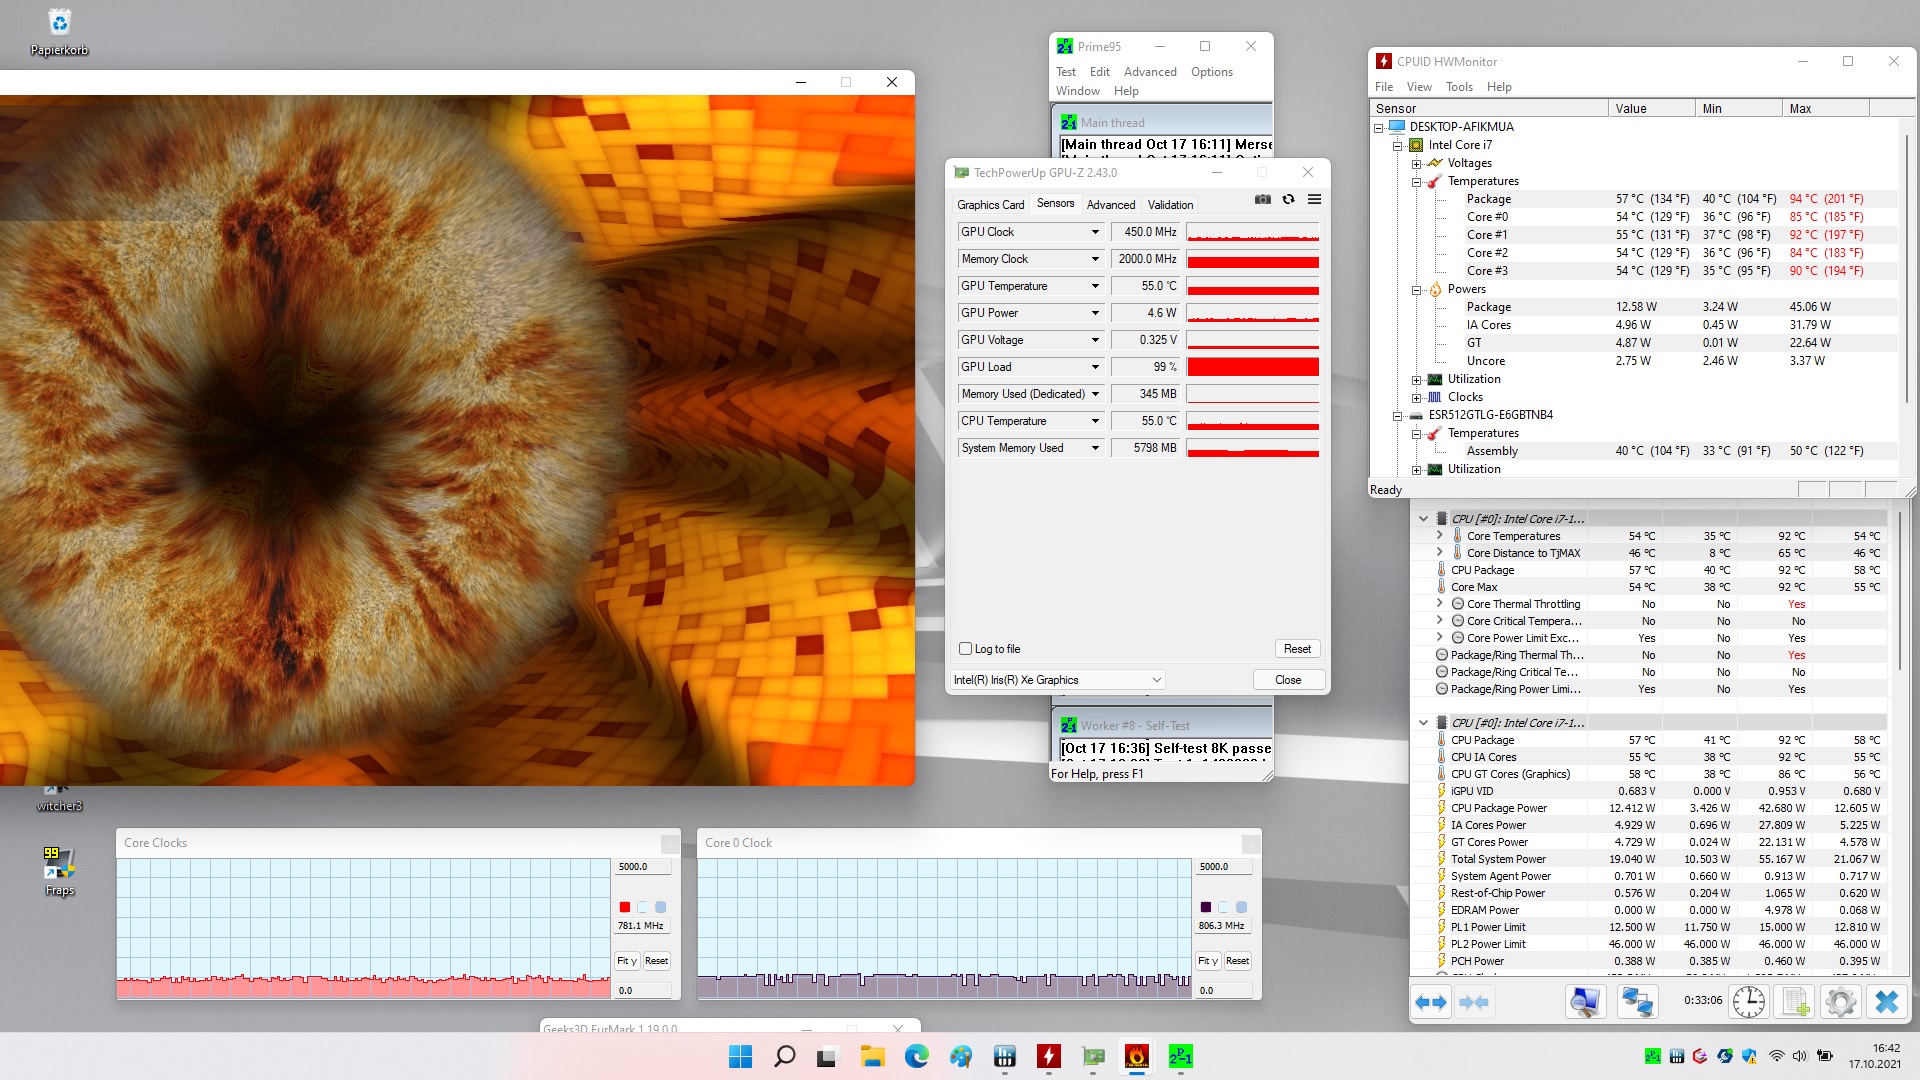
Stress test
The U4 exhibits throttling over time in our standardized stress test. After a short peak, the clock rates in particular drop to a very low level. In the long term, the CPU settles at around 800 MHz (below base the clock speed) and the GPU at 450 MHz (around the minimum clock speed). However, this still leads to moderate temperatures of around 55 °C (~131 °F). This also explains the cool external temperatures of the device.
(+) The maximum temperature on the upper side is 37 °C / 99 F, compared to the average of 35.9 °C / 97 F, ranging from 21.4 to 59 °C for the class Subnotebook.
(+) The bottom heats up to a maximum of 37 °C / 99 F, compared to the average of 39.2 °C / 103 F
(+) In idle usage, the average temperature for the upper side is 26.4 °C / 80 F, compared to the device average of 30.8 °C / 87 F.
(+) Playing The Witcher 3, the average temperature for the upper side is 31.6 °C / 89 F, compared to the device average of 30.8 °C / 87 F.
(+) The palmrests and touchpad are cooler than skin temperature with a maximum of 28 °C / 82.4 F and are therefore cool to the touch.
(±) The average temperature of the palmrest area of similar devices was 28.2 °C / 82.8 F (+0.2 °C / 0.4 F).
Speakers
The Gigabyte U4 UD's two stereo speakers are nothing to write home about. Apart from the almost non-existent bass, they actually lack any major weaknesses. However, music in particular doesn't sound very good due to the lack of bass; it sounds quite shrill. This assessment is backed by the fact that 80% of the laptops that we have reviewed so far and 85% of all the subnotebooks have sounded better than this candidate.
Gigabyte U4 UD audio analysis
(±) | speaker loudness is average but good (75 dB)
Bass 100 - 315 Hz
(-) | nearly no bass - on average 26.7% lower than median
(±) | linearity of bass is average (10.4% delta to prev. frequency)
Mids 400 - 2000 Hz
(±) | higher mids - on average 8.1% higher than median
(±) | linearity of mids is average (13.7% delta to prev. frequency)
Highs 2 - 16 kHz
(+) | balanced highs - only 2% away from median
(±) | linearity of highs is average (8% delta to prev. frequency)
Overall 100 - 16.000 Hz
(±) | linearity of overall sound is average (28.3% difference to median)
Compared to same class
» 90% of all tested devices in this class were better, 2% similar, 8% worse
» The best had a delta of 5%, average was 18%, worst was 53%
Compared to all devices tested
» 86% of all tested devices were better, 3% similar, 12% worse
» The best had a delta of 4%, average was 23%, worst was 134%
Apple MacBook 12 (Early 2016) 1.1 GHz audio analysis
(+) | speakers can play relatively loud (83.6 dB)
Bass 100 - 315 Hz
(±) | reduced bass - on average 11.3% lower than median
(±) | linearity of bass is average (14.2% delta to prev. frequency)
Mids 400 - 2000 Hz
(+) | balanced mids - only 2.4% away from median
(+) | mids are linear (5.5% delta to prev. frequency)
Highs 2 - 16 kHz
(+) | balanced highs - only 2% away from median
(+) | highs are linear (4.5% delta to prev. frequency)
Overall 100 - 16.000 Hz
(+) | overall sound is linear (10.2% difference to median)
Compared to same class
» 7% of all tested devices in this class were better, 2% similar, 90% worse
» The best had a delta of 5%, average was 18%, worst was 53%
Compared to all devices tested
» 5% of all tested devices were better, 1% similar, 94% worse
» The best had a delta of 4%, average was 23%, worst was 134%
Suboptimal energy consumption + small battery = short battery life
The Gigabyte U4 UD lags a bit behind our chosen competitors in terms of average energy consumption. With an idle consumption of 10 watts, the device can't keep up with the competition. This is also true for the MSI Prestige 14 equipped with the same CPU. One reason might be the very bright display. The power adapter's capacity of 65 watts is sufficient, since we measured a maximum consumption of 62 watts.
| Off / Standby | |
| Idle | |
| Load |
|
Key:
min: | |
| Gigabyte U4 UD i7-1195G7, Iris Xe G7 96EUs, , IPS, 1920x1080, 14" | MSI Prestige 14 Evo A11MO-026US i7-1195G7, Iris Xe G7 96EUs, Samsung PM9A1 MZVL2512HCJQ, IPS, 1920x1080, 14" | Dell Inspiron 13 5301-0D0XN i5-1135G7, Iris Xe G7 80EUs, , IPS, 1920x1080, 13.3" | LG Gram 14Z90P-G.AA79G i7-1165G7, Iris Xe G7 96EUs, SK Hynix PC601 1TB HFS001TD9TNG, IPS, 1920x1200, 14" | HP Envy 13-ba1475ng i7-1165G7, GeForce MX450, Intel SSD 660p SSDPEKNW512G8, IPS, 1920x1080, 13.3" | Average of class Subnotebook | |
|---|---|---|---|---|---|---|
| Power Consumption | 8% | 10% | 38% | 26% | 16% | |
| Idle Minimum * (Watt) | 6 | 3.4 43% | 4.4 27% | 2.5 58% | 3.4 43% | 3.73 ? 38% |
| Idle Average * (Watt) | 10 | 5.2 48% | 9.1 9% | 5.3 47% | 4.9 51% | 6.57 ? 34% |
| Idle Maximum * (Watt) | 14 | 5.8 59% | 11 21% | 9.5 32% | 5.7 59% | 7.93 ? 43% |
| Load Average * (Watt) | 33 | 52.8 -60% | 37.1 -12% | 26.2 21% | 39.6 -20% | 42.1 ? -28% |
| Witcher 3 ultra * (Watt) | 30.2 | 40.5 -34% | 36.8 -22% | |||
| Load Maximum * (Watt) | 62 | 65.6 -6% | 39 37% | 42.8 31% | 64.4 -4% | 65.1 ? -5% |
* ... smaller is better
Energy consumption during The Witcher 3
Battery life
Due to the consumption mentioned above and the 36.7 Wh battery, which is the smallest in our comparison field, battery life won't knock anyone's socks off. The device lasts just under 2 hours under load, around 4:30 hours when browsing at reduced brightness, and around 5:30 hours when watching videos on one battery charge. This isn't enough to intimidate the competition, and it's also miles behind the subnotebook average.
Using the low weight as an excuse doesn't apply in this case. The LG Gram weighs just as little, but it has a battery that is twice as large, and it manages to get much more out of it. That said, it's also considerably more expensive.
| Gigabyte U4 UD i7-1195G7, Iris Xe G7 96EUs, 36.7 Wh | MSI Prestige 14 Evo A11MO-026US i7-1195G7, Iris Xe G7 96EUs, 52 Wh | Dell Inspiron 13 5301-0D0XN i5-1135G7, Iris Xe G7 80EUs, 40 Wh | LG Gram 14Z90P-G.AA79G i7-1165G7, Iris Xe G7 96EUs, 72 Wh | HP Envy 13-ba1475ng i7-1165G7, GeForce MX450, 51 Wh | Average of class Subnotebook | |
|---|---|---|---|---|---|---|
| Battery runtime | 89% | -0% | 186% | 131% | 131% | |
| H.264 (h) | 5.4 | 4.4 -19% | 19.2 256% | 15.3 ? 183% | ||
| WiFi v1.3 (h) | 4.5 | 8.5 89% | 6 33% | 14.2 216% | 10.4 131% | 13.9 ? 209% |
| Load (h) | 2 | 1.7 -15% | 3.7 85% | 2.04 ? 2% | ||
| Reader / Idle (h) | 11.7 | 48.8 | 26.4 ? |
Pros
Cons
Verdict: The Gigabyte U4 UD wastes potential in the test
With the U4 UD, Gigabyte offers a compact subnotebook that is especially appealing with its weight of less than 1 kg. Its workmanship is of high quality, and its design is sober.
The built-in CPU promises a lot of performance out of the box, but Gigabyte doesn't fully exploit it. As a result, the device can usually hold its ground against comparison models with slower CPUs, but it falls short of expectations.
This also applies to the GPU and consequently the gaming performance. Nevertheless, it's sufficient for a round of gaming at the two lower graphics levels - you can't expect more from most subnotebooks anyway.
While the port configuration is alright, the Gigabyte U4 UD has to put up with criticism when it comes to other important aspects, such as battery life. On the one hand, this is due to the relatively high consumption rates, and on the other hand, to the the fact that the device has the smallest battery in the test field.
Overall, the Gigabyte U4 UD delivers a solid performance in our test, but it also misses out on an even better rating and an absolute purchase recommendation due to some points of criticism. Therefore, the device is primarily suitable for prospective buyers who are looking for a particularly light subnotebook at a low price, but who don't have especially high expectations in terms of endurance.
If an average runtime of about 4 hours isn't enough, users should consider the LG Gram 14Z90P-G.AA79G endurance runner, which is admittedly much more expensive. And those looking for even more performance will be satisfied with the MSI Prestige 14 Evo A11MO-026US that sports the same CPU/GPU combo.
Price and availability
At the time of writing, the Gigabyte U4 UD (Intel Core i7-1195G7, Intel Iris Xe Graphics G7 96EUs, 16 GB DDR4 RAM, 512 GB SSD) can be found on Amazon for around $1,060.
Gigabyte U4 UD
- 11/22/2021 v7 (old)
Marcus Schwarten
Price comparison

