Notebookcheck Logo

Qualcomm SD X Adreno X1-45 1.7 TFLOPS vs Qualcomm SD X Adreno X1-45 2.1 TFLOPS

Qualcomm SD X Adreno X1-45 1.7 TFLOPS

► remove from comparison Qualcomm Adreno X1-45 1.7 TFLOPS

The 1.7 TFLOPS Adreno X1-45 is an integrated graphics adapter that the Snapdragon X Plus 8-core X1P-42-100 SoC features. Compared to the faster 3.8 TFLOPS and 4.6 TFLOPS X1-85 iGPUs, this little guy does not just run at lower clock speeds but also has fewer unified shaders at its disposal, with 768 being the most likely number. The 2.1 TFLOPS X1-45 variant on the other hand only differs in clock speeds.

Architecture

The underlying architecture is reportedly (ChipsAndCheese) in many respects the same as what was used in the Adreno 730, rendering the iGPU DirectX 12-compatible but not DirectX 12 Ultimate-compatible. Ray tracing is only supported via Vulcan 1.3. The highest OpenGL version supported is ES 3.2. The iGPU enjoys access to fast enough RAM but has comparatively small and slow caches to work with. AVC, HEVC and AV1 video codecs can be both hardware-decoded and hardware-encoded; with VP9, only decoding is possible.

The highest monitor resolution supported is UHD 2160p rather than SUHD 4320p.

Performance

A lot depends on the power targets of a specific system, just like it is with AMD, Intel and Nvidia products. That being said, the 1.7 TFLOPS model is on par with the GeForce GTX 950M and significantly behind the Iris Xe Graphics G7 (80 EUs) in synthetic benchmarks. Games put it really close to the GeForce MX350 which is a lot better; still, this kind of performance is only just sufficient for pre-2020 games and resolutions such as HD 720p.

It is also worth mentioning that Qualcomm's graphics drivers aren't quite as polished as what AMD, Intel and especially Nvidia have to offer, leading to severe visual artefacts in certain games. A lot of games won't start at all.

Power consumption

Snapdragon X Plus 8-core chips normally consume no more than 30 W, including the on-package RAM. This makes it highly unlikely that the iGPU will ever get to eat more than 20 W.

Since TSMC's N4P process is employed, it's safe to say power efficiency is going to be better than average with this iGPU, as of late 2024. It's still far behind Apple's M-series chips of course as our in-depth analysis article shows.

Qualcomm SD X Adreno X1-45 2.1 TFLOPS

► remove from comparison Qualcomm Adreno X1-45 2.1 TFLOPS

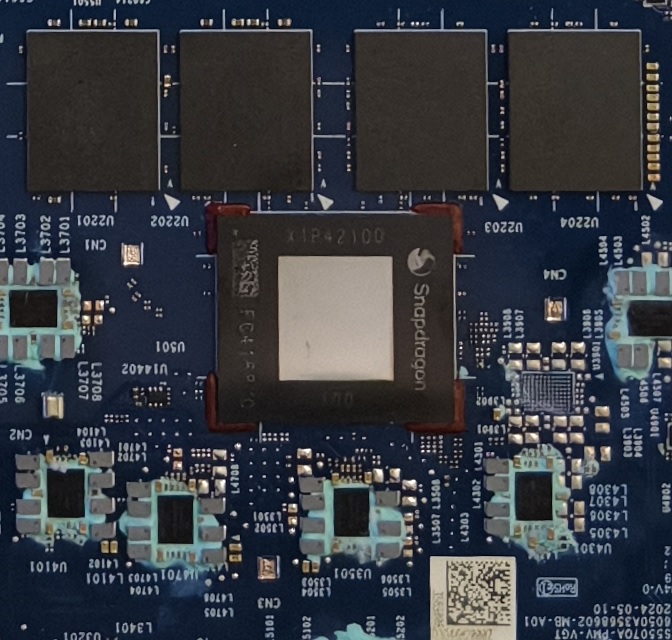
The 2.1 TFLOPS Adreno X1-45 is an integrated graphics adapter that the Snapdragon X Plus 8-core X1P-46-100 SoC features. Compared to the faster 3.8 TFLOPS and 4.6 TFLOPS X1-85 iGPUs, this little guy does not just run at lower clock speeds but also has fewer unified shaders at its disposal, with 768 being the most likely number.

The slower 1.7 TFLOPS model in the meantime runs at even lower clock speeds.

Architecture

The underlying architecture is reportedly (ChipsAndCheese) in many respects the same as what was used in the Adreno 730, rendering the iGPU DirectX 12-compatible but not DirectX 12 Ultimate-compatible. Ray tracing is only supported via Vulcan 1.3. The highest OpenGL version supported is ES 3.2. The iGPU enjoys access to fast enough RAM but has comparatively small and slow caches to work with. AVC, HEVC and AV1 video codecs can be both hardware-decoded and hardware-encoded; with VP9, only decoding is possible.

The highest monitor resolution supported is UHD 2160p rather than SUHD 4320p.

Performance

A lot depends on the power targets of a specific system, just like it is with AMD, Intel and Nvidia products. That being said, we expect the 2.1 TFLOPS X1-45 to be almost as fast as the 96 EU Intel Iris Xe iGPU, making for playable experience in pre-2021 games at below-900p resolutions and on low graphics settings.

It is also worth mentioning that Qualcomm's graphics drivers aren't quite as polished as what AMD, Intel and especially Nvidia have to offer, leading to severe visual artefacts in certain games. A lot of games won't start at all.

Power consumption

Snapdragon X Plus 8-core chips normally consume no more than 30 W, including the on-package RAM. This makes it highly unlikely that the iGPU will ever get to eat more than 20 W.

Since TSMC's N4P process is employed, it's safe to say power efficiency is going to be better than average with this iGPU, as of late 2024. It's still far behind Apple's M-series chips of course as our in-depth analysis article shows.

Qualcomm SD X Adreno X1-45 1.7 TFLOPSQualcomm SD X Adreno X1-45 2.1 TFLOPS
Snapdragon X Series
Adreno X1-85 4.6 TFLOPS compare 1536 @ 1.5 GHz? Bit @ 8448 MHz
Adreno X1-85 3.8 TFLOPS compare 1536 @ 1.25 GHz? Bit @ 8448 MHz
Adreno X1-45 2.1 TFLOPS 768 128 Bit @ 8448 MHz
Adreno X1-45 1.7 TFLOPS 768 128 Bit @ 8448 MHz
Adreno X1-85 4.6 TFLOPS compare 1536 @ 1.5 GHz? Bit @ 8448 MHz
Adreno X1-85 3.8 TFLOPS compare 1536 @ 1.25 GHz? Bit @ 8448 MHz
Adreno X1-45 2.1 TFLOPS 768 128 Bit @ 8448 MHz
Adreno X1-45 1.7 TFLOPS 768 128 Bit @ 8448 MHz
Pipelines768 - unified768 - unified
Memory Speed8448 MHz8448 MHz
Memory Bus Width128 Bit128 Bit
Memory TypeLPDDR5xLPDDR5x
Shared Memoryyesyes
APIDirectX 12_1, OpenGL ES 3.2, OpenCL 3.0, Vulkan 1.3DirectX 12_1, OpenGL ES 3.2, OpenCL 3.0, Vulkan 1.3
Power Consumption20 Watt20 Watt
technology4 nm4 nm
Displays3 Displays (max.)3 Displays (max.)
FeaturesSUHD 2160p60 resolution support, AVC/HEVC/AV1 encoding and decodingSUHD 2160p60 resolution support, AVC/HEVC/AV1 encoding and decoding
Date of Announcement03.09.2024 03.09.2024
CPU in Adreno X1-45 1.7 TFLOPSGPU Base SpeedGPU Boost / Turbo
Qualcomm Snapdragon X Plus X1P-46-1008 x ? MHz, 30 W? MHz? MHz
Qualcomm Snapdragon X Plus X1P-42-1008 x ? MHz, 30 W? MHz? MHz
Qualcomm Snapdragon X X1-26-1008 x ? MHz? MHz? MHz
min. - max.? MHz? MHz

Benchmarks

3DMark - 3DMark Steel Nomad
min: 228     avg: 231.2     median: 232 (2%)     max: 235 Points
3DMark - 3DMark Steel Nomad Light
min: 1080     avg: 1115     median: 1097 (3%)     max: 1148 Points
3DMark - 3DMark Wild Life Unlimited
3263 Points (2%)
3DMark - 3DMark Wild Life Extreme Unlimited
min: 3164     avg: 3194     median: 3187 (4%)     max: 3225 Points
3DMark - 3DMark Solar Bay
5914 Points (3%)
3DMark - 3DMark Time Spy Score
min: 981     avg: 1043     median: 1066.5 (3%)     max: 1075 Points
3DMark - 3DMark Time Spy Graphics
min: 873     avg: 917     median: 933.5 (2%)     max: 941 Points
3DMark - 3DMark Cloud Gate Score
min: 17207     avg: 17800     median: 17607 (17%)     max: 19040 Points
3DMark - 3DMark Cloud Gate Graphics
min: 23800     avg: 24860     median: 24152 (6%)     max: 27960 Points
Cinebench R10 Cinebench R10 Shading (32bit) + Qualcomm SD X Adreno X1-45 1.7 TFLOPS
Cinebench R10 - Cinebench R10 Shading (32bit)
6442 Points (5%)
Cinebench R15
Cinebench R15 OpenGL 64 Bit + Qualcomm SD X Adreno X1-45 1.7 TFLOPS
Cinebench R15 - Cinebench R15 OpenGL 64 Bit
min: 19.7     avg: 22.5     median: 22.8 (1%)     max: 24.2 fps
Cinebench R15 OpenGL Ref. Match 64 Bit + Qualcomm SD X Adreno X1-45 1.7 TFLOPS
Basemark GPU 1.2 - Basemark GPU 1.2 Vulkan Official Medium Offscreen 1080
min: 104.6     avg: 128.2     median: 104.6 (3%)     max: 246 fps
Basemark GPU 1.2 - Basemark GPU 1.2 Vulkan Official High Offscreen 2160
3.6 fps (1%)
Geekbench 6.5 - Geekbench 6.5 GPU OpenCL
min: 9415     avg: 42943     median: 9798.5 (2%)     max: 206281 Points
Geekbench 6.5 - Geekbench 6.5 GPU Vulkan
min: 11315     avg: 49046     median: 13789 (3%)     max: 207733 Points
Power Consumption - Furmark Stress Test Power Consumption - external Monitor *
min: 8.54     avg: 10.6     median: 9.6 (1%)     max: 15.2 Watt
Power Consumption - The Witcher 3 Power Consumption - external Monitor *
min: 18     avg: 18.5     median: 18.5 (3%)     max: 18.9 Watt
Power Consumption - Power Efficiency - Witcher 3 ultra external Monitor
min: 0.582     avg: 0.6     median: 0.6 (49%)     max: 0.611 fps per Watt
Power Consumption - Power Efficiency - Cyberpunk 2077 ultra
min: 0.2067     avg: 0.3     median: 0.3 (1%)     max: 0.4318 fps per Watt

Average Benchmarks Qualcomm SD X Adreno X1-45 1.7 TFLOPS → 0% n=0

- Range of benchmark values for this graphics card
red legend - Average benchmark values for this graphics card
* Smaller numbers mean a higher performance
1 This benchmark is not used for the average calculation

Game Benchmarks

The following benchmarks stem from our benchmarks of review laptops. The performance depends on the used graphics memory, clock rate, processor, system settings, drivers, and operating systems. So the results don't have to be representative for all laptops with this GPU. For detailed information on the benchmark results, click on the fps number.

low 1920x1080
100%
Adreno X1-45 1.7 TFLOPS:
46.1  fps
med. 1920x1080
Adreno X1-45 1.7 TFLOPS:
0 (!)  fps
low 1920x1080
100%
Adreno X1-45 1.7 TFLOPS:
13.6 14.4 14.4 14.6 14.7 14.7 15 15.2 15.3 15.3 15.3 15.3 15.6 ~ 15 fps
med. 1920x1080
100%
Adreno X1-45 1.7 TFLOPS:
11.1 11.2 11.2 11.2 11.3 11.5 11.6 11.6 11.7 11.7 11.8 ~ 11 fps
high 1920x1080
100%
Adreno X1-45 1.7 TFLOPS:
8.3 9.2 9.5 9.6 9.6 9.6 9.8 9.8 9.9 9.9 9.9 10 ~ 10 fps
ultra 1920x1080
100%
Adreno X1-45 1.7 TFLOPS:
8.2 8.2 8.2 8.3 8.3 8.3 8.4 8.4 8.5 8.5 8.5 8.5 8.6 ~ 8 fps
low 1920x1080
100%
Adreno X1-45 1.7 TFLOPS:
11.7 12.9 13.1 13.1 13.1 13.1 13.2 13.3 13.4 13.4 13.5 ~ 13 fps
med. 1920x1080
100%
Adreno X1-45 1.7 TFLOPS:
9.4 10.9 10.9 11 11 11 11 11.1 11.2 11.7 11.8 ~ 11 fps
high 1920x1080
100%
Adreno X1-45 1.7 TFLOPS:
7.8 8.7 9.4 9.5 9.5 9.6 9.7 10.2 10.3 ~ 9 fps
ultra 1920x1080
100%
Adreno X1-45 1.7 TFLOPS:
6.8 9.1 9.2 9.2 9.2 9.4 10.1 10.2 ~ 9 fps
F1 22

F1 22

2022
low 1920x1080
100%
Adreno X1-45 1.7 TFLOPS:
33.1 33.7 37.8 ~ 35 fps
med. 1920x1080
100%
Adreno X1-45 1.7 TFLOPS:
34.1 36.6 38.3 ~ 36 fps
high 1920x1080
100%
Adreno X1-45 1.7 TFLOPS:
22.9 23 23.3 ~ 23 fps
ultra 1920x1080
100%
Adreno X1-45 1.7 TFLOPS:
16.2 16.4 16.7 ~ 16 fps
low 1920x1080
100%
Adreno X1-45 1.7 TFLOPS:
27.9  fps
med. 1920x1080
100%
Adreno X1-45 1.7 TFLOPS:
21.1  fps
high 1920x1080
100%
Adreno X1-45 1.7 TFLOPS:
13.4  fps
ultra 1920x1080
100%
Adreno X1-45 1.7 TFLOPS:
10.4  fps
low 1280x720
100%
Adreno X1-45 1.7 TFLOPS:
16 41 ~ 29 fps
med. 1920x1080
100%
Adreno X1-45 1.7 TFLOPS:
15 16 ~ 16 fps
high 1920x1080
100%
Adreno X1-45 1.7 TFLOPS:
13  fps
Strange Brigade

Strange Brigade

2018
low 1280x720
100%
Adreno X1-45 1.7 TFLOPS:
0 (!) 78 83 84 84 85 85.5 85.5 86.7 87.4 87.6 ~ 77 fps
med. 1920x1080
100%
Adreno X1-45 1.7 TFLOPS:
29 29.6 29.8 29.9 30 30 30 30.1 ~ 30 fps
high 1920x1080
100%
Adreno X1-45 1.7 TFLOPS:
22 22.5 22.7 22.8 23 23 23 23 ~ 23 fps
ultra 1920x1080
100%
Adreno X1-45 1.7 TFLOPS:
19 19 19 19.3 19.6 19.7 20 20 ~ 19 fps
Far Cry 5

Far Cry 5

2018
low 1280x720
100%
Adreno X1-45 1.7 TFLOPS:
36 37 37 38 38 38 ~ 37 fps
med. 1920x1080
100%
Adreno X1-45 1.7 TFLOPS:
21 21 21 21 21 21 ~ 21 fps
high 1920x1080
100%
Adreno X1-45 1.7 TFLOPS:
19 19 19 19 19 19 ~ 19 fps
ultra 1920x1080
100%
Adreno X1-45 1.7 TFLOPS:
17 17 18 18 18 18 ~ 18 fps
low 1280x720
100%
Adreno X1-45 1.7 TFLOPS:
33.3 34.9 34.9 36 36 36.3 36.7 38.5 39.3 39.5 40.9 ~ 37 fps
med. 1920x1080
100%
Adreno X1-45 1.7 TFLOPS:
0 (!) 28.2 30.4 30.5 30.8 ~ 24 fps
high 1920x1080
100%
Adreno X1-45 1.7 TFLOPS:
25.3 27.3 27.3 27.3 ~ 27 fps
low 1280x720
100%
Adreno X1-45 1.7 TFLOPS:
21.4 31.4 36.8 36.9 37.1 37.1 37.2 37.2 37.4 37.5 37.6 37.8 38.3 ~ 36 fps
med. 1920x1080
100%
Adreno X1-45 1.7 TFLOPS:
14.9 14.9 14.9 15 15 15.1 15.1 15.2 15.3 15.7 18 18.1 ~ 16 fps
high 1920x1080
100%
Adreno X1-45 1.7 TFLOPS:
9.7 9.8 9.9 10 10.1 12.4 15.1 15.3 15.7 18.1 ~ 13 fps
low 1280x720
100%
Adreno X1-45 1.7 TFLOPS:
77 78.5 79.5 80.3 80.4 81 81.6 83.4 85 85.3 85.6 85.7 89.3 ~ 83 fps
med. 1366x768
100%
Adreno X1-45 1.7 TFLOPS:
61.8 63.2 63.2 64.1 65.8 66 66.1 66.1 66.3 67.1 67.3 67.8 73.2 ~ 66 fps
high 1920x1080
100%
Adreno X1-45 1.7 TFLOPS:
37 55 55.2 55.5 55.7 55.9 56.2 56.3 56.7 56.9 57.6 57.8 60.2 ~ 55 fps
ultra 1920x1080
100%
Adreno X1-45 1.7 TFLOPS:
29.9 47.5 47.8 47.9 48.1 48.2 48.7 48.8 49.1 49.2 49.7 49.9 51.8 ~ 47 fps
low 1024x768
100%
Adreno X1-45 1.7 TFLOPS:
65 68 ~ 67 fps
med. 1366x768
100%
Adreno X1-45 1.7 TFLOPS:
39 41 ~ 40 fps
high 1920x1080
100%
Adreno X1-45 1.7 TFLOPS:
22 22 ~ 22 fps
ultra 1920x1080
100%
Adreno X1-45 1.7 TFLOPS:
11 11 ~ 11 fps
GTA V

GTA V

2015
low 1024x768
100%
Adreno X1-45 1.7 TFLOPS:
84.9 87.5 88 88.5 91.5 92.8 94.4 94.7 95.7 95.9 96.4 98.3 112 ~ 94 fps
med. 1366x768
100%
Adreno X1-45 1.7 TFLOPS:
71.2 81.2 84.2 84.8 85 87.1 88 88.7 89.4 90.6 91.1 91.2 103.6 ~ 87 fps
high 1920x1080
100%
Adreno X1-45 1.7 TFLOPS:
31.2 32.4 32.5 32.8 33 33 33.1 33.4 33.4 33.9 34 34.2 34.3 ~ 33 fps
ultra 1920x1080
100%
Adreno X1-45 1.7 TFLOPS:
13 14 14 14.3 14.5 14.6 14.7 14.7 15 15.3 15.3 15.4 ~ 15 fps

Average Gaming Qualcomm SD X Adreno X1-45 1.7 TFLOPS → 100%

Average Gaming 30-70 fps → 100%

Qualcomm SD X Adreno X1-45 1.7 TFLOPSQualcomm SD X Adreno X1-45 2.1 TFLOPS
lowmed.highultraQHD4Klowmed.highultraQHD4K
Total War Pharaoh46.1
Cyberpunk 20771511108
Baldur's Gate 3131199
F1 2235362316
Tiny Tina's Wonderlands27.921.113.410.4
Shadow of the Tomb Raider291613
Strange Brigade77302319
Far Cry 537211918
X-Plane 11.11372427
Final Fantasy XV Benchmark361613
Dota 2 Reborn83665547
The Witcher 367402211
GTA V94873315
Qualcomm SD X Adreno X1-45 1.7 TFLOPSQualcomm SD X Adreno X1-45 2.1 TFLOPS
lowmed.highultraQHD4Klowmed.highultraQHD4K
< 30 fps
< 60 fps
< 120 fps
≥ 120 fps
4
5
4
7
3
2
10
2

8
1


< 30 fps
< 60 fps
< 120 fps
≥ 120 fps


For more games that might be playable and a list of all games and graphics cards visit our Gaming List

Add one or more devices and compare

In the following list you can select (and also search for) devices that should be added to the comparison. You can select more than one device.

restrict list:
v1.35
log 02. 04:19:45

#0 ran 0s before starting gpusingle class +0s ... 0s

#1 checking url part for id 12765 +0s ... 0s

#2 checking url part for id 12780 +0s ... 0s

#3 redirected to Ajax server, took 1767323985s time from redirect:0 +0s ... 0s

#4 did not recreate cache, as it is less than 5 days old! Created at Thu, 01 Jan 2026 05:18:57 +0100 +0s ... 0s

#5 composed specs +0.027s ... 0.028s

#6 did output specs +0s ... 0.028s

#7 start showIntegratedCPUs +0s ... 0.028s

#8 getting avg benchmarks for device 12765 +0.016s ... 0.044s

#9 got single benchmarks 12765 +0.014s ... 0.058s

#10 getting avg benchmarks for device 12780 +0s ... 0.058s

#11 got single benchmarks 12780 +0s ... 0.058s

#12 got avg benchmarks for devices +0s ... 0.058s

#13 min, max, avg, median took s +0.011s ... 0.07s

#14 before gaming benchmark output +0s ... 0.07s

#15 Got 399 rows for game benchmarks. +0.033s ... 0.102s

#16 composed SQL query for gamebenchmarks +0s ... 0.102s

#17 got data and put it in $dataArray +0.001s ... 0.103s

#18 benchmarks composed for output. +0.006s ... 0.109s

#19 calculated avg scores. +0s ... 0.109s

#20 return log +0.001s ... 0.11s

Please share our article, every link counts!
Mail Logo
Google Logo Add as a preferred
source on Google
> Expert Reviews and News on Laptops, Smartphones and Tech Innovations > Benchmarks / Tech > Graphics Card Comparison - Head 2 Head
Redaktion, 2017-09- 8 (Update: 2023-07- 1)