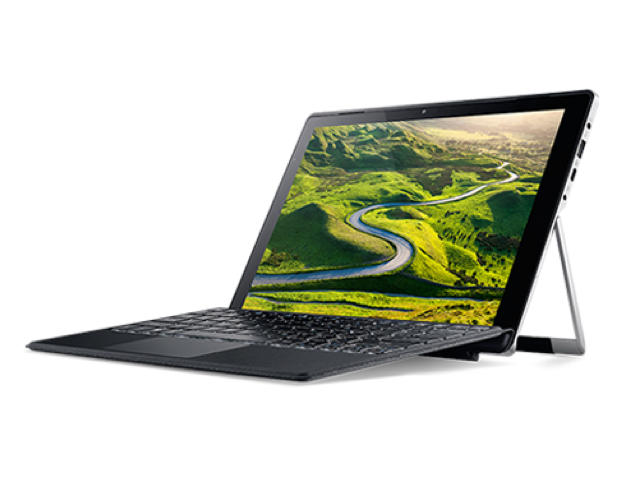
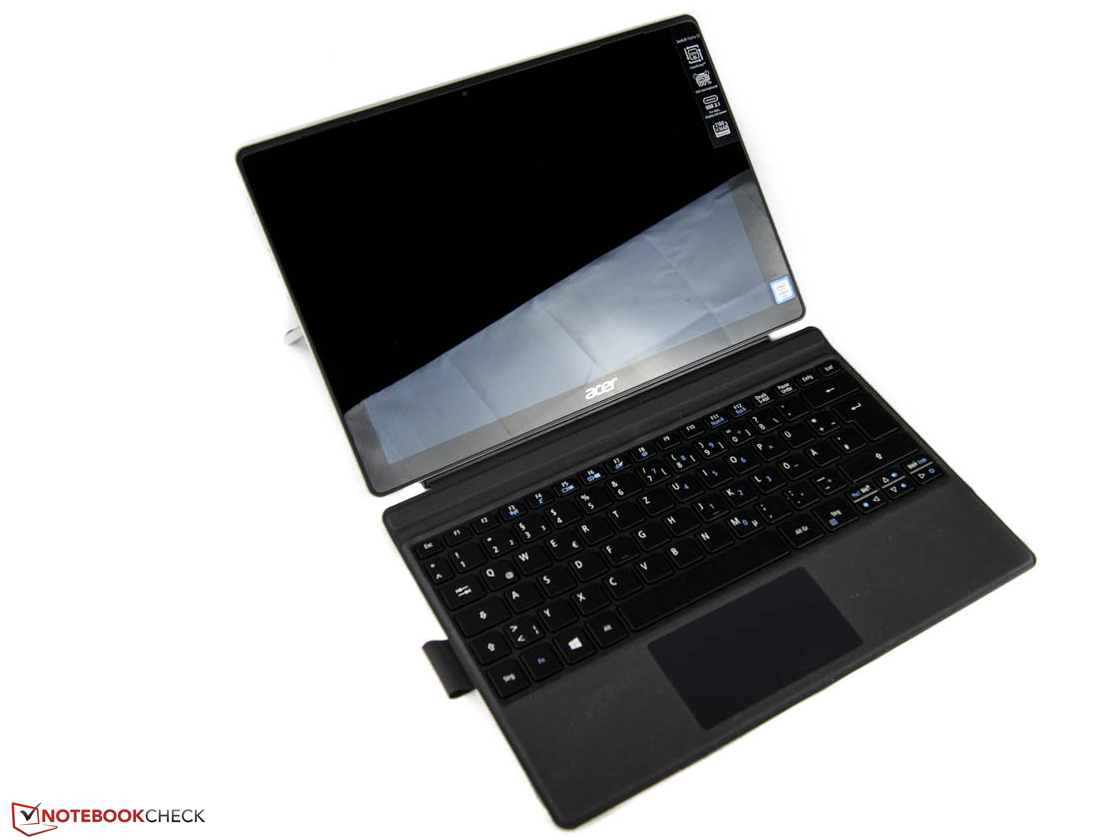
Acer Aspire Switch Alpha 12 SA5-271-70EQ Convertible Review

For the original German review, see here.
The Core i5 variant of the Switch Alpha 12 could already convince us. Finally, a tablet provides decent performance. The Acer Liquid Loop made this possible. Certainly, we were excited to see whether the expensive Core i7 6500U variant with a 512 GB SSD pays off. Does the i7 significantly improve performance? What about battery life and waste heat? This update review will answer all these questions about the Switch Alpha 12 SA5-271-70EQ (i7, 512 GB).
We will skip identical aspects such as case, connectivity, input devices, and speakers here. See our complete review of the Aspire Switch 12 Alpha SA5-271-56HM (Core i5, 128 GB) for information about these. In addition, the premium model has a small, yet important difference: a backlit keyboard!
We will focus on the display in this update, since the panel ID could not be read out and the measurement values are different, yet not worse in all aspects.
Case

Communication
The Switch 12 Alpha delivers very good data throughput rates in our networking test. It can even keep up with the leader, the Yoga 460, in this new test. The Spectre x2 12 shows that not every device can transfer data to a Gigabit Ethernet PC that quickly.
| Networking | |
| iperf Server (receive) TCP 1 m | |
| Acer Aspire Switch Alpha 12 SA5-271-70EQ | |
| Huawei MateBook m5-6Y54 | |
| HP Spectre x2 12-a001ng | |
| iperf Client (transmit) TCP 1 m | |
| Acer Aspire Switch Alpha 12 SA5-271-70EQ | |
| Huawei MateBook m5-6Y54 | |
| HP Spectre x2 12-a001ng | |
Cameras
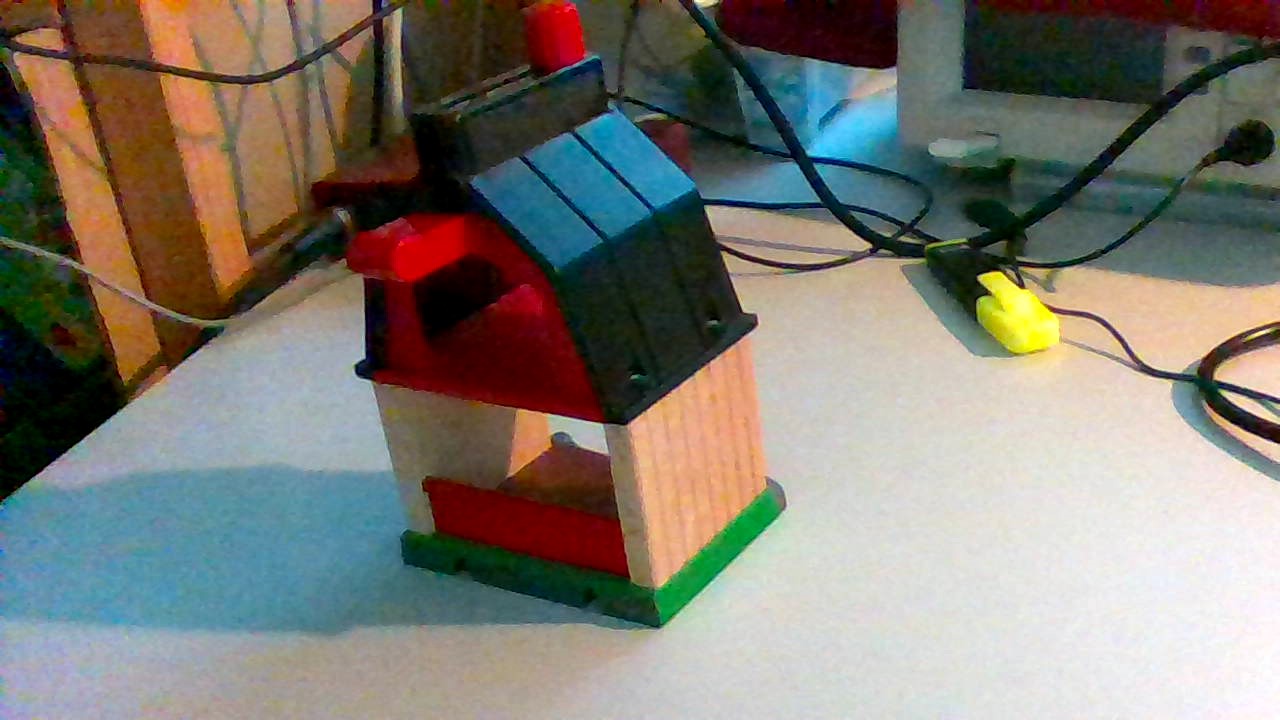
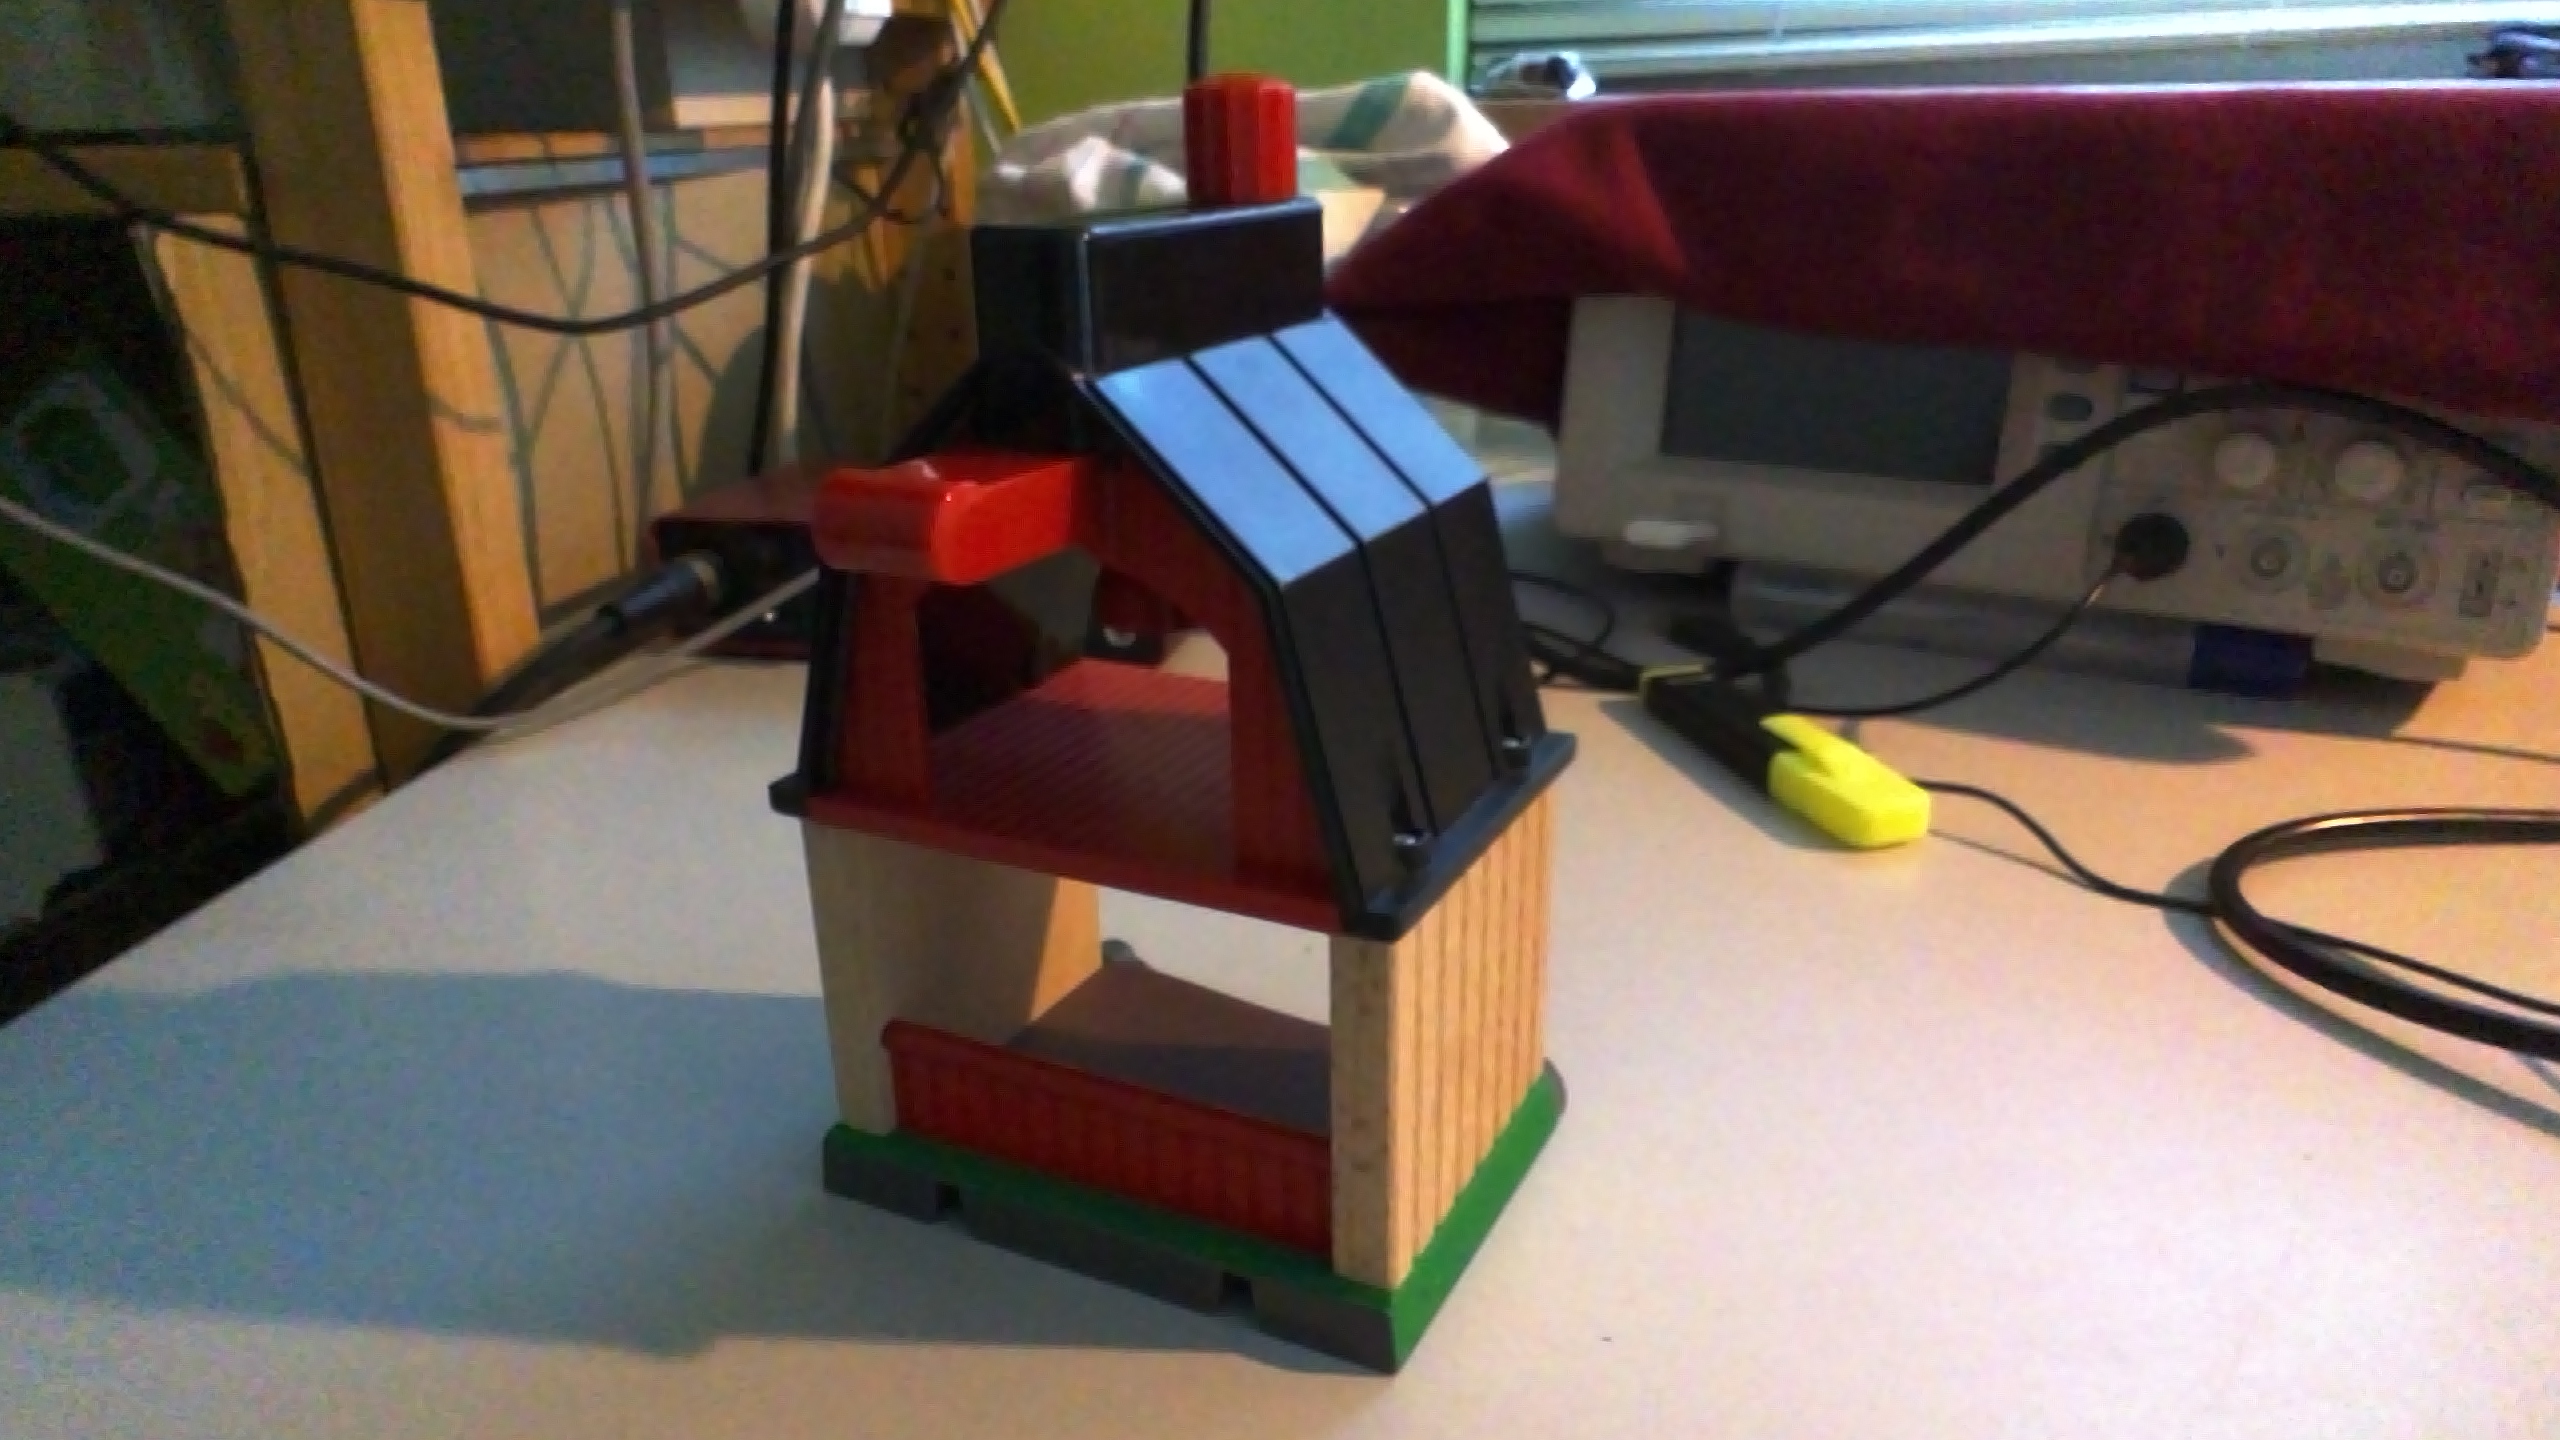
As we missed this part in our review of the i5 model, we will cover it here. The front facing camera does a poor job. It is almost useless in low light conditions. However, the 3.6 MP rear camera performs better. Although outdoor shots suffer from low contrast and dull colors, the details and noise are ok. Due to a slow autofocus recording videos is cumbersome and the result is poor. However, recordings from a constant distance, i.e. fixed focus, are better. The Spectre x2 12 features a better camera and this is not only due to RealSense.


Display
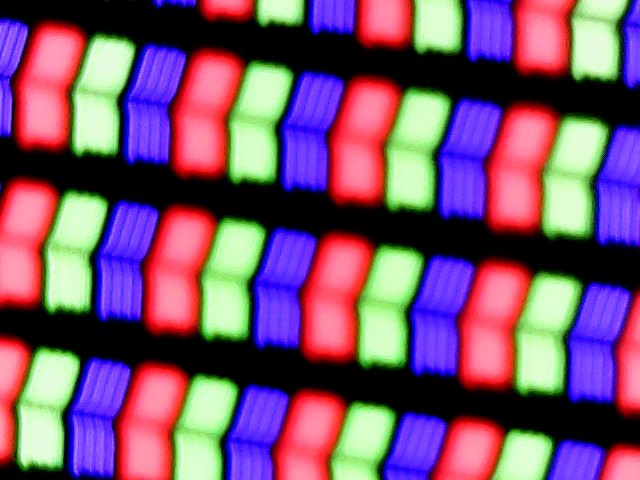
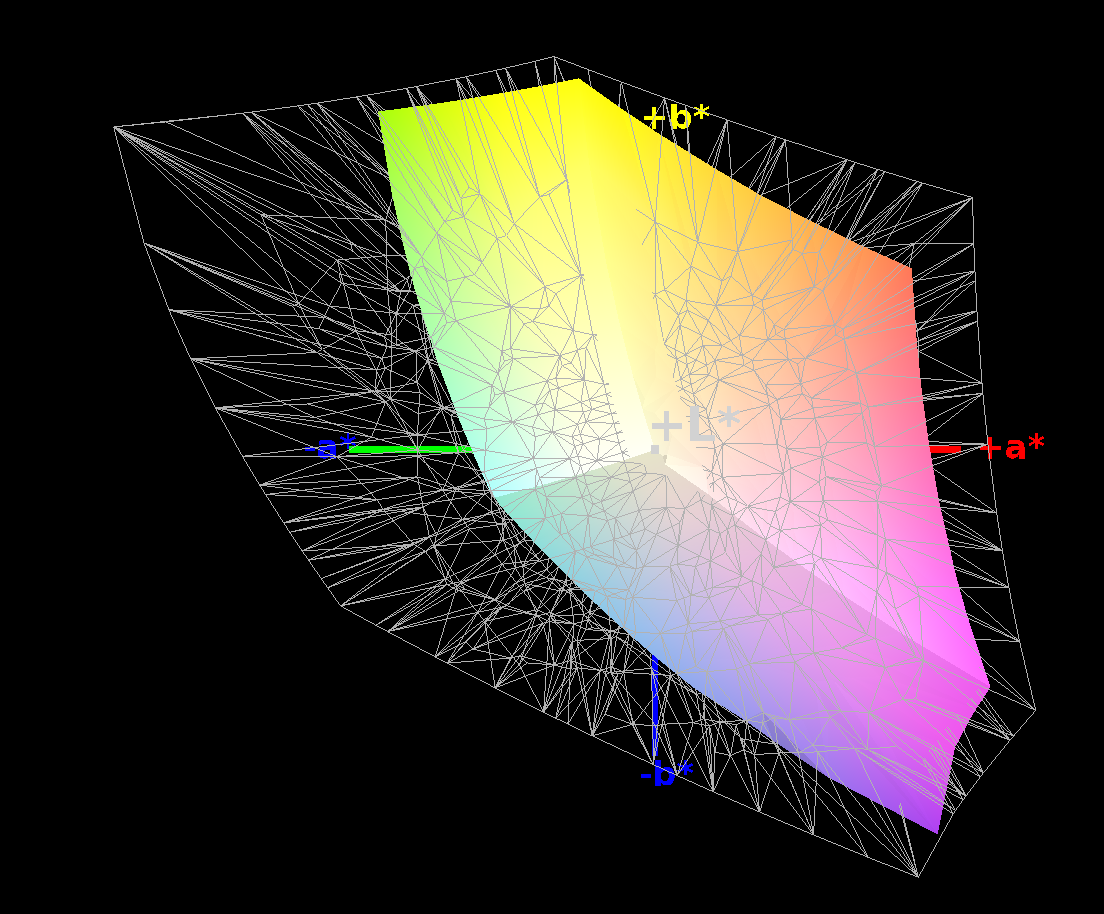
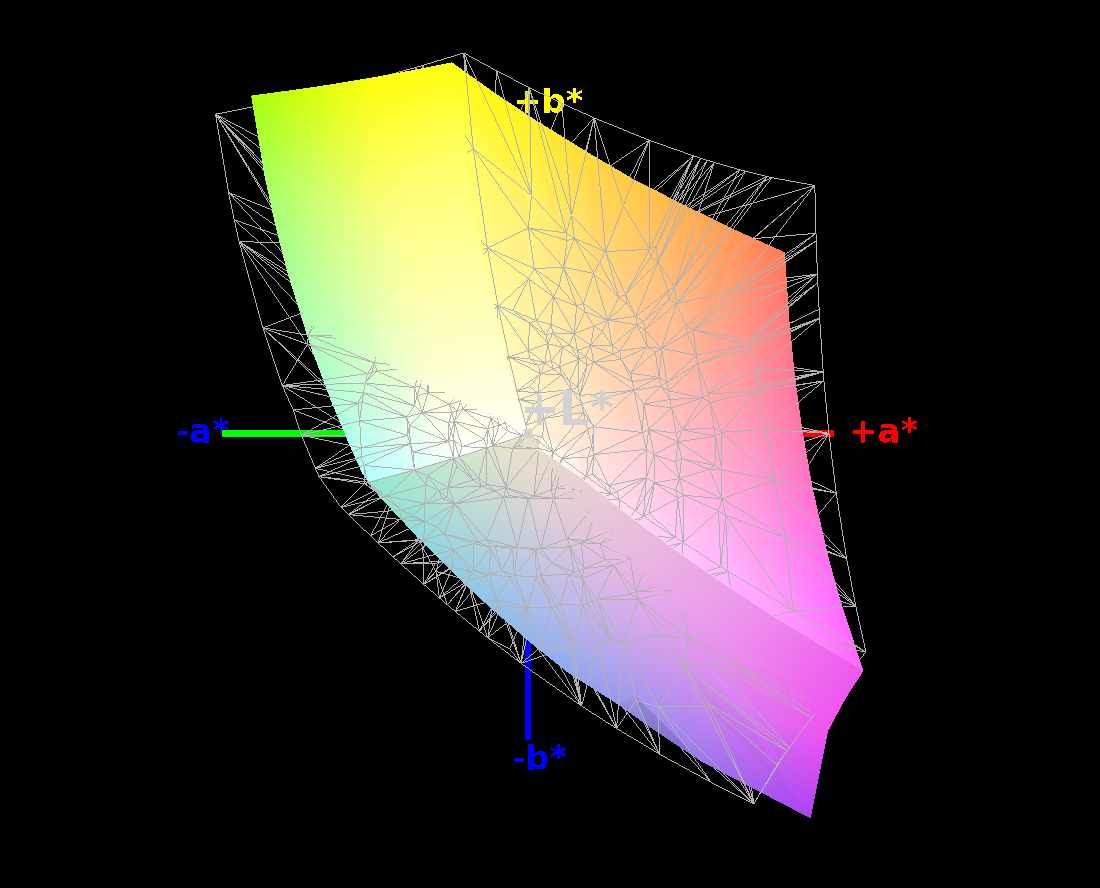
Acer does not offer an alternative to the display. Thus, every Switch Alpha 12 comes with a 12-inch model with 2160x1440 pixels. Unfortunately, we could not determine the panel ID this time. HWinfo only reported WST2216. Probably, it is the Panasonic VVX12T041N00 of the Core i5 sibling, but we cannot say for sure. Therefore, we repeated our display measurements and found several differences. In particular, the contrast is significantly lower now - 700:1 vs. 900:1. The DeltaE values in the following table are also different and the color space is smaller. For example, only 83% of sRGB is covered, while the coverage was 96% in the i5 model.
| |||||||||||||||||||||||||
Brightness Distribution: 87 %
Center on Battery: 391 cd/m²
Contrast: 698:1 (Black: 0.56 cd/m²)
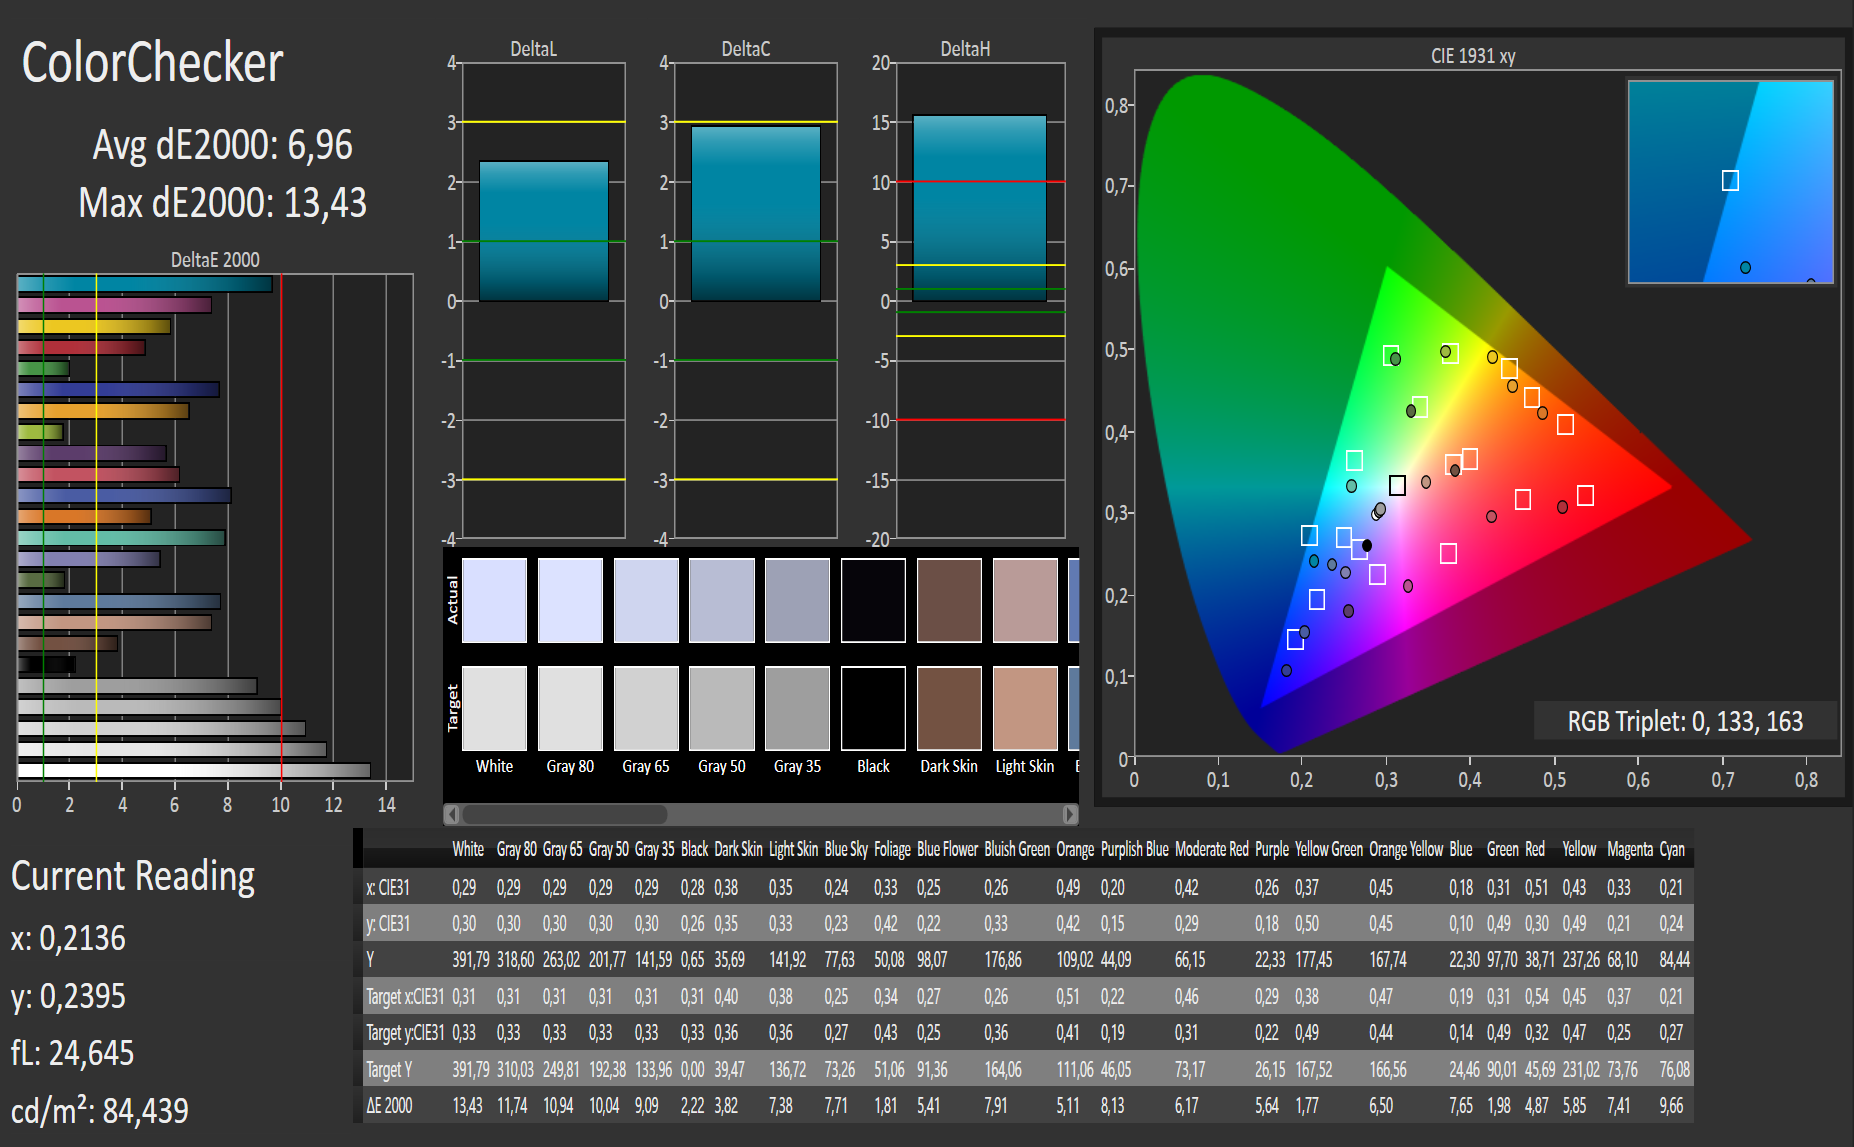
ΔE ColorChecker Calman: 6.96 | ∀{0.5-29.43 Ø4.71}
ΔE Greyscale Calman: 7.44 | ∀{0.09-98 Ø4.96}
83% sRGB (Argyll 1.6.3 3D)
53% AdobeRGB 1998 (Argyll 1.6.3 3D)
56.9% AdobeRGB 1998 (Argyll 3D)
82.7% sRGB (Argyll 3D)
55.7% Display P3 (Argyll 3D)
Gamma: 2.41
CCT: 8126 K
| Acer Aspire Switch Alpha 12 SA5-271-70EQ WST KL.1200W.002 WST2216, , 2160x1440, 12" | Acer Aspire Switch Alpha 12 SA5-271-56HM Panasonic VVX12T041N00, , 2160x1440, 12" | HP Spectre x2 12-a001ng LGD04A5, , 1920x1280, 12" | Lenovo IdeaPad Miix 700 Samsung L_QLLTN120QL01L01, , 2160x1440, 12" | Microsoft Surface Pro 4, Core m3 Samsung SDC3853, , 2736x1824, 12.3" | Huawei MateBook m5-6Y54 TMA 1200 Unknown Vendor, , 2160x1440, 12" | |
|---|---|---|---|---|---|---|
| Display | 17% | -9% | 21% | 20% | 17% | |
| Display P3 Coverage (%) | 55.7 | 65.5 18% | 52.9 -5% | 68.1 22% | 67.5 21% | 65.8 18% |
| sRGB Coverage (%) | 82.7 | 96.1 16% | 71.8 -13% | 97.4 18% | 96.6 17% | 96.2 16% |
| AdobeRGB 1998 Coverage (%) | 56.9 | 66.9 18% | 52.6 -8% | 70.2 23% | 69 21% | 66.8 17% |
| Response Times | -8% | -66% | 0% | -65% | 10% | |
| Response Time Grey 50% / Grey 80% * (ms) | 21 ? | 20 ? 5% | 51 ? -143% | 30 ? -43% | 46 ? -119% | 25 ? -19% |
| Response Time Black / White * (ms) | 28 ? | 34 ? -21% | 25 ? 11% | 16 ? 43% | 31 ? -11% | 17 ? 39% |
| PWM Frequency (Hz) | 50 ? | 1000 ? | 200 ? | 50 ? | ||
| Screen | 10% | 3% | 10% | 34% | 8% | |
| Brightness middle (cd/m²) | 391 | 345 -12% | 353 -10% | 341 -13% | 389.2 0% | 451 15% |
| Brightness (cd/m²) | 367 | 328 -11% | 347 -5% | 318 -13% | 392 7% | 425 16% |
| Brightness Distribution (%) | 87 | 91 5% | 91 5% | 87 0% | 92 6% | 80 -8% |
| Black Level * (cd/m²) | 0.56 | 0.38 32% | 0.44 21% | 0.36 36% | 0.27 52% | 0.37 34% |
| Contrast (:1) | 698 | 908 30% | 802 15% | 947 36% | 1441 106% | 1219 75% |
| Colorchecker dE 2000 * | 6.96 | 8.4 -21% | 6.09 12% | 6 14% | 3.61 48% | 11.04 -59% |
| Colorchecker dE 2000 max. * | 13.43 | 11.9 11% | 14.92 -11% | |||
| Greyscale dE 2000 * | 7.44 | 4.3 42% | 6.24 16% | 8.12 -9% | 3.8 49% | 10.45 -40% |
| Gamma | 2.41 91% | 2.63 84% | 2.41 91% | 2.23 99% | 2.16 102% | 2 110% |
| CCT | 8126 80% | 7368 88% | 7238 90% | 7011 93% | 5969 109% | 8849 73% |
| Color Space (Percent of AdobeRGB 1998) (%) | 53 | 62 17% | 46 -13% | 63.4 20% | 63 19% | 74 40% |
| Color Space (Percent of sRGB) (%) | 83 | 71 -14% | 97.4 17% | 97 17% | 100 20% | |
| Total Average (Program / Settings) | 6% /
9% | -24% /
-9% | 10% /
11% | -4% /
17% | 12% /
10% |
* ... smaller is better
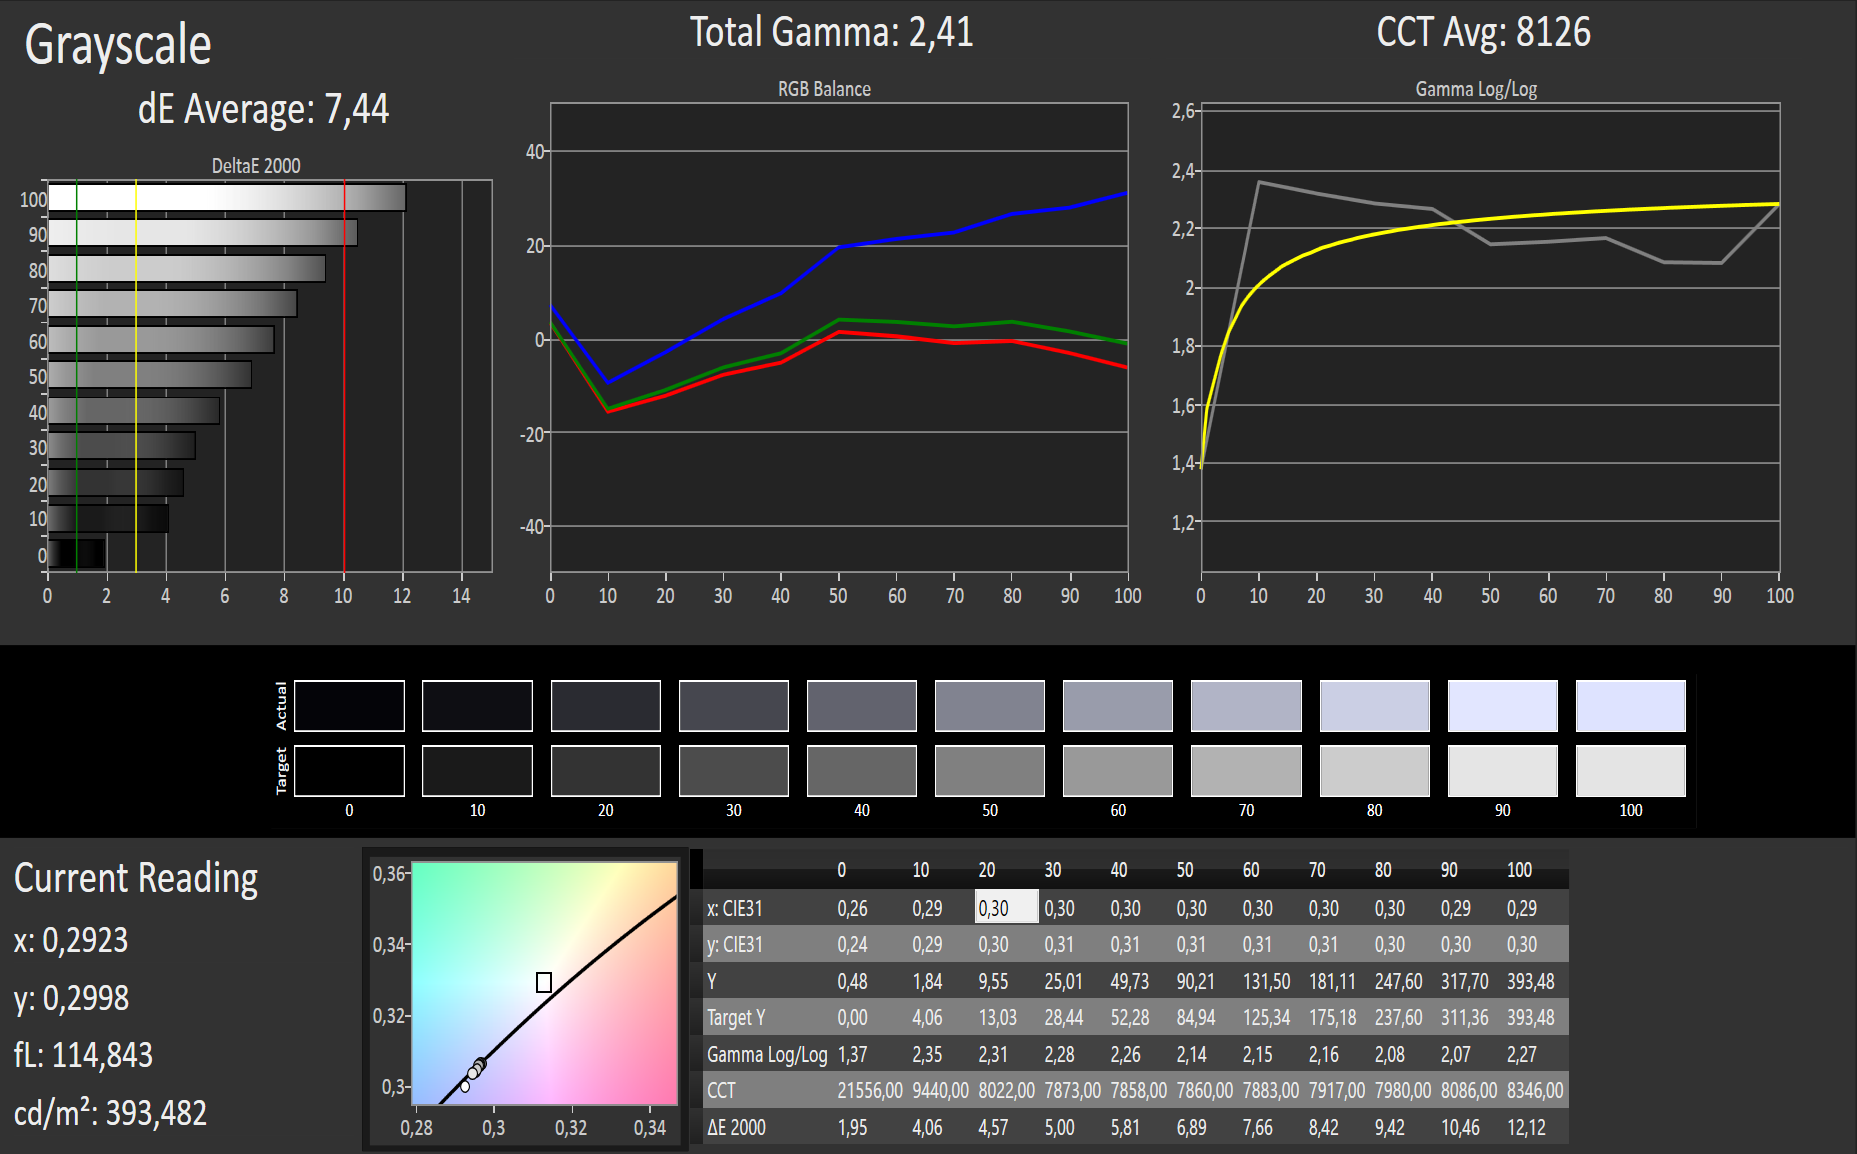
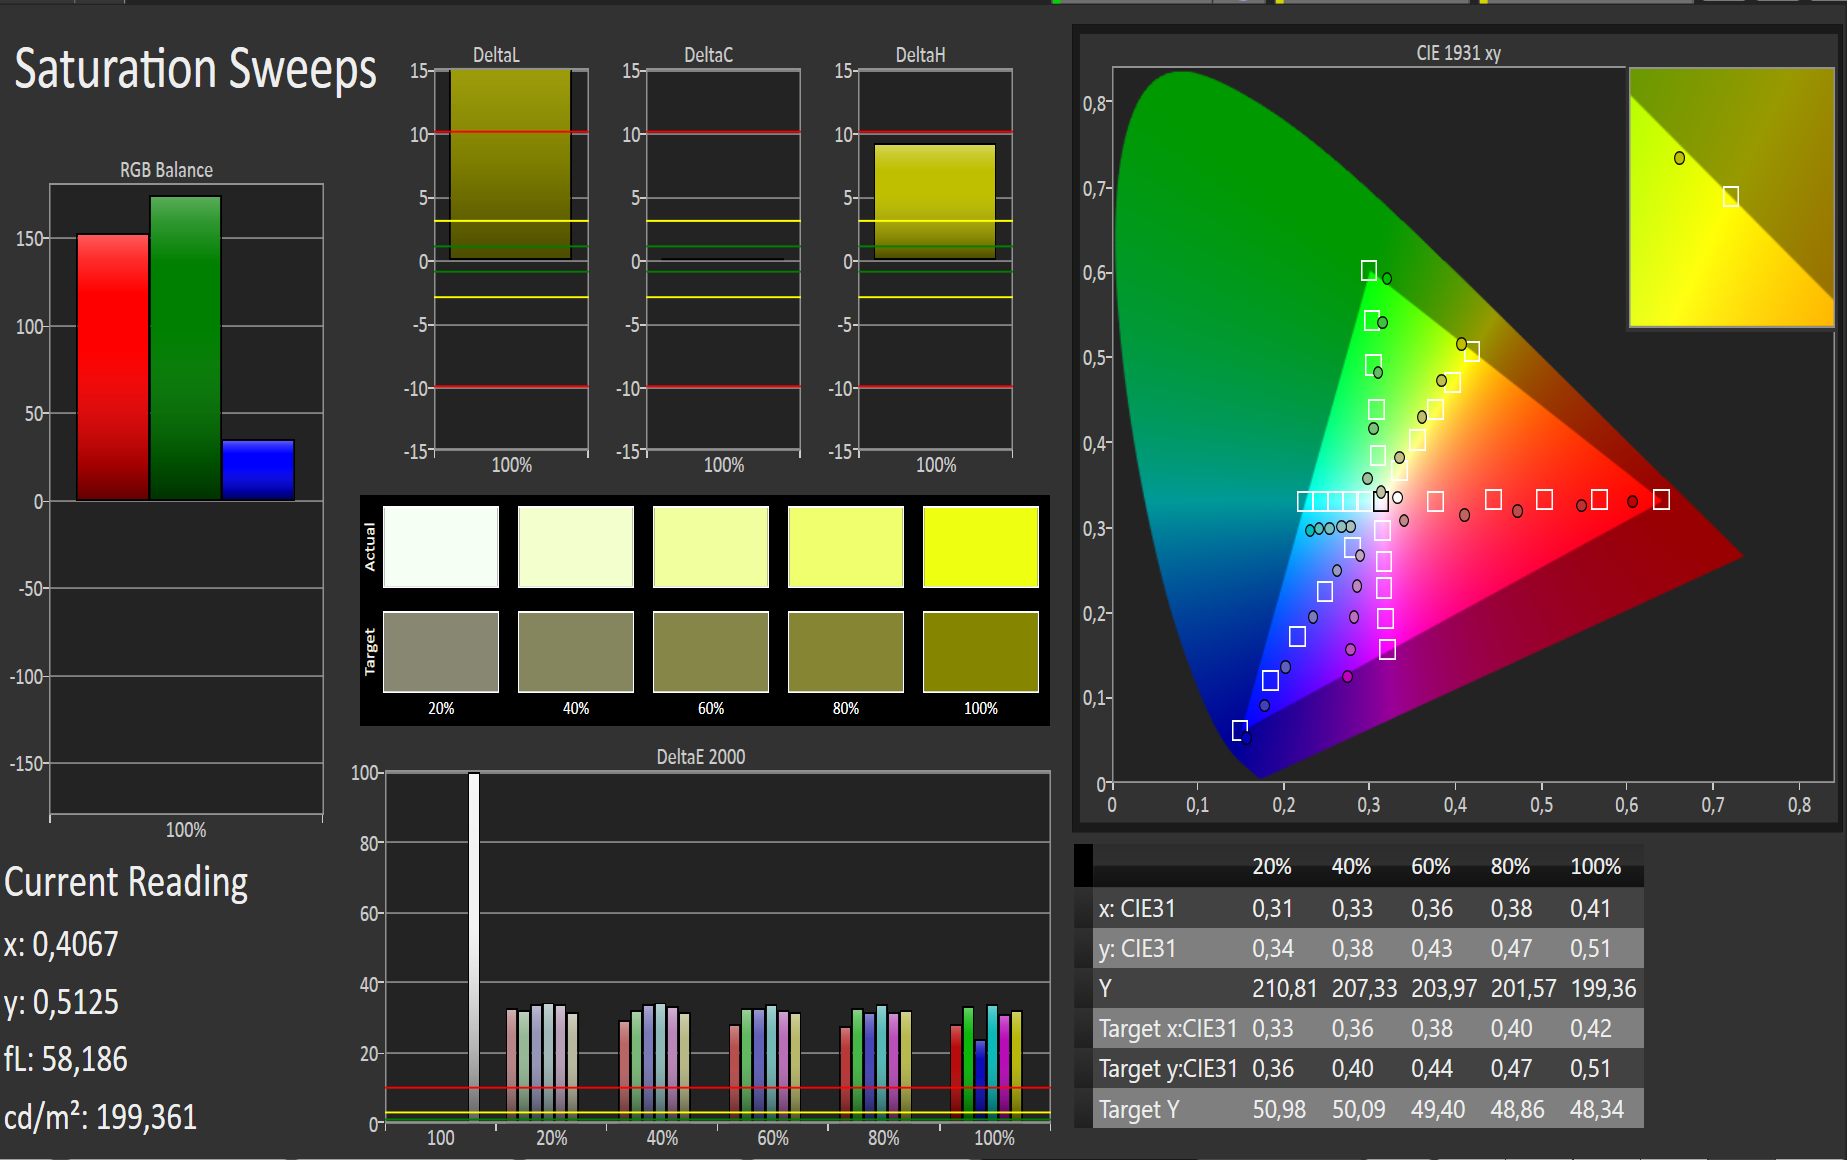
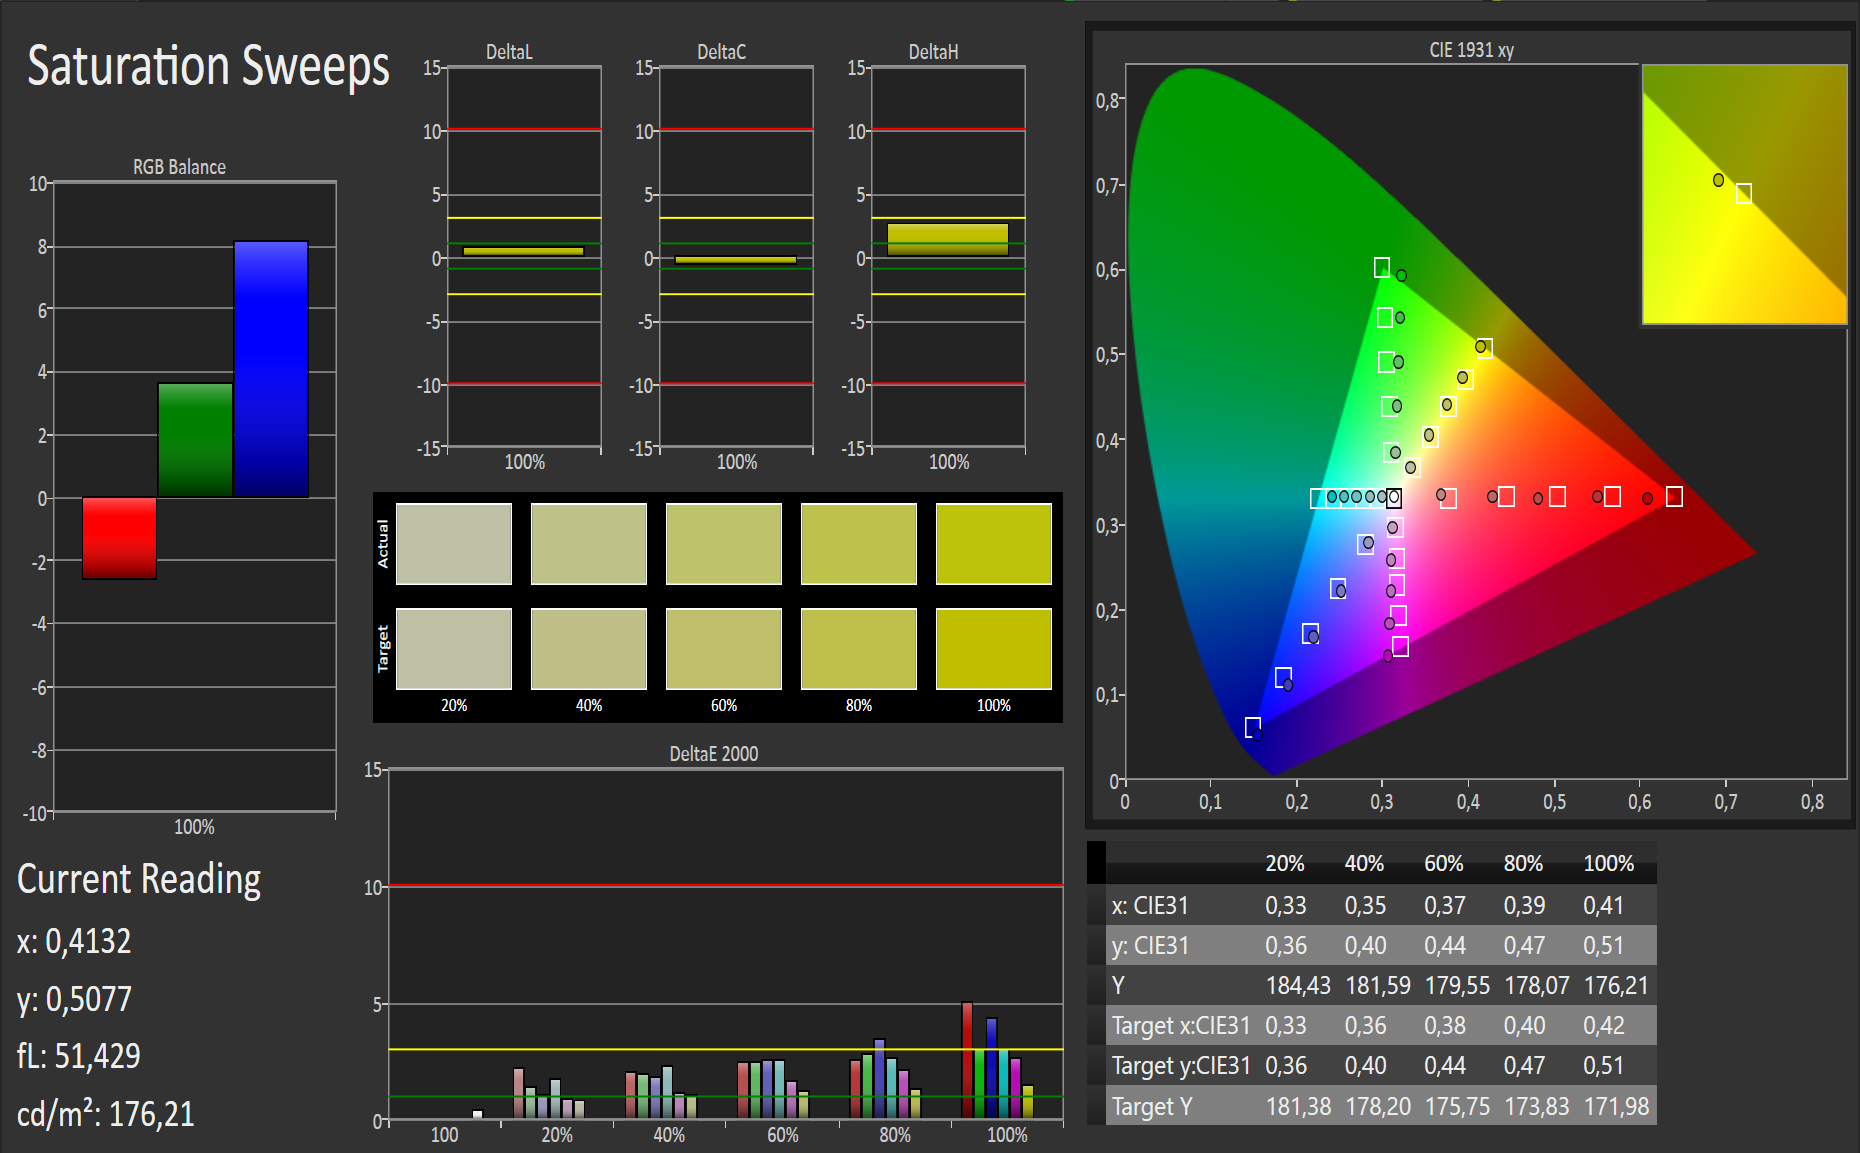
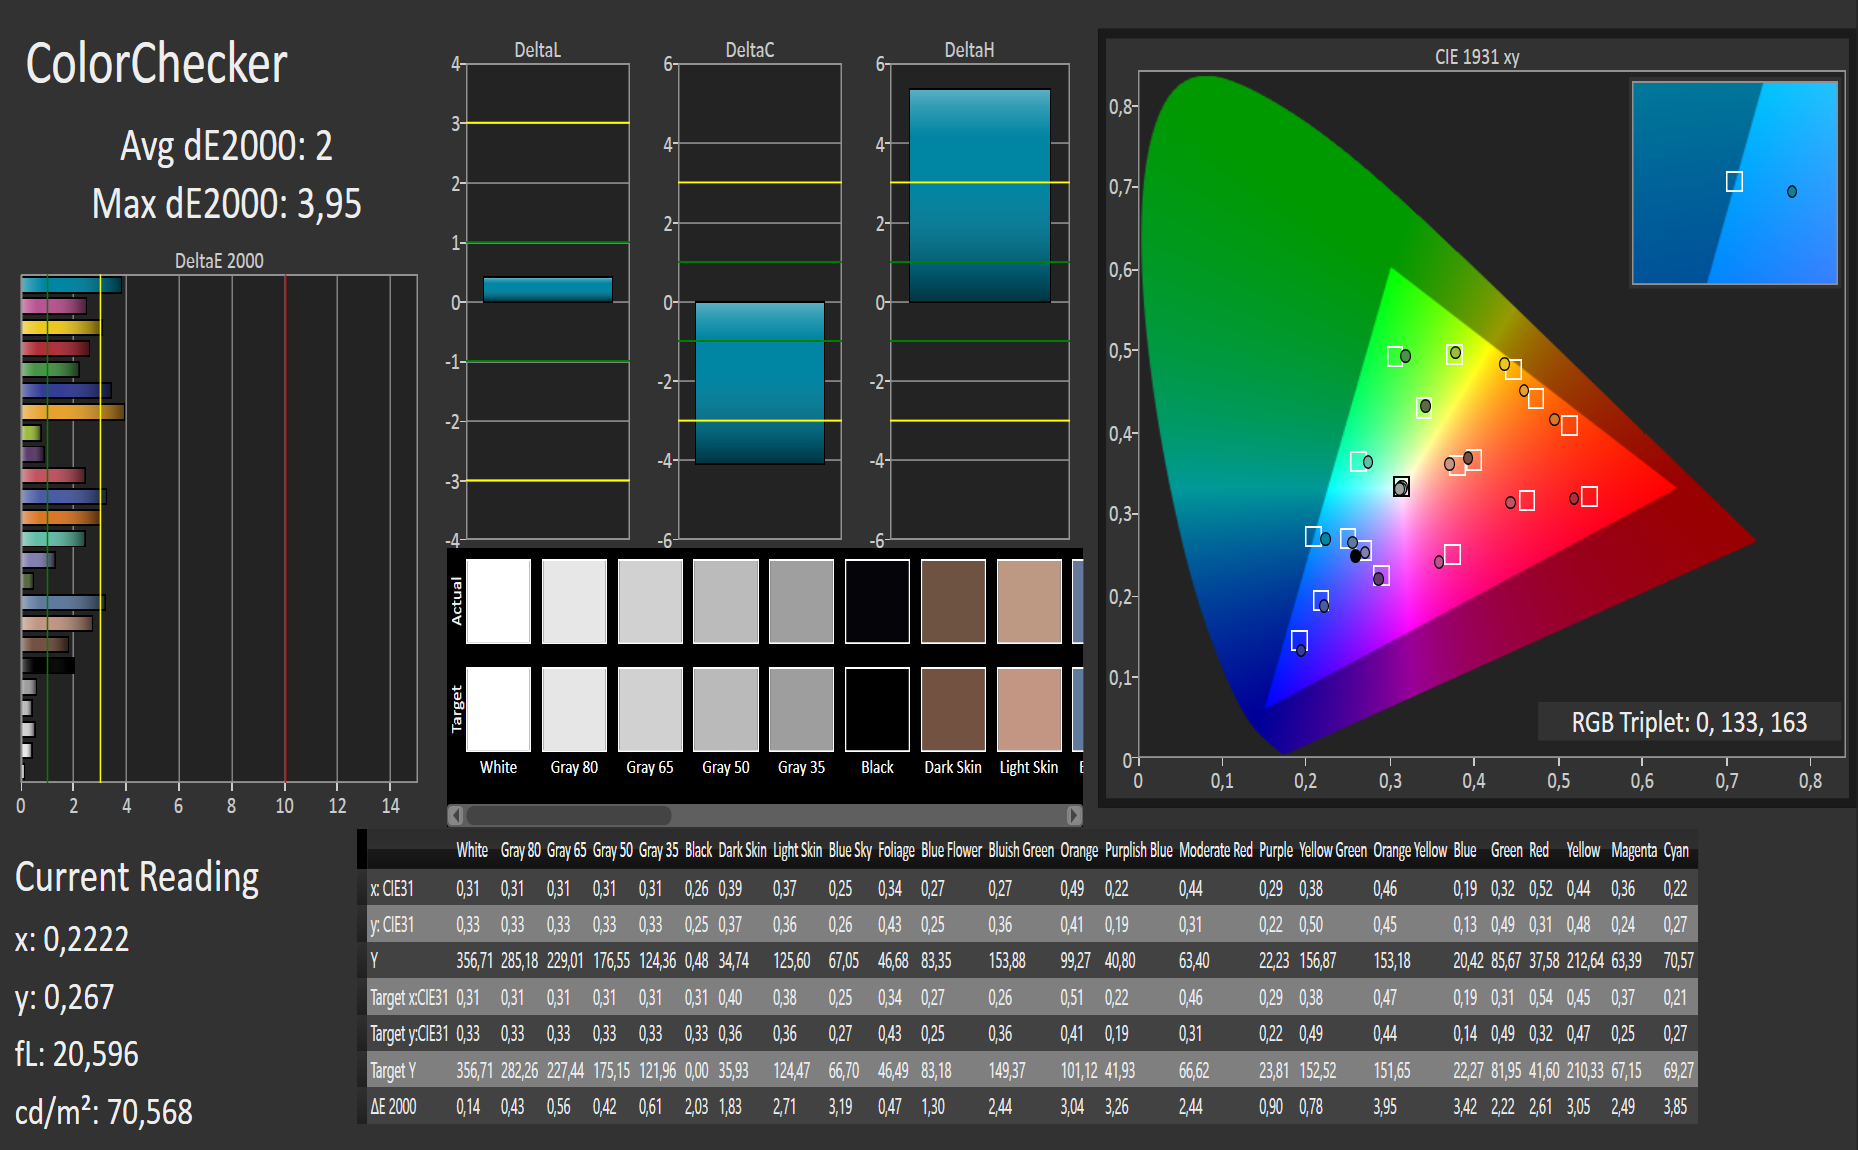
The CalMAN measurements show a significant blue tint, which is visible to the naked eye. This explains the high DeltaE in grayscale and colors. The blue tint was lower in the i5 model (smaller DeltaE). This can be seen in the first row of the CalMAN-screenshots.
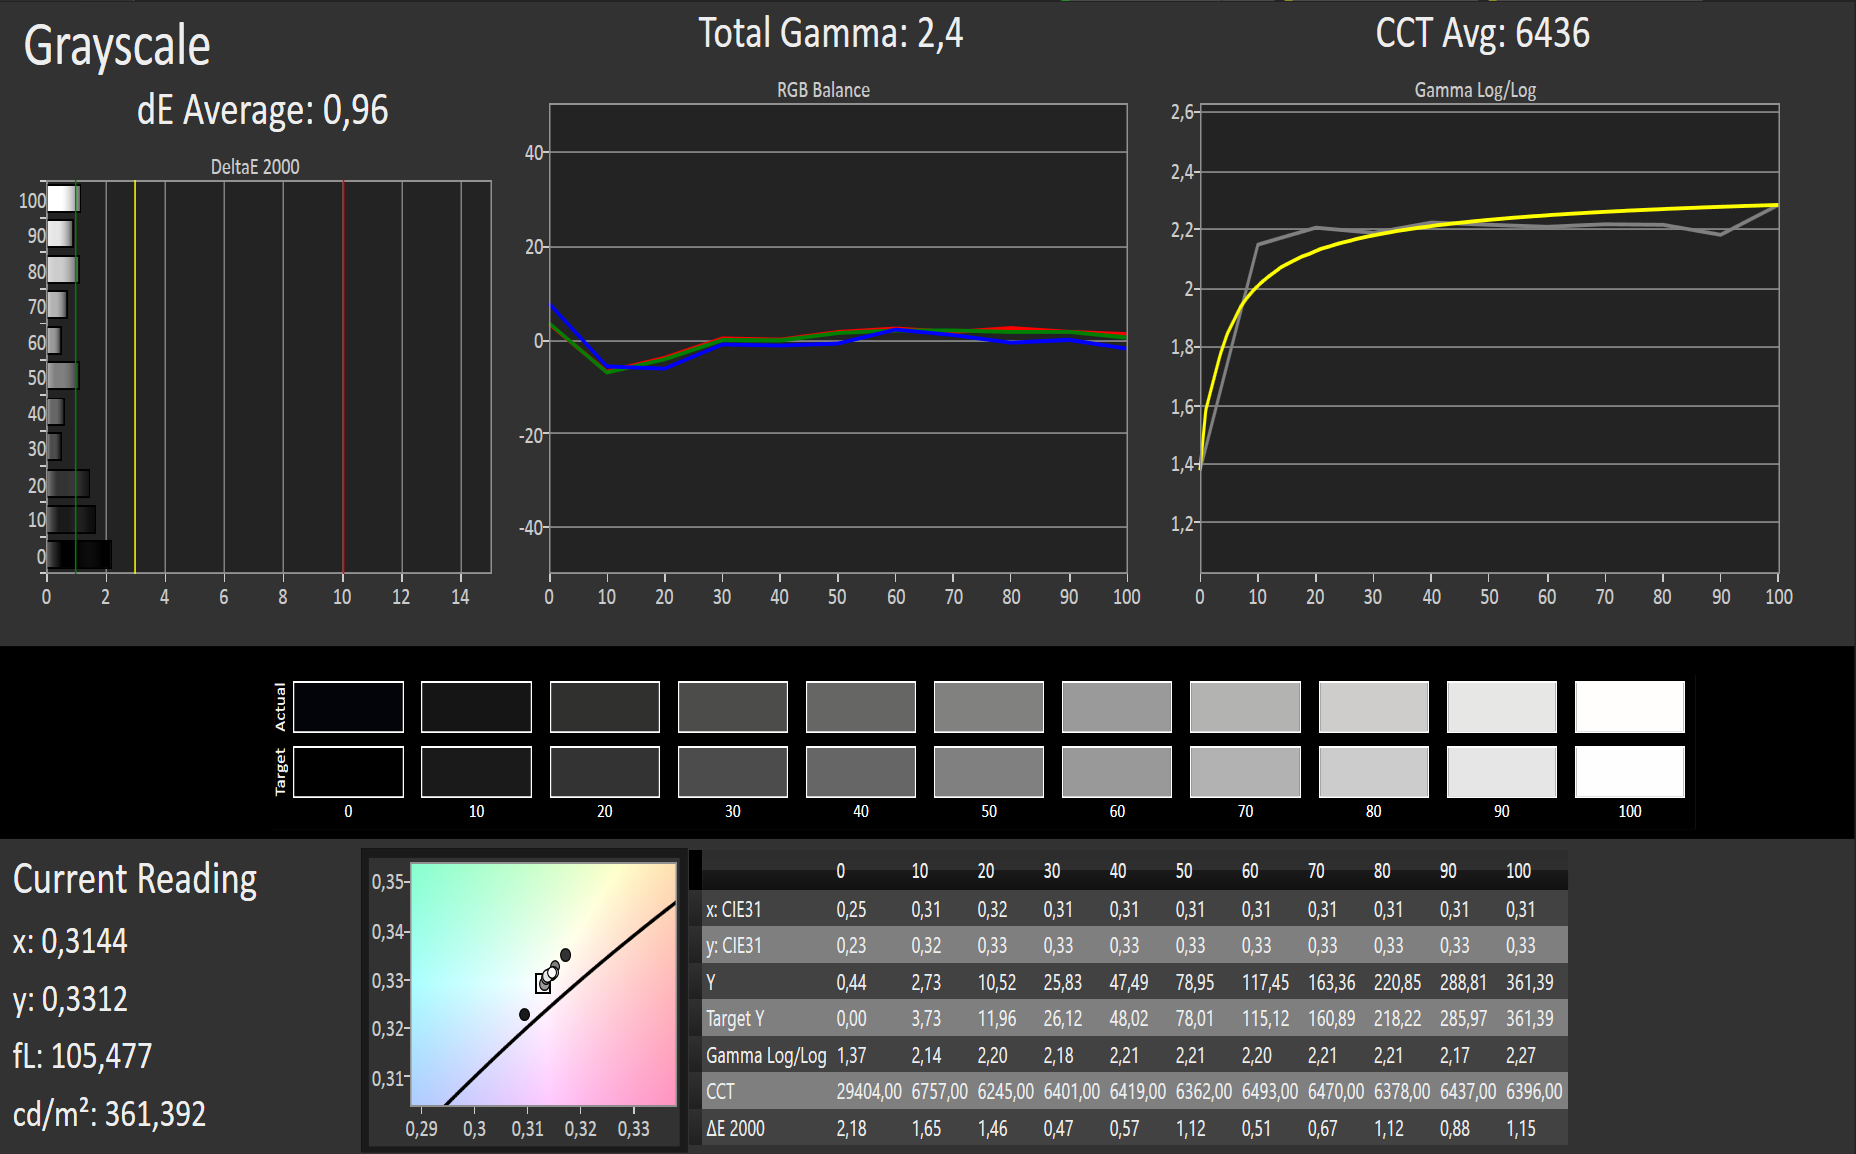
However, the display can perform better, as calibration (photospectrometer) decreases the DeltaE to 0.96 and 2 (gray/color). These are excellent values. Therefore we wonder why the manufacturer did not install a color profile, which protects all Alpha 12 models from a strong blue tint. Alpha 12 users can download the color profile from the box and benefit from a better display.
Display Response Times
| ↔ Response Time Black to White | ||
|---|---|---|
| 28 ms ... rise ↗ and fall ↘ combined | ↗ 5 ms rise | 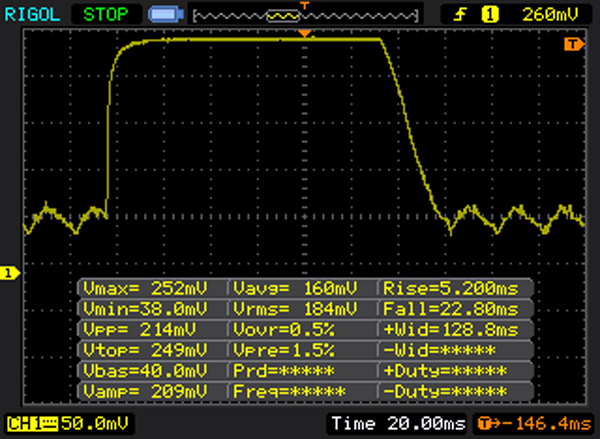 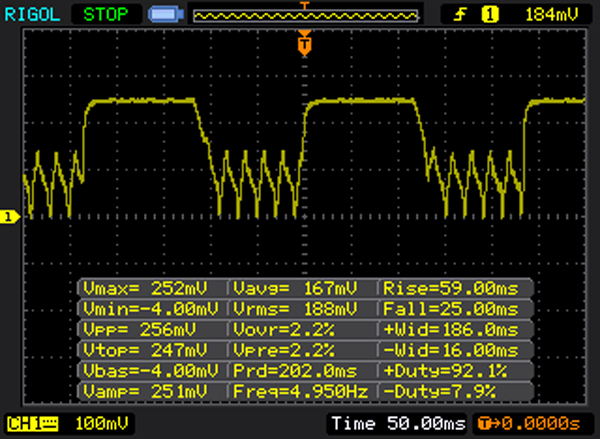 |
| ↘ 23 ms fall | ||
| The screen shows relatively slow response rates in our tests and may be too slow for gamers. In comparison, all tested devices range from 0.1 (minimum) to 240 (maximum) ms. » 71 % of all devices are better. This means that the measured response time is worse than the average of all tested devices (19.8 ms). | ||
| ↔ Response Time 50% Grey to 80% Grey | ||
| 21 ms ... rise ↗ and fall ↘ combined | ↗ 5 ms rise | 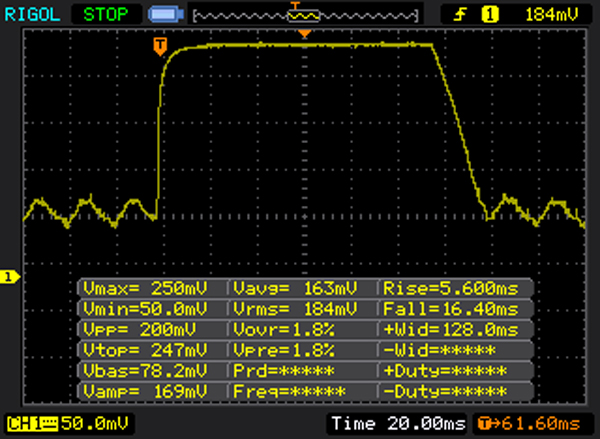 |
| ↘ 16 ms fall | ||
| The screen shows good response rates in our tests, but may be too slow for competitive gamers. In comparison, all tested devices range from 0.165 (minimum) to 636 (maximum) ms. » 33 % of all devices are better. This means that the measured response time is better than the average of all tested devices (31 ms). | ||
Screen Flickering / PWM (Pulse-Width Modulation)
| Screen flickering / PWM detected | 50 Hz | ≤ 10 % brightness setting | 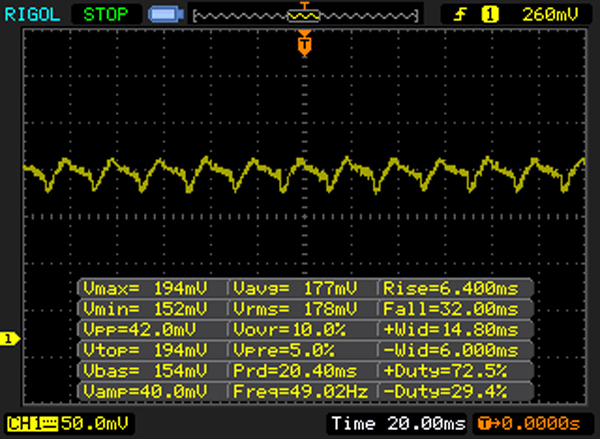 |
The display backlight flickers at 50 Hz (worst case, e.g., utilizing PWM) Flickering detected at a brightness setting of 10 % and below. There should be no flickering or PWM above this brightness setting. The frequency of 50 Hz is very low, so the flickering may cause eyestrain and headaches after extended use. In comparison: 52 % of all tested devices do not use PWM to dim the display. If PWM was detected, an average of 7754 (minimum: 5 - maximum: 343500) Hz was measured. | |||
Performance
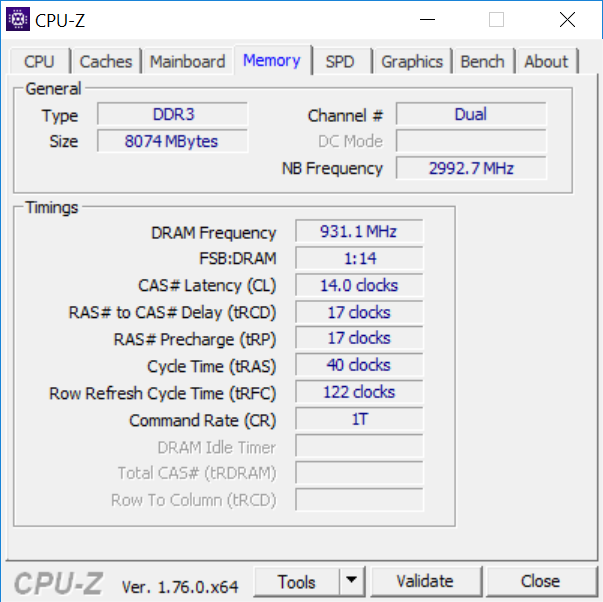
Acer offers two models with different performance in the Switch Alpha series. We have already reviewed the Core i5, 128 GB entry-level model (Aspire Switch Alpha 12 SA5-271-56HM). Now, we have the variant with i7, 512 GB under review. Both variants offer sufficient performance for everyday multimedia tasks. There are even performance reserves, as we will see. Both models of this series can be equipped with 8 or 4 GB RAM.
Processor
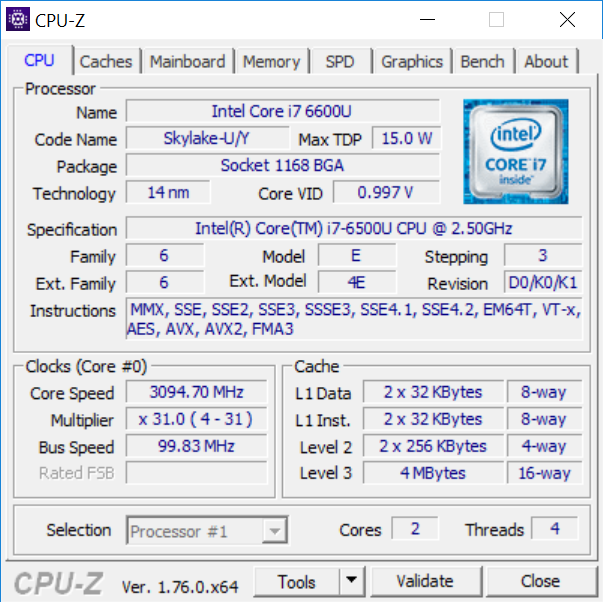
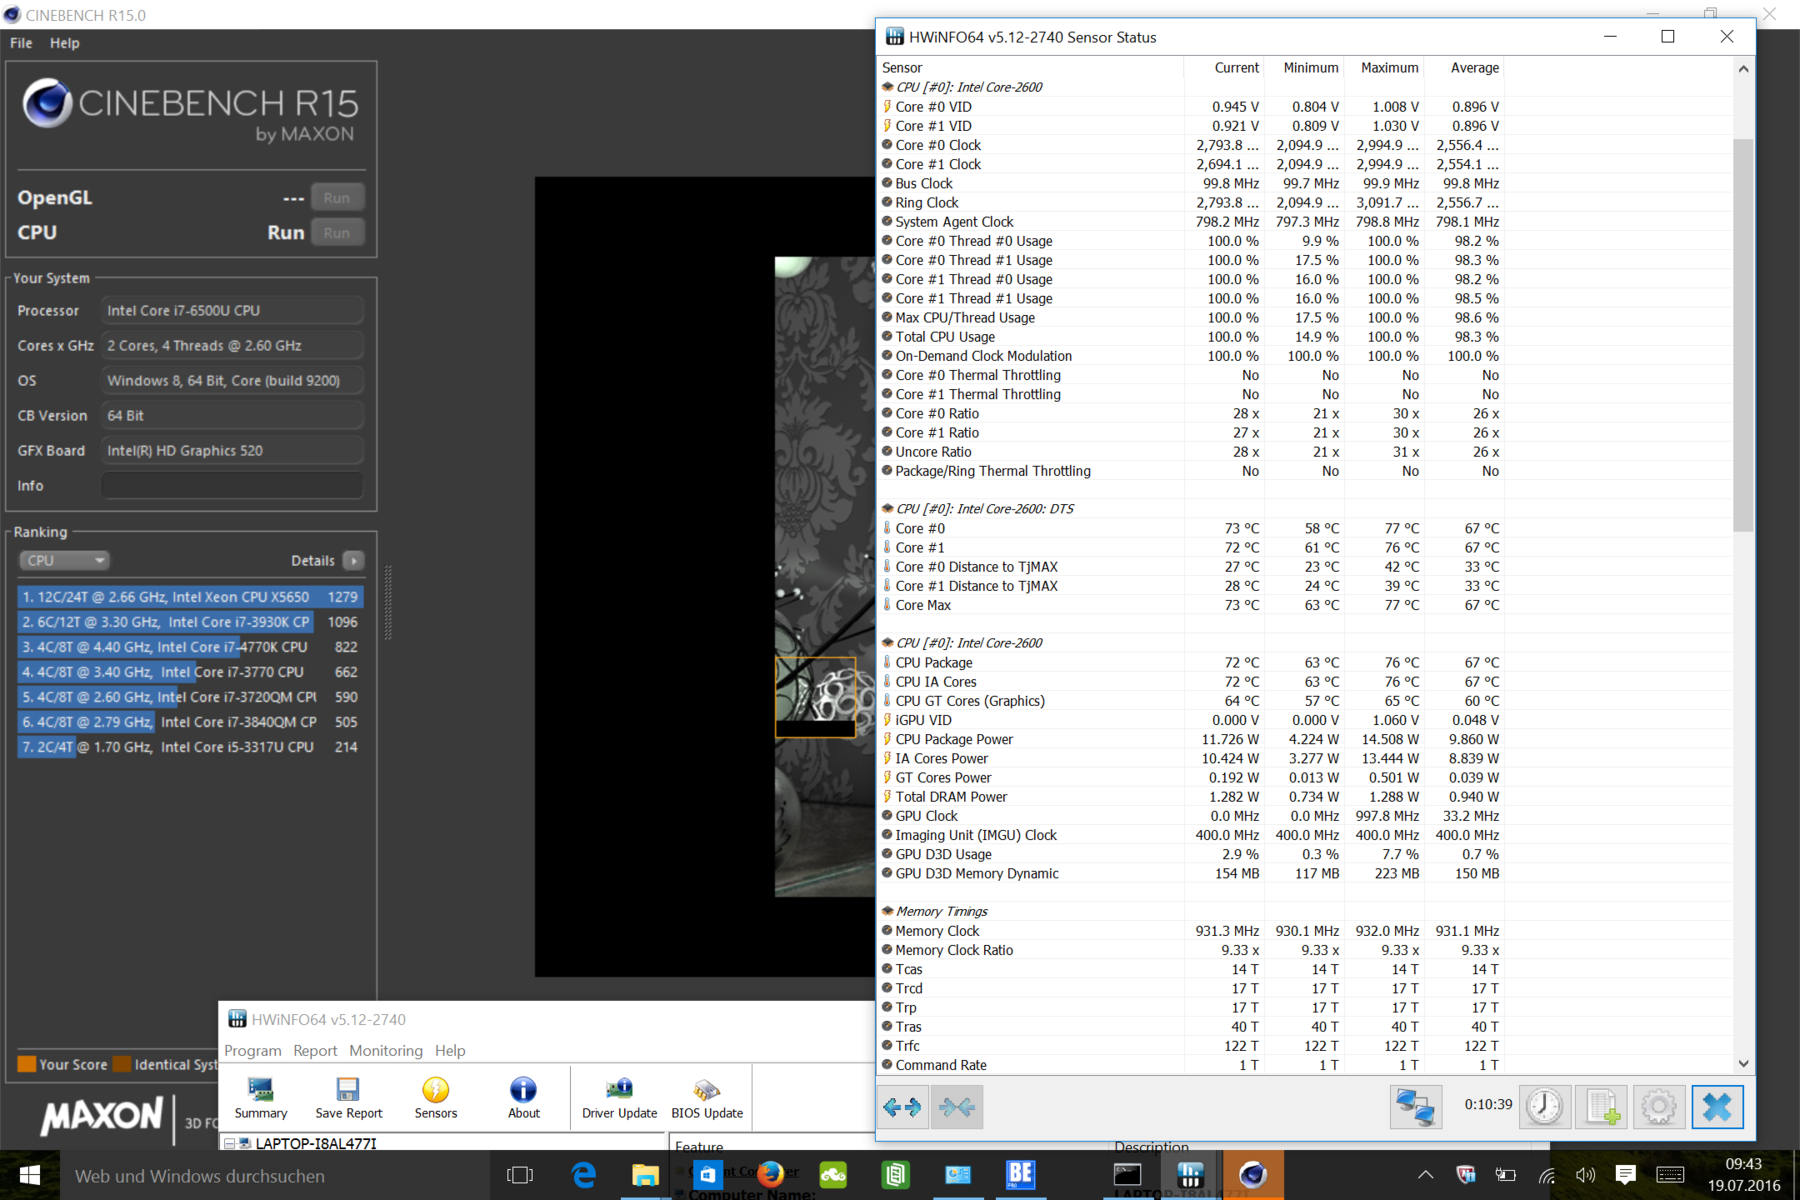
The Intel Core i7-6500U – more information in the datasheet – is a popular 15-Watt laptop processor. Approximately 70% of all Windows notebooks of this performance class use it. Until recently, only Microsoft has incorporated such an SoC in a tablet with fan (Surface Pro 4, i7/i5). Now, Acer does so too but decided to use liquid cooling instead of a fan. The Switch Alpha 12 doesn’t need a heavy radiator or pump. Instead, the liquid contained in a closed pipe very quickly moves the heat from hot parts to cooler parts. This works faster than with copper heatpipes.
As a result, the SoC can stand higher temperatures and keep up a high Turbo clock for a longer time. During a Cinebench R15 loop, the temperatures hover between 65 and 74 °C. By comparison, a fanless Huawei MateBook with Core m5 only allows a maximum temperature of 55 °C and the Turbo is limited to the base clock after a short time.
Consequently, the device clocks at 2.8 GHz during the R15 loop as we are used to from bigger laptops. As the maximum of this SoC is 3.0 GHz, the Alpha 12 performs quite well. By the way, the battery continues charging the battery during such load scenarios; however, it does not do so during the stress test (see emissions). The device behaves the same way on battery. At least, Cinebench R15 delivers the same multithread scores.
The R15 results bring up a surprise. Our i7-6500U variant is slower than the i5-6200U model (+13%) in the single-thread tests. This changes in the multithread test, but the i7 is only 5% faster.
System Performance
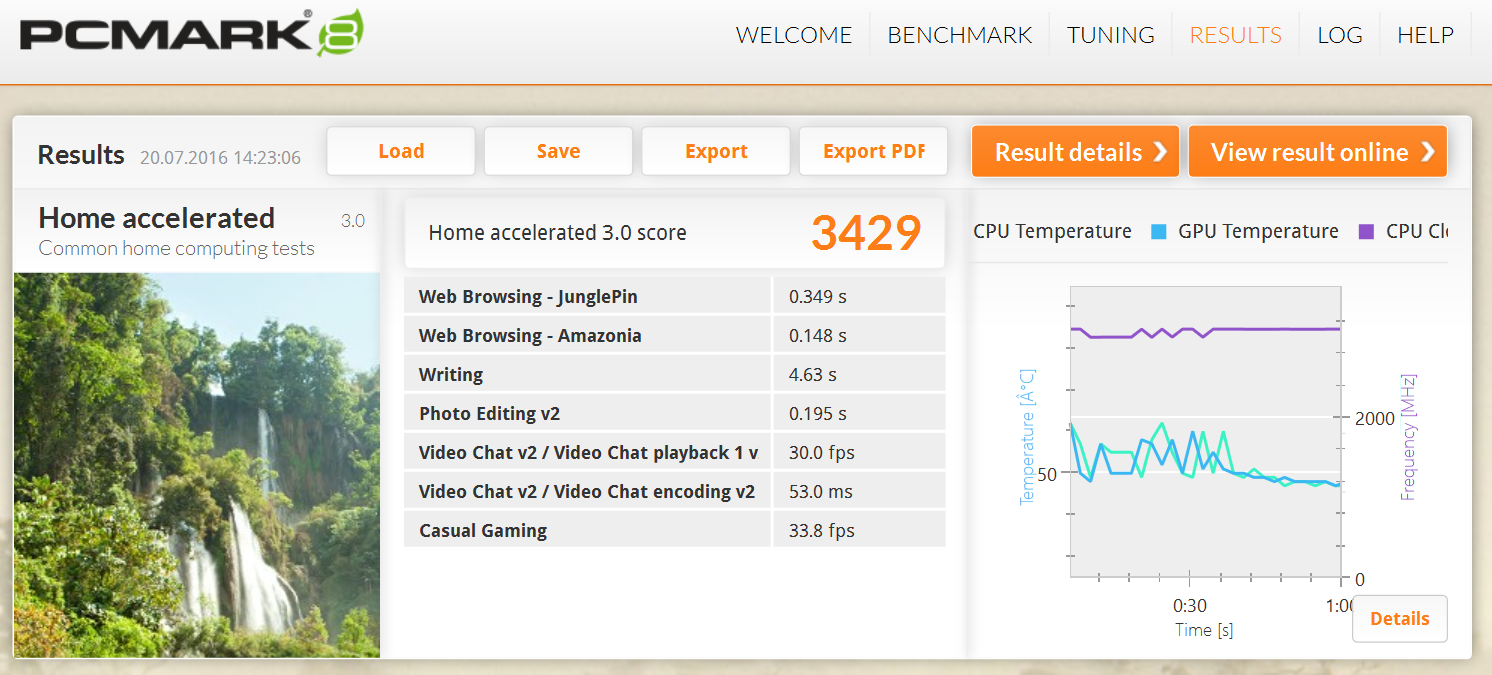
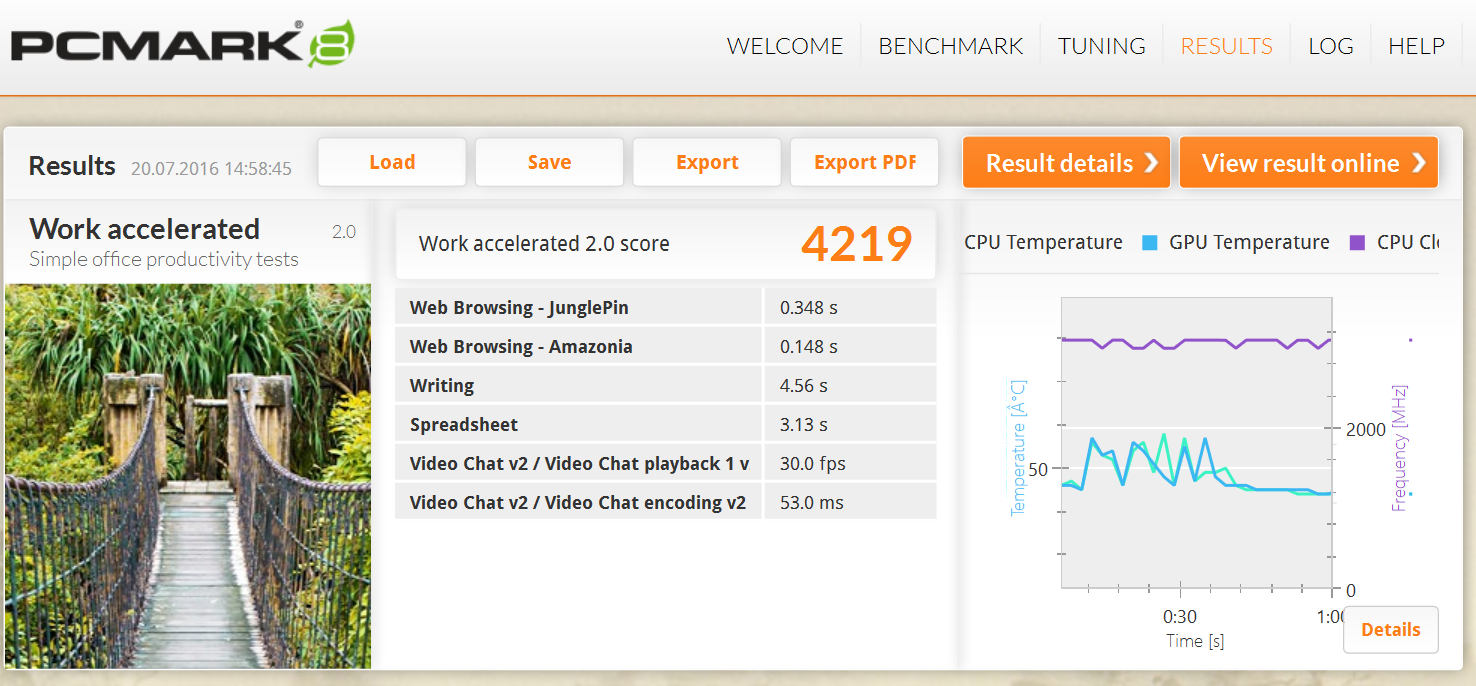
Apparently, the surcharge for an i7 does not pay off. What does PCMark say about this? The Aspire Switch Alpha 12 SA5-271-70EQ takes the lead, but the performance gain is only 5%. Certainly, this is not a significant difference and does not have an impact on a purchase decision. However, Acer only equips the i7 model with a 512 GB SSD. Those who want to have it must also take the i7 for better or worse.
The new Huawei MateBook m5-6Y57 (-36%) and also the Microsoft Surface Pro 4, Core i5 (-12%) fall behind by far. In general, the performance difference is about 10 to 30% between the Core m models and the two Switch Alpha 12 models. An exception is the work score of the HP Spectre x2 12, which it achieves despite a heavily throttling m7 SoC.
| PCMark 8 Home Score Accelerated v2 | 3429 points | |
| PCMark 8 Work Score Accelerated v2 | 4219 points | |
Help | ||
Storage Device
The Lite-On CV1 (M.2) outperforms all competitors, although the total differences of for example -14% compared to the Surface Pro 4 are negligible in the SSD range. However, differences of -30% (Spectre x2 12 with SanDisk X300) are interesting. Such performance differences might be noticeable in write or read intensive applications in practice. However, all the mentioned convertibles perform about the same during copying, opening of applications, or booting.
| Acer Aspire Switch Alpha 12 SA5-271-70EQ Lite-On CV1-8B512 M.2 512 GB | Acer Aspire Switch Alpha 12 SA5-271-56HM Kingston RBU-SNS8152S3256GG2 | HP Spectre x2 12-a001ng Liteon L8H-256V2G | Lenovo IdeaPad Miix 700 Samsung MZNLN128HCGR-000L2 | Microsoft Surface Pro 4, Core i5, 128GB Samsung MZFLV128 NVMe | Huawei MateBook m5-6Y54 SanDisk SD8SN8U256G1027 | |
|---|---|---|---|---|---|---|
| CrystalDiskMark 3.0 | -17% | -20% | -11% | -14% | -8% | |
| Read Seq (MB/s) | 496.6 | 518 4% | 517 4% | 497.9 0% | 666 34% | 512 3% |
| Write Seq (MB/s) | 415.3 | 199.9 -52% | 270.1 -35% | 153.5 -63% | 154.2 -63% | 462.1 11% |
| Read 512 (MB/s) | 335.9 | 374.9 12% | 369.2 10% | 401.2 19% | 266.3 -21% | 376 12% |
| Write 512 (MB/s) | 384 | 201 -48% | 264.6 -31% | 154.5 -60% | 154.2 -60% | 295.2 -23% |
| Read 4k (MB/s) | 32.38 | 29.3 -10% | 23.48 -27% | 36.2 12% | 28.51 -12% | 31.83 -2% |
| Write 4k (MB/s) | 81.8 | 76.8 -6% | 57.4 -30% | 95.5 17% | 101.5 24% | 64.5 -21% |
| Read 4k QD32 (MB/s) | 296.3 | 272 -8% | 223.4 -25% | 389.5 31% | 368.3 24% | 269.6 -9% |
| Write 4k QD32 (MB/s) | 260.3 | 197.1 -24% | 195.8 -25% | 154 -41% | 153.6 -41% | 178.2 -32% |

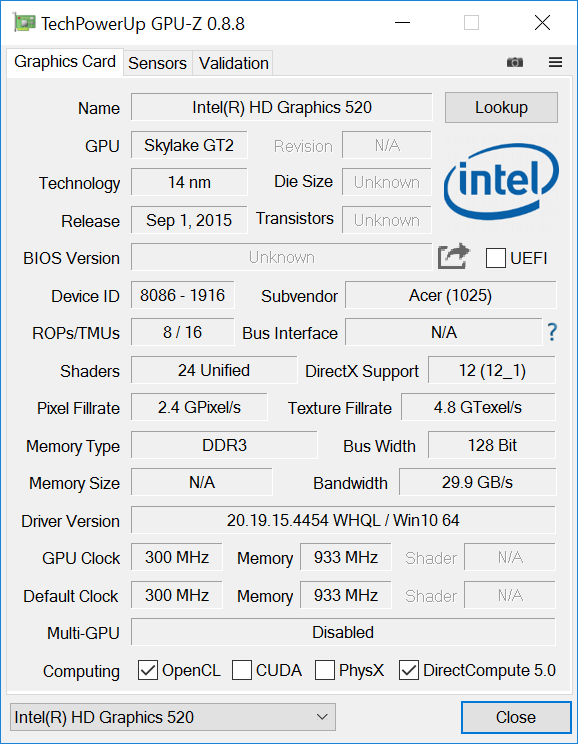
Graphics Card
The Intel HD Graphics 520 proves to be slightly better than its counterpart in the Core i5-6200U. The test model consistently takes the lead in 3DMark; however, the performance gain is only 4%. The bar diagrams show that the HD 520 in the Alpha 12 is the most powerful iGPU which is currently available in a tablet. The Core m (HD 515) cannot keep up with it and falls behind by 10% in the best case (Surface Pro 4 m3). This proves once again that Microsoft is on top of things in the realms of thermal emissions and boost. No other HD 515 can get that close to the HD 520.
| 3DMark 11 Performance | 1635 points | |
| 3DMark Cloud Gate Standard Score | 5771 points | |
| 3DMark Fire Strike Score | 826 points | |
Help | ||
Gaming Performance
While the Core M devices perform throughout poorly in gaming benchmarks, the HD 520 can run some games. Certainly, this is only possible with lowest presets as you can see in BioShock. The HD 515 only achieves playable frame rates in the Surface Pro 4 and the Lenovo IdeaPad Miix 700 (see BioShock Very Low Preset).
This is indeed quite a high gaming performance for a Windows tablet, since we discuss normal PC games and not undemanding browser games or games from the Windows Store here. Those who want higher gaming performance should consider the Surface Book with docking graphics card. However, not everyone will want to spend 2000 Euros (~$2197).
| Thief - 1024x768 Very Low Preset | |
| Acer Aspire Switch Alpha 12 SA5-271-70EQ | |
| Acer Aspire Switch Alpha 12 SA5-271-70EQ | |
| Huawei MateBook m5-6Y54 | |
| Rise of the Tomb Raider | |
| 1024x768 Lowest Preset | |
| Acer Aspire Switch Alpha 12 SA5-271-56HM | |
| Acer Aspire Switch Alpha 12 SA5-271-70EQ | |
| Huawei MateBook m5-6Y54 | |
| 1366x768 Medium Preset AF:2x | |
| Acer Aspire Switch Alpha 12 SA5-271-56HM | |
| Acer Aspire Switch Alpha 12 SA5-271-70EQ | |
| low | med. | high | ultra | |
|---|---|---|---|---|
| BioShock Infinite (2013) | 60.5 | 30 | ||
| Thief (2014) | 27.1 | 15 | ||
| Rise of the Tomb Raider (2016) | 15 | 9.1 |
Emissions
Temperature
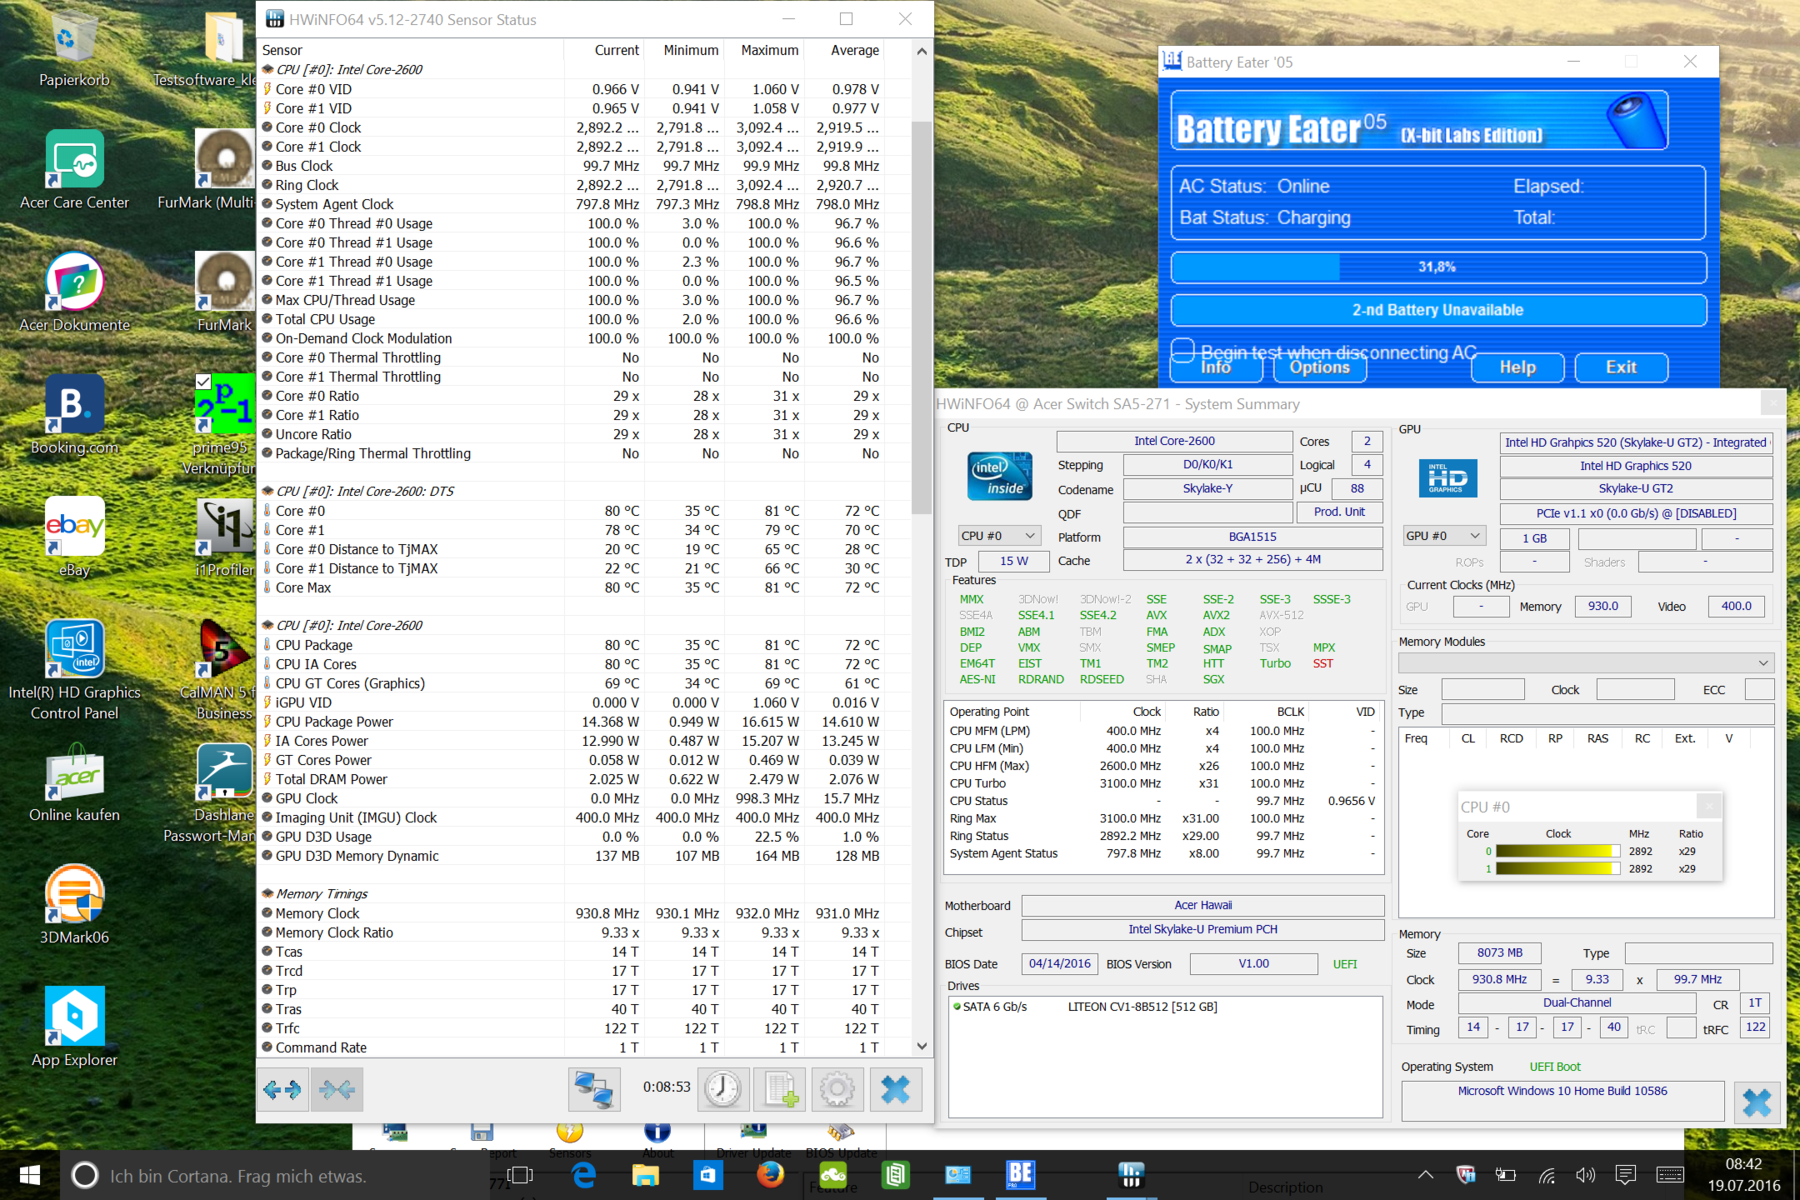
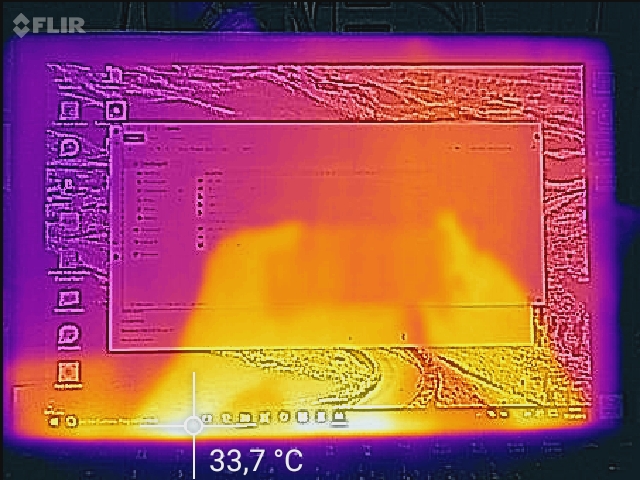
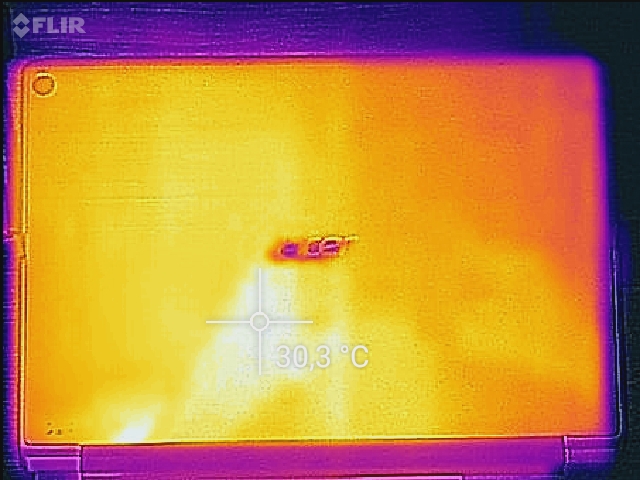
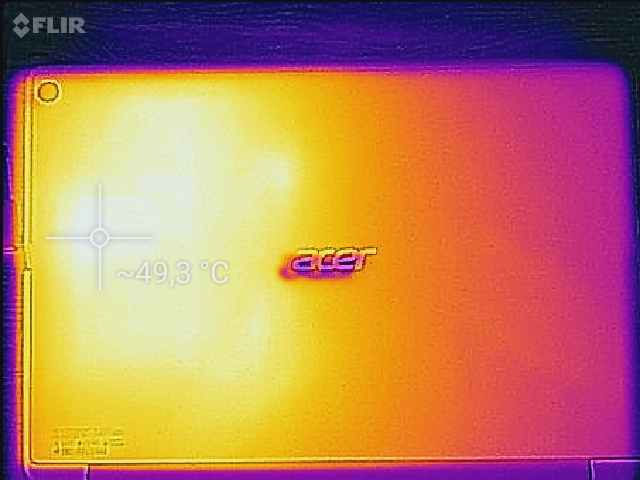
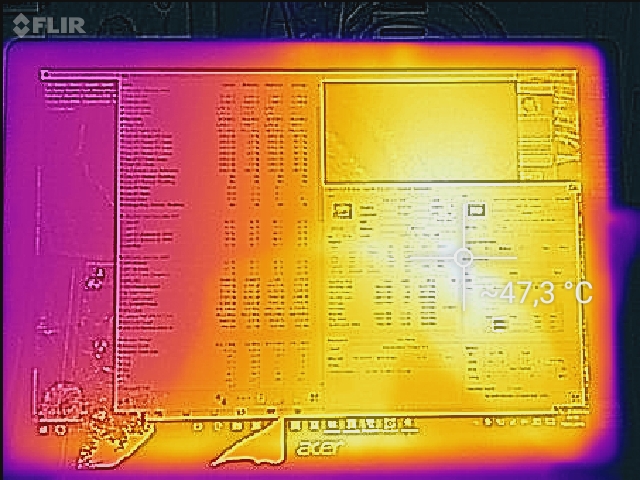
While idle, the Alpha 12 remains cooler as for example the Huawei MateBook with Core m (just under 30 °C). We measured an average of 27 °C on the underside and the top side. In the stress test and during permanent load, the average temperature increases to 44 °C. In some spots we measured 49 °C (see thermal images). In view of these high temperatures you will only want to use the device on the desktop without touching it with your hands. However, the stress test is an extreme scenario, which won't occur often in everyday use.
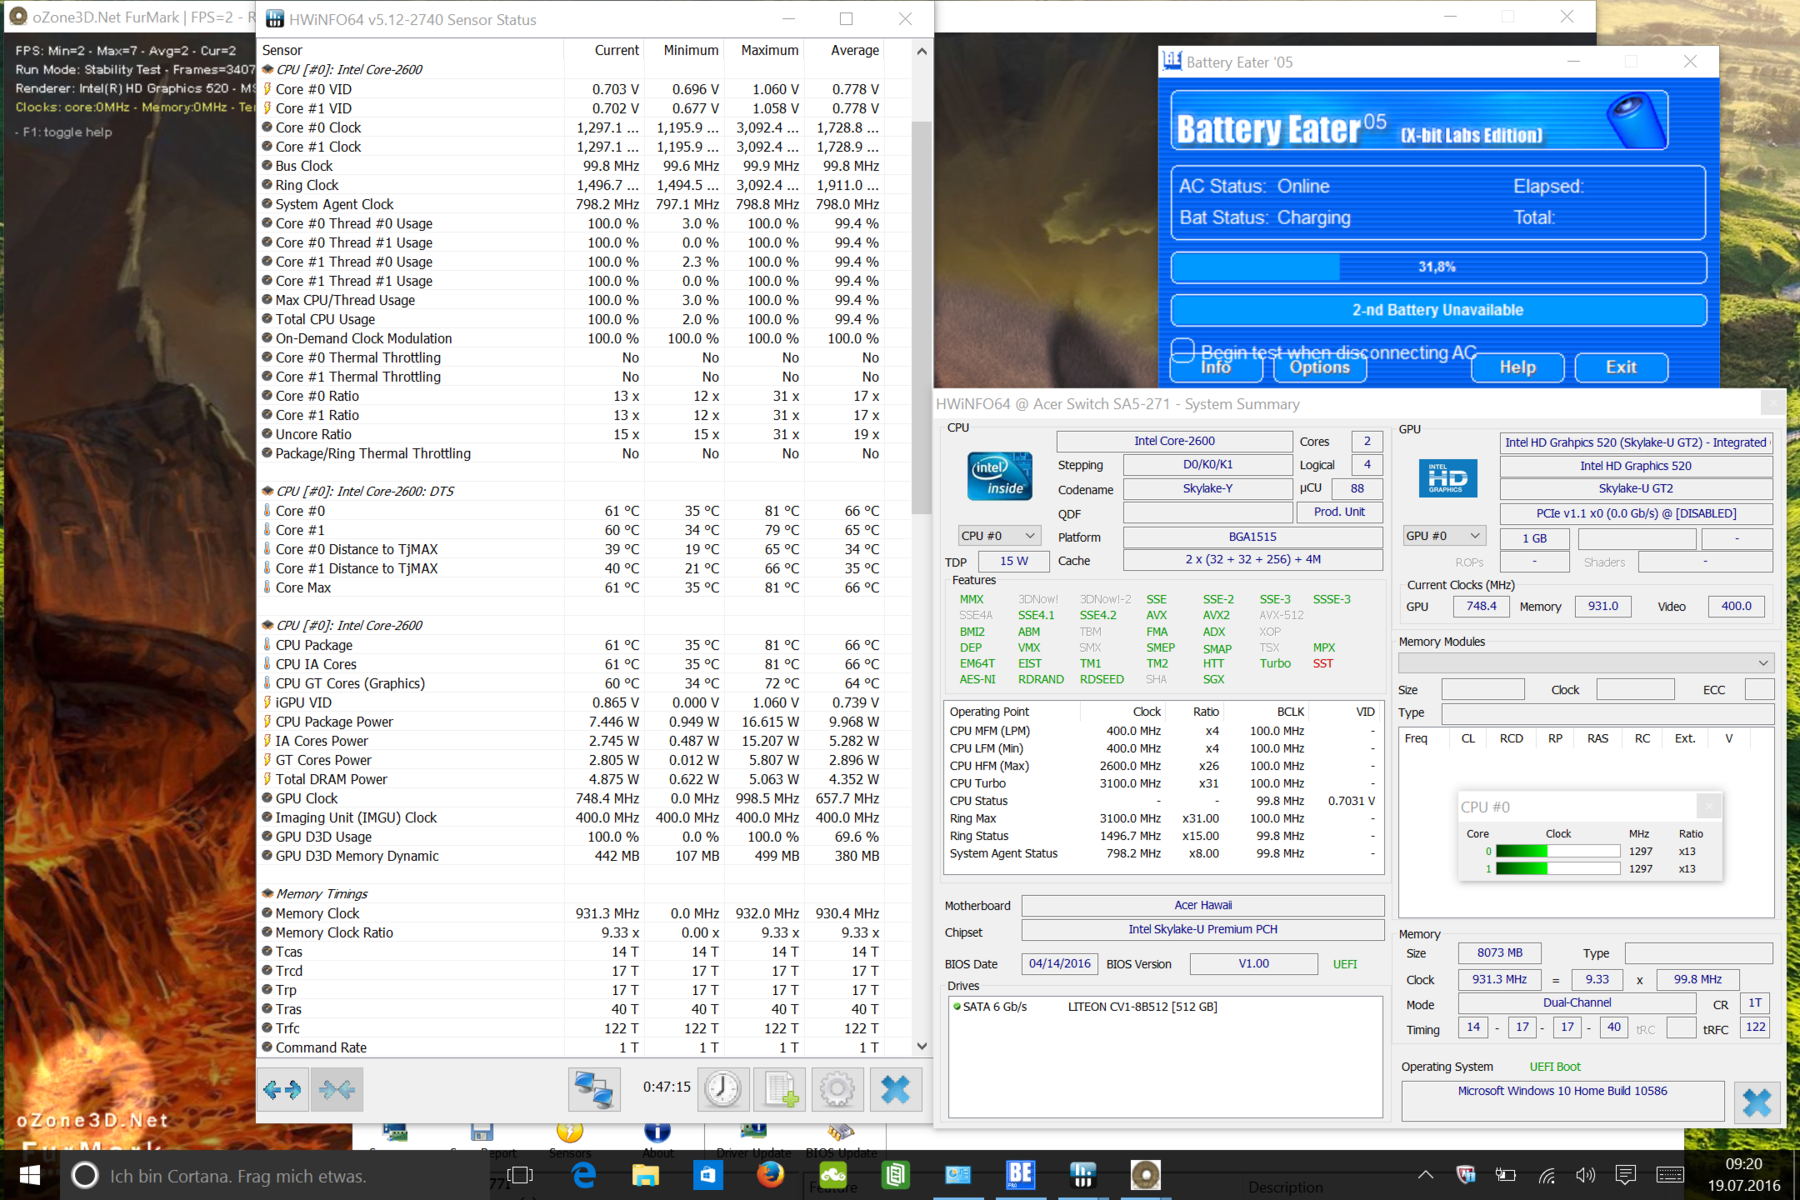
While the clock rates remain between 2.6 and 2.9 GHz during the Cinebench R15 loop and the Prime95 CPU stress test, the device throttles during the stress test. The SoC clocks at between 1.2 and 1.3 GHz here, since also the GPU consumes energy. The latter works at a slightly reduced clock rate of 748 MHz, while the boost usually reaches up to 1000 MHz. As soon as FurMark ends, the Switch Alpha 12 has its full performance available again. The CPU clock quickly increases to 2.9 GHz, when only Prime95 is running again.
A note regarding charging the battery: The power adapter (45 Watt) cannot deliver sufficient performance during the stress test. Thus, the charging process gets interrupted. However, the battery does not lose energy. This is only an issue during our stress test, while the battery continues charging during Prime 95 only and the R15 loop.
(-) The maximum temperature on the upper side is 45.5 °C / 114 F, compared to the average of 35.4 °C / 96 F, ranging from 19.6 to 60 °C for the class Convertible.
(-) The bottom heats up to a maximum of 47.8 °C / 118 F, compared to the average of 36.9 °C / 98 F
(+) In idle usage, the average temperature for the upper side is 26.8 °C / 80 F, compared to the device average of 30.3 °C / 87 F.
(-) The palmrests and touchpad can get very hot to the touch with a maximum of 43.8 °C / 110.8 F.
(-) The average temperature of the palmrest area of similar devices was 28 °C / 82.4 F (-15.8 °C / -28.4 F).
Speakers
Frequency diagram in comparison (Checkboxes at the top can be checked/unchecked!)
Value 1: Pink Noise 100% Vol.; Value 2: Audio off
Energy Management
Power Consumption
The low power consumption makes for a very long idle battery life of 10:44 hours. We measured 5.5 Watt at reduced brightness. We turned the one-level keyboard light off during our measurements. The Alpha 12 is more frugal than the Huawei MateBook when running idle with the most frugal settings with 7.4 Watt.
The power consumption is significantly higher than the i5 sibling's under load. This is not caused by different throttling behaviors during the stress test, since the i5 also reduces the clock rate to 1.1-1.2 GHz. (test model: 1.2-1.3 GHz). As expected, the Core i7, which performs better in multi-core tests, simply requires slightly more energy during basic load.
| Off / Standby | |
| Idle | |
| Load |
|
Key:
min: | |
| Acer Aspire Switch Alpha 12 SA5-271-70EQ 6500U, HD Graphics 520, Lite-On CV1-8B512 M.2 512 GB, IPS, 2160x1440, 12" | Acer Aspire Switch Alpha 12 SA5-271-56HM 6200U, HD Graphics 520, Kingston RBU-SNS8152S3256GG2, IPS, 2160x1440, 12" | HP Spectre x2 12-a001ng 6Y30, HD Graphics 515, Liteon L8H-256V2G, IPS, 1920x1280, 12" | Lenovo IdeaPad Miix 700 6Y54, HD Graphics 515, Samsung MZNLN128HCGR-000L2, IPS, 2160x1440, 12" | Microsoft Surface Pro 4, Core i5, 128GB 6300U, HD Graphics 520, Samsung MZFLV128 NVMe, IPS, 2736x1824, 12.3" | Huawei MateBook m5-6Y54 6Y54, HD Graphics 515, SanDisk SD8SN8U256G1027, IPS, 2160x1440, 12" | |
|---|---|---|---|---|---|---|
| Power Consumption | 6% | 20% | 22% | 26% | 10% | |
| Idle Minimum * (Watt) | 5.5 | 7.3 -33% | 6 -9% | 4 27% | 4.4 20% | 7.4 -35% |
| Idle Average * (Watt) | 9.8 | 10 -2% | 8 18% | 8.6 12% | 9 8% | 11.6 -18% |
| Idle Maximum * (Watt) | 11.9 | 10.15 15% | 10.6 11% | 9.3 22% | 10.7 10% | 11.6 3% |
| Load Average * (Watt) | 36.1 | 25.2 30% | 21.5 40% | 18.6 48% | 19.6 46% | 16.8 53% |
| Load Maximum * (Watt) | 36.7 | 29.3 20% | 22 40% | 36.3 1% | 19.9 46% | 19.1 48% |
* ... smaller is better
Battery Life
The battery runtime is worse than the i5 model's, albeit only in the Wi-Fi test, which is half-an-hour shorter. The load and idle runtimes are identical. The Core m models still lead by far, especially the Surface Pro 4, Core m3 (8 hours). The Huawei MateBook m5-6Y57 is an exception with just under 4:23 hours. While Acer might have revolutionized fanless cooling, it is far away from winning the crown in battery life.
| Acer Aspire Switch Alpha 12 SA5-271-70EQ 6500U, HD Graphics 520, 37 Wh | Acer Aspire Switch Alpha 12 SA5-271-56HM 6200U, HD Graphics 520, 37 Wh | HP Spectre x2 12-a001ng 6Y30, HD Graphics 515, 43 Wh | HP Spectre x2 12-a003ng K3D42EA 6Y75, HD Graphics 515, 42 Wh | Lenovo IdeaPad Miix 700 6Y54, HD Graphics 515, 41 Wh | Microsoft Surface Pro 4, Core m3 6Y30, HD Graphics 515, 38 Wh | Microsoft Surface Pro 4, Core i5, 128GB 6300U, HD Graphics 520, 38 Wh | Huawei MateBook m5-6Y54 6Y54, HD Graphics 515, 33 Wh | |
|---|---|---|---|---|---|---|---|---|
| Battery runtime | 3% | 24% | 39% | 40% | 36% | 28% | -13% | |
| Reader / Idle (h) | 10.7 | 10.7 0% | 11.4 7% | 15.9 49% | 14.4 35% | 13.2 23% | 15 40% | 8 -25% |
| WiFi v1.3 (h) | 4.9 | 5.4 10% | 6.1 24% | 6 22% | 7.3 49% | 8.1 65% | 7.1 45% | 4.4 -10% |
| Load (h) | 1.9 | 1.9 0% | 2.7 42% | 2.8 47% | 2.6 37% | 2.3 21% | 1.9 0% | 1.8 -5% |
| H.264 (h) | 7.8 | 7.5 |
Pros
Cons
Verdict
What makes the premium model of the Switch Alpha 12 SA5-271-70EQ attractive? 1300 Euros (~$1429) is not a bargain. It is not the performance of the Core i7, since system performance, CPU performance and gaming performance are only marginally better than the i5 variant's. According to our measurements, the display is even worse. However, the IPS panel can be excellently calibrated and is even brighter than in the first model. It is not the battery life, either, since the Wi-Fi runtime decreased by half-an-hour to 4:51 h. Those who are looking for a battery life of a workday, should buy another convertible.
What remains are the big 512 GB SSD, 8 GB RAM and a backlit keyboard. Prospective buyers have to decide themselves whether these are worth a surcharge of 500 Euros (~$549). The 128 GB model with i5 is already available for under 800 Euros (~$878). We still recommend the Switch Alpha 12, but the Core i5 model is absolutely sufficient and is available as a bundle with stylus and 256 GB for about 1000 Euros (~$1098).
Those looking for a long battery life and a super-silent operation, won't get around Microsoft's Surface Pro 4, Core m3. About 25% lower system performance than our test model is an acceptable disadvantage in view of the significantly longer battery life.
Acer Aspire Switch Alpha 12 SA5-271-70EQ
- 08/22/2016 v5.1 (old)
Sebastian Jentsch
Price comparison
