 Deutsch
 English
 Español
 Français
 Italiano
 Nederlands
 Polski
 Português
 Русский
 Türkçe
 Svenska
 Chinese
 Magyar
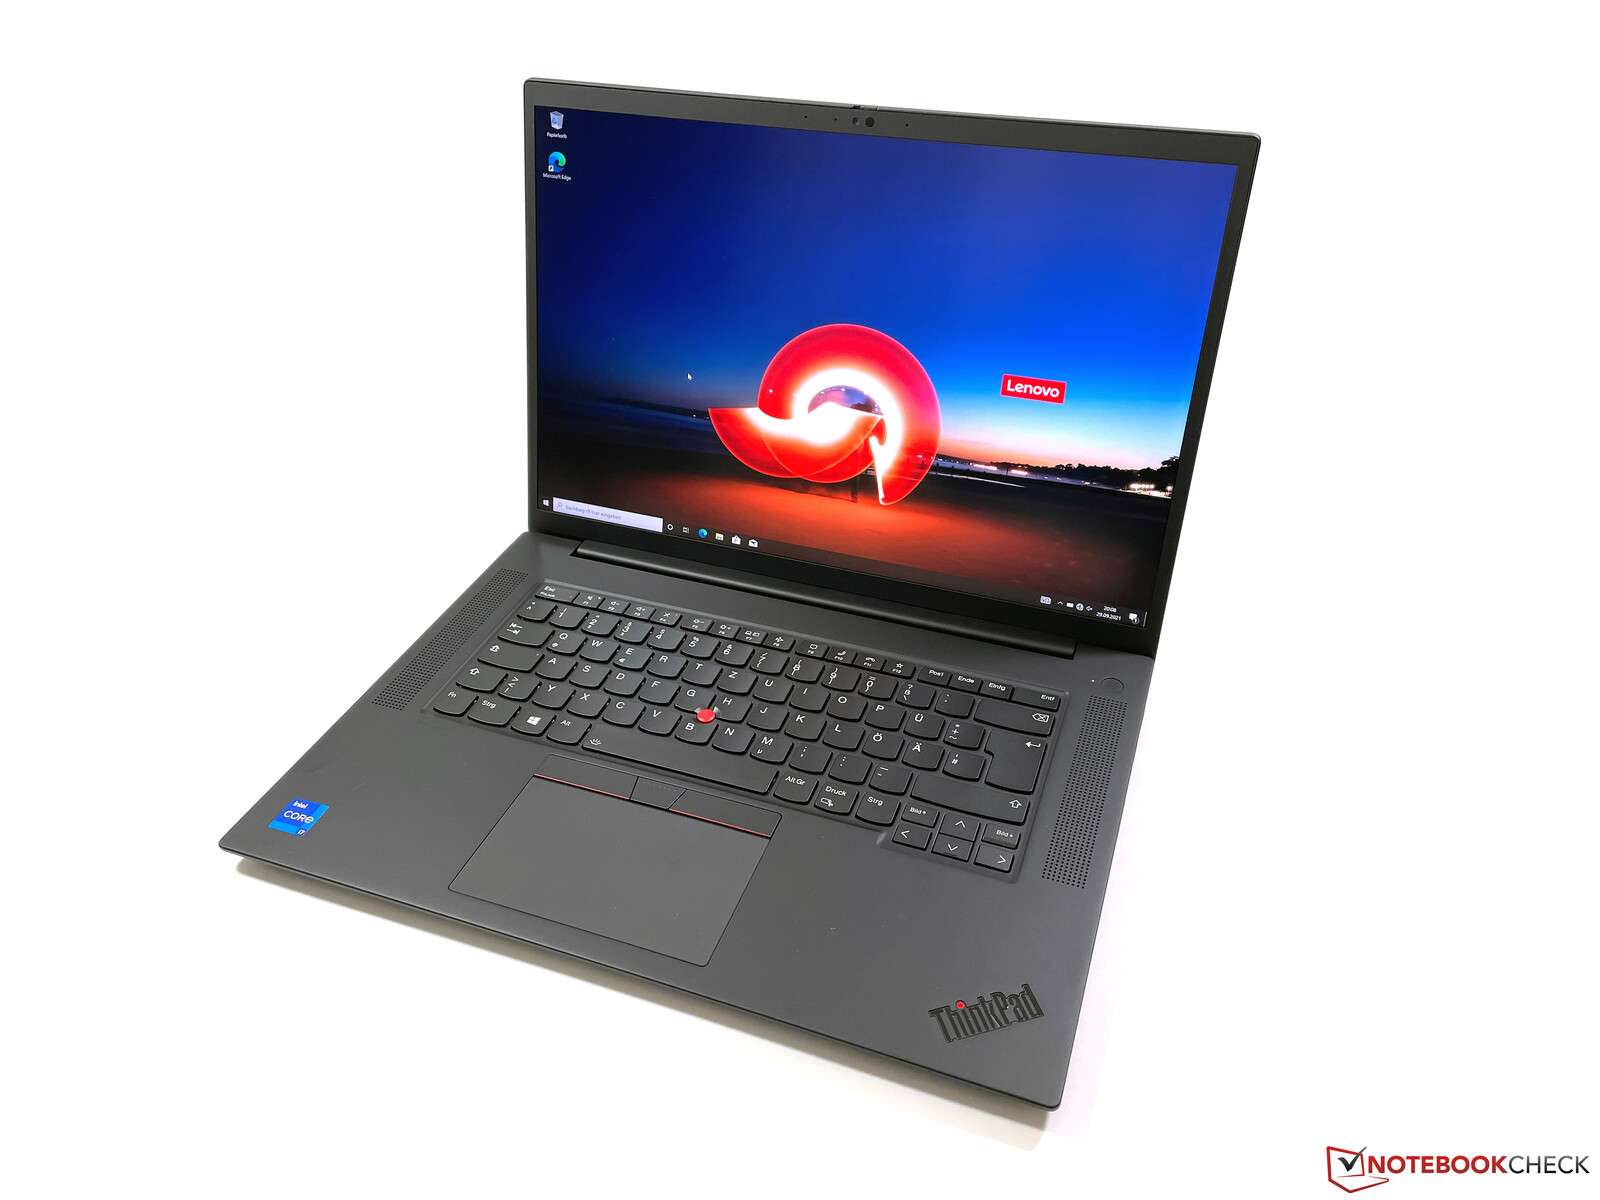
Lenovo ThinkPad P1 G4 Laptop Review: BIOS update provides more CPU performance
The current version of the ThinkPad P1 G4 and the identically built ThinkPad X1 Extreme G4 are available with two different cooling solutions. Configurations with faster graphics cards (from RTX 3060 or the corresponding RTX A3000) use a more capable vapor chamber cooling.
In our first review unit of the ThinkPad P1 G4 with conventional cooling, we were disappointed by the CPU performance. We now have the same configuration in the editorial office once again, and we wanted to check whether the CPU performance has improved in the meantime with the latest BIOS (version 1.13).
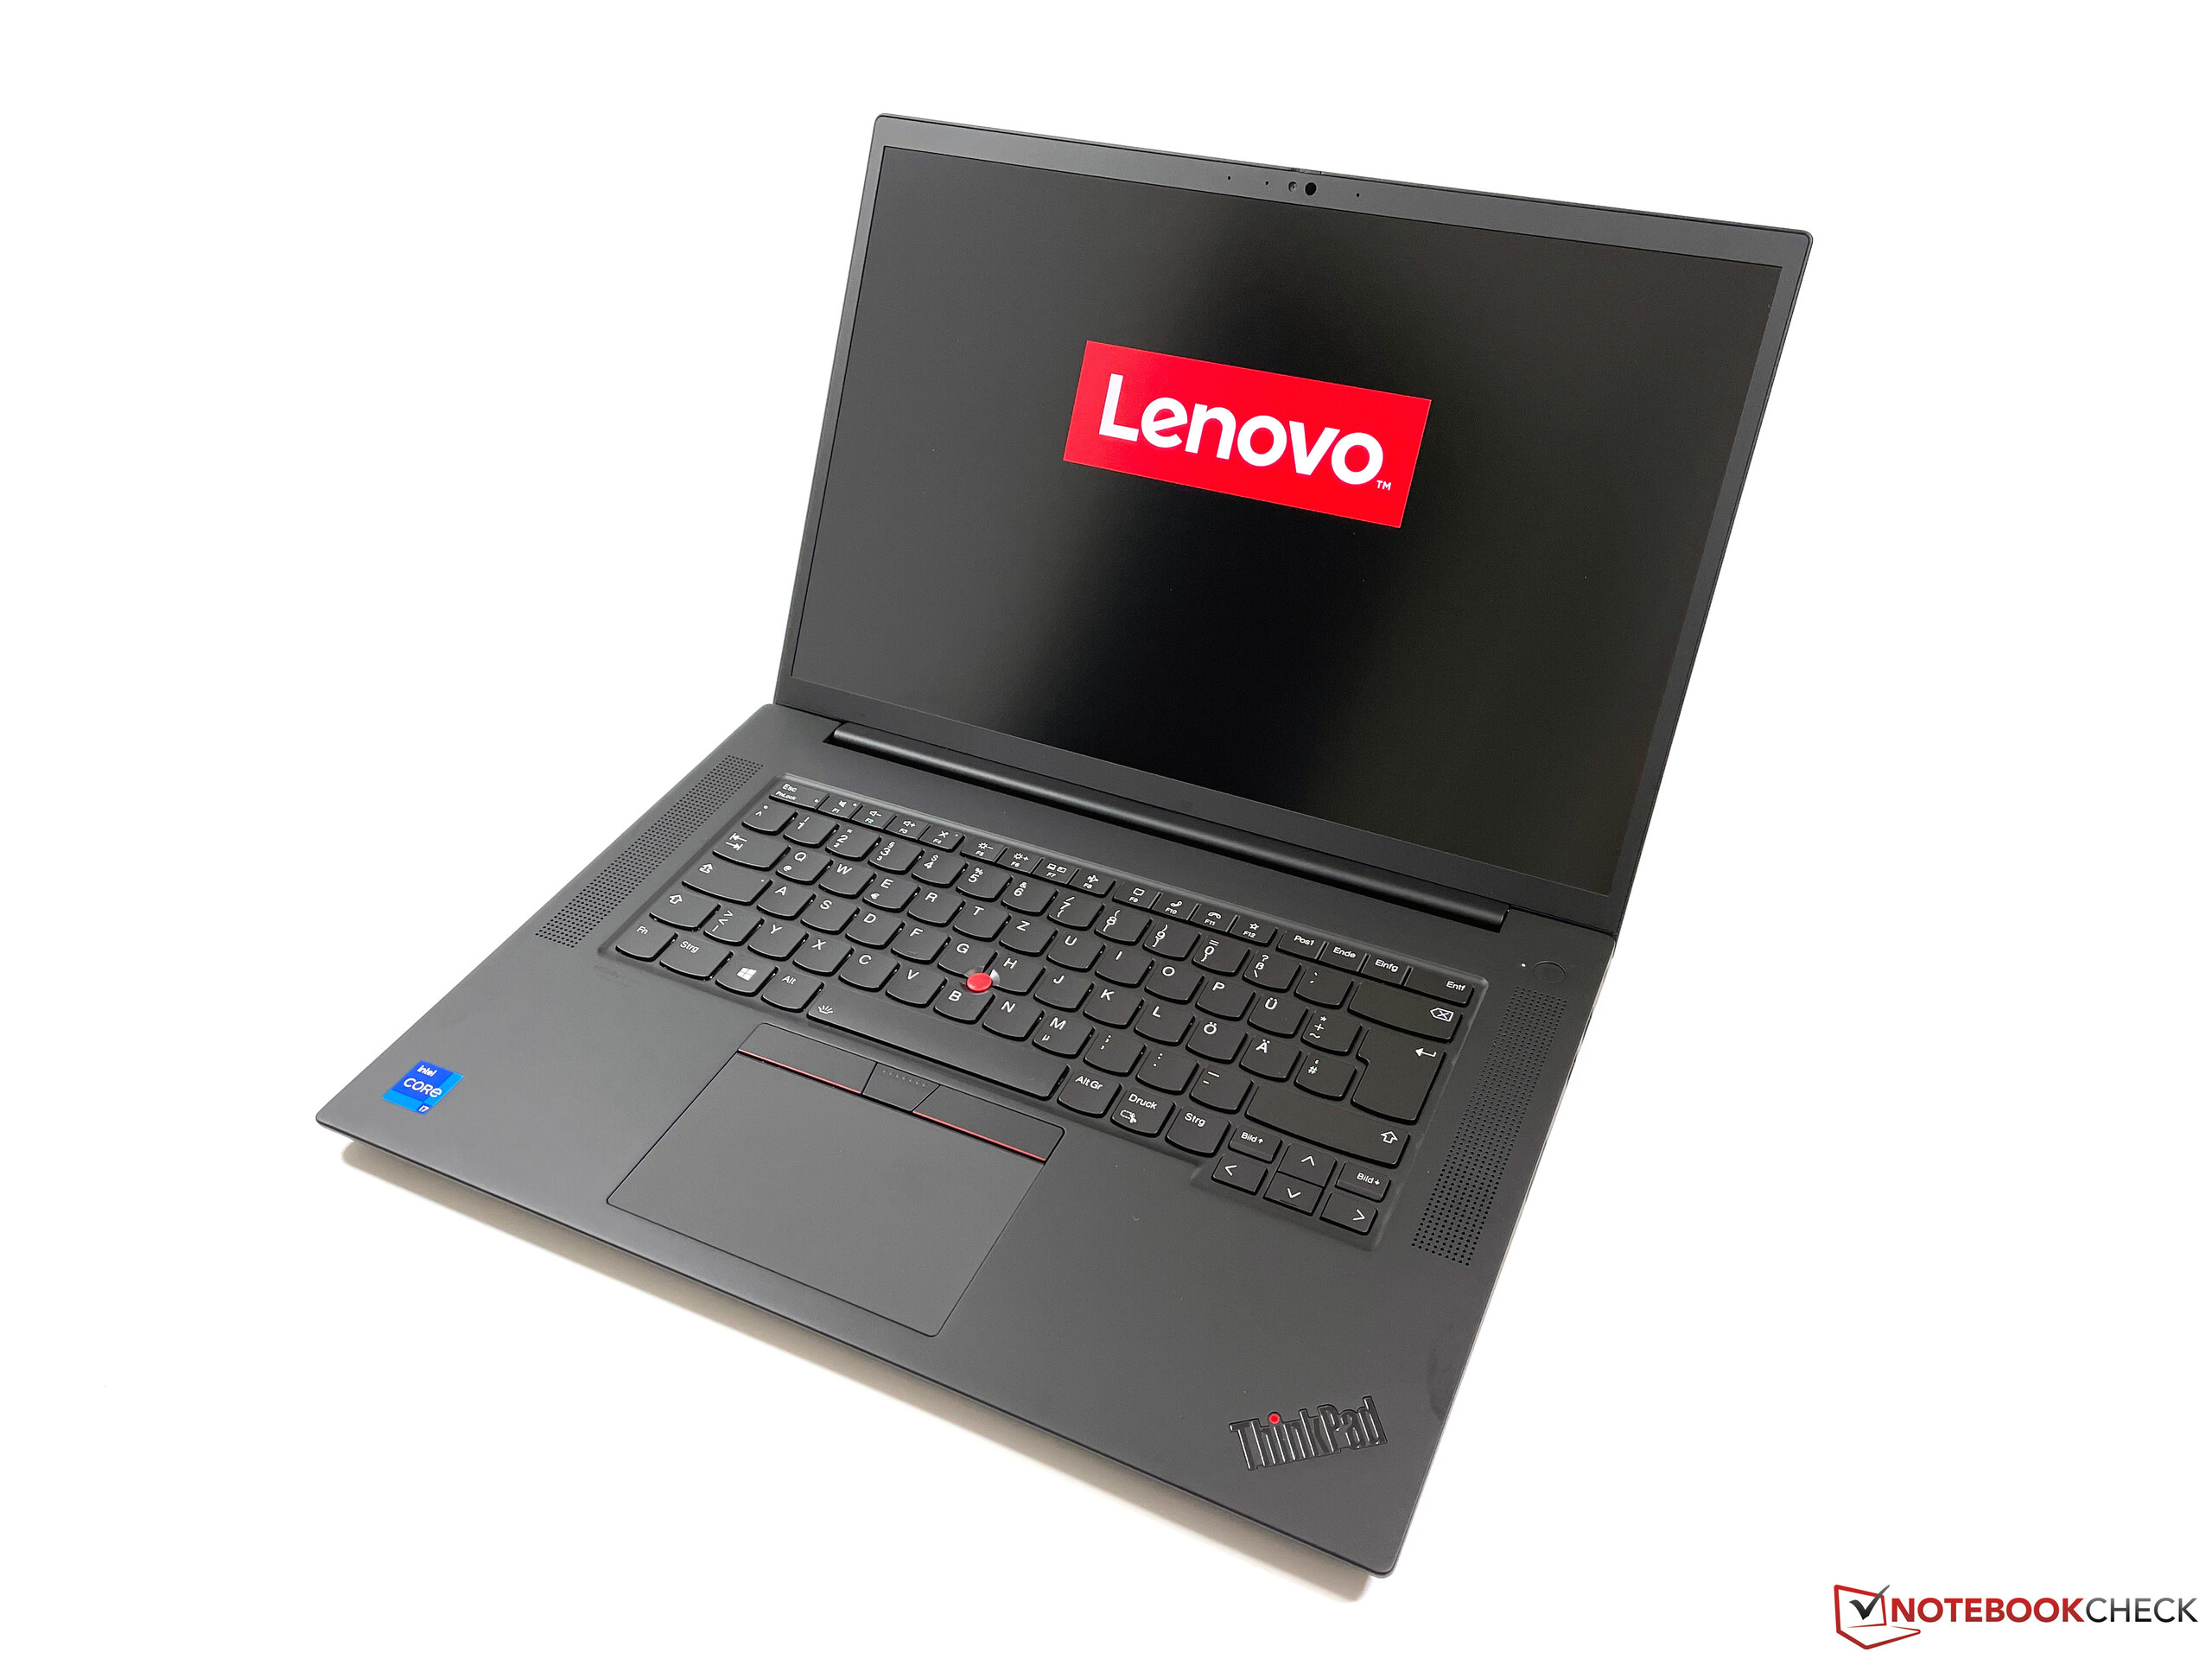
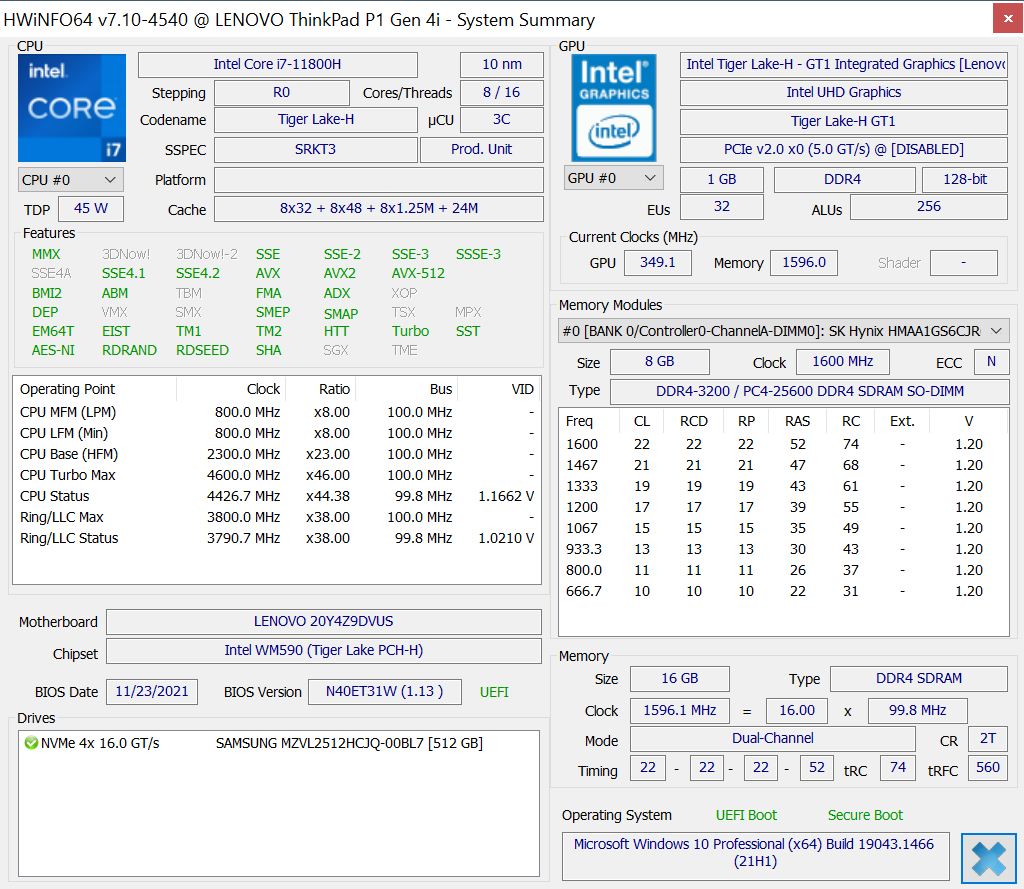
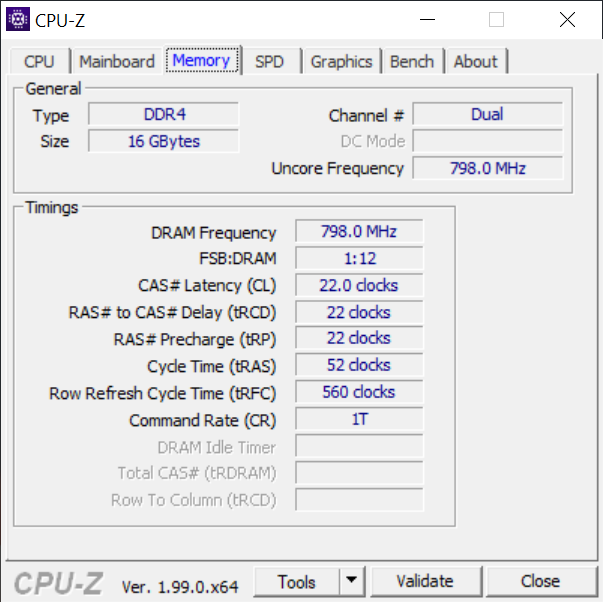
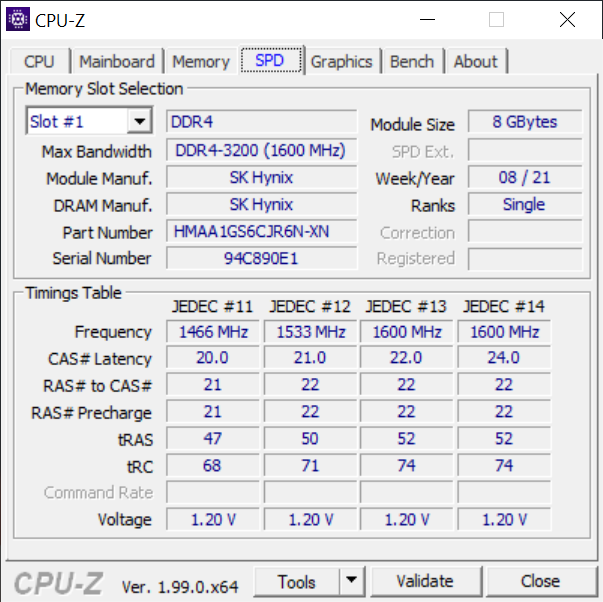
Apart from the change in working memory configuration (now dual-channel), the specifications of today's test device do not differ from the first model of the ThinkPad P1 G4. Therefore, we are again looking at a combination of the Intel Core i7-11800H and the Nvidia T1200. A panel from a different supplier is now being used for the WQHD screen, so we also look at the display characteristics. The main focus, however, is on the CPU performance.
For further information about the ThinkPad P1 G4 and the identically built ThinkPad X1 Extreme G4, we refer you to our previous reviews:
Possible competitors in comparison
Rating | Date | Model | Weight | Height | Size | Resolution | Best Price |
|---|---|---|---|---|---|---|---|
| 89.3 % | 02/2022 | Lenovo ThinkPad P1 G4-20Y4Z9DVUS i7-11800H, T1200 Laptop GPU | 1.8 kg | 17.7 mm | 16.00" | 2560x1600 | |
| 89.4 % | 10/2021 | Lenovo ThinkPad P1 G4-20Y30017GE i7-11800H, T1200 Laptop GPU | 1.8 kg | 17.7 mm | 16.00" | 2560x1600 | |
| 89.8 % | 11/2021 | Lenovo ThinkPad P1 G4-20Y4S0KS00 i7-11850H, GeForce RTX 3070 Laptop GPU | 2 kg | 17.7 mm | 16.00" | 3840x2400 | |
| 89 % | 11/2021 | Lenovo ThinkPad X1 Extreme G4-20Y5CTO1WW (3050 Ti) i7-11800H, GeForce RTX 3050 Ti Laptop GPU | 2 kg | 18.2 mm | 16.00" | 3840x2400 | |
| 88.3 % | 12/2021 | Lenovo ThinkPad X1 Extreme G4-20Y50040GE i9-11950H, GeForce RTX 3080 Laptop GPU | 1.9 kg | 18.2 mm | 16.00" | 3840x2400 |
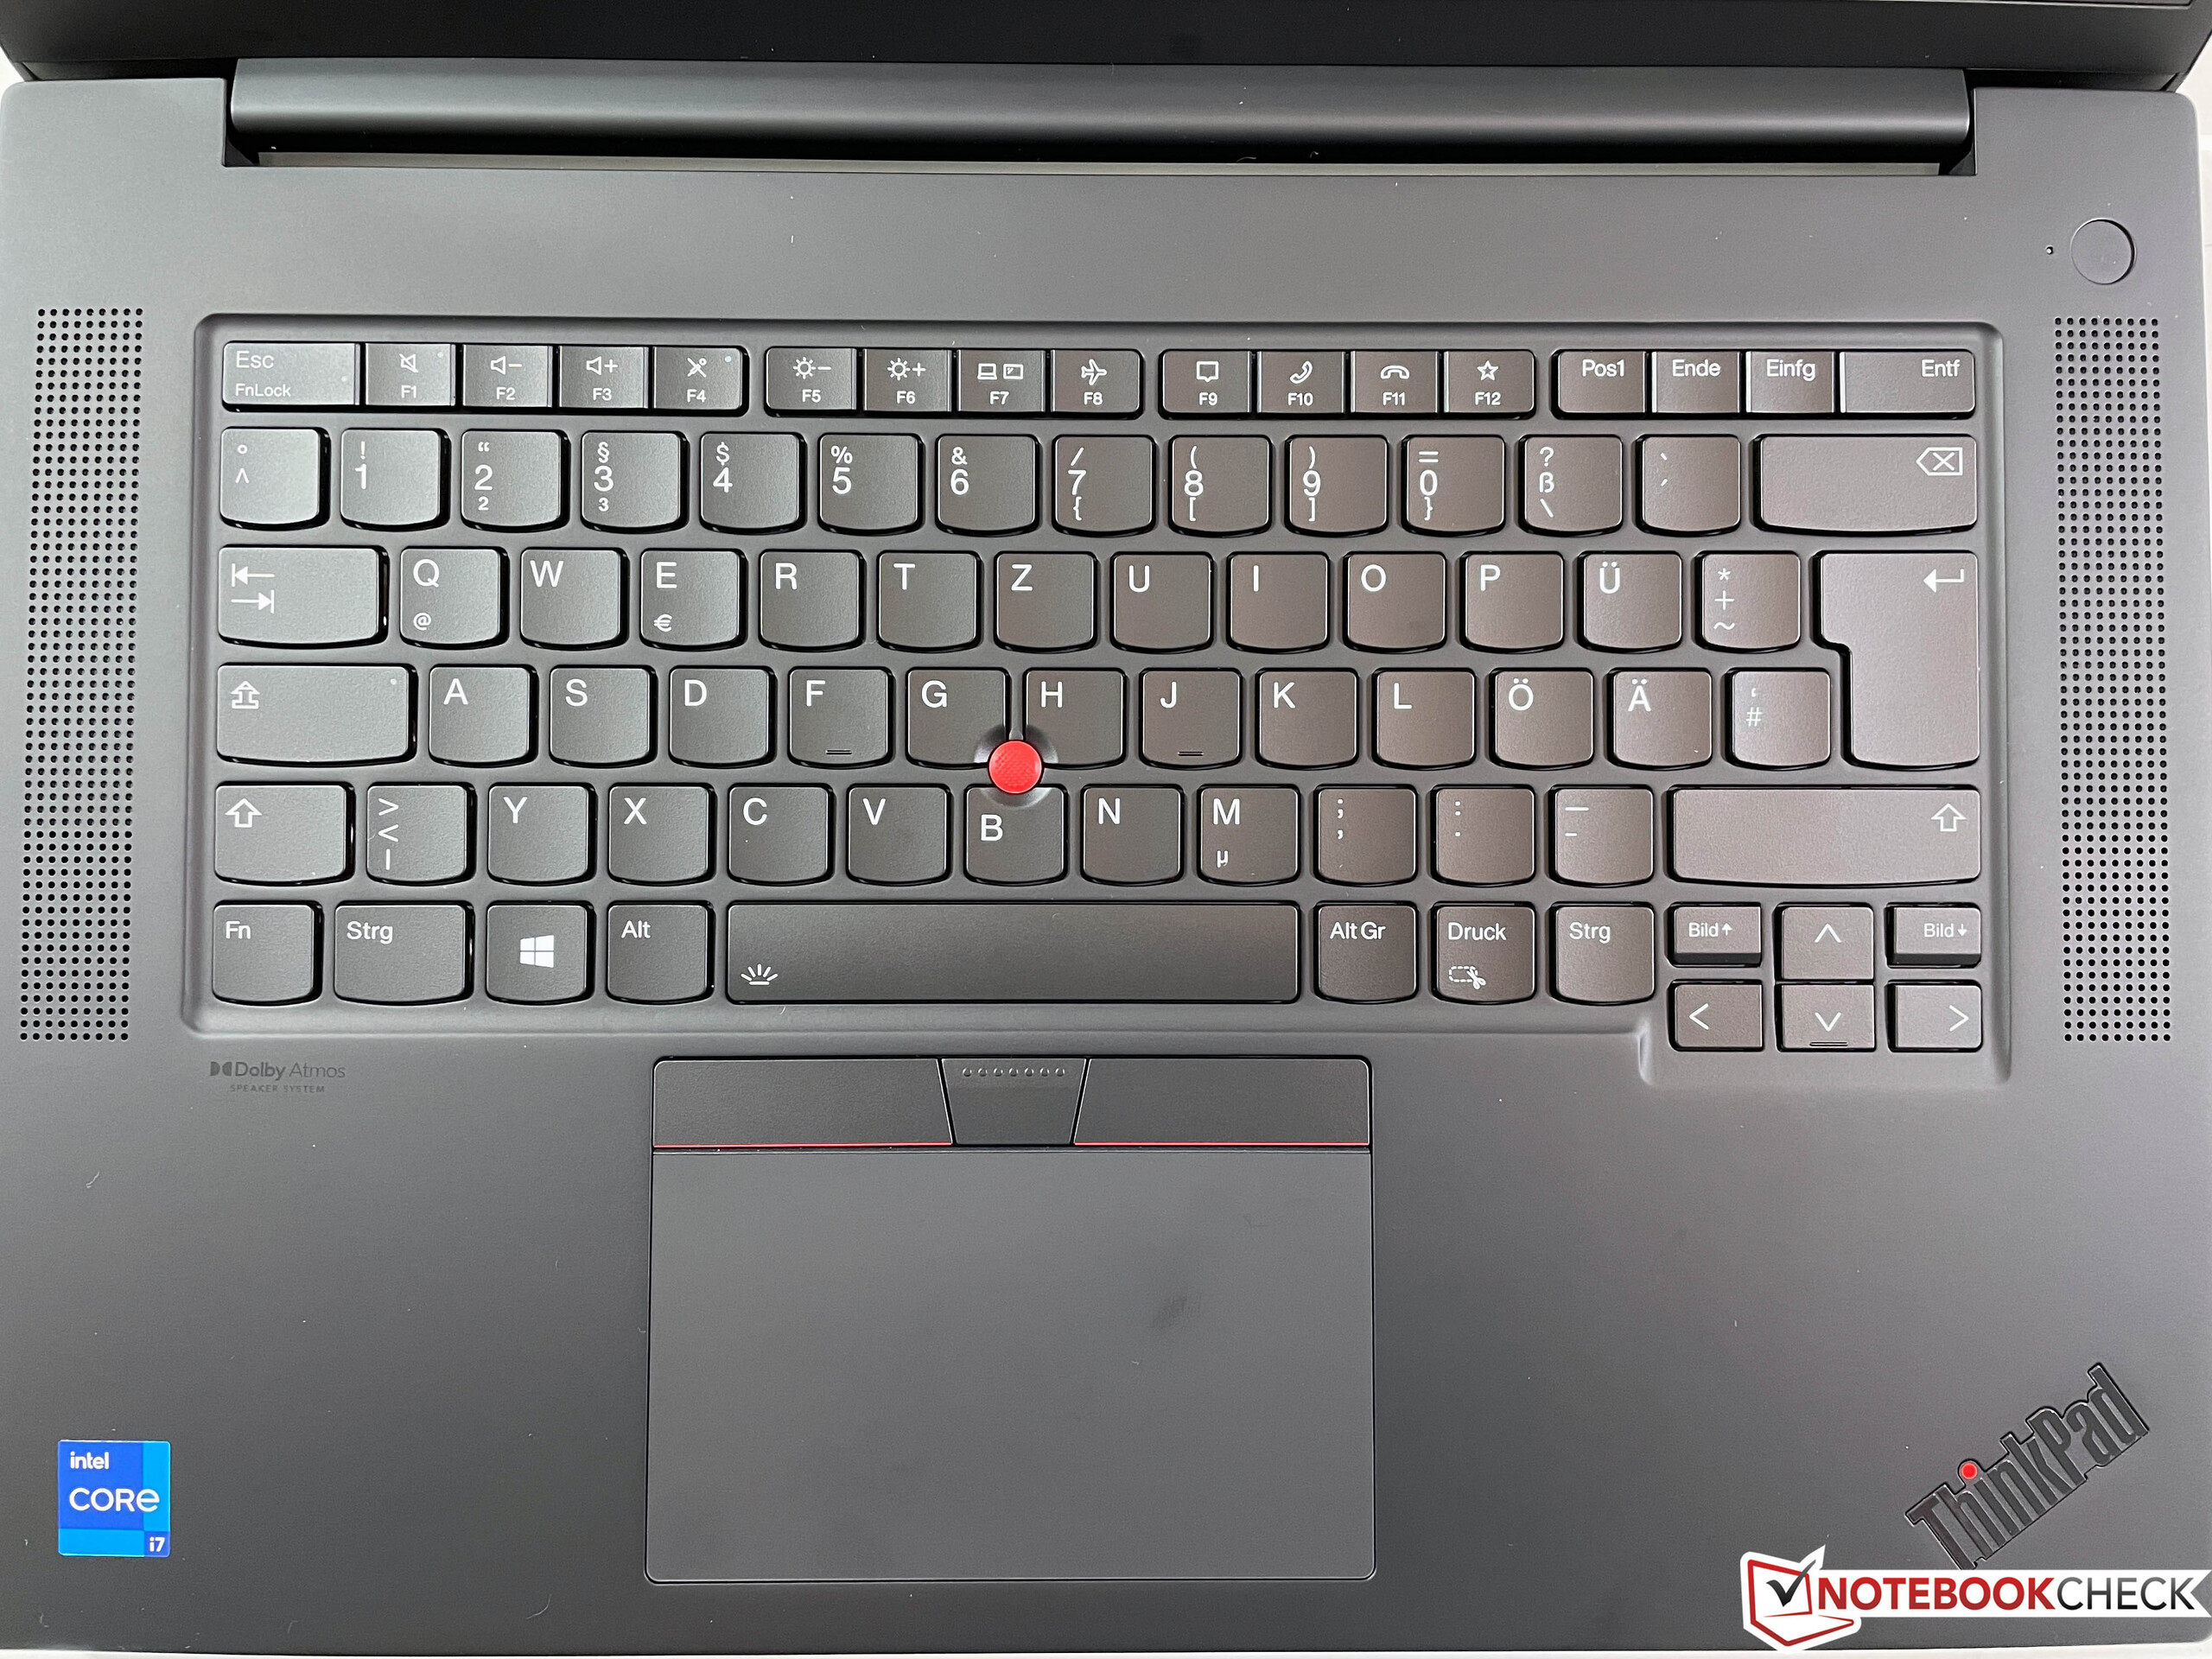
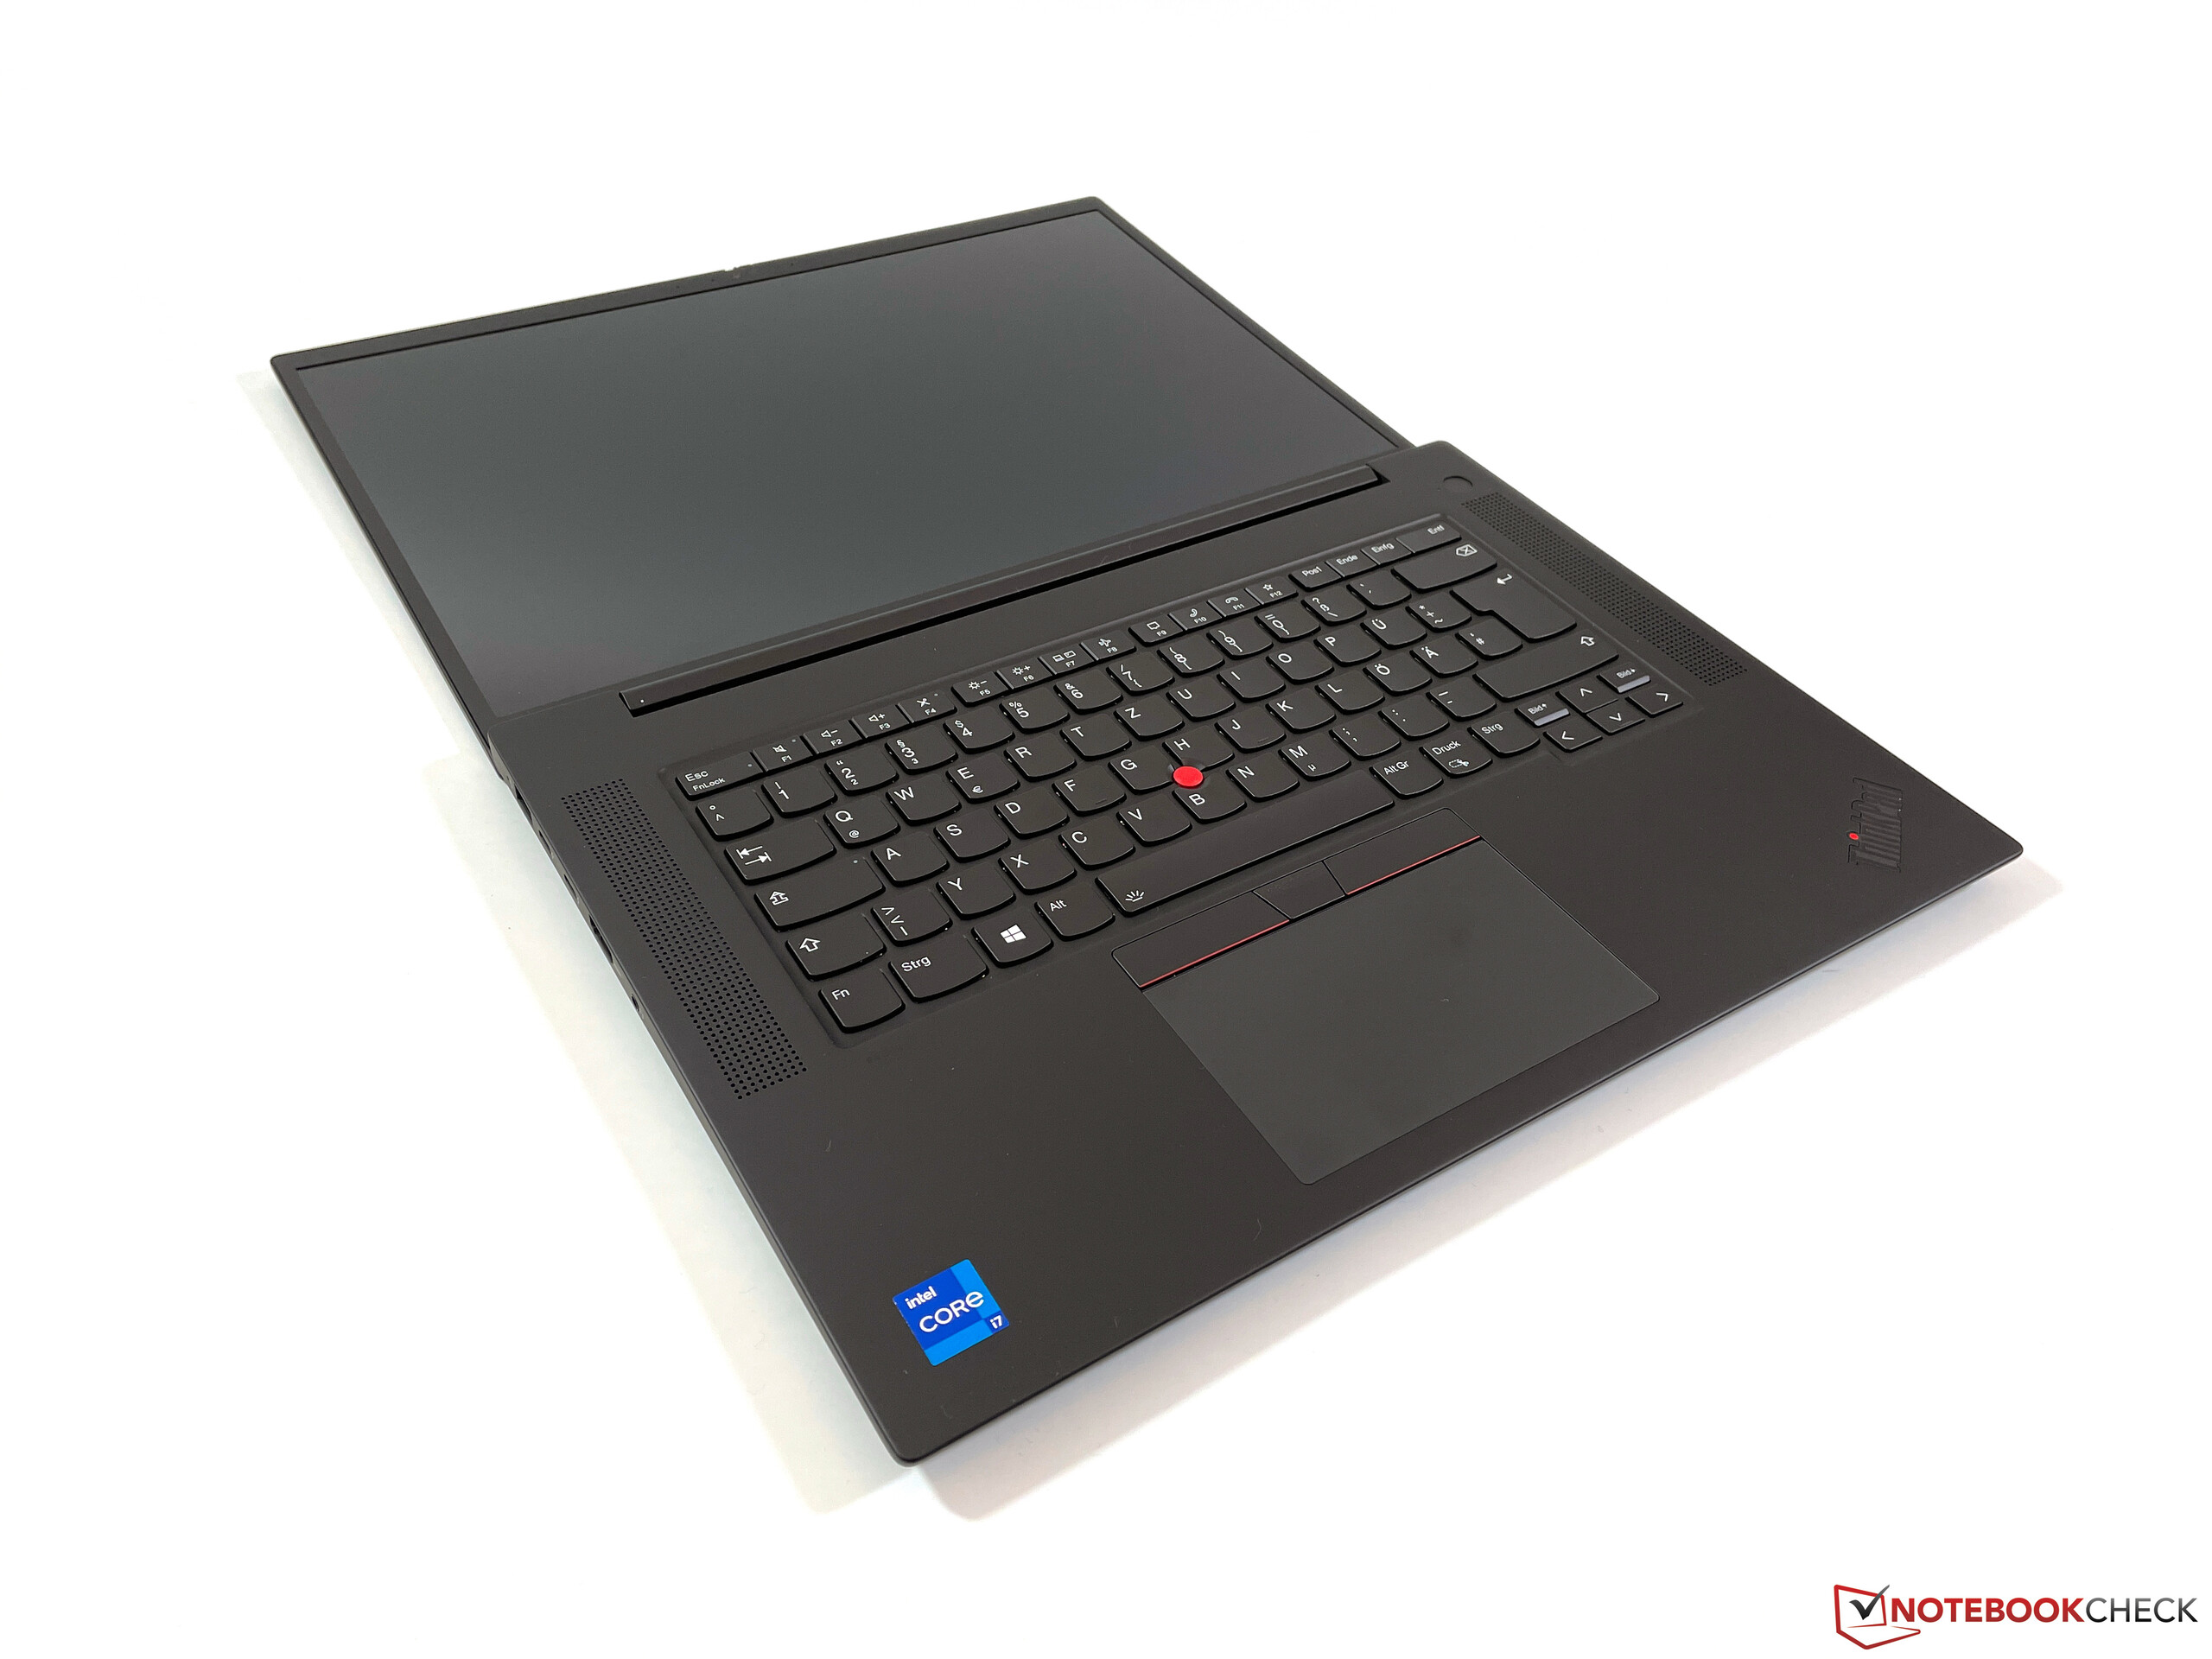
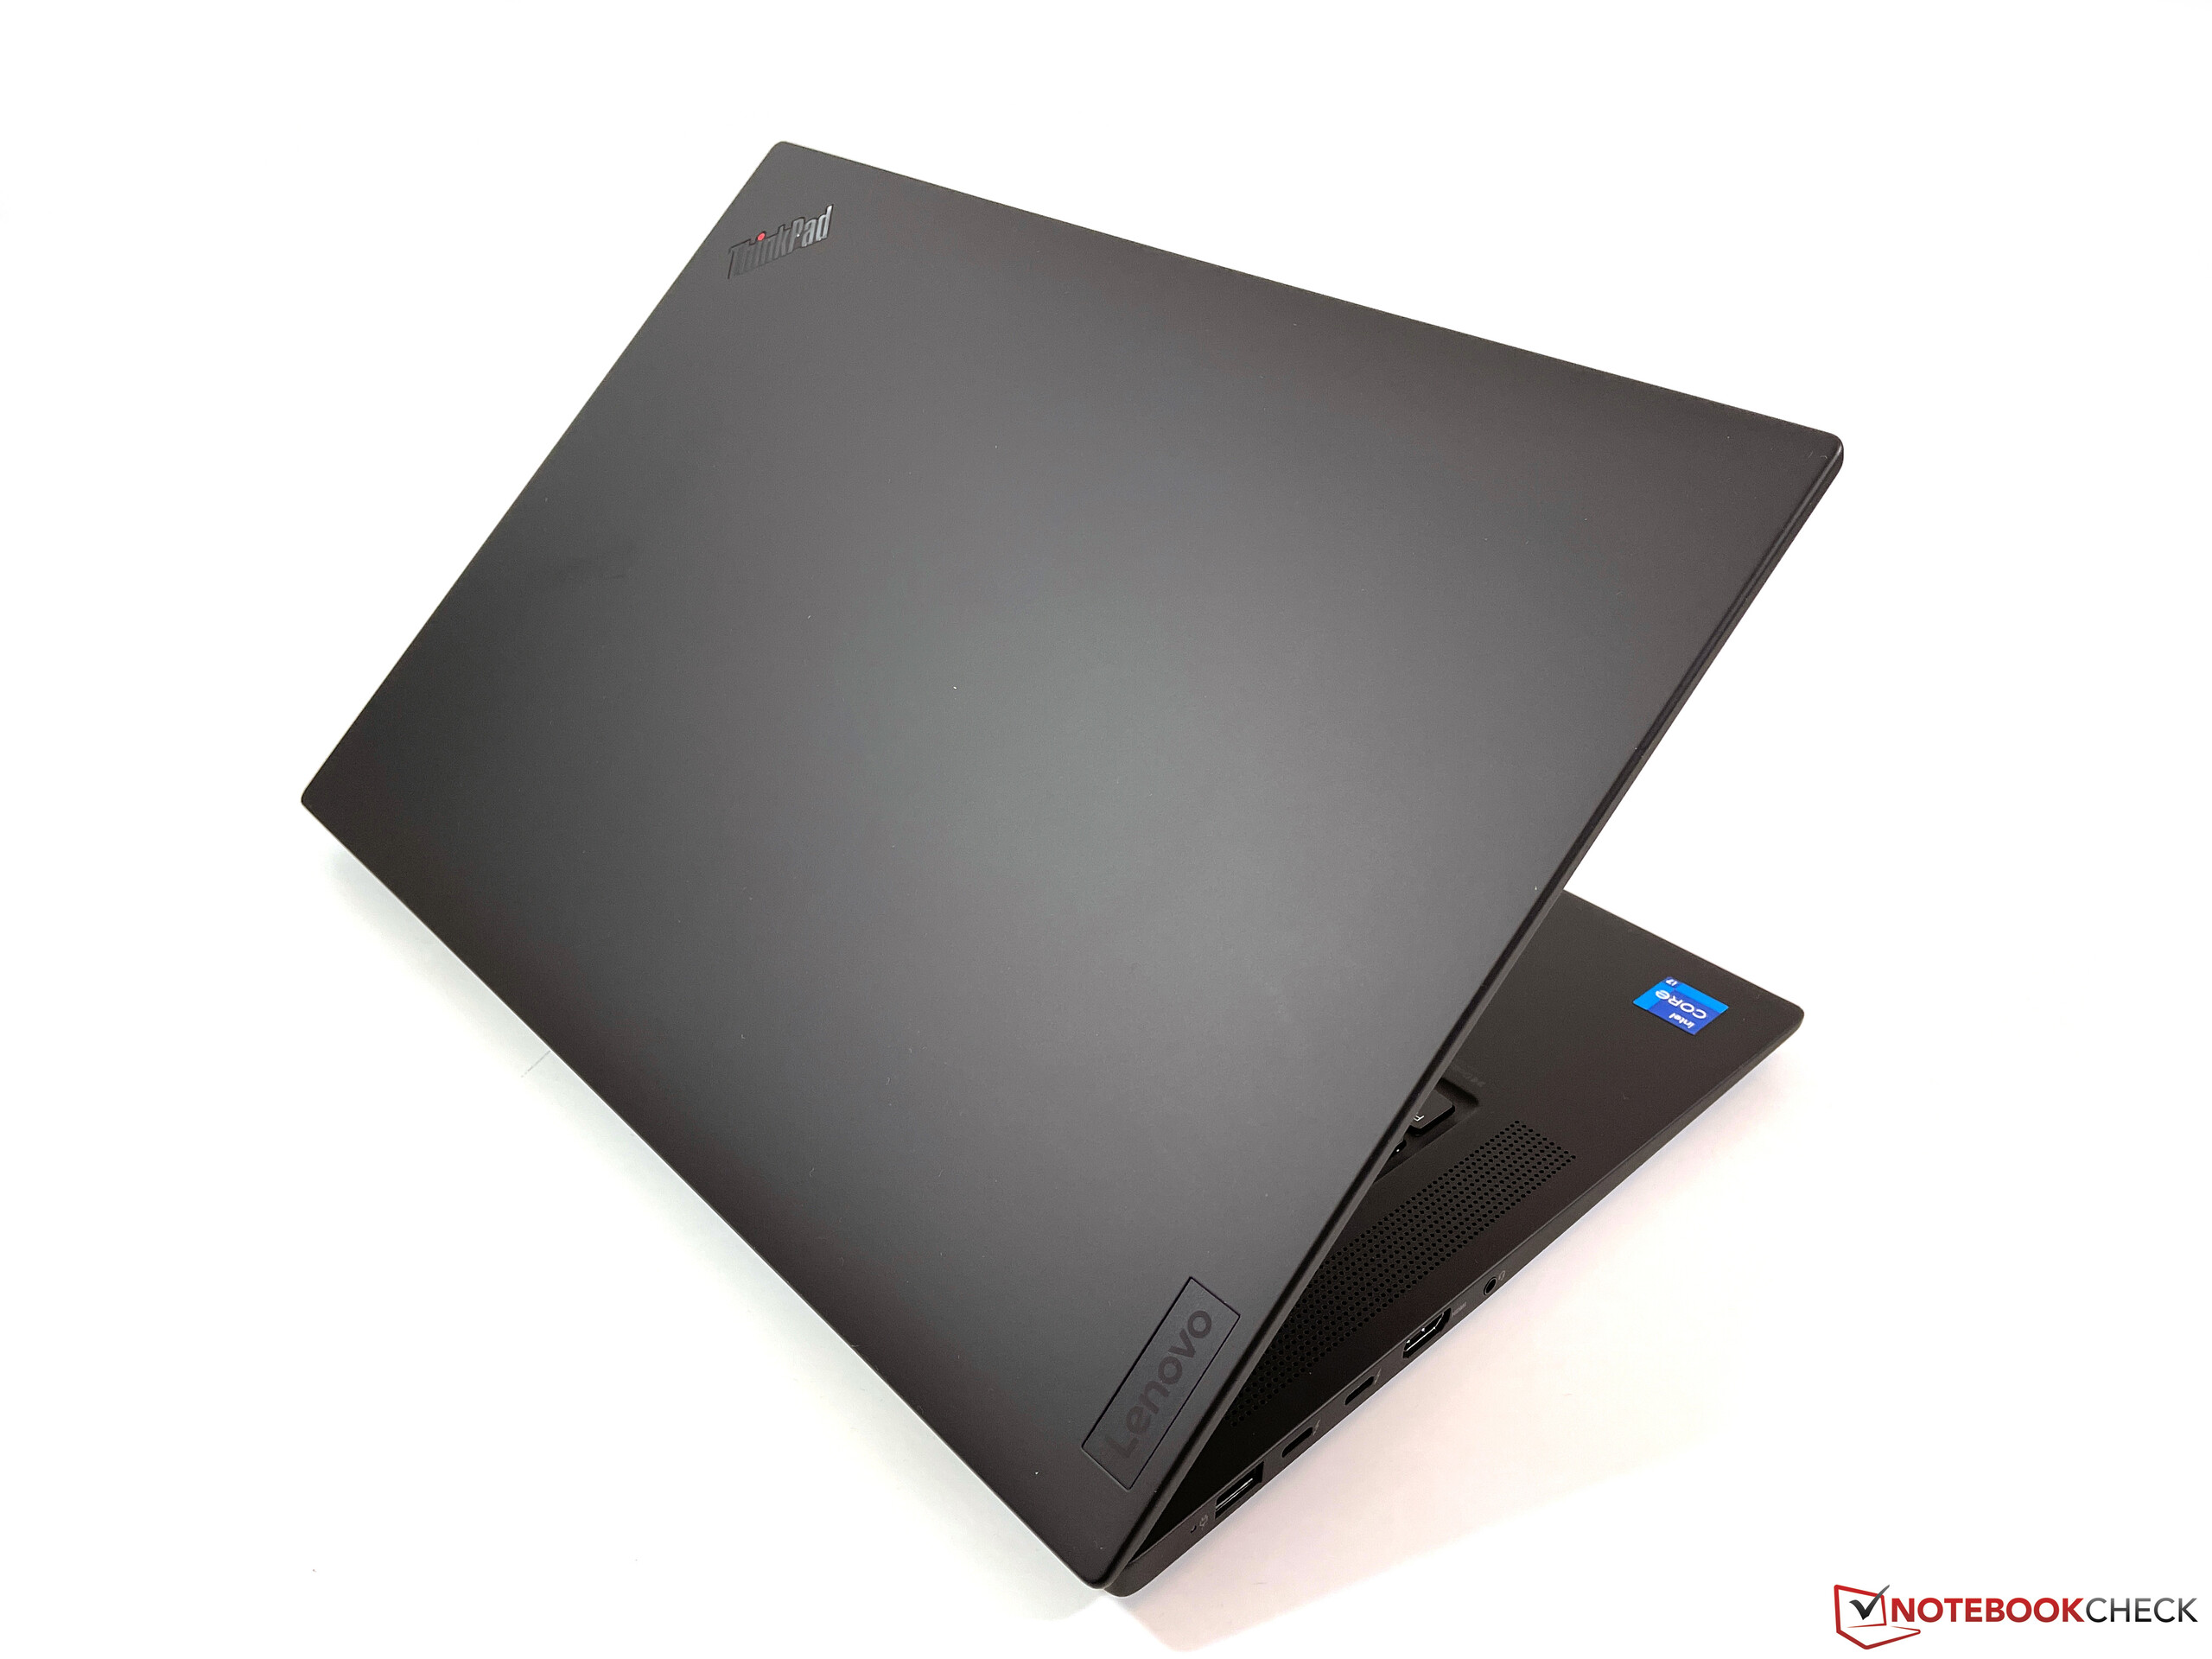
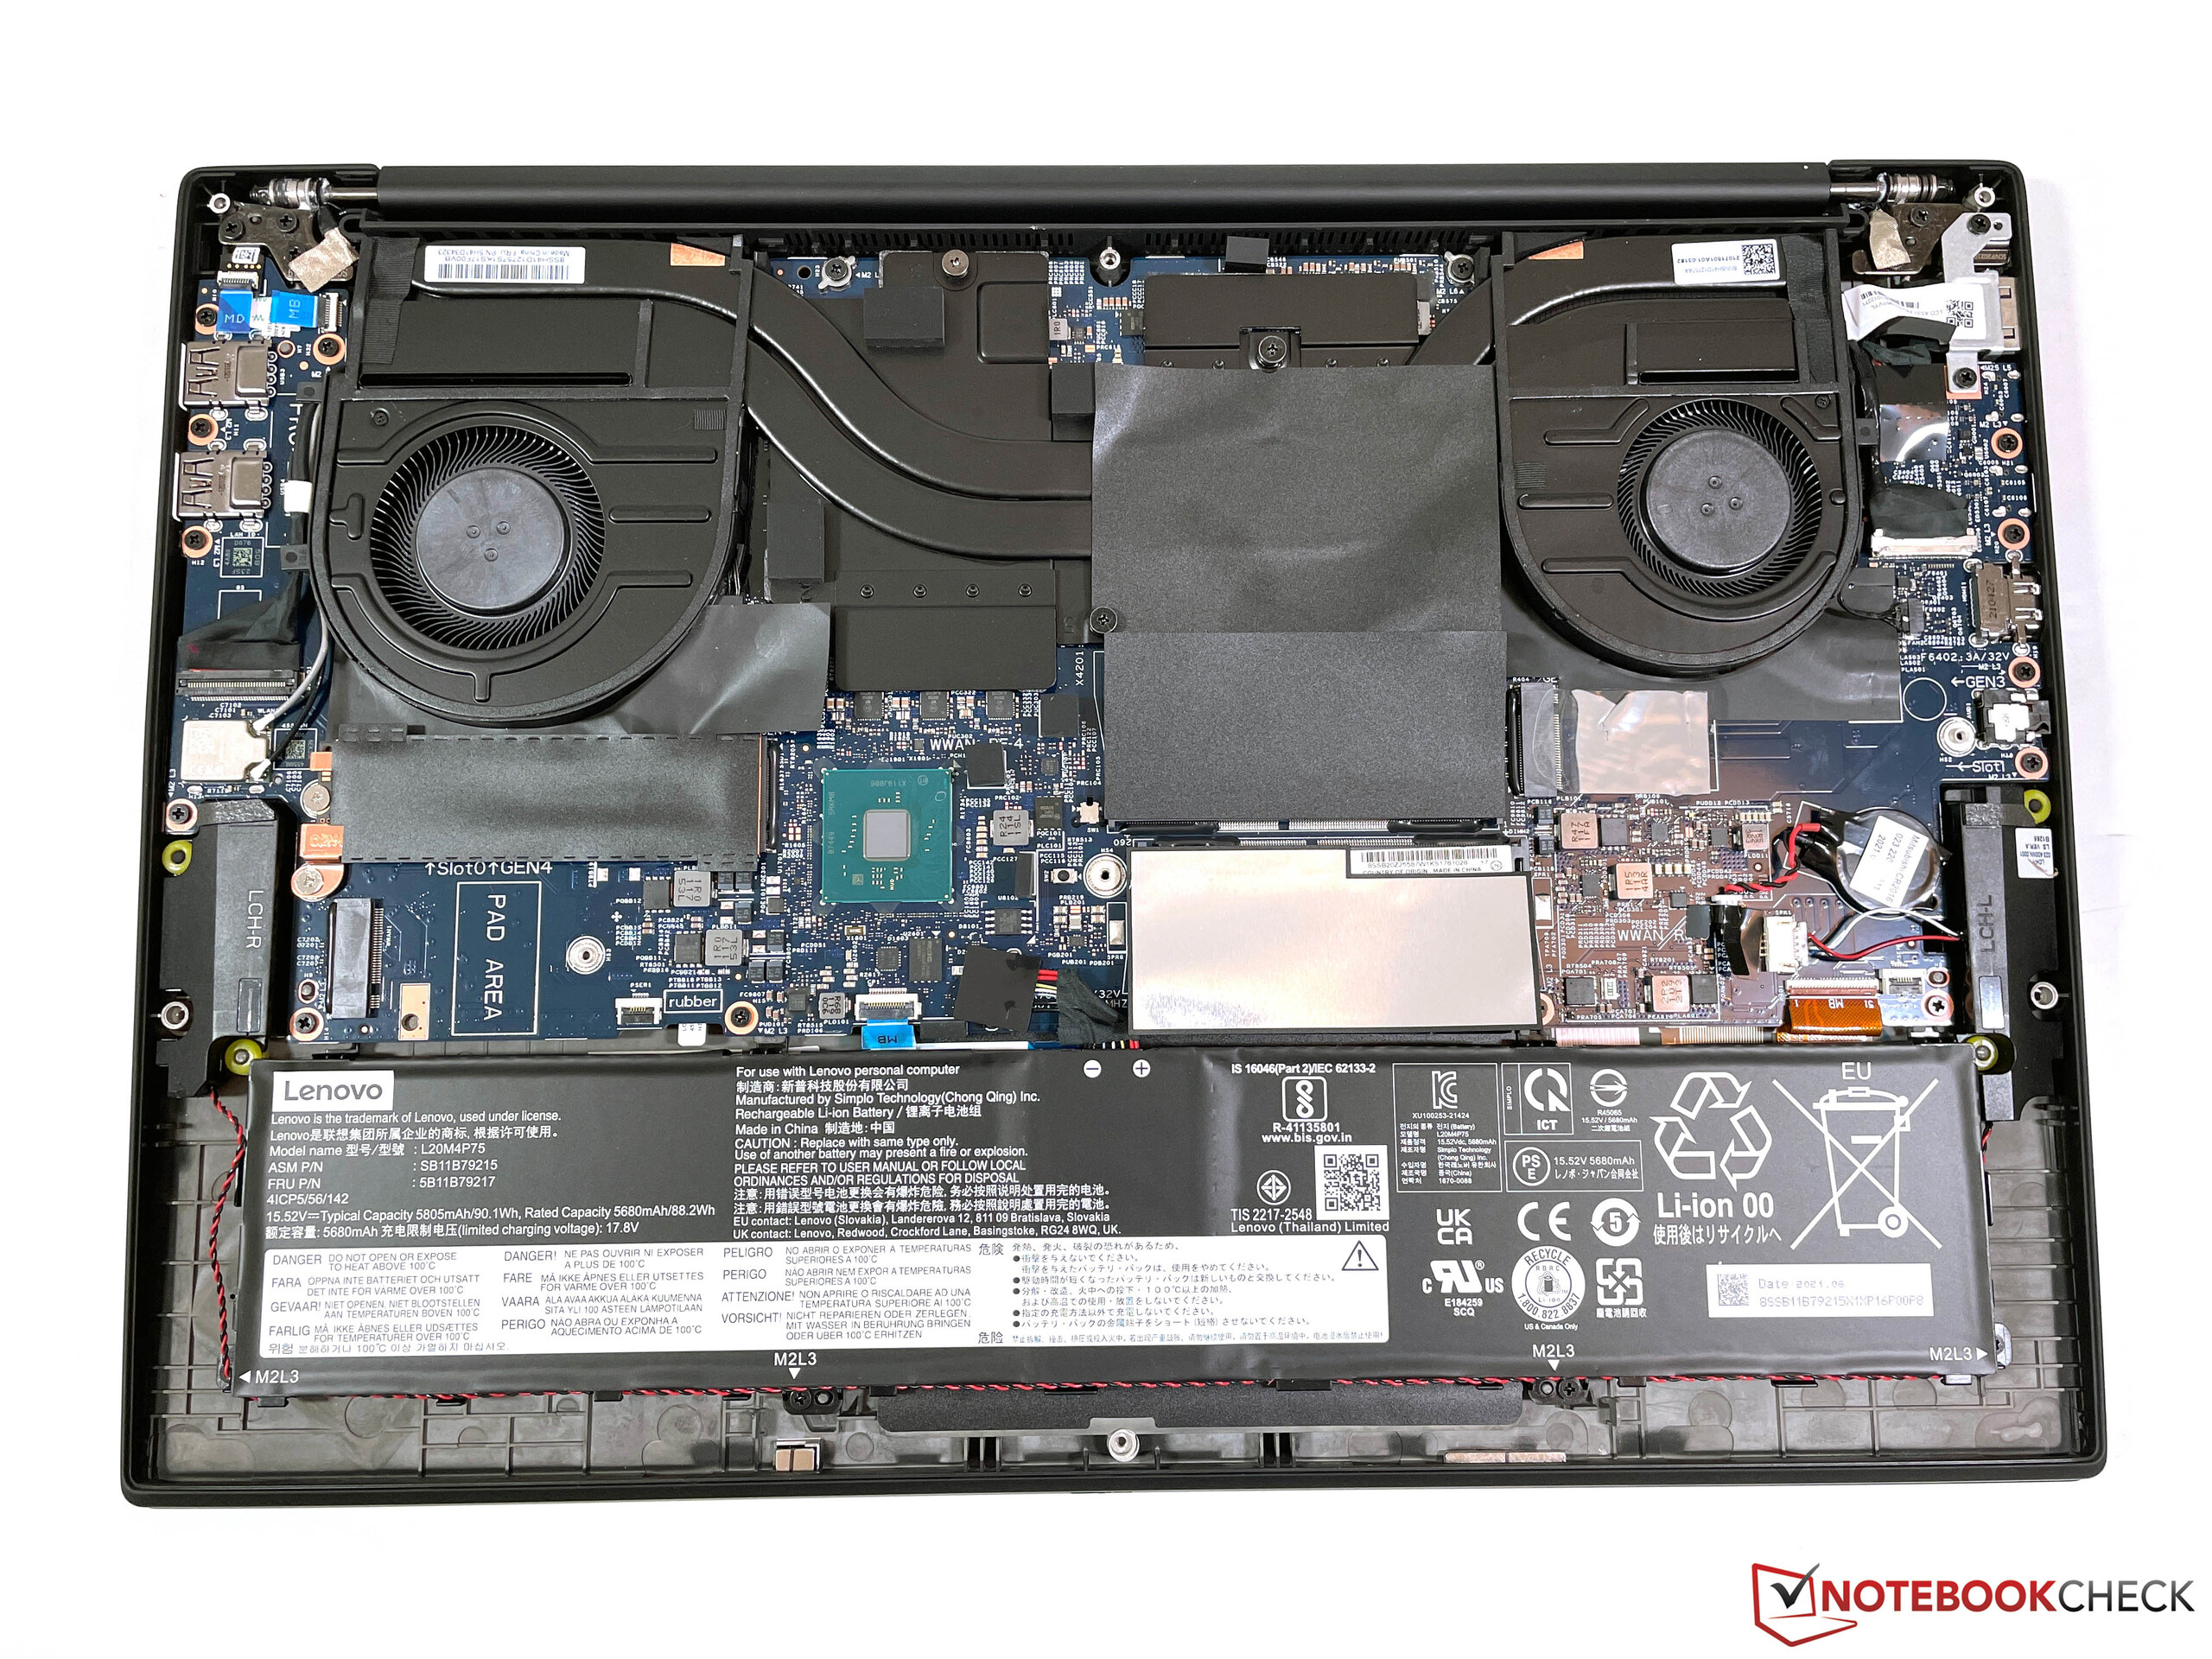
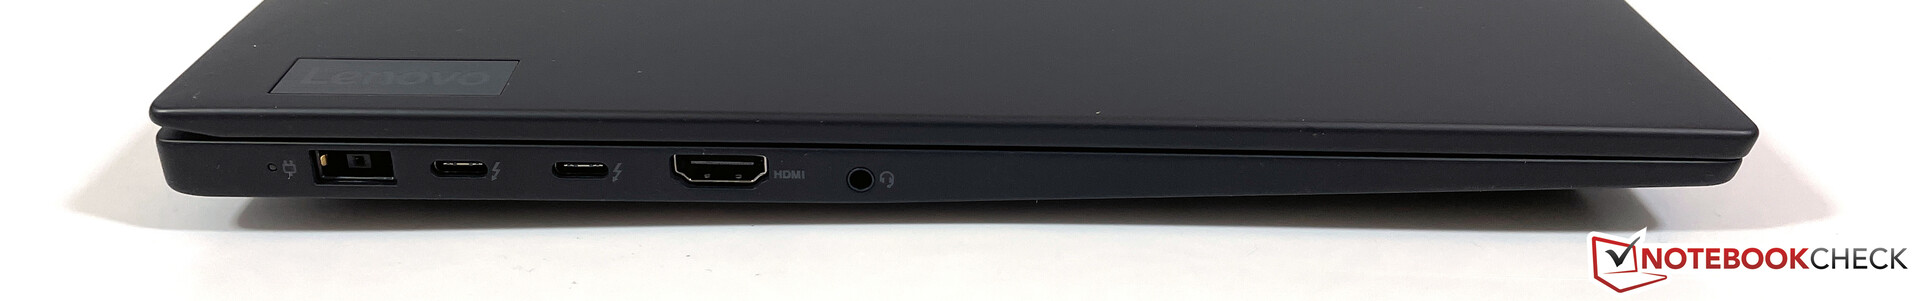
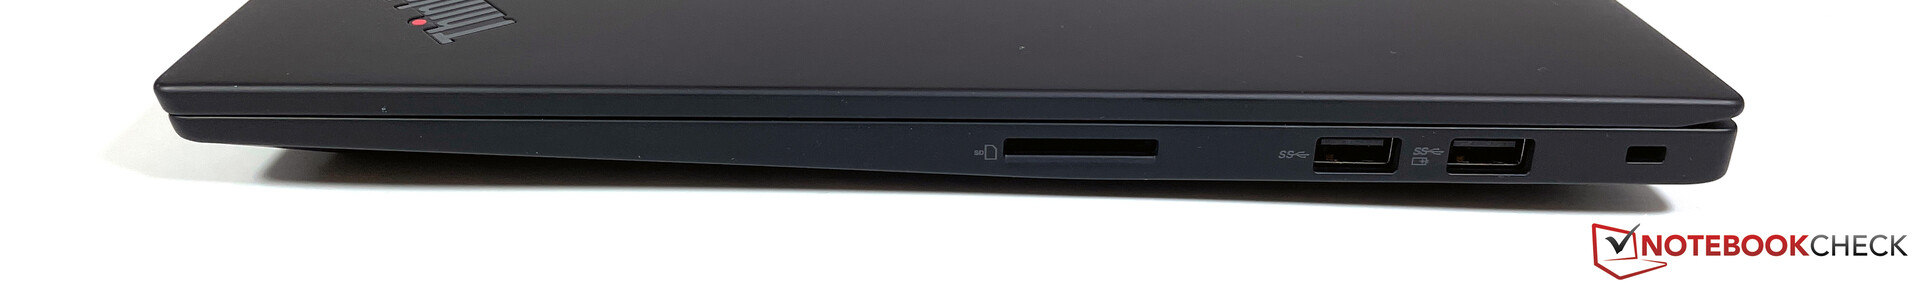
Case & Equipment
| SD Card Reader | |
| average JPG Copy Test (av. of 3 runs) | |
| Lenovo ThinkPad P1 G4-20Y4Z9DVUS (Angelbird AV Pro V60) | |
| Lenovo ThinkPad P1 G4-20Y30017GE (AV PRO V60) | |
| Lenovo ThinkPad X1 Extreme G4-20Y5CTO1WW (3050 Ti) (AV Pro V60) | |
| Average of class Workstation (54.8 - 200, n=16, last 2 years) | |
| maximum AS SSD Seq Read Test (1GB) | |
| Lenovo ThinkPad P1 G4-20Y30017GE (AV PRO V60) | |
| Lenovo ThinkPad P1 G4-20Y4Z9DVUS (Angelbird AV Pro V60) | |
| Lenovo ThinkPad X1 Extreme G4-20Y5CTO1WW (3050 Ti) (AV Pro V60) | |
| Average of class Workstation (78.6 - 226, n=16, last 2 years) | |


Display: WQHD panel from at least two suppliers
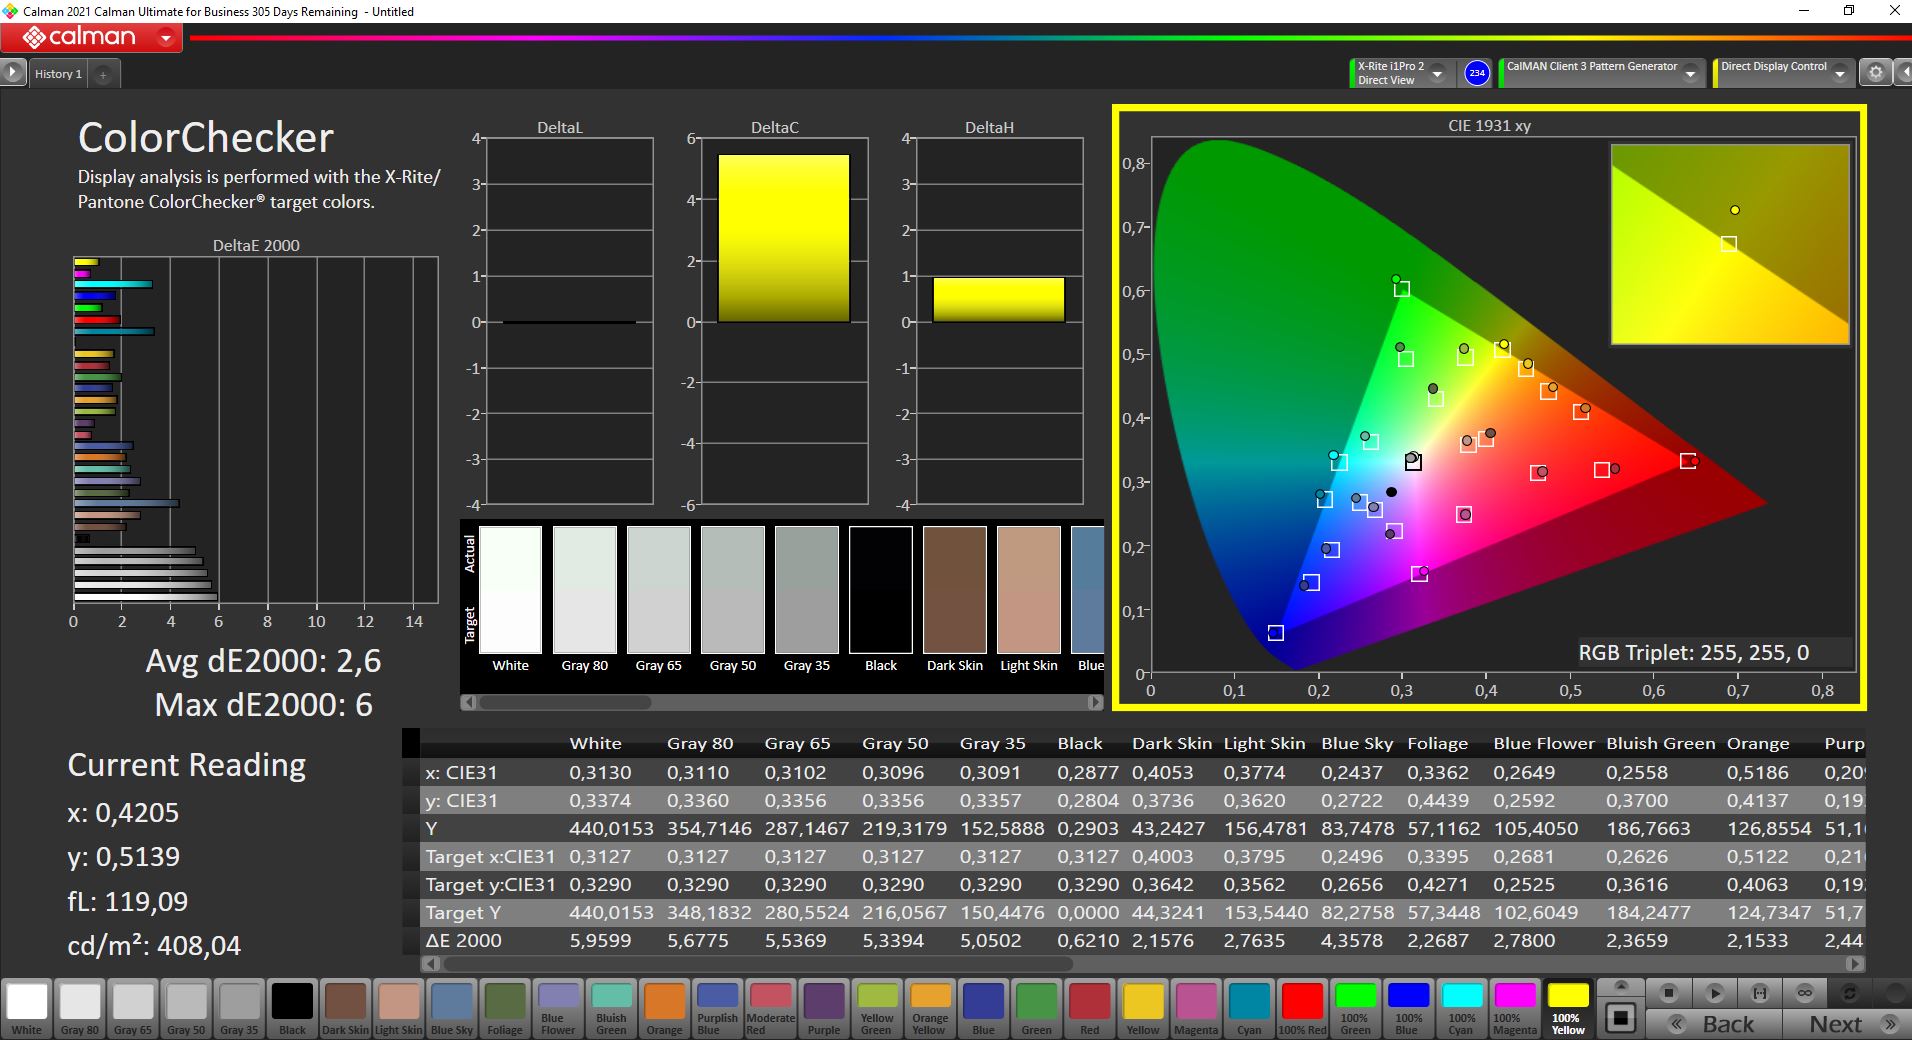
Our review sample of the ThinkPad P1 G4 is once again equipped with the standard WQHD panel (2,560 x 1,600 pixels, 16:10, matte), but the panel ID, and thus the supplier, differs. This BOE panel scores minimally better in the measurements (slightly brighter, slightly higher contrast), but the values are pretty much comparable. Both panels offer very good picture quality without PWM flickering. The response times are slow, but we didn't find them to be problematic.
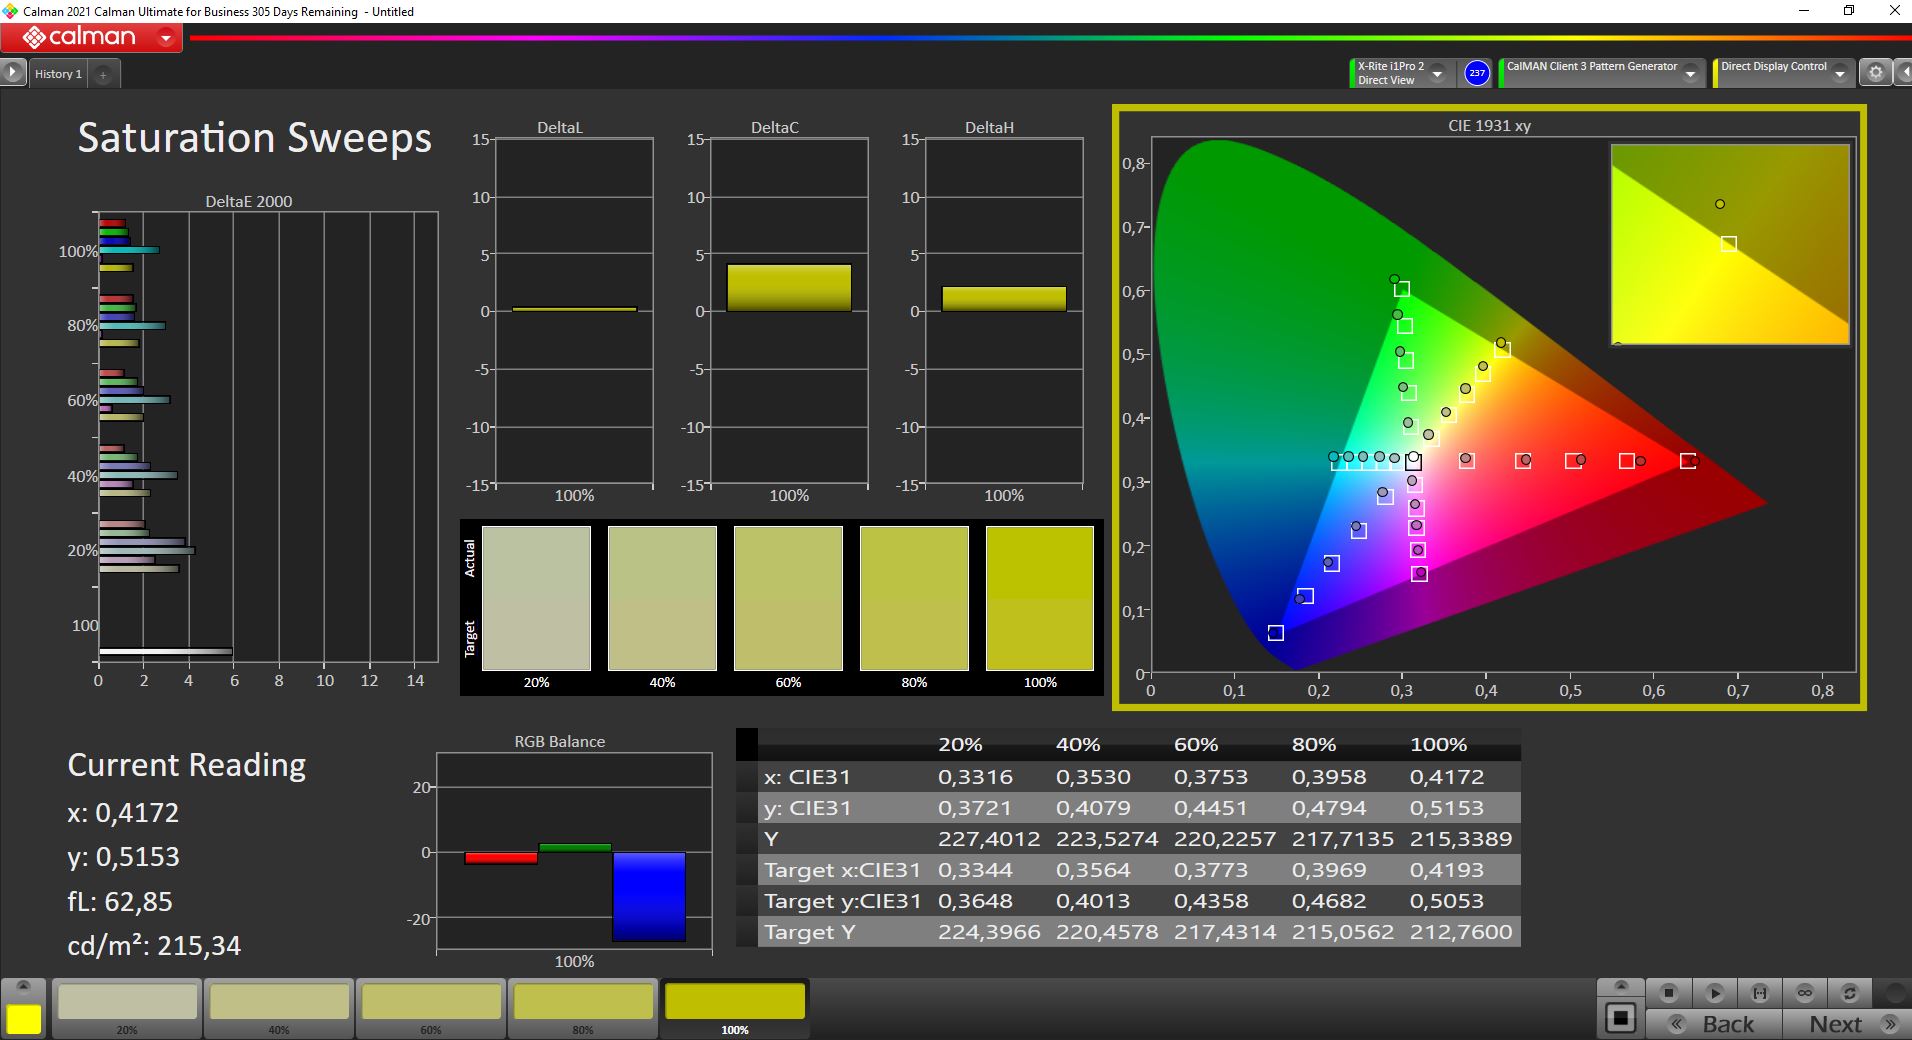
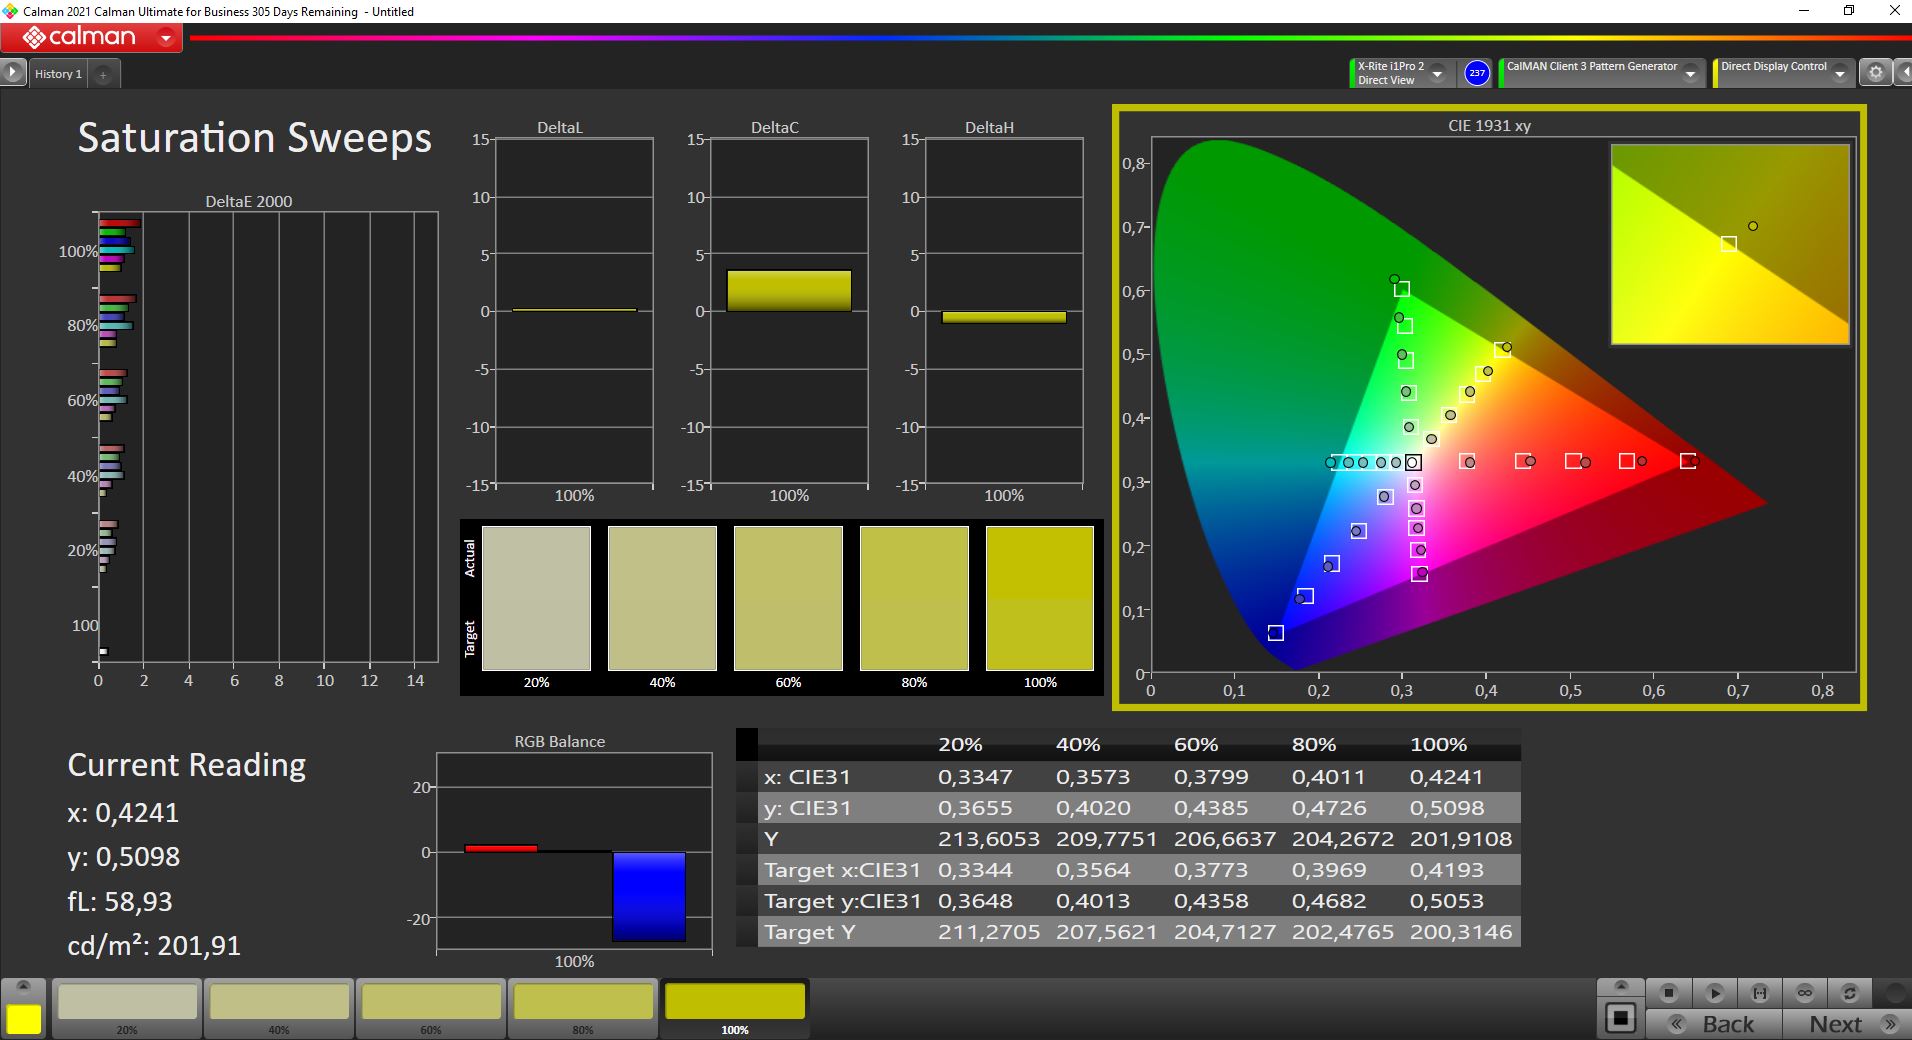
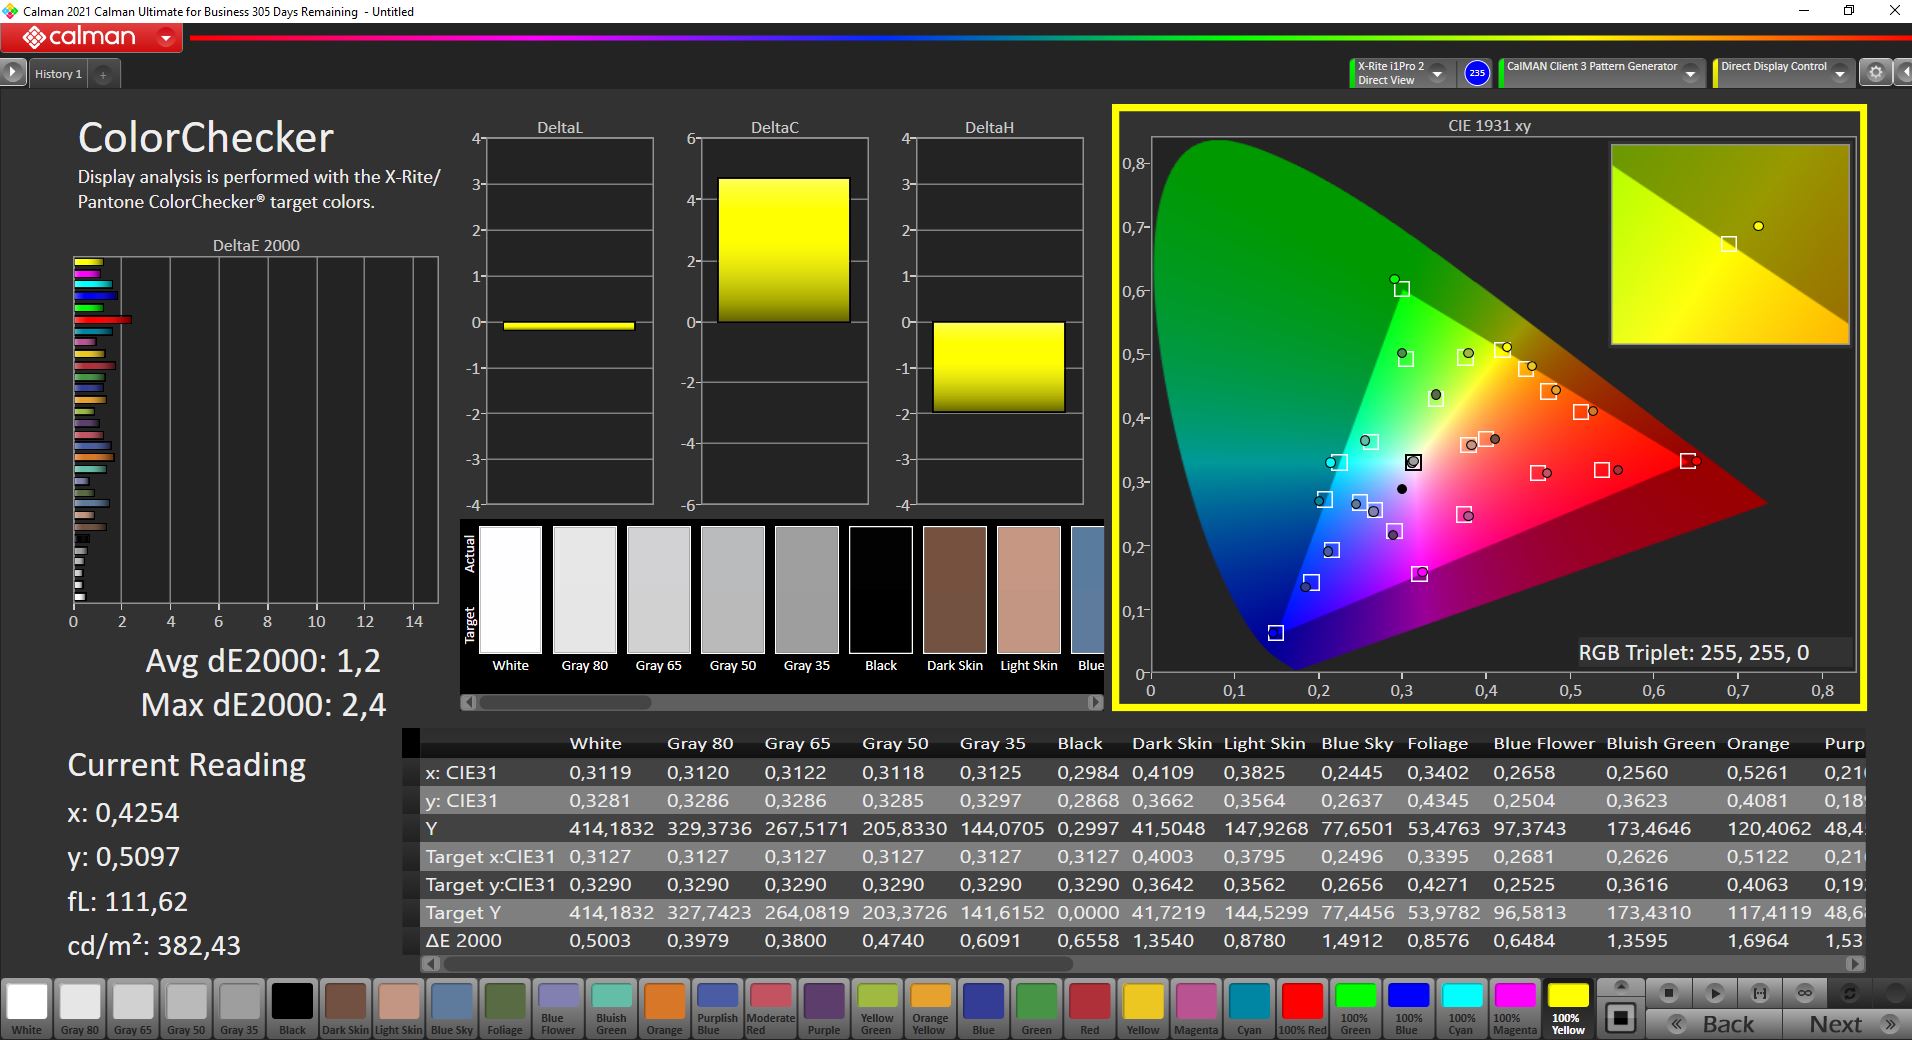
The panel covers the sRGB color space completely, but the screen should be calibrated for the best possible display quality (our calibrated profile is available for free download in the box below). The two optional 4K displays offer a larger color space coverage (AdobeRGB), but the standard WQHD panel is excellent for normal use.
| |||||||||||||||||||||||||
Brightness Distribution: 90 %
Center on Battery: 443 cd/m²
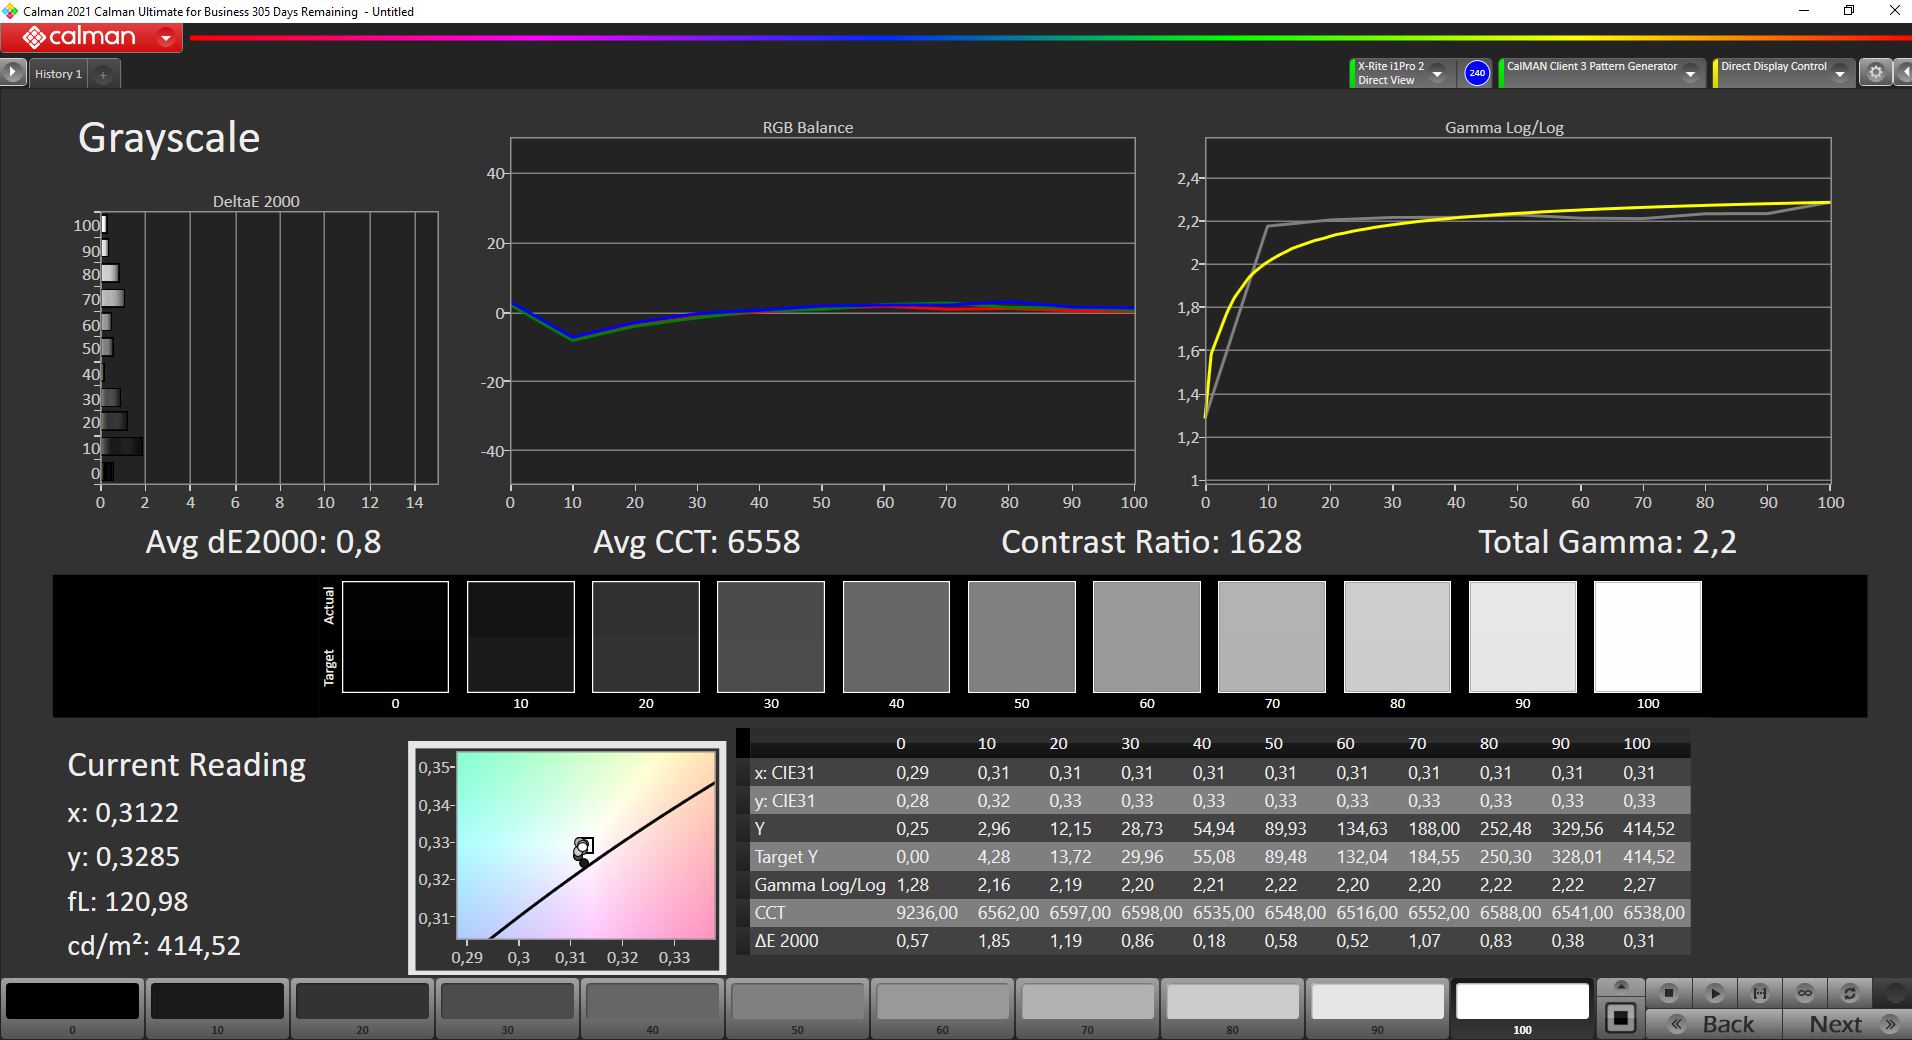
Contrast: 1633:1 (Black: 0.27 cd/m²)
ΔE Color 2.6 | 0.5-29.43 Ø5, calibrated: 1.2
ΔE Greyscale 4.5 | 0.57-98 Ø5.3
74.7% AdobeRGB 1998 (Argyll 2.2.0 3D)
99.3% sRGB (Argyll 2.2.0 3D)
72.7% Display P3 (Argyll 2.2.0 3D)
Gamma: 2.18
| Lenovo ThinkPad P1 G4-20Y4Z9DVUS NE160QDM-N63, IPS, 2560x1600, 16.00 | Lenovo ThinkPad P1 G4-20Y30017GE B160QAN02.M, IPS, 2560x1600, 16.00 | Lenovo ThinkPad P1 G4-20Y4S0KS00 LP160UQ1-SPB1, IPS LED, 3840x2400, 16.00 | Lenovo ThinkPad X1 Extreme G4-20Y5CTO1WW (3050 Ti) LP160UQ1-SPB1, IPS LED, 3840x2400, 16.00 | |
|---|---|---|---|---|
| Display | 4% | 17% | 15% | |
| Display P3 Coverage | 72.7 | 77.3 6% | 85.7 18% | 84.3 16% |
| sRGB Coverage | 99.3 | 99.9 1% | 99.4 0% | 98.3 -1% |
| AdobeRGB 1998 Coverage | 74.7 | 78.1 5% | 98.9 32% | 97.8 31% |
| Response Times | -14% | -43% | -75% | |
| Response Time Grey 50% / Grey 80% * | 40.8 | 40.8 ? -0% | 55.2 ? -35% | 60 ? -47% |
| Response Time Black / White * | 20.8 | 26.4 ? -27% | 31.2 ? -50% | 42 ? -102% |
| PWM Frequency | ||||
| Screen | -2% | 14% | 7% | |
| Brightness middle | 441 | 420 -5% | 630 43% | 639 45% |
| Brightness | 420 | 401 -5% | 622 48% | 612 46% |
| Brightness Distribution | 90 | 90 0% | 90 0% | 84 -7% |
| Black Level * | 0.27 | 0.3 -11% | 0.41 -52% | 0.47 -74% |
| Contrast | 1633 | 1400 -14% | 1537 -6% | 1360 -17% |
| Colorchecker dE 2000 * | 2.6 | 2.5 4% | 2.2 15% | 2.2 15% |
| Colorchecker dE 2000 max. * | 6 | 4.9 18% | 5 17% | 5.3 12% |
| Colorchecker dE 2000 calibrated * | 1.2 | 1.6 -33% | 1 17% | 1.4 -17% |
| Greyscale dE 2000 * | 4.5 | 3.4 24% | 2.7 40% | 1.7 62% |
| Gamma | 2.18 101% | 2.24 98% | 2.26 97% | 2.31 95% |
| CCT | 6623 98% | 6479 100% | 6886 94% | 6390 102% |
| Total Average (Program / Settings) | -4% /
-3% | -4% /
6% | -18% /
-3% |
* ... smaller is better

Display Response Times
| ↔ Response Time Black to White | ||
|---|---|---|
| 20.8 ms ... rise ↗ and fall ↘ combined | ↗ ms rise | 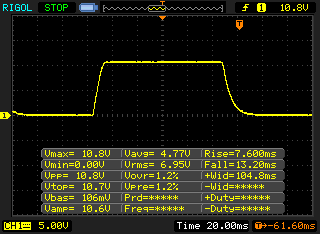 |
| ↘ ms fall | ||
| The screen shows good response rates in our tests, but may be too slow for competitive gamers. In comparison, all tested devices range from 0.1 (minimum) to 240 (maximum) ms. » 40 % of all devices are better. This means that the measured response time is similar to the average of all tested devices (21.5 ms). | ||
| ↔ Response Time 50% Grey to 80% Grey | ||
| 40.8 ms ... rise ↗ and fall ↘ combined | ↗ ms rise | 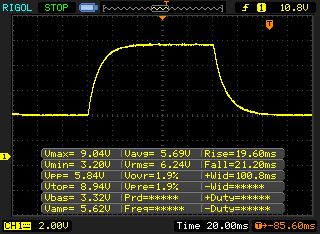 |
| ↘ ms fall | ||
| The screen shows slow response rates in our tests and will be unsatisfactory for gamers. In comparison, all tested devices range from 0.2 (minimum) to 636 (maximum) ms. » 59 % of all devices are better. This means that the measured response time is worse than the average of all tested devices (33.7 ms). | ||
Screen Flickering / PWM (Pulse-Width Modulation)
| Screen flickering / PWM not detected |  | ||
In comparison: 53 % of all tested devices do not use PWM to dim the display. If PWM was detected, an average of 17900 (minimum: 5 - maximum: 3846000) Hz was measured. | |||
Performance: ThinkPad P1 G4 finally without handbrake applied
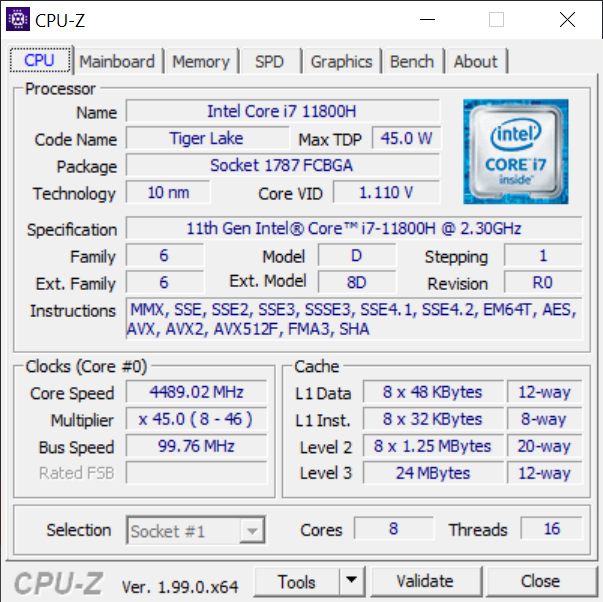

Processor: Core i7-11800H
We have now tested several versions of the ThinkPad P1 G4 and the X1 Extreme G4, and the CPU performance has been increased with each new BIOS version. In our first test, we were disappointed because the CPU settled at 40 W after a short time and was thus significantly slower than an average Core i7-11800H. However, with the latest BIOS version 1.13, these limitations are now a thing of the past and the Core i7-11800H performs very well.
The CPU performance is now comparable to the vapor chamber models and is identical to the actually faster Core i9-11950H. This shows that the optional Core i9 processor only offers a minimal performance advantage over the Core i7-11800H in the single-core tests.
In battery mode, the processor's power consumption is limited to 70 W, which leads to a small performance loss of around 15 percent. Further CPU benchmarks are available in our mobile processors comparison section.
Cinebench R15 Multi Dauertest

Cinebench R23: Multi Core | Single Core
Cinebench R20: CPU (Multi Core) | CPU (Single Core)
Cinebench R15: CPU Multi 64Bit | CPU Single 64Bit
Blender: v2.79 BMW27 CPU
7-Zip 18.03: 7z b 4 | 7z b 4 -mmt1
Geekbench 5.5: Multi-Core | Single-Core
HWBOT x265 Benchmark v2.2: 4k Preset
LibreOffice : 20 Documents To PDF
R Benchmark 2.5: Overall mean
| CPU Performance Rating | |
| Average of class Workstation | |
| Lenovo ThinkPad X1 Extreme G4-20Y50040GE -3! | |
| Lenovo ThinkPad P1 G4-20Y4S0KS00 | |
| Lenovo ThinkPad X1 Extreme G4-20Y5CTO1WW (3050 Ti) | |
| Lenovo ThinkPad P1 G4-20Y4Z9DVUS | |
| Average Intel Core i7-11800H | |
| Lenovo ThinkPad P1 G4-20Y30017GE | |
| Cinebench R23 / Multi Core | |
| Average of class Workstation (4332 - 24560, n=28, last 2 years) | |
| Lenovo ThinkPad X1 Extreme G4-20Y5CTO1WW (3050 Ti) | |
| Lenovo ThinkPad P1 G4-20Y4Z9DVUS | |
| Lenovo ThinkPad X1 Extreme G4-20Y50040GE | |
| Lenovo ThinkPad P1 G4-20Y4S0KS00 | |
| Average Intel Core i7-11800H (6508 - 14088, n=48) | |
| Lenovo ThinkPad P1 G4-20Y30017GE | |
| Cinebench R23 / Single Core | |
| Average of class Workstation (1144 - 2106, n=28, last 2 years) | |
| Lenovo ThinkPad X1 Extreme G4-20Y50040GE | |
| Lenovo ThinkPad P1 G4-20Y4S0KS00 | |
| Lenovo ThinkPad X1 Extreme G4-20Y5CTO1WW (3050 Ti) | |
| Lenovo ThinkPad P1 G4-20Y4Z9DVUS | |
| Average Intel Core i7-11800H (1386 - 1522, n=45) | |
| Lenovo ThinkPad P1 G4-20Y30017GE | |
| Cinebench R20 / CPU (Multi Core) | |
| Average of class Workstation (1669 - 9329, n=29, last 2 years) | |
| Lenovo ThinkPad P1 G4-20Y4Z9DVUS | |
| Lenovo ThinkPad X1 Extreme G4-20Y5CTO1WW (3050 Ti) | |
| Lenovo ThinkPad P1 G4-20Y4S0KS00 | |
| Lenovo ThinkPad X1 Extreme G4-20Y50040GE | |
| Average Intel Core i7-11800H (2498 - 5408, n=50) | |
| Lenovo ThinkPad P1 G4-20Y30017GE | |
| Cinebench R20 / CPU (Single Core) | |
| Average of class Workstation (528 - 816, n=29, last 2 years) | |
| Lenovo ThinkPad X1 Extreme G4-20Y50040GE | |
| Lenovo ThinkPad P1 G4-20Y4S0KS00 | |
| Lenovo ThinkPad X1 Extreme G4-20Y5CTO1WW (3050 Ti) | |
| Lenovo ThinkPad P1 G4-20Y4Z9DVUS | |
| Average Intel Core i7-11800H (520 - 586, n=47) | |
| Lenovo ThinkPad P1 G4-20Y30017GE | |
| Cinebench R15 / CPU Multi 64Bit | |
| Average of class Workstation (706 - 3625, n=28, last 2 years) | |
| Lenovo ThinkPad P1 G4-20Y4Z9DVUS | |
| Lenovo ThinkPad X1 Extreme G4-20Y50040GE | |
| Lenovo ThinkPad X1 Extreme G4-20Y50040GE | |
| Lenovo ThinkPad X1 Extreme G4-20Y5CTO1WW (3050 Ti) | |
| Lenovo ThinkPad P1 G4-20Y4S0KS00 | |
| Average Intel Core i7-11800H (1342 - 2173, n=50) | |
| Lenovo ThinkPad P1 G4-20Y30017GE | |
| Cinebench R15 / CPU Single 64Bit | |
| Average of class Workstation (166.2 - 301, n=28, last 2 years) | |
| Lenovo ThinkPad X1 Extreme G4-20Y50040GE | |
| Lenovo ThinkPad P1 G4-20Y4S0KS00 | |
| Lenovo ThinkPad P1 G4-20Y4Z9DVUS | |
| Lenovo ThinkPad X1 Extreme G4-20Y5CTO1WW (3050 Ti) | |
| Average Intel Core i7-11800H (201 - 231, n=46) | |
| Lenovo ThinkPad P1 G4-20Y30017GE | |
| Blender / v2.79 BMW27 CPU | |
| Lenovo ThinkPad P1 G4-20Y30017GE | |
| Average Intel Core i7-11800H (217 - 454, n=46) | |
| Lenovo ThinkPad P1 G4-20Y4S0KS00 | |
| Lenovo ThinkPad X1 Extreme G4-20Y5CTO1WW (3050 Ti) | |
| Lenovo ThinkPad P1 G4-20Y4Z9DVUS | |
| Average of class Workstation (137 - 684, n=28, last 2 years) | |
| 7-Zip 18.03 / 7z b 4 | |
| Average of class Workstation (20087 - 99351, n=28, last 2 years) | |
| Lenovo ThinkPad P1 G4-20Y4S0KS00 | |
| Lenovo ThinkPad P1 G4-20Y4Z9DVUS | |
| Lenovo ThinkPad X1 Extreme G4-20Y5CTO1WW (3050 Ti) | |
| Average Intel Core i7-11800H (33718 - 56758, n=46) | |
| Lenovo ThinkPad P1 G4-20Y30017GE | |
| 7-Zip 18.03 / 7z b 4 -mmt1 | |
| Average of class Workstation (4777 - 6670, n=28, last 2 years) | |
| Lenovo ThinkPad P1 G4-20Y4S0KS00 | |
| Lenovo ThinkPad X1 Extreme G4-20Y5CTO1WW (3050 Ti) | |
| Lenovo ThinkPad P1 G4-20Y4Z9DVUS | |
| Lenovo ThinkPad P1 G4-20Y30017GE | |
| Average Intel Core i7-11800H (5138 - 5732, n=46) | |
| Geekbench 5.5 / Multi-Core | |
| Average of class Workstation (5022 - 17487, n=28, last 2 years) | |
| Lenovo ThinkPad P1 G4-20Y4S0KS00 | |
| Average Intel Core i7-11800H (4655 - 9851, n=40) | |
| Lenovo ThinkPad P1 G4-20Y4Z9DVUS | |
| Lenovo ThinkPad X1 Extreme G4-20Y5CTO1WW (3050 Ti) | |
| Lenovo ThinkPad X1 Extreme G4-20Y50040GE | |
| Lenovo ThinkPad P1 G4-20Y30017GE | |
| Geekbench 5.5 / Single-Core | |
| Average of class Workstation (1474 - 2095, n=28, last 2 years) | |
| Lenovo ThinkPad P1 G4-20Y4S0KS00 | |
| Lenovo ThinkPad X1 Extreme G4-20Y50040GE | |
| Lenovo ThinkPad X1 Extreme G4-20Y5CTO1WW (3050 Ti) | |
| Lenovo ThinkPad P1 G4-20Y4Z9DVUS | |
| Average Intel Core i7-11800H (1429 - 1625, n=40) | |
| Lenovo ThinkPad P1 G4-20Y30017GE | |
| HWBOT x265 Benchmark v2.2 / 4k Preset | |
| Average of class Workstation (5.09 - 26, n=28, last 2 years) | |
| Lenovo ThinkPad P1 G4-20Y4S0KS00 | |
| Lenovo ThinkPad P1 G4-20Y4Z9DVUS | |
| Lenovo ThinkPad X1 Extreme G4-20Y50040GE | |
| Average Intel Core i7-11800H (7.38 - 17.4, n=46) | |
| Lenovo ThinkPad X1 Extreme G4-20Y5CTO1WW (3050 Ti) | |
| Lenovo ThinkPad P1 G4-20Y30017GE | |
| LibreOffice / 20 Documents To PDF | |
| Lenovo ThinkPad P1 G4-20Y4Z9DVUS | |
| Lenovo ThinkPad P1 G4-20Y30017GE | |
| Average of class Workstation (36.5 - 95.2, n=28, last 2 years) | |
| Average Intel Core i7-11800H (38.6 - 59.9, n=45) | |
| Lenovo ThinkPad P1 G4-20Y4S0KS00 | |
| Lenovo ThinkPad X1 Extreme G4-20Y5CTO1WW (3050 Ti) | |
| Lenovo ThinkPad X1 Extreme G4-20Y50040GE | |
| R Benchmark 2.5 / Overall mean | |
| Lenovo ThinkPad P1 G4-20Y30017GE | |
| Average Intel Core i7-11800H (0.548 - 0.615, n=46) | |
| Lenovo ThinkPad P1 G4-20Y4Z9DVUS | |
| Lenovo ThinkPad X1 Extreme G4-20Y5CTO1WW (3050 Ti) | |
| Lenovo ThinkPad X1 Extreme G4-20Y50040GE | |
| Lenovo ThinkPad P1 G4-20Y4S0KS00 | |
| Average of class Workstation (0.3876 - 0.544, n=28, last 2 years) | |
* ... smaller is better
AIDA64: FP32 Ray-Trace | FPU Julia | CPU SHA3 | CPU Queen | FPU SinJulia | FPU Mandel | CPU AES | CPU ZLib | FP64 Ray-Trace | CPU PhotoWorxx
| Performance Rating | |
| Average of class Workstation | |
| Lenovo ThinkPad X1 Extreme G4-20Y50040GE | |
| Lenovo ThinkPad X1 Extreme G4-20Y5CTO1WW (3050 Ti) | |
| Lenovo ThinkPad P1 G4-20Y4Z9DVUS | |
| Average Intel Core i7-11800H | |
| Lenovo ThinkPad P1 G4-20Y30017GE -9! | |
| Lenovo ThinkPad P1 G4-20Y4S0KS00 -9! | |
| AIDA64 / FP32 Ray-Trace | |
| Average of class Workstation (2619 - 25776, n=28, last 2 years) | |
| Lenovo ThinkPad X1 Extreme G4-20Y50040GE | |
| Lenovo ThinkPad P1 G4-20Y4Z9DVUS | |
| Lenovo ThinkPad X1 Extreme G4-20Y5CTO1WW (3050 Ti) | |
| Average Intel Core i7-11800H (8772 - 15961, n=20) | |
| AIDA64 / FPU Julia | |
| Average of class Workstation (12909 - 109059, n=28, last 2 years) | |
| Lenovo ThinkPad P1 G4-20Y4Z9DVUS | |
| Lenovo ThinkPad X1 Extreme G4-20Y50040GE | |
| Lenovo ThinkPad X1 Extreme G4-20Y5CTO1WW (3050 Ti) | |
| Average Intel Core i7-11800H (39404 - 65636, n=20) | |
| AIDA64 / CPU SHA3 | |
| Lenovo ThinkPad X1 Extreme G4-20Y50040GE | |
| Lenovo ThinkPad P1 G4-20Y4Z9DVUS | |
| Lenovo ThinkPad X1 Extreme G4-20Y5CTO1WW (3050 Ti) | |
| Average Intel Core i7-11800H (2599 - 4439, n=20) | |
| Average of class Workstation (824 - 4981, n=28, last 2 years) | |
| AIDA64 / CPU Queen | |
| Lenovo ThinkPad X1 Extreme G4-20Y50040GE | |
| Average of class Workstation (26716 - 131931, n=28, last 2 years) | |
| Lenovo ThinkPad X1 Extreme G4-20Y5CTO1WW (3050 Ti) | |
| Lenovo ThinkPad P1 G4-20Y4Z9DVUS | |
| Average Intel Core i7-11800H (85233 - 91941, n=20) | |
| AIDA64 / FPU SinJulia | |
| Lenovo ThinkPad X1 Extreme G4-20Y50040GE | |
| Average of class Workstation (3105 - 14742, n=28, last 2 years) | |
| Lenovo ThinkPad X1 Extreme G4-20Y5CTO1WW (3050 Ti) | |
| Lenovo ThinkPad P1 G4-20Y4Z9DVUS | |
| Average Intel Core i7-11800H (6420 - 9792, n=20) | |
| AIDA64 / FPU Mandel | |
| Average of class Workstation (6967 - 58181, n=28, last 2 years) | |
| Lenovo ThinkPad X1 Extreme G4-20Y50040GE | |
| Lenovo ThinkPad P1 G4-20Y4Z9DVUS | |
| Lenovo ThinkPad X1 Extreme G4-20Y5CTO1WW (3050 Ti) | |
| Average Intel Core i7-11800H (23365 - 39464, n=20) | |
| AIDA64 / CPU AES | |
| Lenovo ThinkPad X1 Extreme G4-20Y50040GE | |
| Lenovo ThinkPad X1 Extreme G4-20Y5CTO1WW (3050 Ti) | |
| Average Intel Core i7-11800H (74617 - 149388, n=20) | |
| Lenovo ThinkPad P1 G4-20Y4Z9DVUS | |
| Average of class Workstation (19489 - 132156, n=28, last 2 years) | |
| AIDA64 / CPU ZLib | |
| Average of class Workstation (314 - 1472, n=28, last 2 years) | |
| Lenovo ThinkPad X1 Extreme G4-20Y50040GE | |
| Lenovo ThinkPad P1 G4-20Y4Z9DVUS | |
| Lenovo ThinkPad X1 Extreme G4-20Y5CTO1WW (3050 Ti) | |
| Average Intel Core i7-11800H (461 - 830, n=43) | |
| Lenovo ThinkPad P1 G4-20Y30017GE | |
| Lenovo ThinkPad P1 G4-20Y4S0KS00 | |
| AIDA64 / FP64 Ray-Trace | |
| Average of class Workstation (1473 - 13800, n=28, last 2 years) | |
| Lenovo ThinkPad X1 Extreme G4-20Y50040GE | |
| Lenovo ThinkPad P1 G4-20Y4Z9DVUS | |
| Lenovo ThinkPad X1 Extreme G4-20Y5CTO1WW (3050 Ti) | |
| Average Intel Core i7-11800H (4545 - 8717, n=21) | |
| AIDA64 / CPU PhotoWorxx | |
| Average of class Workstation (18157 - 51637, n=28, last 2 years) | |
| Average Intel Core i7-11800H (11898 - 26757, n=21) | |
| Lenovo ThinkPad X1 Extreme G4-20Y5CTO1WW (3050 Ti) | |
| Lenovo ThinkPad P1 G4-20Y4Z9DVUS | |
| Lenovo ThinkPad X1 Extreme G4-20Y50040GE | |
CrossMark: Overall | Productivity | Creativity | Responsiveness
| PCMark 10 / Score | |
| Lenovo ThinkPad P1 G4-20Y4S0KS00 | |
| Lenovo ThinkPad X1 Extreme G4-20Y50040GE | |
| Average of class Workstation (5488 - 8587, n=27, last 2 years) | |
| Lenovo ThinkPad X1 Extreme G4-20Y5CTO1WW (3050 Ti) | |
| Lenovo ThinkPad P1 G4-20Y4Z9DVUS | |
| Average Intel Core i7-11800H, NVIDIA T1200 Laptop GPU (5889 - 6147, n=3) | |
| Lenovo ThinkPad P1 G4-20Y30017GE | |
| PCMark 10 / Essentials | |
| Lenovo ThinkPad P1 G4-20Y4S0KS00 | |
| Lenovo ThinkPad X1 Extreme G4-20Y5CTO1WW (3050 Ti) | |
| Average of class Workstation (9151 - 12197, n=27, last 2 years) | |
| Lenovo ThinkPad X1 Extreme G4-20Y50040GE | |
| Lenovo ThinkPad P1 G4-20Y4Z9DVUS | |
| Average Intel Core i7-11800H, NVIDIA T1200 Laptop GPU (9776 - 9956, n=3) | |
| Lenovo ThinkPad P1 G4-20Y30017GE | |
| PCMark 10 / Productivity | |
| Average of class Workstation (7846 - 10820, n=27, last 2 years) | |
| Lenovo ThinkPad P1 G4-20Y4S0KS00 | |
| Lenovo ThinkPad X1 Extreme G4-20Y50040GE | |
| Lenovo ThinkPad X1 Extreme G4-20Y5CTO1WW (3050 Ti) | |
| Lenovo ThinkPad P1 G4-20Y30017GE | |
| Average Intel Core i7-11800H, NVIDIA T1200 Laptop GPU (8276 - 8445, n=3) | |
| Lenovo ThinkPad P1 G4-20Y4Z9DVUS | |
| PCMark 10 / Digital Content Creation | |
| Lenovo ThinkPad P1 G4-20Y4S0KS00 | |
| Lenovo ThinkPad X1 Extreme G4-20Y50040GE | |
| Average of class Workstation (5399 - 13947, n=27, last 2 years) | |
| Lenovo ThinkPad X1 Extreme G4-20Y5CTO1WW (3050 Ti) | |
| Lenovo ThinkPad P1 G4-20Y4Z9DVUS | |
| Average Intel Core i7-11800H, NVIDIA T1200 Laptop GPU (6851 - 7581, n=3) | |
| Lenovo ThinkPad P1 G4-20Y30017GE | |
| CrossMark / Overall | |
| Average of class Workstation (1154 - 1972, n=27, last 2 years) | |
| Lenovo ThinkPad X1 Extreme G4-20Y50040GE | |
| Lenovo ThinkPad P1 G4-20Y4S0KS00 | |
| Lenovo ThinkPad P1 G4-20Y4Z9DVUS | |
| Average Intel Core i7-11800H, NVIDIA T1200 Laptop GPU (1367 - 1526, n=2) | |
| CrossMark / Productivity | |
| Lenovo ThinkPad X1 Extreme G4-20Y50040GE | |
| Average of class Workstation (1188 - 1842, n=27, last 2 years) | |
| Lenovo ThinkPad P1 G4-20Y4S0KS00 | |
| Lenovo ThinkPad P1 G4-20Y4Z9DVUS | |
| Average Intel Core i7-11800H, NVIDIA T1200 Laptop GPU (1389 - 1521, n=2) | |
| CrossMark / Creativity | |
| Average of class Workstation (1180 - 2248, n=27, last 2 years) | |
| Lenovo ThinkPad P1 G4-20Y4S0KS00 | |
| Lenovo ThinkPad X1 Extreme G4-20Y50040GE | |
| Lenovo ThinkPad P1 G4-20Y4Z9DVUS | |
| Average Intel Core i7-11800H, NVIDIA T1200 Laptop GPU (1430 - 1606, n=2) | |
| CrossMark / Responsiveness | |
| Lenovo ThinkPad X1 Extreme G4-20Y50040GE | |
| Lenovo ThinkPad P1 G4-20Y4S0KS00 | |
| Average of class Workstation (990 - 1865, n=27, last 2 years) | |
| Lenovo ThinkPad P1 G4-20Y4Z9DVUS | |
| Average Intel Core i7-11800H, NVIDIA T1200 Laptop GPU (1137 - 1323, n=2) | |
| PCMark 10 Score | 6147 points | |
Help | ||
| AIDA64 / Memory Copy | |
| Average of class Workstation (30324 - 95718, n=28, last 2 years) | |
| Average Intel Core i7-11800H (24508 - 48144, n=21) | |
| Lenovo ThinkPad P1 G4-20Y4Z9DVUS | |
| Lenovo ThinkPad X1 Extreme G4-20Y5CTO1WW (3050 Ti) | |
| Lenovo ThinkPad X1 Extreme G4-20Y50040GE | |
| AIDA64 / Memory Read | |
| Average of class Workstation (30787 - 85570, n=28, last 2 years) | |
| Average Intel Core i7-11800H (25882 - 50365, n=20) | |
| Lenovo ThinkPad X1 Extreme G4-20Y5CTO1WW (3050 Ti) | |
| Lenovo ThinkPad P1 G4-20Y4Z9DVUS | |
| Lenovo ThinkPad X1 Extreme G4-20Y50040GE | |
| AIDA64 / Memory Write | |
| Average of class Workstation (32728 - 93871, n=28, last 2 years) | |
| Average Intel Core i7-11800H (22240 - 46214, n=20) | |
| Lenovo ThinkPad X1 Extreme G4-20Y5CTO1WW (3050 Ti) | |
| Lenovo ThinkPad P1 G4-20Y4Z9DVUS | |
| Lenovo ThinkPad X1 Extreme G4-20Y50040GE | |
| AIDA64 / Memory Latency | |
| Average of class Workstation (83.4 - 139.3, n=28, last 2 years) | |
| Lenovo ThinkPad X1 Extreme G4-20Y50040GE | |
| Lenovo ThinkPad X1 Extreme G4-20Y5CTO1WW (3050 Ti) | |
| Lenovo ThinkPad P1 G4-20Y4Z9DVUS | |
| Average Intel Core i7-11800H (71.9 - 104.1, n=44) | |
| Lenovo ThinkPad P1 G4-20Y30017GE | |
| Lenovo ThinkPad P1 G4-20Y4S0KS00 | |
* ... smaller is better
DPC latencies
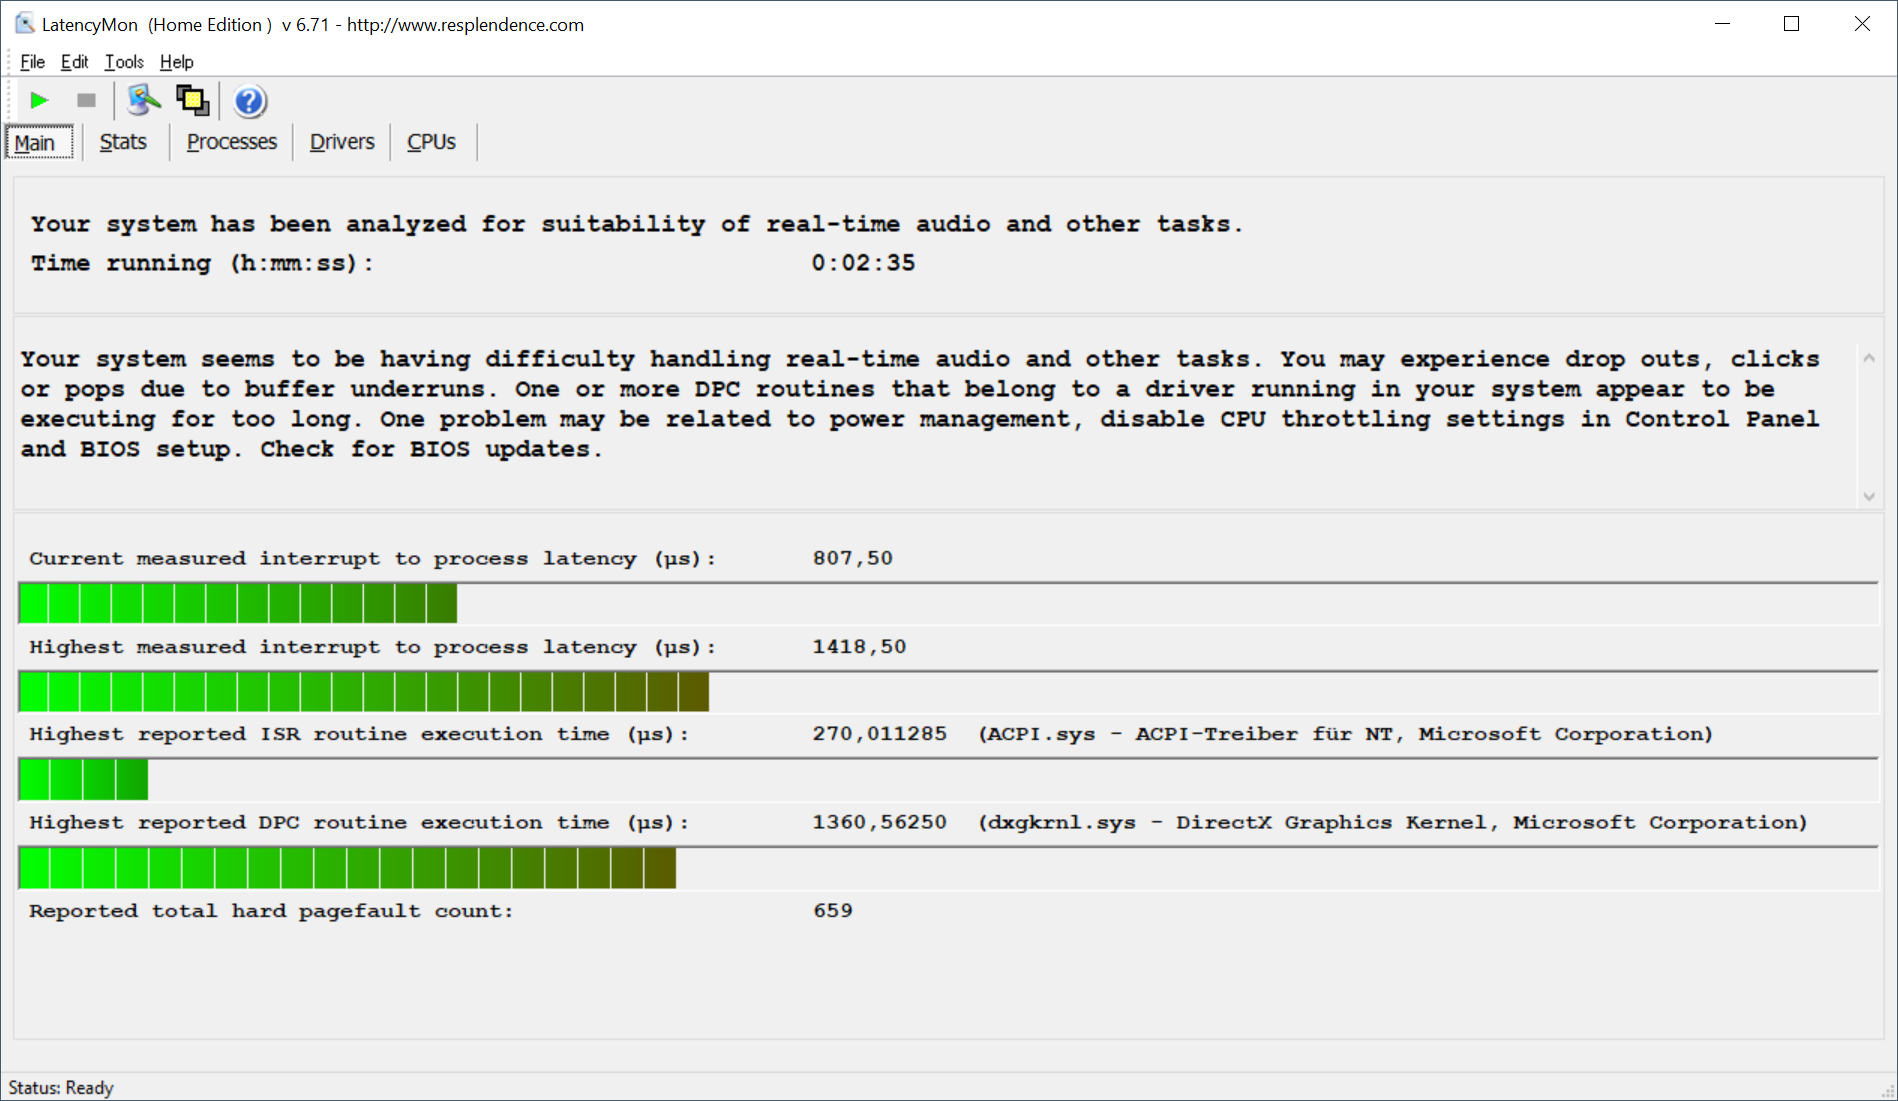
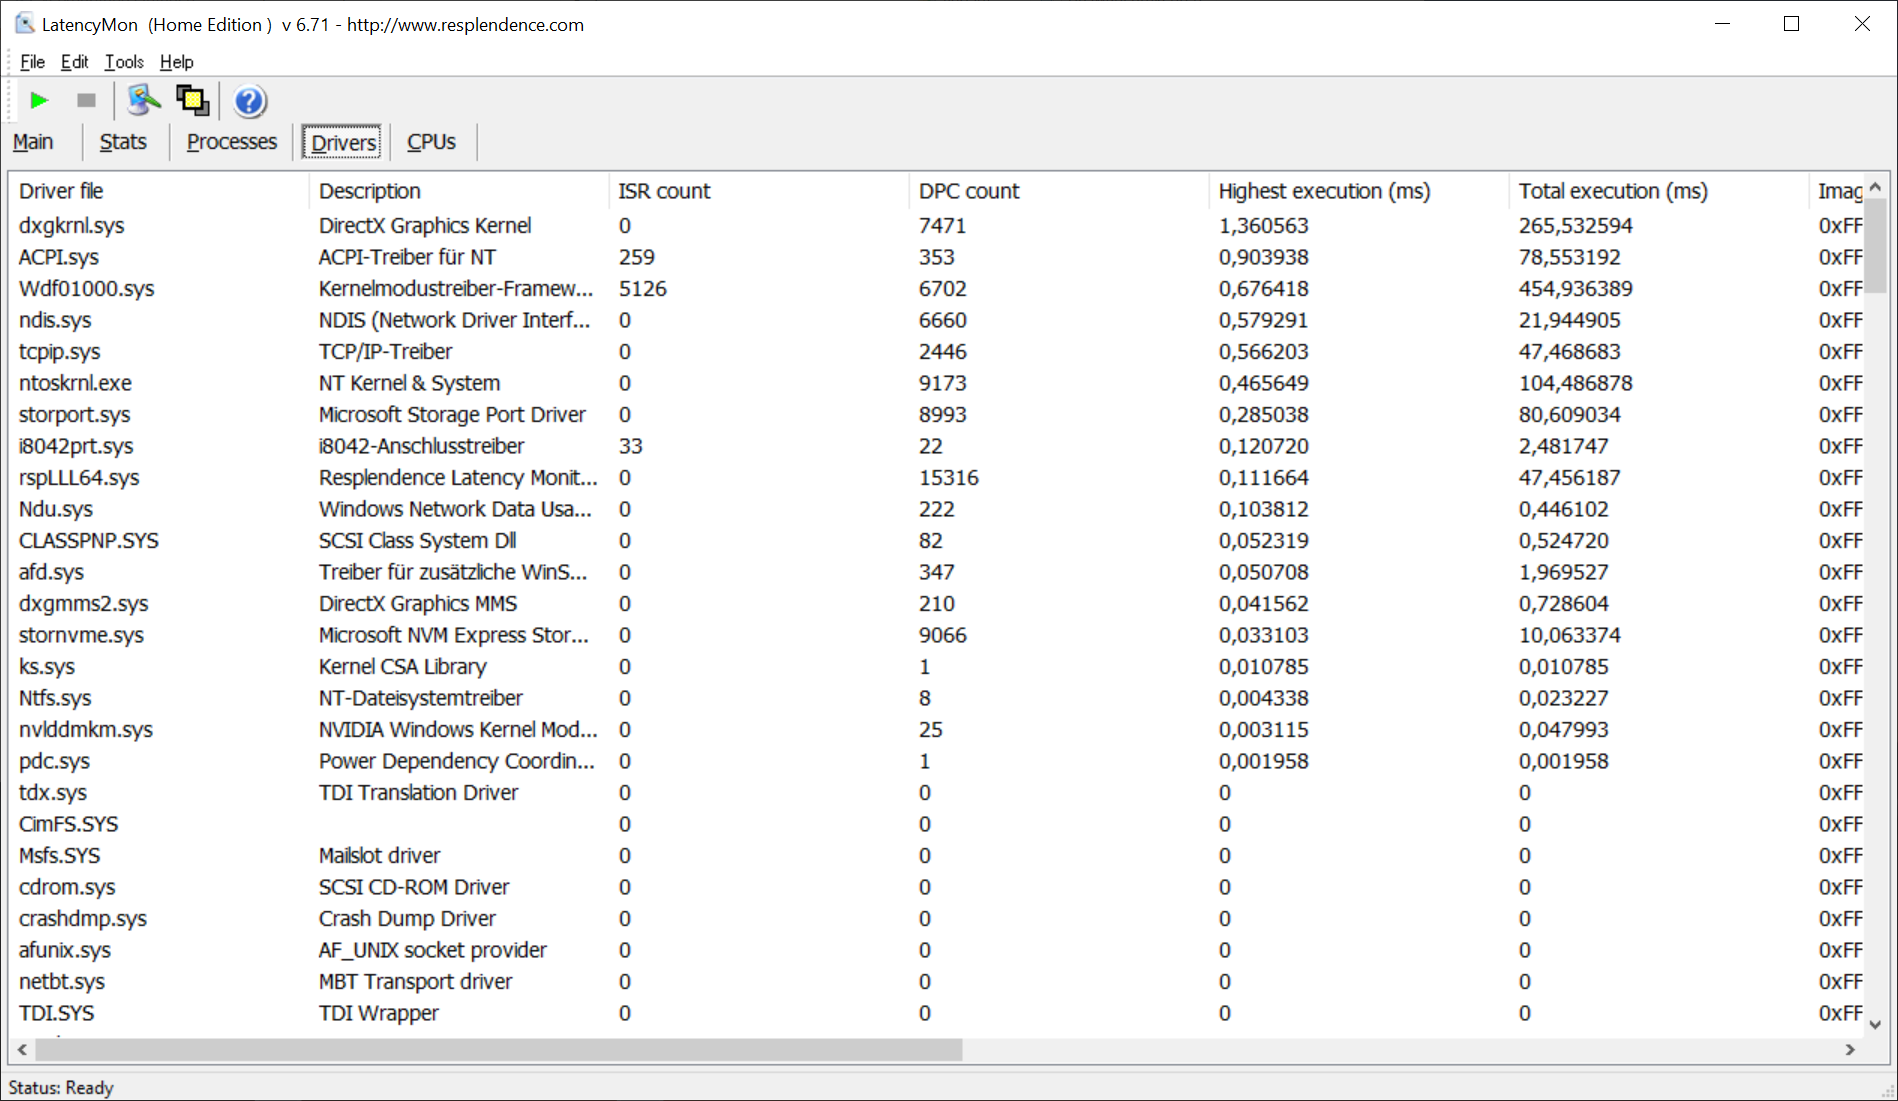
| DPC Latencies / LatencyMon - interrupt to process latency (max), Web, Youtube, Prime95 | |
| Lenovo ThinkPad P1 G4-20Y30017GE | |
| Lenovo ThinkPad X1 Extreme G4-20Y50040GE | |
| Lenovo ThinkPad P1 G4-20Y4Z9DVUS | |
| Lenovo ThinkPad X1 Extreme G4-20Y5CTO1WW (3050 Ti) | |
| Lenovo ThinkPad P1 G4-20Y4S0KS00 | |
* ... smaller is better

Graphics card: Nvidia T1200 with 60 W
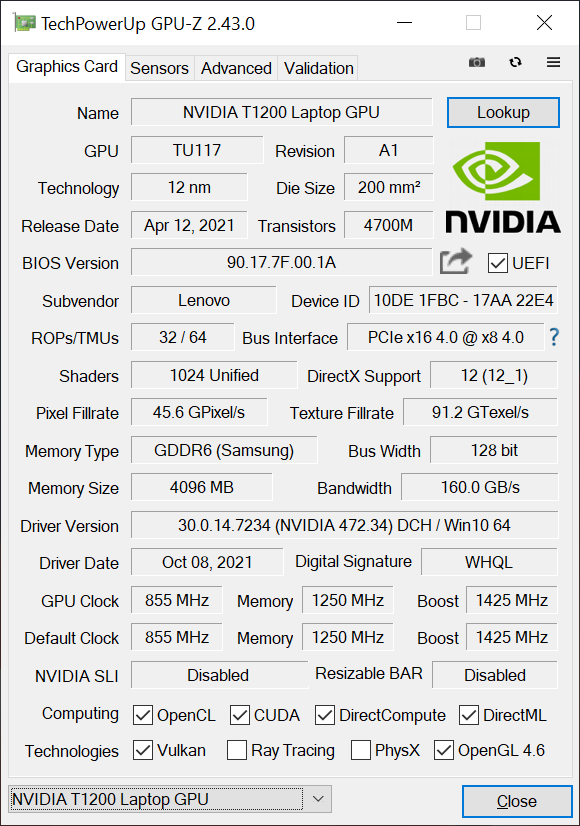
The performance of the graphics card has not changed due to the BIOS updates. Nvidia's professional T1200 GPU (based on the TU117 chip of the consumer GeForce GTX 1650 Ti) is still allowed to consume a maximum of 60 W, and the results in the benchmarks are unsurprisingly on the same level as before. In professional benchmarks, you can still see the advantage of professional drivers because even the RTX 3070 can be overtaken in some scenarios.
The performance remains stable even under longer loads, and the demanding Time Spy stress test is passed without problems with a score of 99.2%. This also applies to our gaming stress test with The Witcher 3 wherein the performance remains completely stable. The GPU is allowed to consume a maximum of 35 W in battery mode, which is why the graphics performance drops by about 15%.
Further GPU benchmarks are available here.
| 3DMark 11 Performance | 14344 points | |
| 3DMark Fire Strike Score | 9310 points | |
| 3DMark Time Spy Score | 3937 points | |
Help | ||
The Witcher 3 FPS chart

| low | med. | high | ultra | QHD | |
| The Witcher 3 (2015) | 198 | 125 | 71 | 36.7 | |
| Dota 2 Reborn (2015) | 157 | 138 | 128 | 116 | |
| Final Fantasy XV Benchmark (2018) | 102 | 56.5 | 39 | 26.6 | |
| X-Plane 11.11 (2018) | 109 | 94 | 75.6 |
Emissions & Energy
Noise emissions
The fan characteristics have not changed. The two fans still quickly reach their maximum speed under load, which corresponds to a noise level of ~47 dB(A). We could not detect any disturbing electronic noises or coil whine in this test device.
| Lenovo ThinkPad P1 G4-20Y4Z9DVUS T1200 Laptop GPU, i7-11800H, Samsung PM9A1 MZVL2512HCJQ | Lenovo ThinkPad P1 G4-20Y30017GE T1200 Laptop GPU, i7-11800H, Samsung PM9A1 MZVL2512HCJQ | Lenovo ThinkPad P1 G4-20Y4S0KS00 GeForce RTX 3070 Laptop GPU, i7-11850H, Samsung PM9A1 MZVL21T0HCLR | Lenovo ThinkPad X1 Extreme G4-20Y5CTO1WW (3050 Ti) GeForce RTX 3050 Ti Laptop GPU, i7-11800H, Samsung PM9A1 MZVL21T0HCLR | Lenovo ThinkPad X1 Extreme G4-20Y50040GE GeForce RTX 3080 Laptop GPU, i9-11950H, Kioxia XG7 KXG7AZNV1T02 | |
|---|---|---|---|---|---|
| Noise | 0% | 2% | 1% | -2% | |
| off / environment * | 24.3 | 24.3 -0% | 23.8 2% | 23.52 3% | 24.7 -2% |
| Idle Minimum * | 24.3 | 24.3 -0% | 23.8 2% | 23.52 3% | 24.7 -2% |
| Idle Average * | 24.3 | 24.3 -0% | 23.8 2% | 23.52 3% | 24.7 -2% |
| Idle Maximum * | 26.6 | 26.6 -0% | 28.3 -6% | 23.52 12% | 28.1 -6% |
| Load Average * | 46.8 | 46.8 -0% | 38.6 18% | 42.9 8% | 42.5 9% |
| Witcher 3 ultra * | 46.8 | 46.8 -0% | 47.4 -1% | 52.5 -12% | 46.4 1% |
| Load Maximum * | 46.8 | 46.8 -0% | 47.4 -1% | 52.45 -12% | 52.1 -11% |
* ... smaller is better
Temperature
Surface temperatures under load are now slightly higher than before as the power consumption of the components under combined load has shifted a bit. The dedicated GPU was clearly prioritized in the stress test in our preview review, and it continued to run at 60 W, which is why the processor was throttled to just 20 W. With the latest BIOS 1.13, this ratio has now shifted and the processor settles at 35 W after a few minutes, while the Nvidia T1200 now runs at 45 W.

(-) The maximum temperature on the upper side is 49.9 °C / 122 F, compared to the average of 38.1 °C / 101 F, ranging from 22.2 to 69.8 °C for the class Workstation.
(-) The bottom heats up to a maximum of 56.7 °C / 134 F, compared to the average of 41.3 °C / 106 F
(+) In idle usage, the average temperature for the upper side is 24.9 °C / 77 F, compared to the device average of 32 °C / 90 F.
(+) The palmrests and touchpad are reaching skin temperature as a maximum (33.9 °C / 93 F) and are therefore not hot.
(-) The average temperature of the palmrest area of similar devices was 27.8 °C / 82 F (-6.1 °C / -11 F).
| Lenovo ThinkPad P1 G4-20Y4Z9DVUS Intel Core i7-11800H, NVIDIA T1200 Laptop GPU | Lenovo ThinkPad X1 Extreme G4-20Y5CTO1WW (3050 Ti) Intel Core i7-11800H, NVIDIA GeForce RTX 3050 Ti Laptop GPU | Lenovo ThinkPad X1 Extreme G4-20Y50040GE Intel Core i9-11950H, NVIDIA GeForce RTX 3080 Laptop GPU | Lenovo ThinkPad P1 G4-20Y30017GE Intel Core i7-11800H, NVIDIA T1200 Laptop GPU | Lenovo ThinkPad P1 G4-20Y4S0KS00 Intel Core i7-11850H, NVIDIA GeForce RTX 3070 Laptop GPU | |
|---|---|---|---|---|---|
| Heat | -4% | -5% | 2% | -5% | |
| Maximum Upper Side * | 49.9 | 49 2% | 51.4 -3% | 50.6 -1% | 51 -2% |
| Maximum Bottom * | 56.7 | 44.4 22% | 55.9 1% | 53.6 5% | 53.5 6% |
| Idle Upper Side * | 25.5 | 32.1 -26% | 27.2 -7% | 25 2% | 28.8 -13% |
| Idle Bottom * | 26.2 | 29.8 -14% | 28.8 -10% | 25.7 2% | 29.3 -12% |
* ... smaller is better
Loudspeaker
Lenovo ThinkPad P1 G4-20Y4Z9DVUS audio analysis
(+) | speakers can play relatively loud (84.3 dB)
Bass 100 - 315 Hz
(±) | reduced bass - on average 12.2% lower than median
(±) | linearity of bass is average (9.8% delta to prev. frequency)
Mids 400 - 2000 Hz
(+) | balanced mids - only 3.5% away from median
(+) | mids are linear (3.4% delta to prev. frequency)
Highs 2 - 16 kHz
(+) | balanced highs - only 2.9% away from median
(+) | highs are linear (5% delta to prev. frequency)
Overall 100 - 16.000 Hz
(+) | overall sound is linear (11.8% difference to median)
Compared to same class
» 10% of all tested devices in this class were better, 3% similar, 88% worse
» The best had a delta of 7%, average was 18%, worst was 35%
Compared to all devices tested
» 6% of all tested devices were better, 2% similar, 92% worse
» The best had a delta of 4%, average was 25%, worst was 134%
Energy consumption
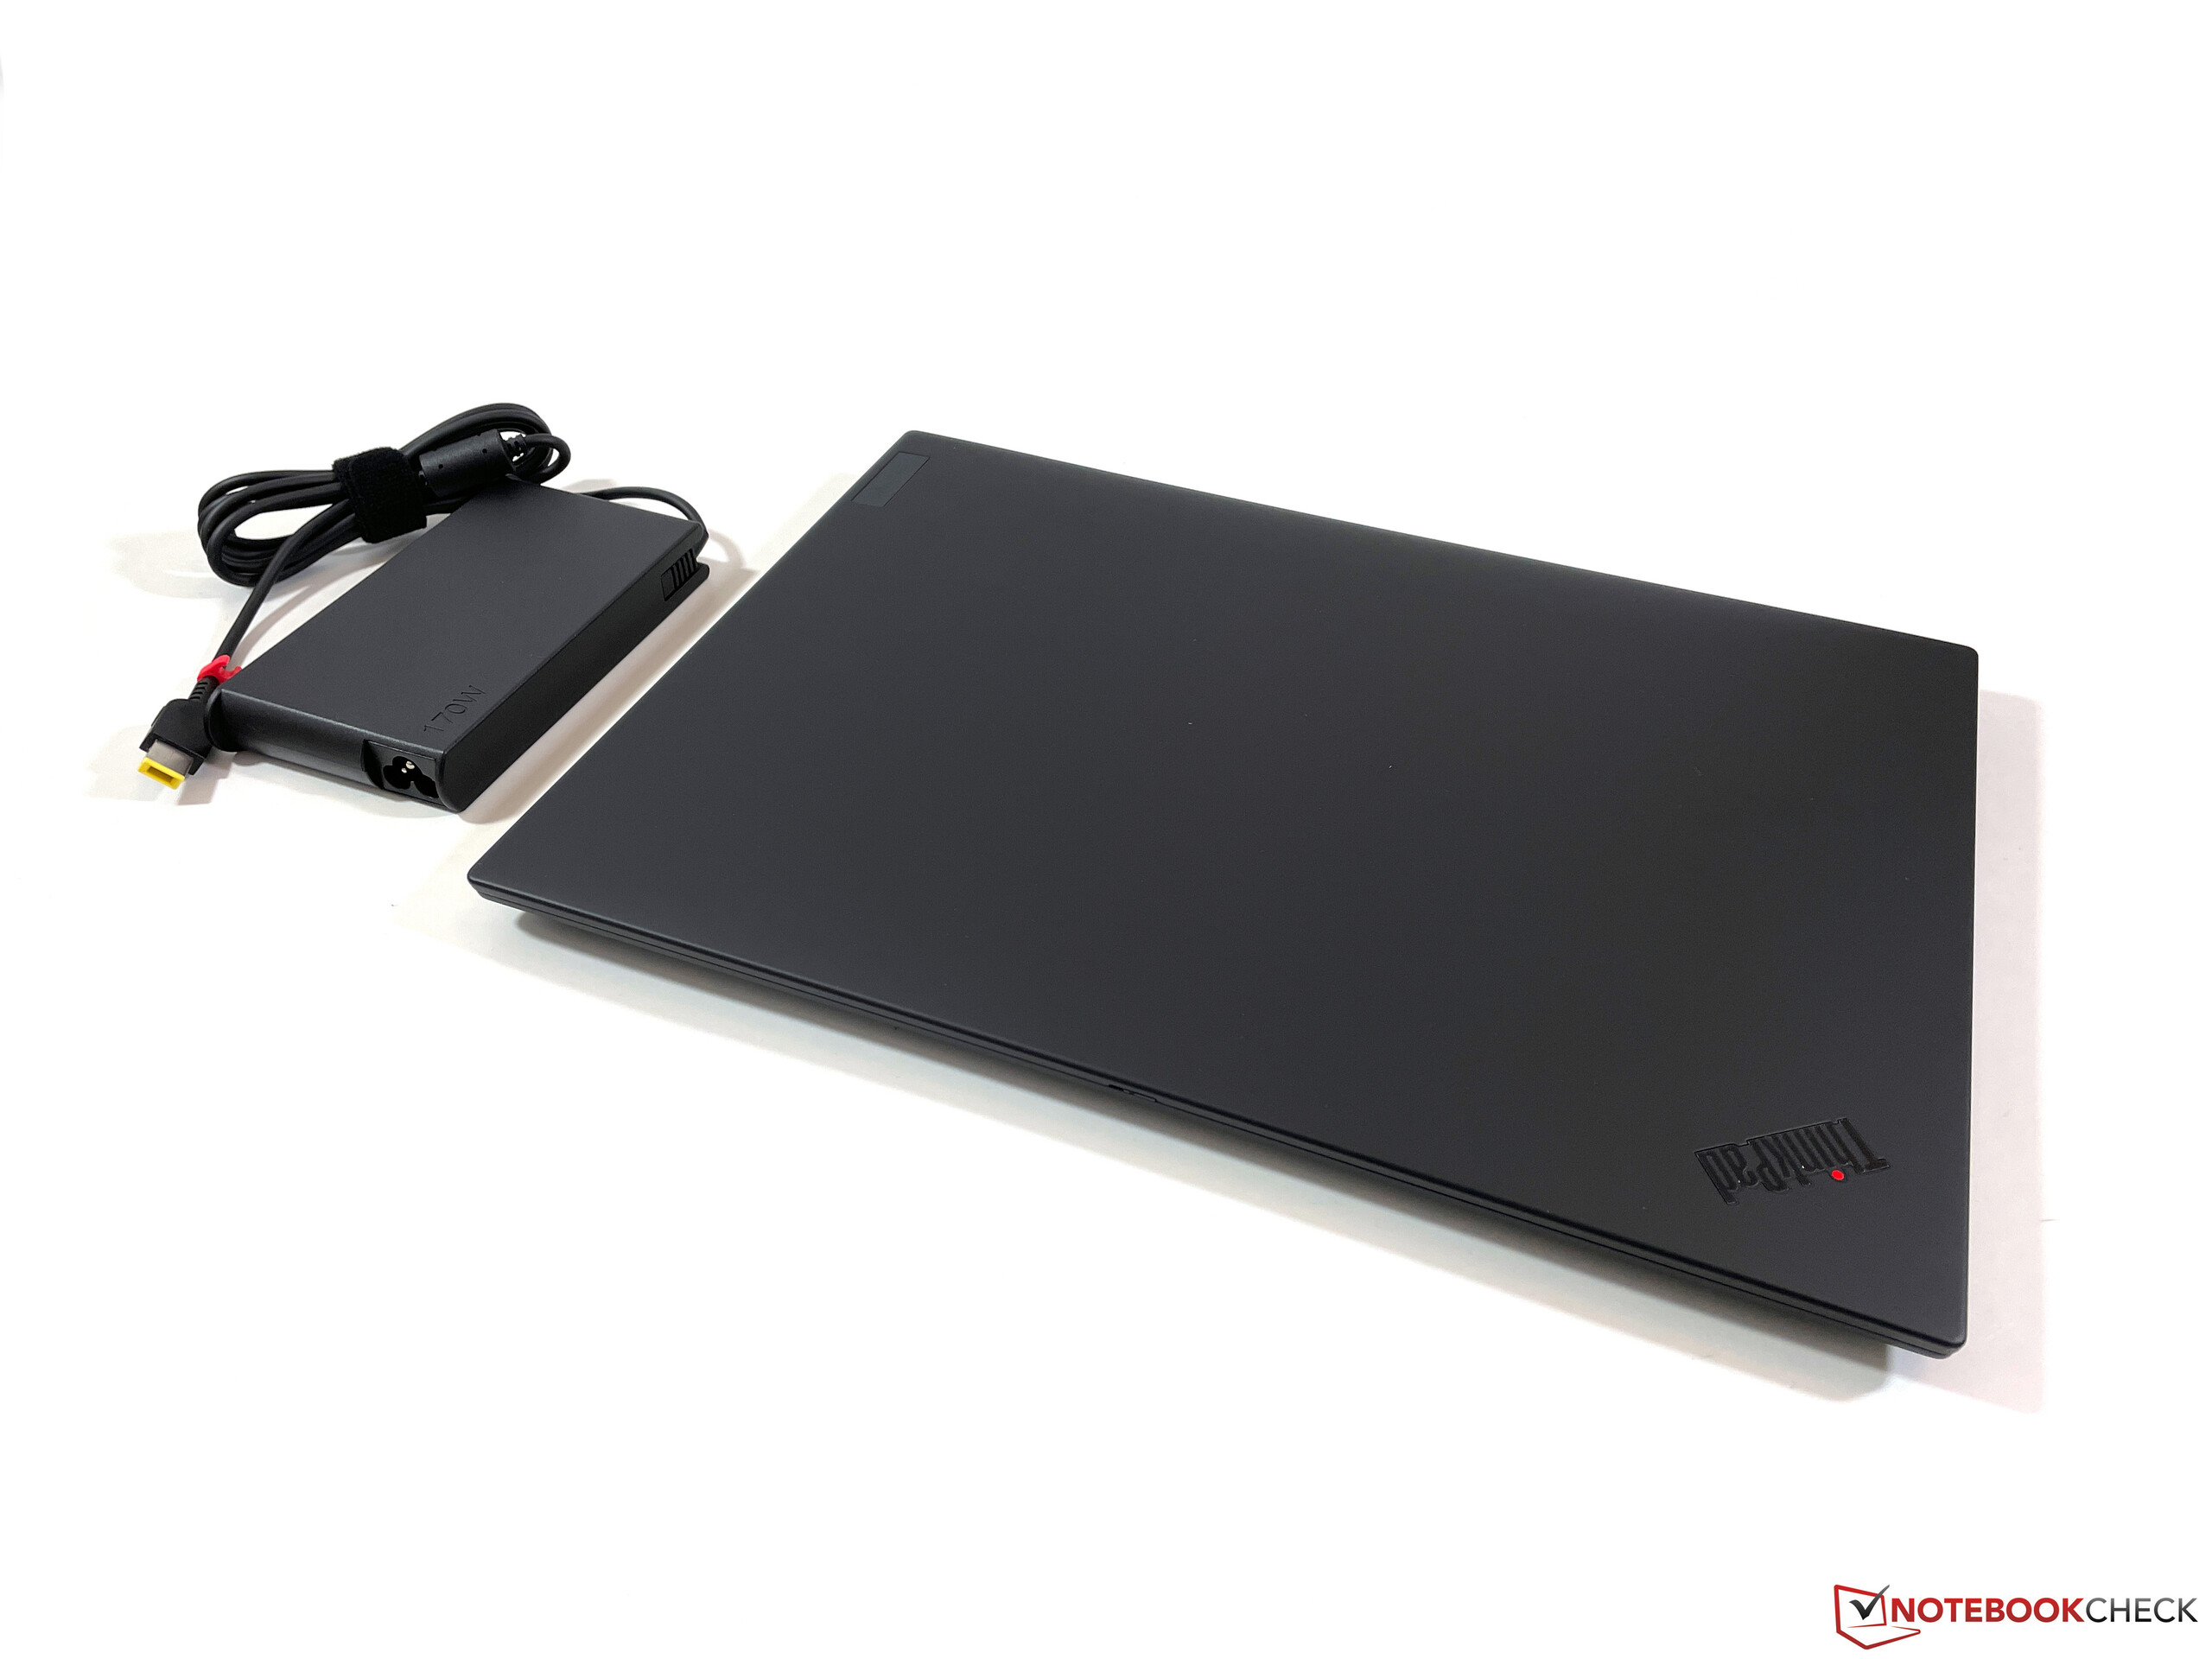
The power consumption under load is now significantly higher when the CPU is subjected to greater stress. In the stress test, we determine a maximum of 170.8 W at the beginning of the test, but the value first settles at 122 W for a few minutes and then at 111 W, which is in line with the decreasing TDP of the processor. The standby consumption of slightly north of 2 W is still too high.
| Off / Standby | |
| Idle | |
| Load |
|
Energieaufnahme Witcher 3 / Stresstest
Energieaufnahme mit externem Monitor
Battery life
The battery run times are practically identical to the first review unit of the ThinkPad P1 G4. At a brightness of 150 cd/m² (corresponds to 68% of maximum brightness in this case), our WLAN test runs for just under 9 hours and at maximum brightness for just over 6 hours. Thus, the standard WQHD panel clearly remains the better choice over the optional 4K panels when it comes to endurance.
Pros
Cons
Verdict - ThinkPad P1 G4 now with more CPU power
Lenovo has now noticeably improved the CPU performance with the latest BIOS version, and it no longer matters whether you choose a configuration with conventional cooling or a model with a stronger GPU and the vapor chamber cooling. Under combined load, the graphics card performance is similar in both versions, whereas the processor with the conventional cooling even has a slight advantage (35 vs. 30 W in the stress test).
Furthermore, our benchmarks also clearly show that the optional Core i9 CPUs do not provide any additional performance compared to the standard Core i7-11800H. The only reason for an upgrade in our eyes is the vPro support that the optional chips offer.
With the latest BIOS 1.13, it no longer matters whether you choose a configuration with conventional or vapor chamber cooling since the CPU performance is more or less on the same level.
The fact that Lenovo relies on several suppliers for the standard WQHD panel is not a big problem for the customer in this case because the performance of the two panels is very comparable, and you will not notice a difference in practice. Thus, you need not worry of a panel lottery like in some older ThinkPad models.
Price and availability
Our test device is immediately available at Campuspoint for 2,419 Euros. The retailer also has access to Lenovo's campus program, which can get you this configuration for 2,279 Euro.
Lenovo ThinkPad P1 G4-20Y4Z9DVUS
-
02/01/2022 v7
Andreas Osthoff
More articles related to this device
Lenovo ThinkPad P1 G4-20Y4Z9DVUS (ThinkPad P1 G4 Series)Related Articles

Pricecompare

