

Intel Core i7-13620H vs Intel Core i5-14501E vs Intel Core i5-13500
Intel Core i7-13620H
► remove from comparisonThe Intel Core i7-13620H is a high-end mobile CPU for laptops of the Raptor Lake-H series (based on the Alder Lake architecture). It was announced in early 2023 and offers 6 performance cores (P-cores, Golden Cove architecture) and 4 of the 8 efficient cores (E-cores, Gracemont architecture). The P-cores support Hyper-Threading leading to 16 supported threads when combined with the E-cores. The clock rate ranges from 2.4 to 4.9 GHz (single-core boost, all-core boost up to 4.7 GHz) on the performance cluster and 1.8 to 3.6 GHz on the efficient cluster. The performance of the E-cores should be similar to old Skylake cores (compare to the Core i7-6700HQ). All cores can use up to 24 MB L3 cache. Compared to the older i7-12650H, the 13620H offers higher clock speeds.
Performance
Thanks to the improved clock speeds, the i7-13620H should be able to clearly best the old i7-12650H. Still, the faster i7 models of the 13th gen offer more e-Cores and therefore a clearly better multi-threaded performance.
Features
The integrated memory controller supports various memory types up to DDR5-5200 (up from DDR5-4800 of the 12th gen.). The Thread Director (in hardware) can support the operating system to decide which thread to use on the performance or efficient cores for the best performance. For AI tasks, the CPU also integrates GNA 3.0 and DL Boost (via AVX2). Quick Sync in version 8 is the same as in the Rocket Lake CPUs and supports MPEG-2, AVC, VC-1 decode, JPEG, VP8 decode, VP9, HEVC, and AV1 decode in hardware. The CPU now supports PCIe 5.0 x8 for a GPU and two PCIe 4.0 x4 for SSDs.
The integrated graphics card is based on the Xe-architecture and offers 64 of the 96 EUs (Execution Units) clocked at up to 1.5GHz.
Power consumption
The i7-13620H is rated at a TDP of 55W (PL1, 115W PL2) and is manufactured in a further improved 10nm process (Intel 7) that allows the higher clock speeds compared to the 12th gen CPUs.
Intel Core i5-14501E
► remove from comparisonThe Intel Core i5-14501E is a peculiar Raptor Lake family desktop processor (SoC) that has 6 performance cores but 0 efficient cores. It's the lack of E-cores that makes 14X01 chips special.
The product has decently sized level 2 and 3 caches at 12 MB and 24 MB, respectively. Its CPU cores run at up to 5.2 GHz. The UHD 770 serves as the integrated graphics solution. There is no 'proper' NPU here, however, vPro Enterprise features such as RPE (Remote Platform Erase) are onboard.
The i5 chip is manufactured built with the Intel 7 process which is fairly old, as of mid 2025. Its base TDP sits at 65 W which is the standard value for desktop CPUs.
Performance
While we have not tested a single 14X01 processor as of July 2025, we do know that a single 4.6 GHz Raptor Cove core, such as that of an Core i7-14650HX is good for 116 Cinebench 2024 points and 285 Cinebench R15 points. (The 14501E can run at up to 5.2 GHz, too, to remind you.) If we multiply the values by 6, we get a reasonably fair projection that sees the 14501E being about as fast as lower mid-range laptop AMD chips of 2025, such as the AMD Ryzen AI 5 340. While not particularly impressive, this is definitely sufficient for any tasks and applications one could run in 2025, top games included.
Intel Core i5-13500
► remove from comparison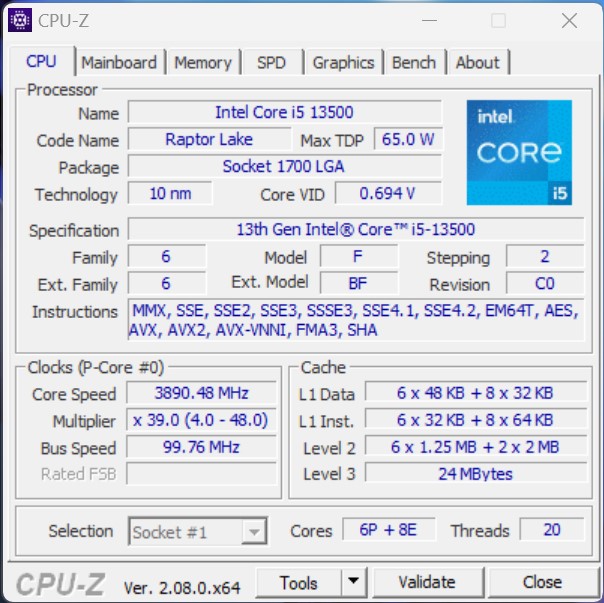
The Intel Core i5-13500 is a fast and relatively power efficient desktop processor based on the Raptor Lake architecture, which was introduced in October 2022. The processor offers a base clock of 2.5 GHz and reaches up to 4.8 GHz in Turbo. The hybrid CPU architecture introduced with Alder Lake is also used in the Raptor Lake processors. Compared to the Intel Core i5-12500, the Intel Core i5-13500 offers more cores, which means a higher overall performance can be achieved. In total, the Intel Core i5-13500 can process up to 20 threads in parallel. The performance cores (P cores) offer hyperthreading for this purpose, which is withheld from the energy-efficient cores (E cores).
Performance
Due to the higher number of physical computing units, the Intel Core i5-13500 offers noticeably more performance compared to the Intel Core i5-12500. Both processors have 6 P-cores, although only the Intel Core i5-13500 is additionally equipped with 8 E-cores.
Graphics unit
Like the Intel Core i5-12600K, the Intel Core i5-13500 offers an integrated graphics unit. The Intel Iris Xe architecture continues to serve as the basis. In terms of performance, however, not much has changed with the new Intel UHD Graphics 770.
Power consumption
The TDP of the Intel Core i5-13500 is 65 watts, with the option to increase this to up to 154 watts in Turbo mode. Compared to the Intel Core i5-12500, the energy requirement increases slightly.
| Model | Intel Core i7-13620H | Intel Core i5-14501E | Intel Core i5-13500 | ||||||||||||||||||||||||||||||||||||||||||||||||||||||||||||||||||||||||||||||||||||||||||||||||||||||||||||||||||||||||||||
| Codename | Raptor Lake-H | Raptor Lake | Raptor Lake | ||||||||||||||||||||||||||||||||||||||||||||||||||||||||||||||||||||||||||||||||||||||||||||||||||||||||||||||||||||||||||||
| Series | Intel Raptor Lake-H | Intel Raptor Lake-S | Intel Raptor Lake-S | ||||||||||||||||||||||||||||||||||||||||||||||||||||||||||||||||||||||||||||||||||||||||||||||||||||||||||||||||||||||||||||
| Series: Raptor Lake-S Raptor Lake |
|
|
| ||||||||||||||||||||||||||||||||||||||||||||||||||||||||||||||||||||||||||||||||||||||||||||||||||||||||||||||||||||||||||||
| Clock | 1800 - 4900 MHz | 3300 - 5200 MHz | 2500 - 4800 MHz | ||||||||||||||||||||||||||||||||||||||||||||||||||||||||||||||||||||||||||||||||||||||||||||||||||||||||||||||||||||||||||||
| L1 Cache | 864 KB | ||||||||||||||||||||||||||||||||||||||||||||||||||||||||||||||||||||||||||||||||||||||||||||||||||||||||||||||||||||||||||||||
| L2 Cache | 9.5 MB | 12 MB | 11.5 MB | ||||||||||||||||||||||||||||||||||||||||||||||||||||||||||||||||||||||||||||||||||||||||||||||||||||||||||||||||||||||||||||
| L3 Cache | 24 MB | 24 MB | 24 MB | ||||||||||||||||||||||||||||||||||||||||||||||||||||||||||||||||||||||||||||||||||||||||||||||||||||||||||||||||||||||||||||
| Cores / Threads | 10 / 16 6 x 4.9 GHz Intel Golden Cove P-Core 4 x 3.6 GHz Intel Gracemont E-Core | 6 / 12 6 x 5.2 GHz Intel Raptor Cove P-Core | 14 / 20 6 x 4.8 GHz Intel Raptor Cove P-Core 8 x 3.5 GHz Intel Gracemont E-Core | ||||||||||||||||||||||||||||||||||||||||||||||||||||||||||||||||||||||||||||||||||||||||||||||||||||||||||||||||||||||||||||
| TDP | 45 Watt | 65 Watt | 65 Watt | ||||||||||||||||||||||||||||||||||||||||||||||||||||||||||||||||||||||||||||||||||||||||||||||||||||||||||||||||||||||||||||
| Technology | 10 nm | 10 nm | 10 nm | ||||||||||||||||||||||||||||||||||||||||||||||||||||||||||||||||||||||||||||||||||||||||||||||||||||||||||||||||||||||||||||
| max. Temp. | 100 °C | 100 °C | |||||||||||||||||||||||||||||||||||||||||||||||||||||||||||||||||||||||||||||||||||||||||||||||||||||||||||||||||||||||||||||
| Socket | BGA1700 | LGA1700 | LGA 1700 | ||||||||||||||||||||||||||||||||||||||||||||||||||||||||||||||||||||||||||||||||||||||||||||||||||||||||||||||||||||||||||||
| Features | Thread Director | DDR4-3200/DDR5-4800 RAM, PCIe 5 + PCIe 4, DL Boost, GNA, vPro En., RPE, MMX, SSE, SSE2, SSE3, SSSE3, SSE4.1, SSE4.2, AVX, AVX2, BMI2, ABM, FMA, ADX, SMEP, SMAP, EIST, TM1, TM2, HT, Turbo, SST, AES-NI, RDRAND, RDSEED, SHA | Intel UHD Graphics 770, DDR5 4800 MT/s, DDR4 3200 MT/s | ||||||||||||||||||||||||||||||||||||||||||||||||||||||||||||||||||||||||||||||||||||||||||||||||||||||||||||||||||||||||||||
| iGPU | Intel UHD Graphics 64EUs (Alder Lake 12th Gen) ( - 1500 MHz) | Intel UHD Graphics 770 ( - 1550 MHz) | Intel UHD Graphics 770 (300 - 1550 MHz) | ||||||||||||||||||||||||||||||||||||||||||||||||||||||||||||||||||||||||||||||||||||||||||||||||||||||||||||||||||||||||||||
| Architecture | x86 | x86 | x86 | ||||||||||||||||||||||||||||||||||||||||||||||||||||||||||||||||||||||||||||||||||||||||||||||||||||||||||||||||||||||||||||
| Announced | |||||||||||||||||||||||||||||||||||||||||||||||||||||||||||||||||||||||||||||||||||||||||||||||||||||||||||||||||||||||||||||||
| Manufacturer | ark.intel.com | www.intel.com | www.intel.de | ||||||||||||||||||||||||||||||||||||||||||||||||||||||||||||||||||||||||||||||||||||||||||||||||||||||||||||||||||||||||||||
| TDP Turbo PL2 | 154 Watt | ||||||||||||||||||||||||||||||||||||||||||||||||||||||||||||||||||||||||||||||||||||||||||||||||||||||||||||||||||||||||||||||
| Die Size | 215 mm2 |

Benchmarks

Average Benchmarks Intel Core i7-13620H → 100% n=2
Average Benchmarks Intel Core i5-14501E → 91% n=2
Average Benchmarks Intel Core i5-13500 → 89% n=2
* Smaller numbers mean a higher performance
1 This benchmark is not used for the average calculation