Intel Core i5-13600K vs Intel Core i7-14700K
Intel Core i5-13600K ► remove from comparison
The Intel Core i5-13600K is a fast mid-range desktop processor of the Raptor Lake series. It includes a hybrid architecture for the CPU cores with combined 14 cores. Six fast Raptor Cove performance cores (P-cores) with HyperThreading and a clock speed of 3.5 - 5.1 GHz and eight Gracemont efficiency cores without HyperThreading and a clock speed of 2.6 - 3.9 GHz.
Thanks to the faster P-cores and more E-cores, the i5-13600K is significantly faster than the old i5-12600K (especially in multi-threaded workloads.
The 13600K is rated at 125 Watt TDP base power (PL1) and 181 Watt Turbo Power (PL2) and therefore slightly higher than the old Core i5-12600K .
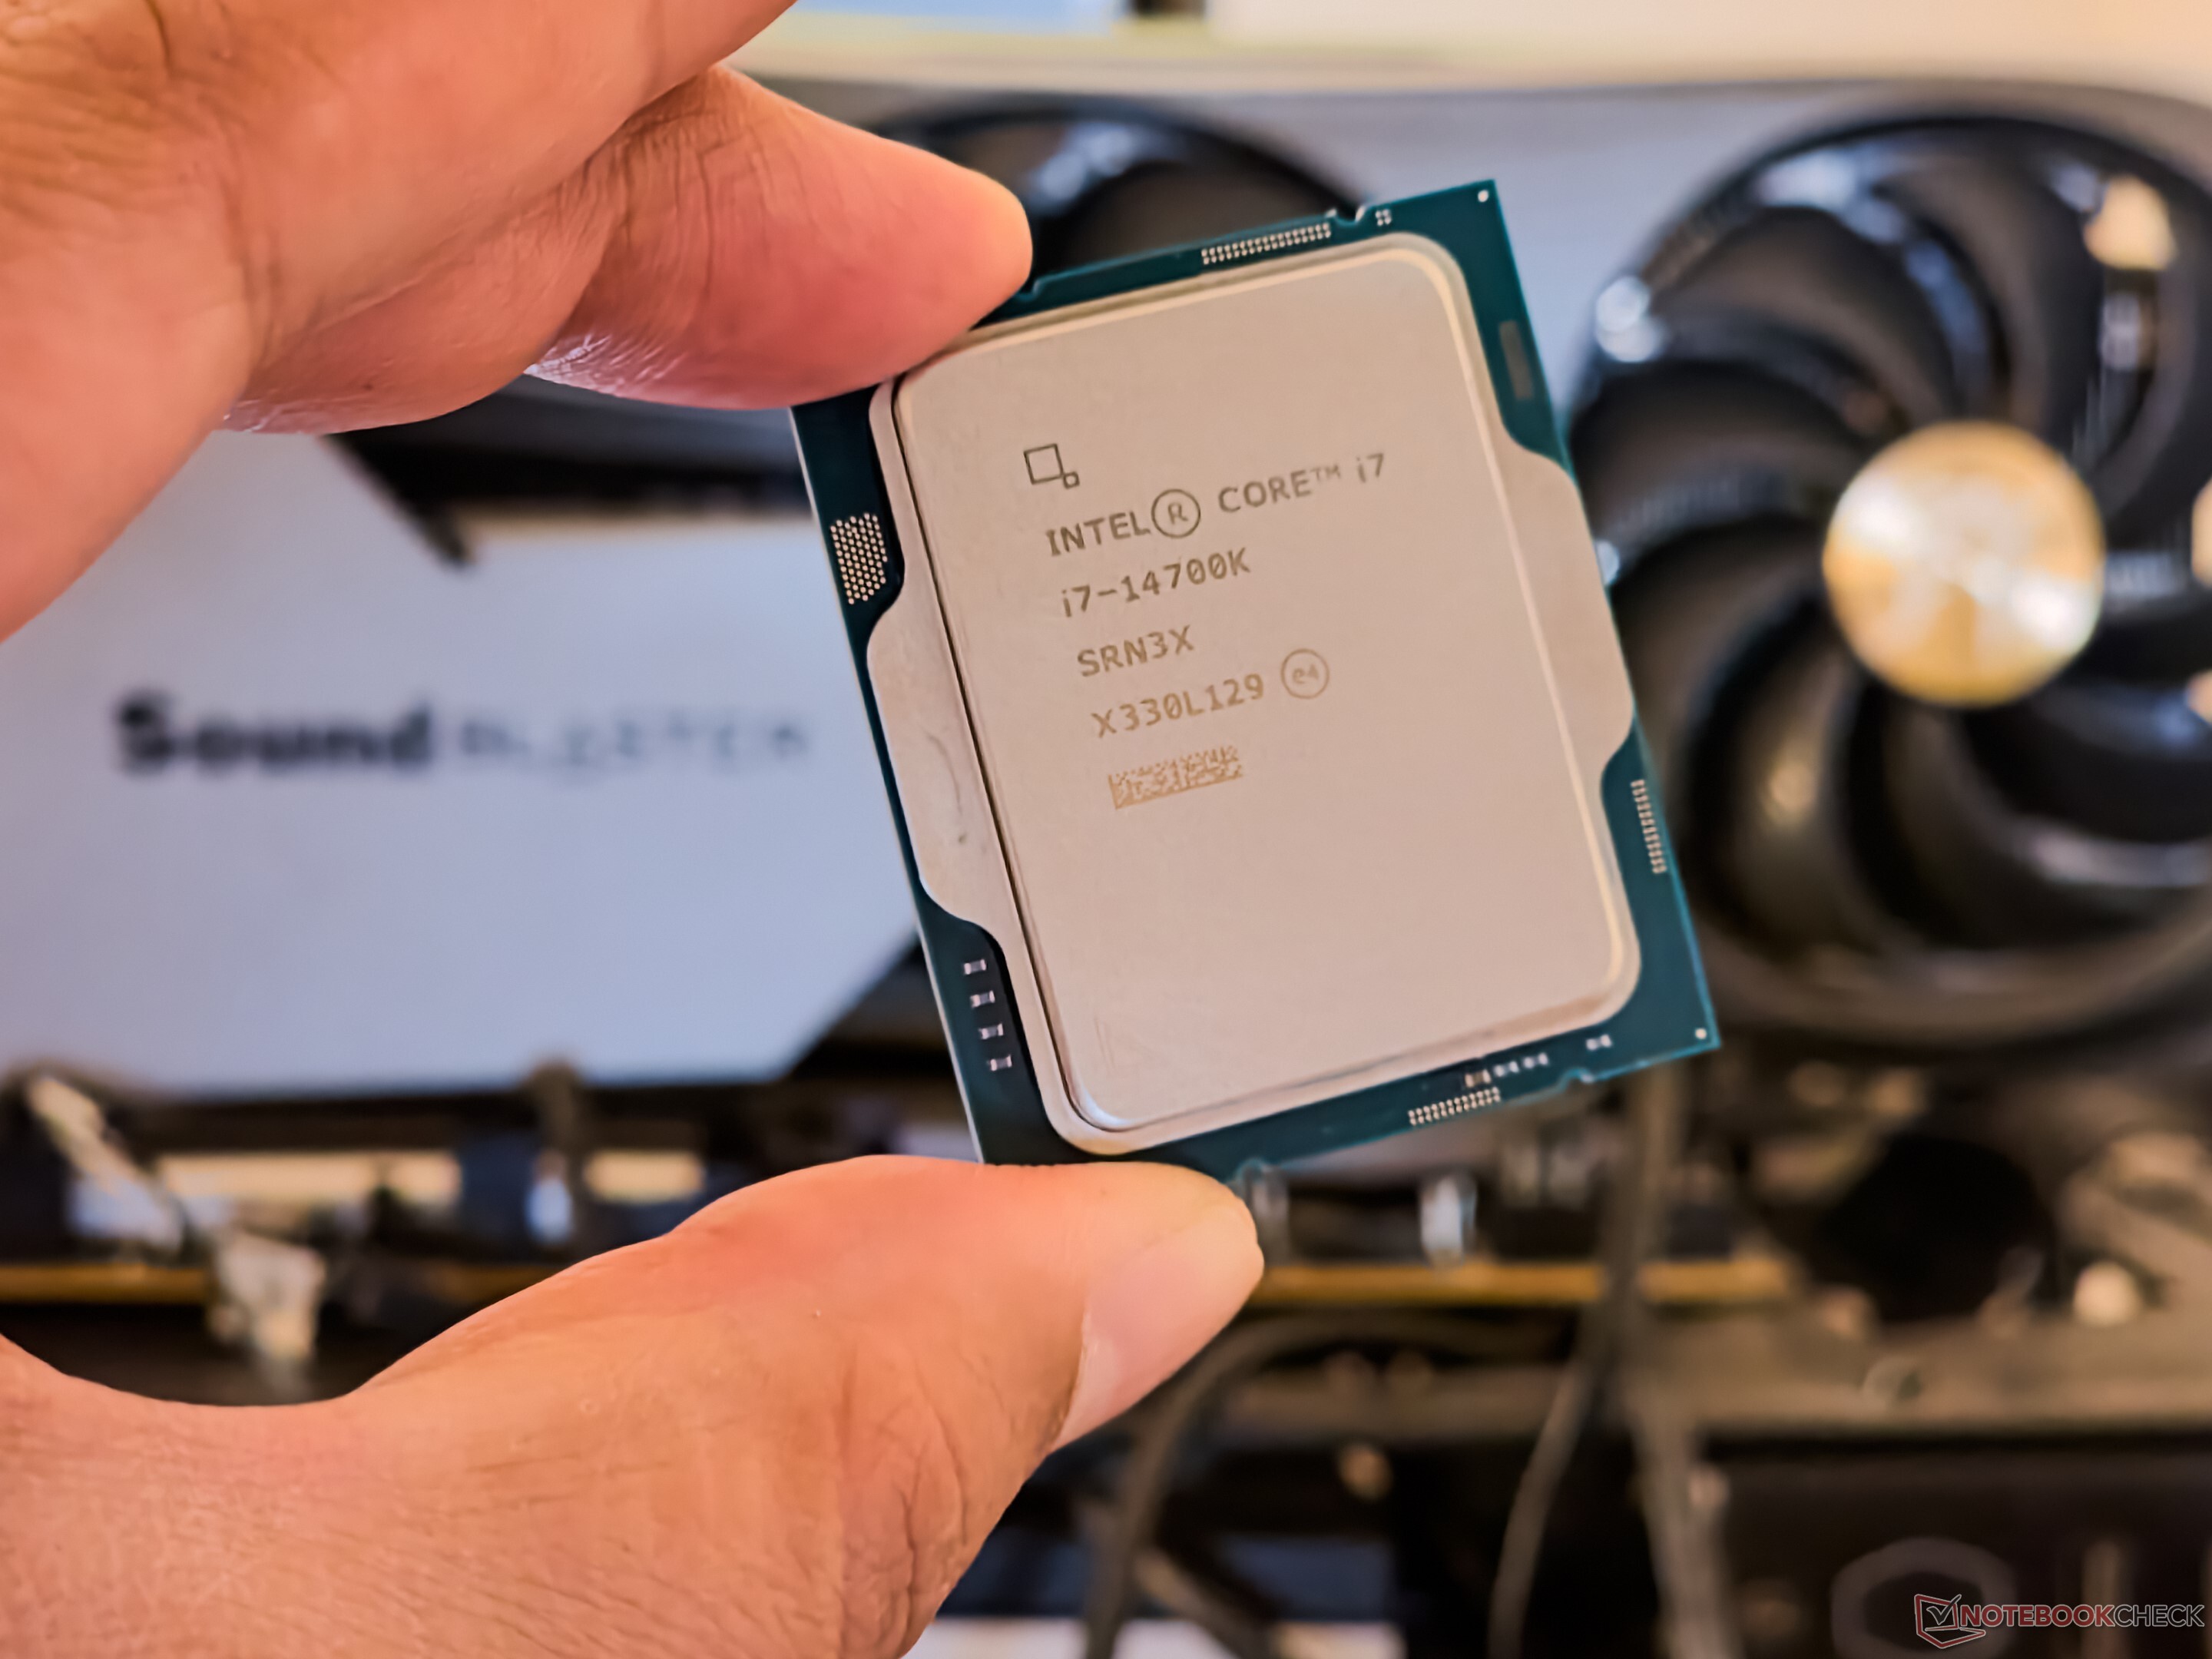
Intel Core i7-14700K ► remove from comparison
The Intel Core i5-14700K is a desktop processor based on the Raptor Lake architecture, which inherits the 13th generation of Intel Core processors with minor improvements. The processor offers a base clock of 2.5 GHz or 3.4 GHz and reaches up to 5.6 GHz in Turbo. The basic CPU structure remains unchanged. The Intel Core i5-14700K features 8 P-cores and 12 E-cores, allowing up to 28 threads to be processed in parallel. The Intel Core i5-14700K still offers a freely selectable multiplier, which makes overclocking much easier. It is also based on the LGA 1700 socket, which was already introduced with Alder Lake.
Performance
Compared to the Intel Core i5-13700K , the IPC of the new Core i5-14700K has only been increased slightly. This means that the difference in performance is only due to the higher number of efficiency cores (12 vs. 8) and higher clock rates.
Graphics unit
Like the Intel Core i5-13700K, the Intel Core i5-14700K also has an integrated graphics unit. The Intel Iris Xe architecture continues to serve as the basis. In terms of performance, however, nothing has changed with the Intel UHD Graphics 770.
Power consumption
The TDP of the Intel Core i5-14700K is 125 watts, with the option of consuming up to 253 watts in Turbo mode.
Model Intel Core i5-13600K Intel Core i7-14700K Series Intel Raptor Lake-S Intel Raptor Lake-R Codename Raptor Lake Raptor Lake Series: Raptor Lake-R Raptor Lake Clock 3500 - 5100 MHz 2500 - 5600 MHz L2 Cache 20 MB 28 MB L3 Cache 24 MB 33 MB Cores / Threads 14 / 20 20 / 28 TDP 125 Watt 125 Watt Technology 10 nm 10 nm Die Size 257 mm2 max. Temp. 100 °C 100 °C Socket LGA 1700 LGA 1700 Features Intel UHD Graphics 770, DDR5 5600 MT/s, DDR4 3200 MT/s Intel UHD Graphics 770, DDR5 5600 MT/s, DDR4 3200 MT/s iGPU Intel UHD Graphics 770 (300 - 1500 MHz)Intel UHD Graphics 770 (300 - 1600 MHz)Architecture x86 x86 $319 U.S. $319 U.S. Announced Manufacturer www.intel.com ark.intel.com
Benchmarks Performance Rating - CB R15 + R20 + 7-Zip + X265 + Blender + 3DM11 CPU - i5-13600K
49.4 pt (69%)
...
...
Performance Rating - CB R15 + R20 + 7-Zip + X265 + Blender + 3DM11 CPU - i7-14700K
57.8 pt (80%)
...
Cinebench 2024 - CB24 CPU Single Core
127.9 Points (89%)
Cinebench 2024 - CB24 CPU Multi Core
1982 Points (37%)
Cinebench R23 - Cinebench R23 Multi Core
min: 24174 avg: 24221 median: 24221 (22%) max: 24268 Points
CPU TDP ? TDP 125 W 100% 100%
35892 Points (33%)
CPU TDP ? TDP 125 W 100% 80%
Cinebench R23 - Cinebench R23 Single Core
min: 1991 avg: 2001 median: 2000.5 (85%) max: 2010 Points
CPU TDP ? TDP 125 W 100% 99%
2153 Points (92%)
CPU TDP ? TDP 125 W 100% 96%
Cinebench R20 - Cinebench R20 CPU (Single Core)
min: 766 avg: 771 median: 770.5 (86%) max: 775 Points
CPU TDP ? TDP 125 W 100% 99%
832 Points (92%)
CPU TDP ? TDP 125 W 100% 95%
Cinebench R20 - Cinebench R20 CPU (Multi Core)
min: 9217 avg: 9241 median: 9241 (23%) max: 9265 Points
CPU TDP ? TDP 125 W 100% 99%
13672 Points (33%)
CPU TDP ? TDP 125 W 100% 80%
Cinebench R15 - Cinebench R15 CPU Multi 64 Bit
min: 3641 avg: 3642 median: 3642 (23%) max: 3643 Points
CPU TDP ? TDP 125 W 100% 100%
5459 Points (34%)
CPU TDP ? TDP 125 W 100% 80%
Cinebench R15 - Cinebench R15 CPU Single 64 Bit
min: 286 avg: 287.5 median: 287.5 (87%) max: 289 Points
CPU TDP ? TDP 125 W 100% 99%
314 Points (95%)
CPU TDP ? TDP 125 W 100% 95%
Cinebench R11.5 - Cinebench R11.5 CPU Multi 64 Bit
min: 42.2 avg: 42.3 median: 42.3 (55%) max: 42.38 Points
CPU TDP ? TDP 125 W 100% 100%
61.4 Points (80%)
CPU TDP ? TDP 125 W 100% 81%
Cinebench R11.5 - Cinebench R11.5 CPU Single 64 Bit
min: 3.45 avg: 3.5 median: 3.5 (86%) max: 3.48 Points
CPU TDP ? TDP 125 W 100% 99%
3.7 Points (92%)
CPU TDP ? TDP 125 W 100% 96%
Cinebench R10 - Cinebench R10 Rend. Single (32bit)
min: 10710 avg: 10755 median: 10754.5 (65%) max: 10799 Points
CPU TDP ? TDP 125 W 100% 99%
12027 Points (73%)
CPU TDP ? TDP 125 W 100% 94%
Cinebench R10 - Cinebench R10 Rend. Multi (32bit)
min: 67973 avg: 68880 median: 68879.5 (50%) max: 69786 Points
CPU TDP ? TDP 125 W 97% 100%
91081 Points (66%)
CPU TDP ? TDP 125 W 100% 88%
Cinebench R10 - Cinebench R10 Rend. Multi (64bit)
min: 110412 avg: 110969 median: 110969 (77%) max: 111526 Points
CPU TDP ? TDP 125 W 99% 100%
136062 Points (94%)
CPU TDP ? TDP 125 W 100% 90%
Cinebench R10 - Cinebench R10 Rend. Single (64bit)
min: 16074 avg: 16155 median: 16154.5 (20%) max: 16235 Points
CPU TDP ? TDP 125 W 100% 99%
17458 Points (21%)
CPU TDP ? TDP 125 W 100% 95%
wPrime 2.10 - wPrime 2.0 1024m *
min: 172.189 avg: 174.9 median: 174.9 (2%) max: 177.592 s
CPU TDP ? TDP 125 W 100% 100%
109.8 s (1%)
CPU TDP ? TDP 125 W 100% 100%
wPrime 2.10 - wPrime 2.0 32m *
min: 2.518 avg: 2.5 median: 2.5 (1%) max: 2.527 s
CPU TDP ? TDP 125 W 100% 100%
2.1 s (0%)
CPU TDP ? TDP 125 W 100% 100%
min: 10937 avg: 10967 median: 10967 (17%) max: 10997 Points
CPU TDP ? TDP 125 W 99% 100%
12800 Points (20%)
CPU TDP ? TDP 125 W 100% 93%
7-Zip 18.03 - 7-Zip 18.03 Multli Thread 4 runs
min: 89527 avg: 89587 median: 89587 (51%) max: 89647 MIPS
CPU TDP ? TDP 125 W 100% 100%
135648 MIPS (78%)
CPU TDP ? TDP 125 W 100% 79%
7-Zip 18.03 - 7-Zip 18.03 Single Thread 4 runs
min: 6253 avg: 6378 median: 6377.5 (76%) max: 6502 MIPS
CPU TDP ? TDP 125 W 100% 96%
7351 MIPS (88%)
CPU TDP ? TDP 125 W 100% 90%
X264 HD Benchmark 4.0 - x264 Pass 2
min: 198.6 avg: 198.8 median: 198.8 (69%) max: 199 fps
CPU TDP ? TDP 125 W 100% 100%
261 fps (91%)
CPU TDP ? TDP 125 W 100% 86%
X264 HD Benchmark 4.0 - x264 Pass 1
min: 387 avg: 387.5 median: 387.5 (89%) max: 388 fps
CPU TDP ? TDP 125 W 100% 100%
419 fps (97%)
CPU TDP ? TDP 125 W 100% 96%
HWBOT x265 Benchmark v2.2 - HWBOT x265 4k Preset
min: 27.5 avg: 27.6 median: 27.6 (48%) max: 27.6 fps
CPU TDP ? TDP 125 W 100% 100%
36.8 fps (65%)
CPU TDP ? TDP 125 W 100% 85%
TrueCrypt - TrueCrypt Serpent
1.7 GB/s (0%)
CPU TDP ? TDP 125 W 100% 100%
2.6 GB/s (0%)
CPU TDP ? TDP 125 W 100% 79%
TrueCrypt - TrueCrypt Twofish
min: 3.1 avg: 3.2 median: 3.2 (54%) max: 3.2 GB/s
CPU TDP ? TDP 125 W 97% 100%
4.6 GB/s (79%)
CPU TDP ? TDP 125 W 100% 83%
TrueCrypt - TrueCrypt AES
min: 18.8 avg: 19.1 median: 19.1 (50%) max: 19.4 GB/s
CPU TDP ? TDP 125 W 97% 100%
25.6 GB/s (67%)
CPU TDP ? TDP 125 W 100% 87%
Blender - Blender 3.3 Classroom CPU *
min: 37 avg: 161.7 median: 224 (3%) max: 224 Seconds
CPU TDP ? TDP 125 W 101% 100%
155 Seconds (2%)
CPU TDP ? TDP 125 W 101% 100%
Blender - Blender 2.79 BMW27 CPU *
135 Seconds (1%)
CPU TDP ? TDP 125 W 100% 100%
91 Seconds (1%)
CPU TDP ? TDP 125 W 100% 100%
R Benchmark 2.5 - R Benchmark 2.5 *
min: 0.4048 avg: 0.4 median: 0.4 (9%) max: 0.405 sec
CPU TDP ? TDP 125 W 100% 100%
0.4 sec (8%)
CPU TDP ? TDP 125 W 100% 100%
3DMark 06 - CPU - 3DMark 06 - CPU
17627 Points (38%)
20665 Points (44%)
Super Pi mod 1.5 XS 1M - Super Pi mod 1.5 XS 1M *
min: 6.471 avg: 6.5 median: 6.5 (1%) max: 6.58 s
CPU TDP ? TDP 125 W 100% 100%
6 s (1%)
CPU TDP ? TDP 125 W 100% 100%
Super Pi mod 1.5 XS 2M - Super Pi mod 1.5 XS 2M *
min: 14.876 avg: 14.9 median: 14.9 (1%) max: 14.993 s
CPU TDP ? TDP 125 W 100% 100%
12.8 s (1%)
CPU TDP ? TDP 125 W 100% 100%
Super Pi Mod 1.5 XS 32M - Super Pi mod 1.5 XS 32M *
min: 328.929 avg: 331.4 median: 331.4 (1%) max: 333.798 s
CPU TDP ? TDP 125 W 100% 100%
305.9 s (1%)
CPU TDP ? TDP 125 W 100% 100%
3DMark Vantage - 3DM Vant. Perf. CPU no Physx
97718 Points (86%)
3DMark 11 - 3DM11 Performance Physics
min: 30358 avg: 30419 median: 30419 (82%) max: 30480 Points
CPU TDP ? TDP 125 W 100% 100%
32336 Points (87%)
CPU TDP ? TDP 125 W 100% 97%
3DMark - 3DMark Ice Storm Physics
min: 86734 avg: 86952 median: 86952 (71%) max: 87170 Points
CPU TDP ? TDP 125 W 100% 99%
3DMark - 3DMark Ice Storm Extreme Physics
min: 87784 avg: 87861 median: 87860.5 (71%) max: 87937 Points
CPU TDP ? TDP 125 W 100% 100%
3DMark - 3DMark Ice Storm Unlimited Physics
min: 88547 avg: 89321 median: 89321 (75%) max: 90095 Points
CPU TDP ? TDP 125 W 100% 98%
3DMark - 3DMark Cloud Gate Physics
min: 26359 avg: 26394 median: 26394 (67%) max: 26429 Points
CPU TDP ? TDP 125 W 100% 100%
3DMark - 3DMark Fire Strike Standard Physics
min: 35386 avg: 35395 median: 35395 (63%) max: 35404 Points
CPU TDP ? TDP 125 W 100% 100%
49142 Points (88%)
CPU TDP ? TDP 125 W 100% 84%
3DMark - 3DMark Time Spy CPU
min: 17079 avg: 17102 median: 17101.5 (72%) max: 17124 Points
CPU TDP ? TDP 125 W 100% 100%
21541 Points (91%)
CPU TDP ? TDP 125 W 100% 88%
Geekbench 6.2 - Geekbench 6.2 Single-Core
2902 Points (78%)
Geekbench 6.2 - Geekbench 6.2 Multi-Core
19790 Points (78%)
Geekbench 5.5 - Geekbench 5.1 - 5.4 64 Bit Single-Core
min: 1967 avg: 1973 median: 1973 (83%) max: 1979 Points
CPU TDP ? TDP 125 W 99% 100%
2121 Points (89%)
CPU TDP ? TDP 125 W 100% 97%
Geekbench 5.5 - Geekbench 5.1 - 5.4 64 Bit Multi-Core
min: 16651 avg: 16671 median: 16670.5 (30%) max: 16690 Points
CPU TDP ? TDP 125 W 100% 100%
23159 Points (41%)
CPU TDP ? TDP 125 W 100% 84%
Geekbench 5.0 - Geekbench 5.0 64 Bit Single-Core
min: 1931 avg: 1948 median: 1947.5 (8%) max: 1964 Points
CPU TDP ? TDP 125 W 98% 100%
2045 Points (9%)
CPU TDP ? TDP 125 W 100% 99%
Geekbench 5.0 - Geekbench 5.0 64 Bit Multi-Core
min: 16497 avg: 16566 median: 16566 (52%) max: 16635 Points
CPU TDP ? TDP 125 W 100% 99%
22756 Points (72%)
CPU TDP ? TDP 125 W 100% 84%
Geekbench 4.4 - Geekbench 4.1 - 4.4 64 Bit Single-Core
min: 8618 avg: 8625 median: 8624.5 (86%) max: 8631 Points
CPU TDP ? TDP 125 W 100% 100%
9304 Points (93%)
CPU TDP ? TDP 125 W 100% 96%
Geekbench 4.4 - Geekbench 4.1 - 4.4 64 Bit Multi-Core
min: 60407 avg: 61014 median: 61014 (67%) max: 61621 Points
CPU TDP ? TDP 125 W 98% 100%
79501 Points (87%)
CPU TDP ? TDP 125 W 100% 88%
Mozilla Kraken 1.1 - Kraken 1.1 Total Score *
min: 467 avg: 468 median: 468 (1%) max: 469 ms
CPU TDP ? TDP 125 W 100% 100%
439 ms (1%)
CPU TDP ? TDP 125 W 100% 100%
WebXPRT 4 - WebXPRT 4 Score
288 Points (83%)
CPU TDP ? TDP 125 W 100% 100%
314 Points (90%)
CPU TDP ? TDP 125 W 100% 96%
WebXPRT 3 - WebXPRT 3 Score
min: 329 avg: 331 median: 331 (69%) max: 333 Points
CPU TDP ? TDP 125 W 100% 99%
339 Points (71%)
CPU TDP ? TDP 125 W 100% 98%
CrossMark - CrossMark Overall
min: 2237 avg: 2254 median: 2254 (86%) max: 2271 Points
CPU TDP ? TDP 125 W 100% 99%
2288 Points (88%)
CPU TDP ? TDP 125 W 100% 98%
Power Consumption - Prime95 Power Consumption - external Monitor *
min: 278 avg: 313 median: 313 (54%) max: 348 Watt
CPU TDP ? TDP 125 W 100% 130%
400 Watt (69%)
CPU TDP ? TDP 125 W 100% 147%
Power Consumption - Cinebench R15 Multi Power Consumption - external Monitor *
min: 245 avg: 265.5 median: 265.5 (48%) max: 286 Watt
CPU TDP ? TDP 125 W 100% 116%
428 Watt (78%)
CPU TDP ? TDP 125 W 100% 159%
Power Consumption - Idle Power Consumption - external Monitor *
min: 69.3 avg: 73.3 median: 73.3 (48%) max: 77.3 Watt
CPU TDP ? TDP 125 W 111% 100%
104.8 Watt (69%)
CPU TDP ? TDP 125 W 100% 115%
Power Consumption - Cinebench R15 Multi Power Efficiency - external Monitor
min: 12.7 avg: 13.8 median: 13.8 (10%) max: 14.9 Points per Watt
CPU TDP ? TDP 125 W 85% 100%
12.8 Points per Watt (10%)
CPU TDP ? TDP 125 W 86% 100%
Average Benchmarks Intel Core i5-13600K → 100% n=43 Average Benchmarks Intel Core i7-14700K → 119% n=43
- Range of benchmark values for this graphics card
- Average benchmark values for this graphics card
* Smaller numbers mean a higher performance
1 This benchmark is not used for the average calculation
v1.27
log 17. 20:20:49
#0 checking url part for id 14626 +0s ... 0s
#1 checking url part for id 16391 +0s ... 0s
#2 not redirecting to Ajax server +0s ... 0s
#3 did not recreate cache, as it is less than 5 days old! Created at Sun, 16 Jun 2024 05:37:17 +0200 +0.001s ... 0.001s
#4 composed specs +0.031s ... 0.032s
#5 did output specs +0s ... 0.032s
#6 getting avg benchmarks for device 14626 +0.019s ... 0.051s
#7 got single benchmarks 14626 +0.011s ... 0.061s
#8 getting avg benchmarks for device 16391 +0.016s ... 0.077s
#9 got single benchmarks 16391 +0.008s ... 0.085s
#10 got avg benchmarks for devices +0s ... 0.085s
#11 min, max, avg, median took s +0.314s ... 0.399s
#12 return log +0.057s ... 0.456s
Please share our article, every link counts!
Redaktion, 2017-09- 8 (Update: 2023-07- 1)
 Deutsch
 English
 Español
 Français
 Italiano
 Nederlands
 Polski
 Português
 Русский
 Türkçe
 Svenska
 Chinese
 Magyar