Notebookcheck Logo

Intel Core i5-12400F vs Intel Core i5-13400F

Intel Core i5-12400F

► remove from comparison

The Intel Core i5-12400F is a fast six-core processor based on the Alder Lake architecture, which was introduced in January 2022. The processor has a base clock speed of 2.5 GHz and reaches a maximum clock speed of up to 4.4 GHz under load. As with its predecessor, the Intel Core i5-11400F, Alder-Lake also supports hyperthreading, which means that up to 12 threads can be processed simultaneously. The Intel Core i5-12400F is manufactured using the 10 nm process. There are many changes to the new architecture, which is essentially based on a hybrid architecture. However, the Intel Core i5-12400F does not fully benefit from this, as only P-cores are used under the heatspreader. Only with the faster Intel Core i5-12600K can you enjoy the performance of the combination of P and E cores. The Intel Core i5-12400F is a non-K CPU, which in turn means that there is no freely selectable multiplier, which means that the CPU is not suitable for overclocking.

Performance

Compared to the Intel Core i5-11400F , the IPC of the Intel Core i5-12400F has been significantly increased again. The performance difference between the two processors is between 10 and 20 percent in most cases. Due to the good single-thread performance, the Intel Core i5-12400F is definitely a sensible CPU to use as the basis in a gaming PC.

Graphics unit

The processors marked with an "F" in the nomenclature do not offer an integrated graphics unit. All other non-F processors can rely on the Intel Iris Xe.

Power consumption

The TDP is relatively low at 65 watts. This is the PL1 value. For Turbo, the Intel Core i5-12400F with PL2 offers a higher TDP of up to 117 watts. If all restrictions are deactivated in the BIOS, there is no time limit for the PL2 value. With the maximum 117 watts, a large cooling unit is not required.

Intel Core i5-13400F

► remove from comparison Intel i5-13400F

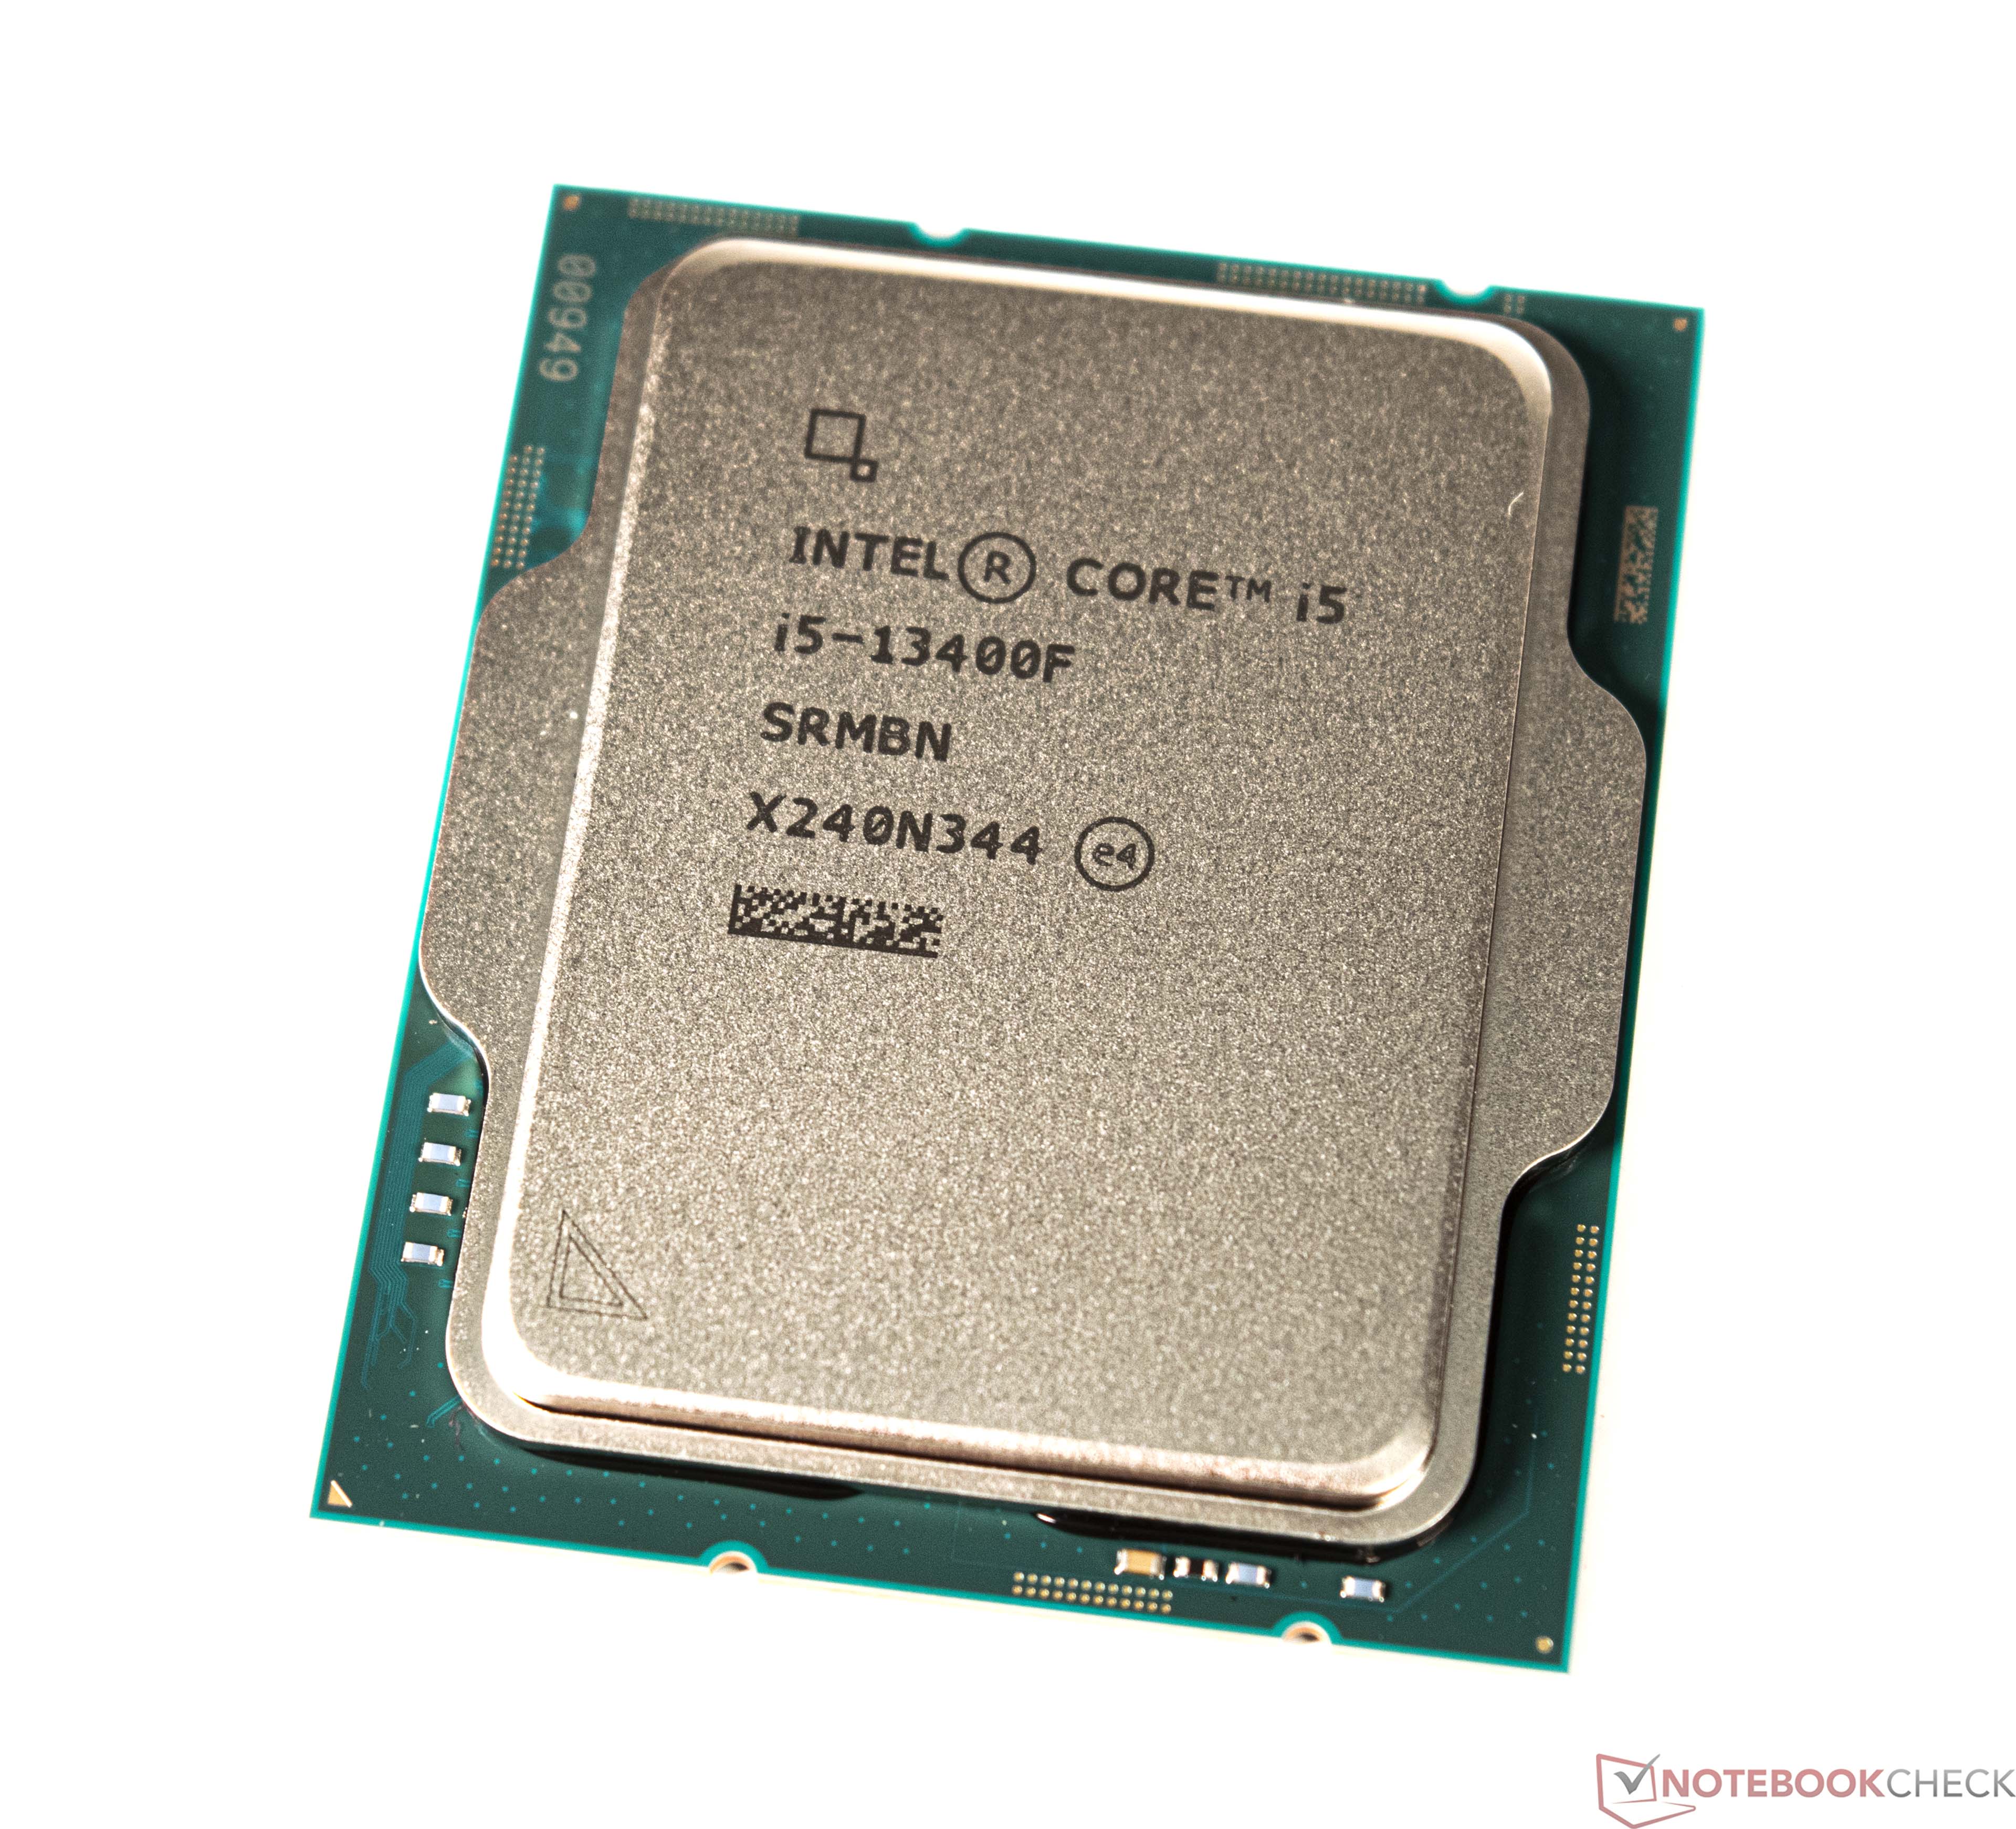
The Intel Core i5-13400F is a mid-range desktop processor of the Raptor Lake series. It includes a hybrid architecture for the CPU cores with combined 10 cores. Six fast Golden Cove / Raptor Cove performance cores (P-cores) with HyperThreading and a clock speed of 3.5 - 5.1 GHz and four Gracemont efficiency cores without HyperThreading and a clock speed of 2.6 - 3.9 GHz. The 13400F can be based on the older Alder Lake chips (at least for early models) or the newer Raptor Lake chips. The F-series of CPUs do not integrate a iGPU.

The performance is clearly higher than the old Core i5-12400F due to the additional four E-cores. These help in multi-threaded workloads and the higher boost core of the p-cores help for single threaded workloads.

The power consumption of the 13400F is rated at 65 Watt for sustained workloads (PL1) and 148 Watt for short bursts (PL2).

ModelIntel Core i5-12400FIntel Core i5-13400F
CodenameAlder Lake-SRaptor Lake-S
Series Alder Lake-SIntel Raptor Lake-S
Clock2500 - 4400 MHz2500 - 4600 MHz
L1 Cache480 KB0.1 MB
L2 Cache7.5 MB9.5 MB
L3 Cache17.9 MB20 MB
Cores / Threads6 / 1210 / 16
TDP65 Watt65 Watt
Technology10 nm10 nm
Die Size163 mm2257 mm2
max. Temp.100 °C100 °C
Socket1700LGA 1700
FeaturesTVB, HyperThreading, AVX, AVX2, FMA3, Quick Sync, VirtualizationIntel SSE4.1, Intel SSE4.2, Intel AVX2
Architecturex86x86
$180 U.S.$196 U.S.
Announced
Manufacturerwww.intel.deark.intel.com
Series: Raptor Lake-S Raptor Lake-S
Intel Core i7-13700 compare2.1 - 5.2 GHz16 / 24 cores30 MB L3
Intel Core i5-13400F « 2.5 - 4.6 GHz10 / 16 cores20 MB L3
Intel Core i5-13400 compare2.5 - 4.6 GHz10 / 16 cores20 MB L3

Benchmarks

Performance Rating - CB R15 + R20 + 7-Zip + X265 + Blender + 3DM11 CPU - i5-12400F
36.2 pt (60%)
Restrict / Search: Model: Max. age: years
Performance Rating - CB R15 + R20 + 7-Zip + X265 + Blender + 3DM11 CPU - i5-13400F
37.9 pt (63%)
Restrict / Search: Model: Max. age: years
Cinebench R23 - Cinebench R23 Multi Core
12380 Points (11%)
15911 Points (15%)
Cinebench R23 - Cinebench R23 Single Core
1680 Points (68%)
1744 Points (71%)
Cinebench R20 - Cinebench R20 CPU (Single Core)
653 Points (71%)
672 Points (73%)
Cinebench R20 - Cinebench R20 CPU (Multi Core)
4740 Points (12%)
6091 Points (15%)
Cinebench R15 - Cinebench R15 CPU Multi 64 Bit
1759 Points (11%)
2364 Points (15%)
Cinebench R15 - Cinebench R15 CPU Single 64 Bit
244 Points (68%)
252 Points (70%)
Cinebench R11.5 - Cinebench R11.5 CPU Multi 64 Bit
20.4 Points (26%)
27.5 Points (36%)
Cinebench R11.5 - Cinebench R11.5 CPU Single 64 Bit
3 Points (70%)
3.1 Points (73%)
Cinebench R10 - Cinebench R10 Rend. Single (32bit)
8389 Points (51%)
8689 Points (52%)
Cinebench R10 - Cinebench R10 Rend. Multi (32bit)
40690 Points (29%)
51113 Points (37%)
Cinebench R10 - Cinebench R10 Rend. Multi (64bit)
69819 Points (45%)
82988 Points (53%)
Cinebench R10 - Cinebench R10 Rend. Single (64bit)
13664 Points (17%)
13947 Points (17%)
wPrime 2.10 - wPrime 2.0 1024m *
112.8 s (1%)
367.9 s (4%)
wPrime 2.10 - wPrime 2.0 32m *
4.1 s (1%)
3.3 s (1%)
WinRAR - WinRAR 4.0
7816 Points (12%)
8602 Points (14%)
7-Zip 18.03 - 7-Zip 18.03 Multi Thread 4 runs
45043 MIPS (26%)
60048 MIPS (34%)
7-Zip 18.03 - 7-Zip 18.03 Single Thread 4 runs
5476 MIPS (65%)
5743 MIPS (68%)
X264 HD Benchmark 4.0 - x264 Pass 2
101.4 fps (3%)
136.9 fps (3%)
X264 HD Benchmark 4.0 - x264 Pass 1
252.5 fps (6%)
314.5 fps (8%)
HWBOT x265 Benchmark v2.2 - HWBOT x265 4k Preset
15.2 fps (27%)
19.2 fps (34%)
TrueCrypt - TrueCrypt Serpent
0.9 GB/s (26%)
1.1 GB/s (32%)
TrueCrypt - TrueCrypt Twofish
1.4 GB/s (24%)
2 GB/s (34%)
TrueCrypt - TrueCrypt AES
9.3 GB/s (24%)
12.2 GB/s (32%)
Blender - Blender 3.3 Classroom CPU *
430 Seconds (5%)
336 Seconds (4%)
Blender - Blender 2.79 BMW27 CPU *
269 Seconds (2%)
206 Seconds (1%)
R Benchmark 2.5 - R Benchmark 2.5 *
0.5 sec (10%)
0.5 sec (10%)
3DMark 06 - CPU - 3DMark 06 - CPU
11892 Points (25%)
13989 Points (30%)
Super Pi mod 1.5 XS 1M - Super Pi mod 1.5 XS 1M *
8.3 s (2%)
8 s (2%)
Super Pi mod 1.5 XS 2M - Super Pi mod 1.5 XS 2M *
18.5 s (1%)
17.9 s (1%)
Super Pi Mod 1.5 XS 32M - Super Pi mod 1.5 XS 32M *
438.4 s (2%)
420.5 s (2%)
3DMark Vantage - 3DM Vant. Perf. CPU no Physx
63413 Points (49%)
77937 Points (60%)
3DMark 11 - 3DM11 Performance Physics
19436 Points (48%)
23820 Points (59%)
3DMark - 3DMark Ice Storm Physics
81984 Points (67%)
77765 Points (63%)
3DMark - 3DMark Ice Storm Extreme Physics
82024 Points (67%)
76636 Points (62%)
3DMark - 3DMark Ice Storm Unlimited Physics
80273 Points (64%)
3DMark - 3DMark Cloud Gate Physics
15317 Points (39%)
19846 Points (50%)
3DMark - 3DMark Fire Strike Standard Physics
24023 Points (43%)
28087 Points (50%)
3DMark - 3DMark Time Spy CPU
9745 Points (41%)
12669 Points (53%)
Geekbench 6.5 - Geekbench 6.5 Single-Core
2329 Points (54%)
2457 Points (57%)
Geekbench 6.5 - Geekbench 6.5 Multi-Core
9737 Points (38%)
11255 Points (44%)
Geekbench 5.5 - Geekbench 5.1 - 5.5 64 Bit Single-Core
1742 Points (59%)
1792 Points (60%)
Geekbench 5.5 - Geekbench 5.1 - 5.5 64 Bit Multi-Core
9517 Points (17%)
12095 Points (22%)
Geekbench 5.0 - Geekbench 5.0 64 Bit Single-Core
1673 Points (7%)
1721 Points (7%)
Geekbench 5.0 - Geekbench 5.0 64 Bit Multi-Core
9368 Points (30%)
12009 Points (38%)
Geekbench 4.4 - Geekbench 4.1 - 4.4 64 Bit Single-Core
7548 Points (75%)
7684 Points (77%)
Geekbench 4.4 - Geekbench 4.1 - 4.4 64 Bit Multi-Core
35098 Points (34%)
43856 Points (43%)
Mozilla Kraken 1.1 - Kraken 1.1 Total Score *
573 ms (1%)
535 ms (1%)
WebXPRT 4 - WebXPRT 4 Score
235 Points (61%)
254 Points (66%)
WebXPRT 3 - WebXPRT 3 Score
272 Points (49%)
294 Points (53%)
CrossMark - CrossMark Overall
1762 Points (66%)
1941 Points (73%)
Power Consumption - Prime95 Power Consumption - external Monitor *
239 Watt (41%)
214 Watt (37%)
Power Consumption - Cinebench R15 Multi Power Consumption - external Monitor *
194.4 Watt (35%)
184.2 Watt (34%)
Power Consumption - Idle Power Consumption - external Monitor *
83.6 Watt (55%)
76.3 Watt (50%)

Average Benchmarks Intel Core i5-12400F → 100% n=49

Average Benchmarks Intel Core i5-13400F → 115% n=49

- Range of benchmark values for this graphics card
red legend - Average benchmark values for this graphics card
* Smaller numbers mean a higher performance
1 This benchmark is not used for the average calculation

Add one or more devices and compare

In the following list you can select (and also search for) devices that should be added to the comparison. You can select more than one device.

restrict list:
v1.35
log 10. 05:14:11

#0 ran 0s before starting gpusingle class +0s ... 0s

#1 checking url part for id 14994 +0s ... 0s

#2 checking url part for id 14966 +0s ... 0s

#3 redirected to Ajax server, took 1765340051s time from redirect:0 +0s ... 0s

#4 did not recreate cache, as it is less than 5 days old! Created at Sun, 07 Dec 2025 05:18:56 +0100 +0s ... 0s

#5 composed specs +0.003s ... 0.003s

#6 did output specs +0s ... 0.003s

#7 getting avg benchmarks for device 14994 +0.005s ... 0.008s

#8 got single benchmarks 14994 +0.005s ... 0.013s

#9 getting avg benchmarks for device 14966 +0.004s ... 0.017s

#10 got single benchmarks 14966 +0.005s ... 0.022s

#11 got avg benchmarks for devices +0s ... 0.022s

#12 min, max, avg, median took s +0.05s ... 0.071s

#13 return log +0.02s ... 0.091s

Please share our article, every link counts!
Mail Logo
> Expert Reviews and News on Laptops, Smartphones and Tech Innovations > Benchmarks / Tech > Processor Comparison - Head 2 Head
Redaktion, 2017-09- 8 (Update: 2023-07- 1)