Intel Core Ultra X7 358H vs Intel Core Ultra 7 365
Intel Core Ultra X7 358H
► remove from comparison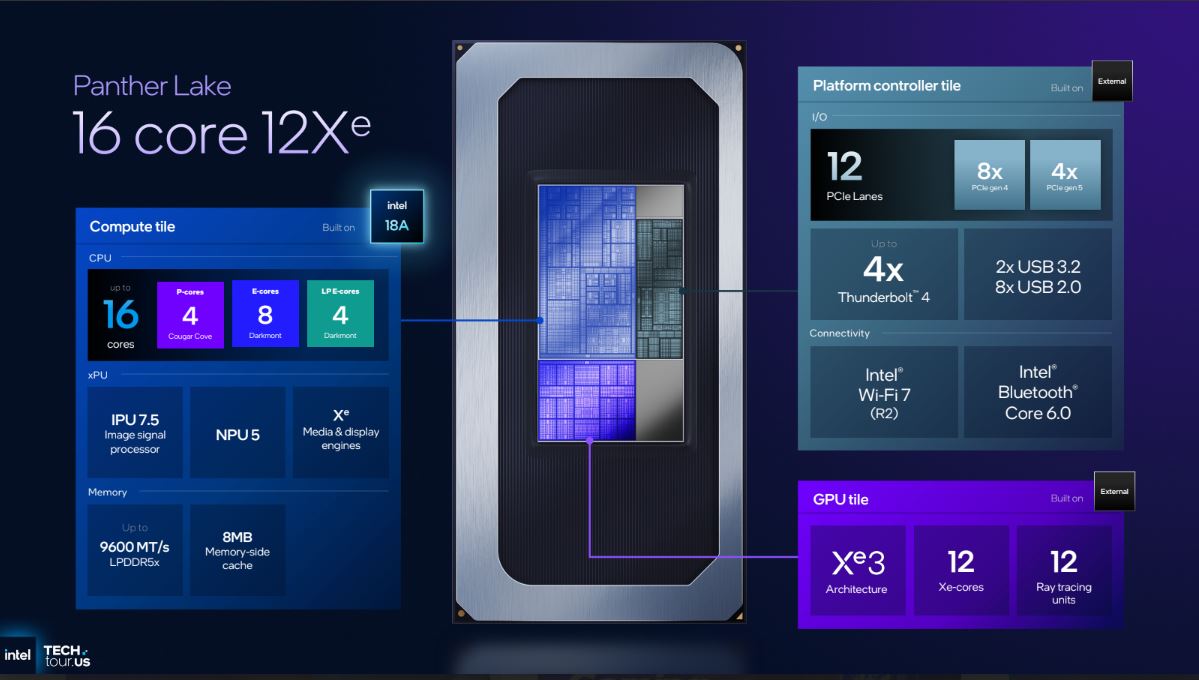
The Intel Core Ultra X7 358H is a high-end 16-core SoC from the Panther Lake family for notebooks and the second-fastest model with the fast 12-core iGPU.
The 358H integrates a compute tile that is manufactured by Intel in the new 18A process. This includes 4 large Cougar Cove P-Cores with up to 1.9 - 4.8 GHz, 8 Darkmont E-Cores with 1.5 - 3.7 GHz and another 4 small Darkmont LP (Low Power) E-Cores with 1.5 - 3.3 GHz. Furthermore, the new NPU 5 with 50 TOPS INT 8 and an IPU 7.5 image processor are installed. The integrated memory controller supports up to 96 GB LPDDR5-9600.
The GPU tile contains a fast iGPU with 12 Xe3 cores and ray tracing support and is manufactured by TSMC using the N3E process.
The third chiplet integrates the platform controller with 12 PCIe lanes, 4x Thunderbolt 4, Wi-Fi 7 (R2) and Bluetooth Core 6.0. The platform controller is also manufactured by TSMC.
The power consumption is specified from 15 W (minimum assured power) over 25 Watt (processor base power PL1) up to 80 W (maximum Turbo power).
Intel Core Ultra 7 365
► remove from comparison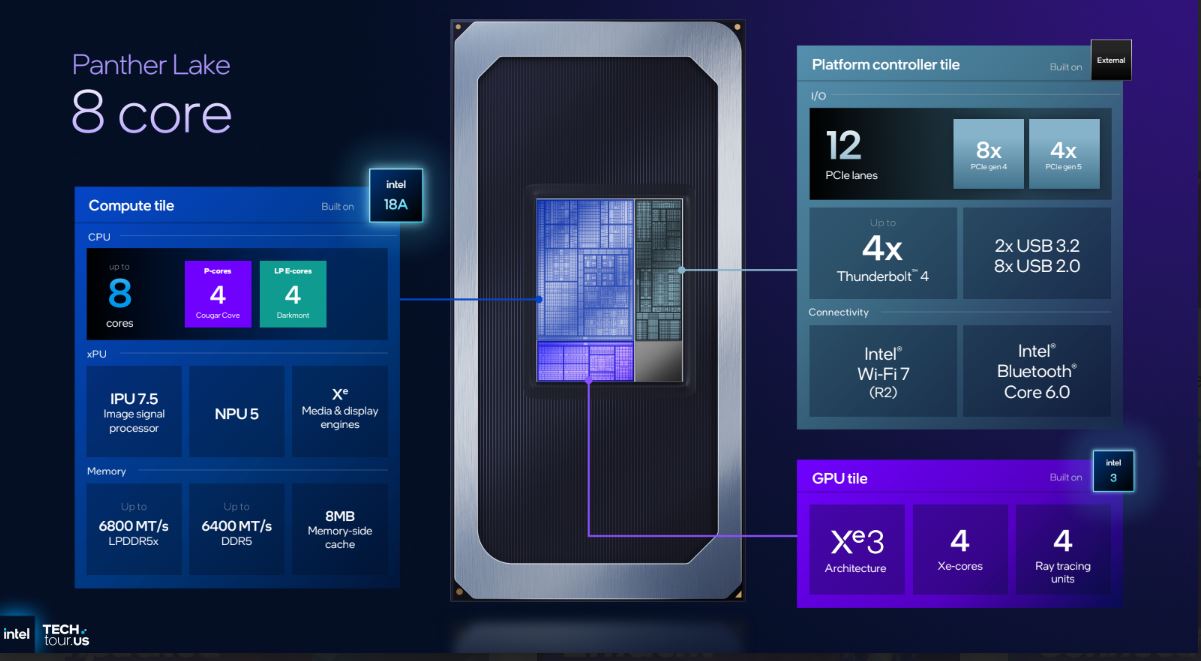
The Intel Core Ultra 5 365 is a mid-range 8-core (4+4) SoC from the Panther Lake family for notebooks. Furthermore the chip offers support for vPro management features (vPro eligibility).
It integrates a compute tile manufactured by Intel in the new 18A process with 4 large Cougar Cove P cores and up to 2.4 - 4.8 GHz and 4 Darkmont LP (Low Power) E cores with 1.8 - 3.6. Furthermore, the new NPU 5 with 50 TOPS INT 8 and an IPU 7.5 image processor are installed. The integrated memory controller supports up to 96 GB LPDDR5X-7467 or 128 GB DDR5-6400.
The GPU tile contains a fast iGPU with 4 Xe3 cores and ray tracing support and is manufactured by Intel in the Intel 3 process.
The third chiplet integrates the platform controller with 12 PCIe lanes, 4x Thunderbolt 4, Wi-Fi 7 (R2) and Bluetooth Core 6.0. The platform controller is also manufactured at TSMC.
The power consumption is specified from 15 W (minimum assured power) over 25 Watt (processor base power PL1) up to 55 W (maximum Turbo power).
| Model | Intel Core Ultra X7 358H | Intel Core Ultra 7 365 | ||||||||||||||||||||||||||||||||||||||||||||||||||||||||||||||||||||||||||||||||||||||||||||||||||||||||||||||||
| Codename | Panther Lake | Panther Lake | ||||||||||||||||||||||||||||||||||||||||||||||||||||||||||||||||||||||||||||||||||||||||||||||||||||||||||||||||
| Series | Intel Panther Lake | Intel Panther Lake | ||||||||||||||||||||||||||||||||||||||||||||||||||||||||||||||||||||||||||||||||||||||||||||||||||||||||||||||||
| Series: Panther Lake Panther Lake |
|
| ||||||||||||||||||||||||||||||||||||||||||||||||||||||||||||||||||||||||||||||||||||||||||||||||||||||||||||||||
| Clock | 1500 - 4800 MHz | 1800 - 4800 MHz | ||||||||||||||||||||||||||||||||||||||||||||||||||||||||||||||||||||||||||||||||||||||||||||||||||||||||||||||||
| L3 Cache | 18 MB | 12 MB | ||||||||||||||||||||||||||||||||||||||||||||||||||||||||||||||||||||||||||||||||||||||||||||||||||||||||||||||||
| Cores / Threads | 16 / 16 4 x 4.8 GHz Intel Cougar Cove P-Core 8 x 3.7 GHz Intel Darkmont E-Core 4 x 3.3 GHz Intel Darkmont E-Core | 8 / 8 4 x 4.8 GHz Intel Cougar Cove P-Core 4 x 3.6 GHz Intel Darkmont LP E-Core | ||||||||||||||||||||||||||||||||||||||||||||||||||||||||||||||||||||||||||||||||||||||||||||||||||||||||||||||||
| TDP | 25 Watt | 25 Watt | ||||||||||||||||||||||||||||||||||||||||||||||||||||||||||||||||||||||||||||||||||||||||||||||||||||||||||||||||
| TDP Turbo PL2 | 80 Watt | 55 Watt | ||||||||||||||||||||||||||||||||||||||||||||||||||||||||||||||||||||||||||||||||||||||||||||||||||||||||||||||||
| Technology | 2 nm | 1.8 nm | ||||||||||||||||||||||||||||||||||||||||||||||||||||||||||||||||||||||||||||||||||||||||||||||||||||||||||||||||
| max. Temp. | 100 °C | 100 °C | ||||||||||||||||||||||||||||||||||||||||||||||||||||||||||||||||||||||||||||||||||||||||||||||||||||||||||||||||
| Socket | FCBGA2540 | FCBGA2540 | ||||||||||||||||||||||||||||||||||||||||||||||||||||||||||||||||||||||||||||||||||||||||||||||||||||||||||||||||
| iGPU | Intel Arc B390 12 Xe3 Panther Lake iGPU ( - 2500 MHz) | Intel Graphics 4 Xe3 Panther Lake iGPU ( - 2500 MHz) | ||||||||||||||||||||||||||||||||||||||||||||||||||||||||||||||||||||||||||||||||||||||||||||||||||||||||||||||||
| Architecture | x86 | x86 | ||||||||||||||||||||||||||||||||||||||||||||||||||||||||||||||||||||||||||||||||||||||||||||||||||||||||||||||||
| Announced | ||||||||||||||||||||||||||||||||||||||||||||||||||||||||||||||||||||||||||||||||||||||||||||||||||||||||||||||||||
| Manufacturer | www.intel.com | www.intel.com | ||||||||||||||||||||||||||||||||||||||||||||||||||||||||||||||||||||||||||||||||||||||||||||||||||||||||||||||||
| L1 Cache | 2.3 MB | |||||||||||||||||||||||||||||||||||||||||||||||||||||||||||||||||||||||||||||||||||||||||||||||||||||||||||||||||
| L2 Cache | 16 MB | |||||||||||||||||||||||||||||||||||||||||||||||||||||||||||||||||||||||||||||||||||||||||||||||||||||||||||||||||
| NPU / AI | 50 TOPS INT8 |

Benchmarks

* Smaller numbers mean a higher performance