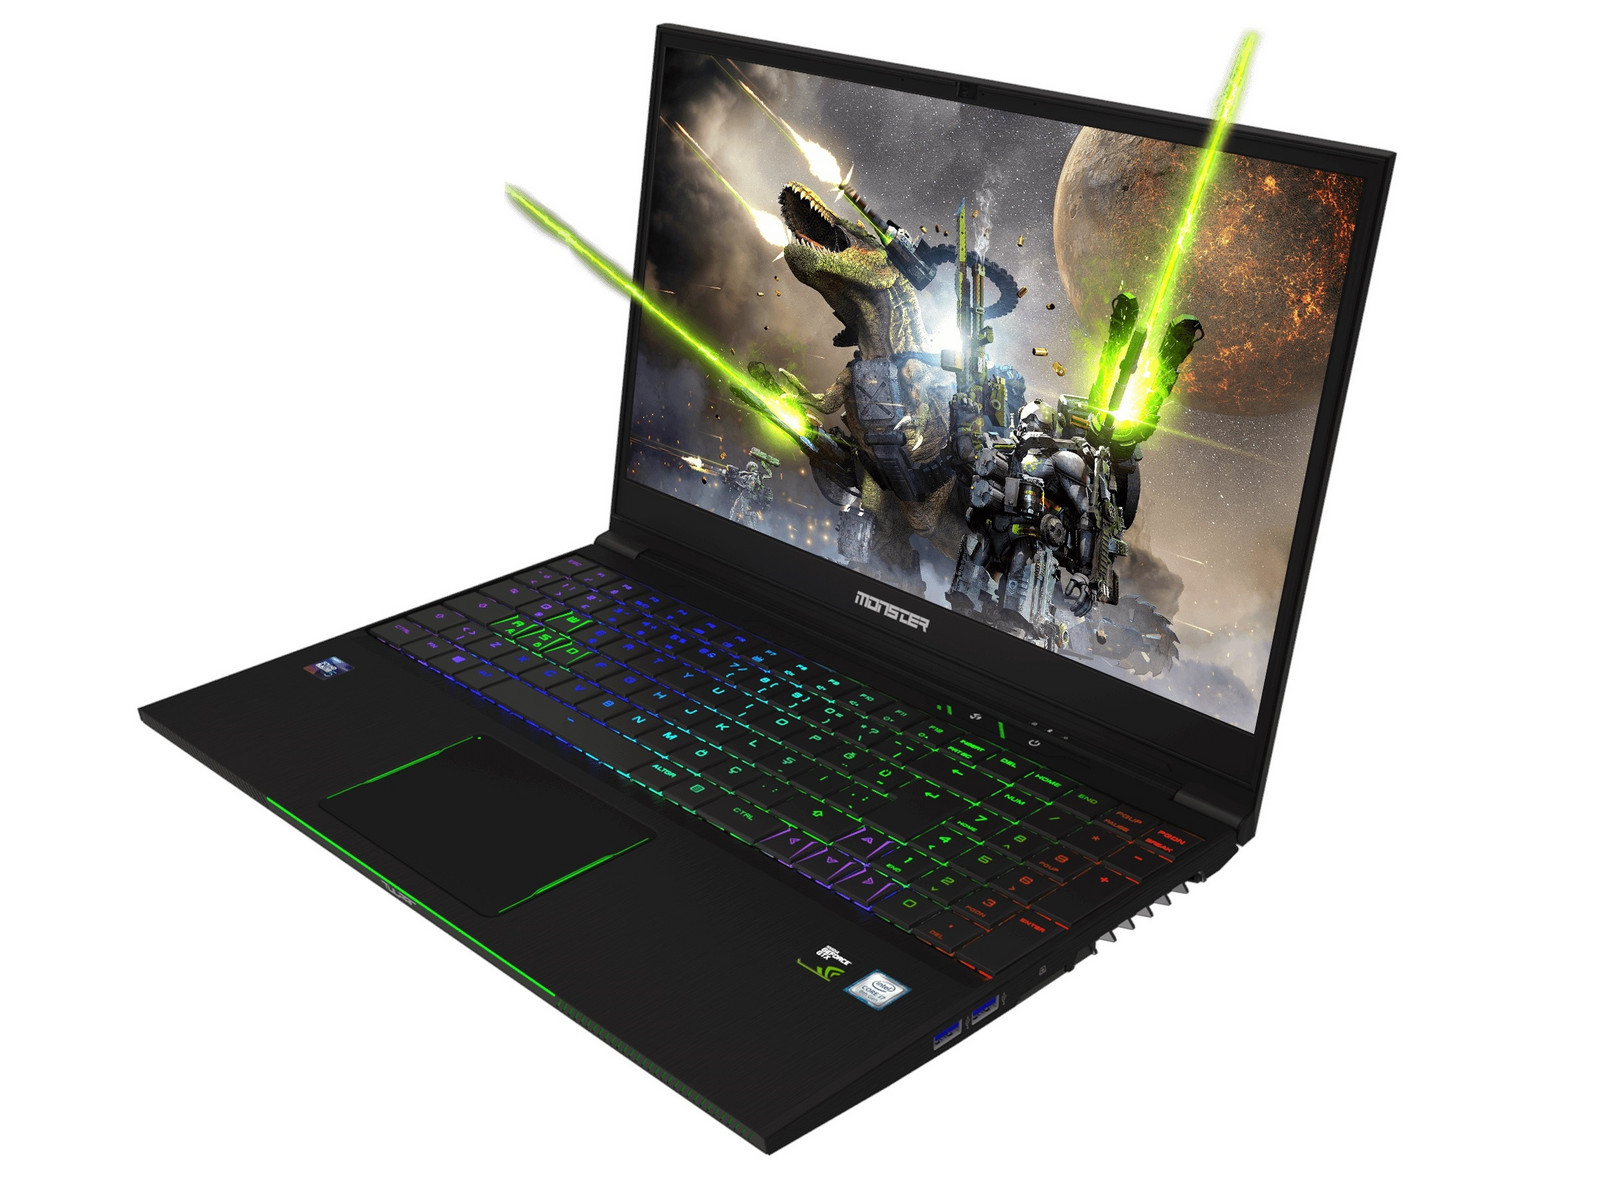
Monster Tulpar T5 (Tongfang GK5CN6Z, i7-8750H, GTX 1060, FHD) Laptop Review

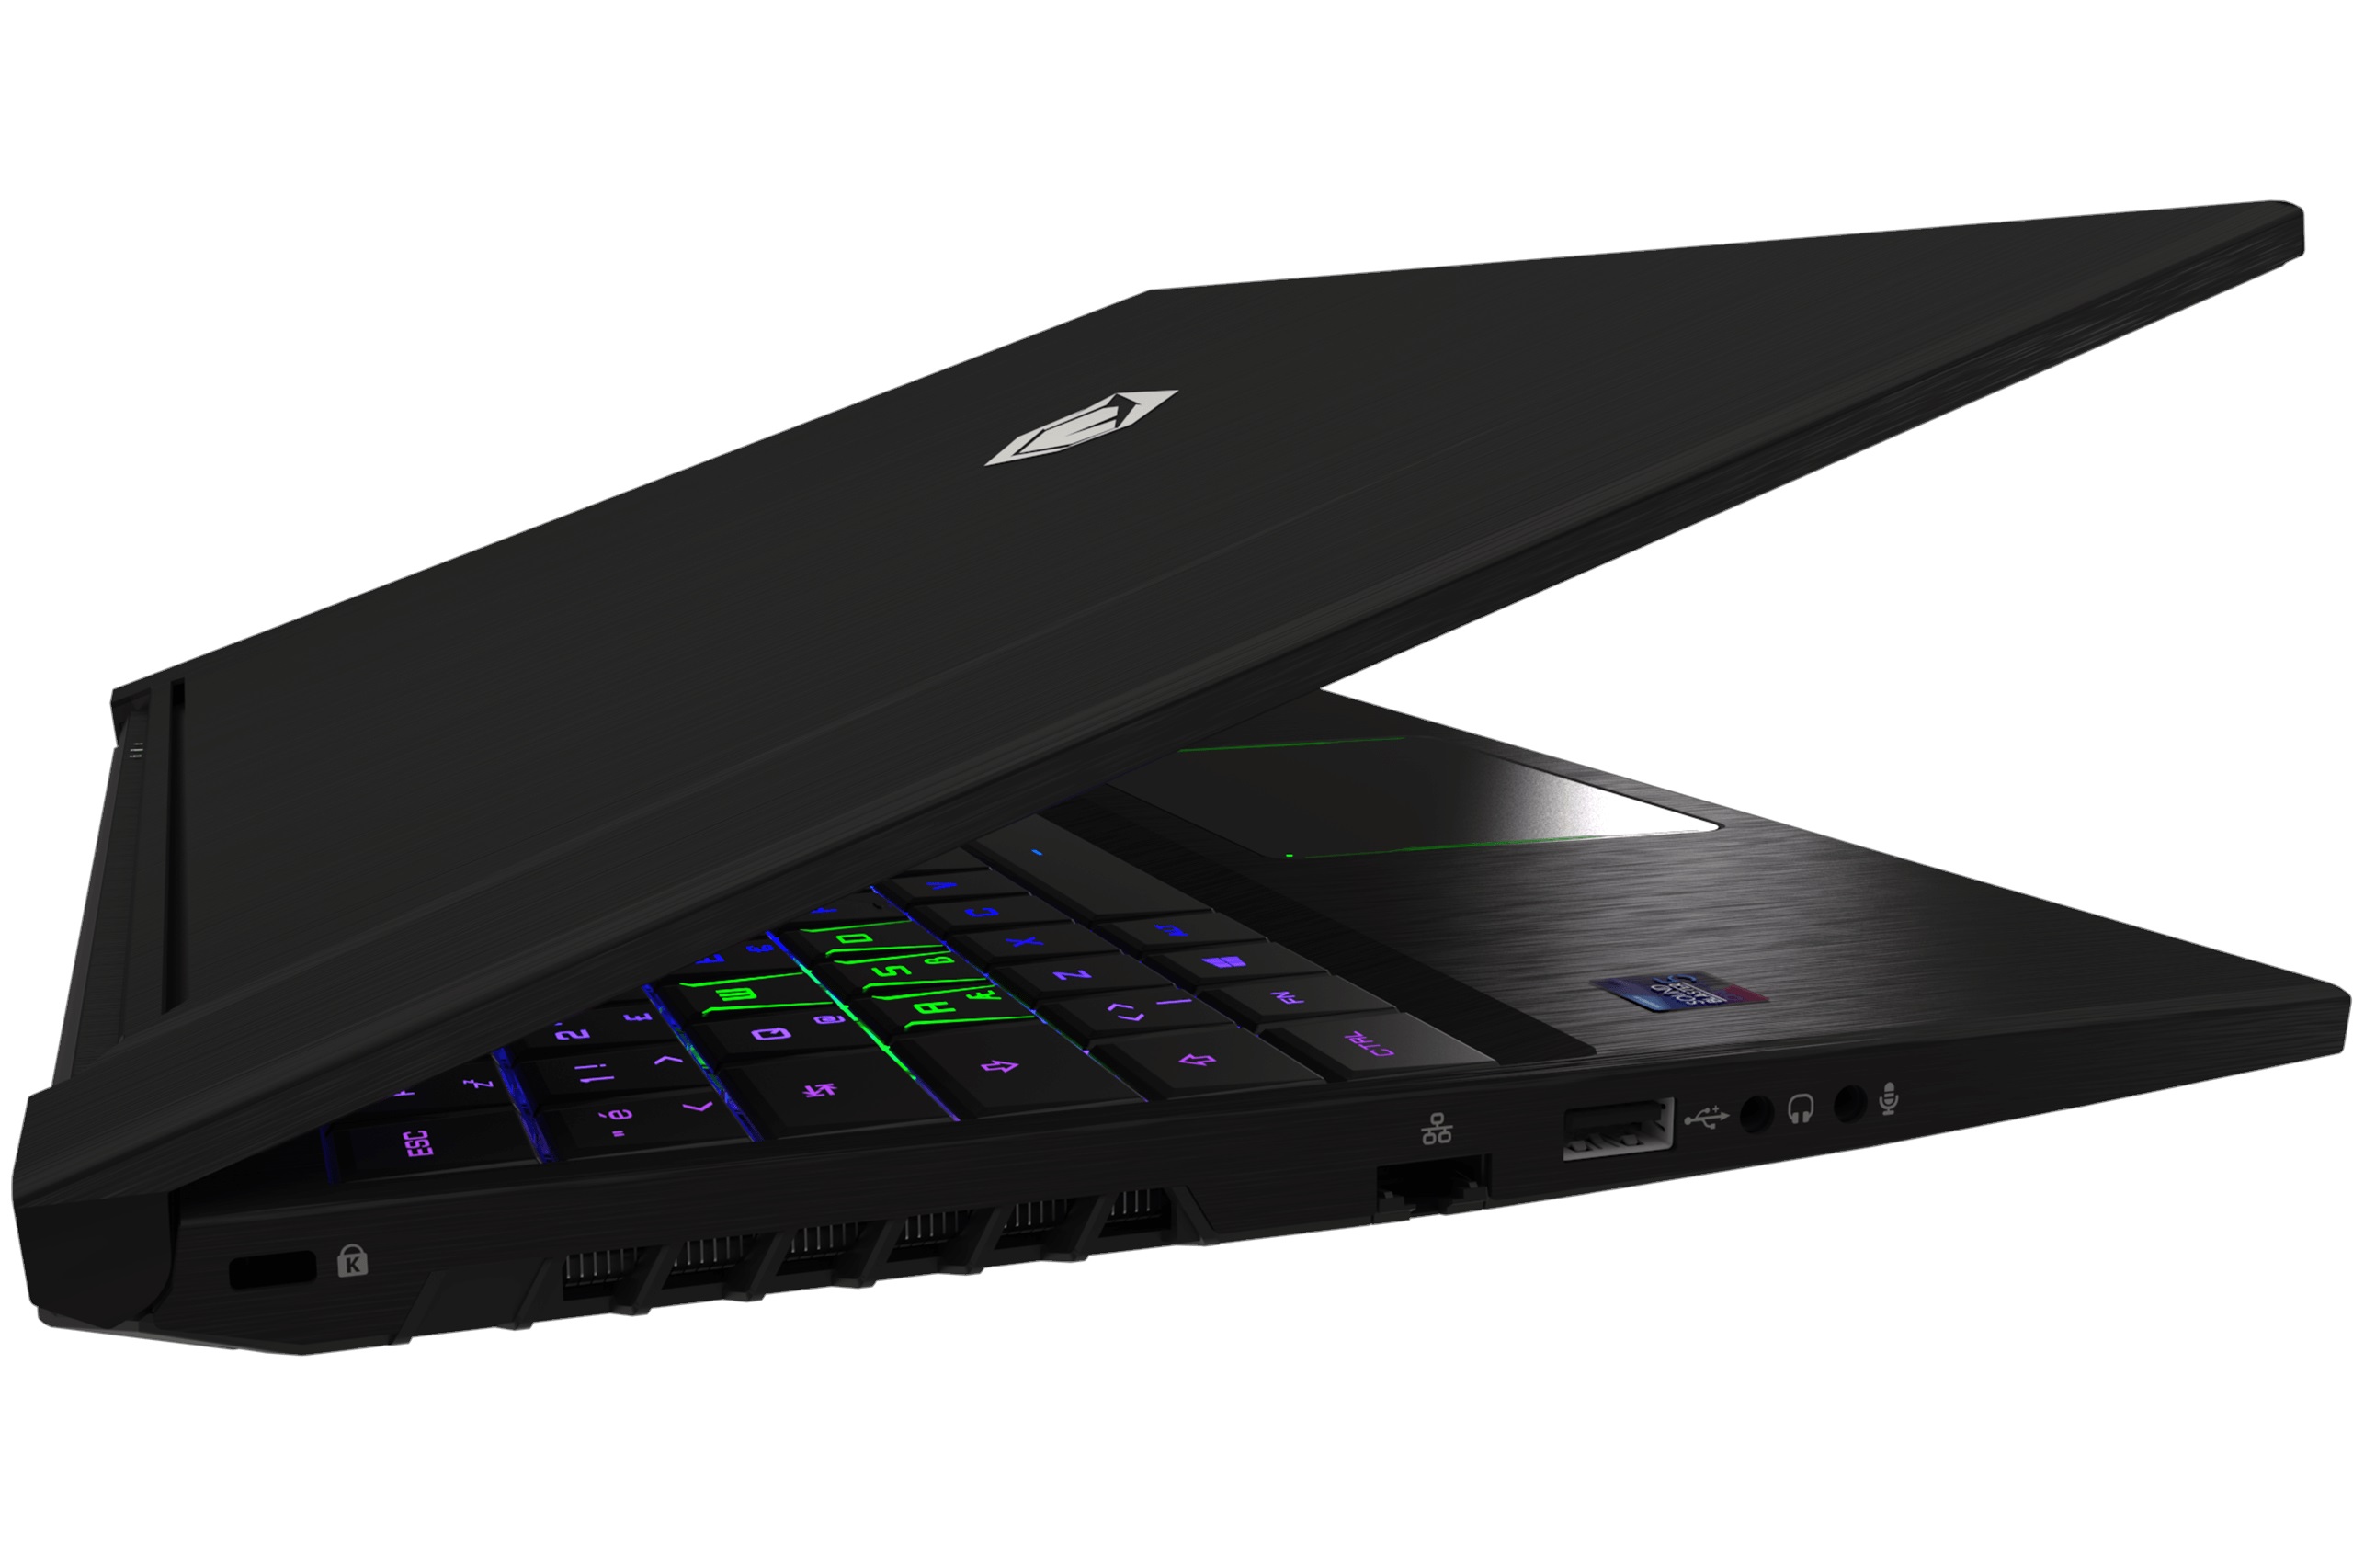
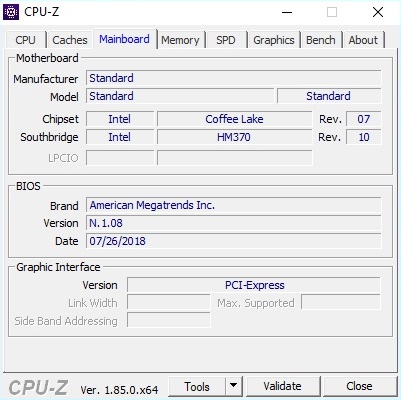
As expected of a barebone reseller, the Tulpar T5 V18.1’s chassis has not been designed and built by Monster but purchased from a third party and adapted to the reseller’s liking. Like Schenker’s XMG Neo 15 Monster selected the Tongfang GK5CN6Z barebone for its laptop, and save for a few details here and there (different keyboard and Turkish keyboard layout) the two are largely identical. Accordingly, we are going to skip the sections on case, connectivity, and input devices and go straight to the display.
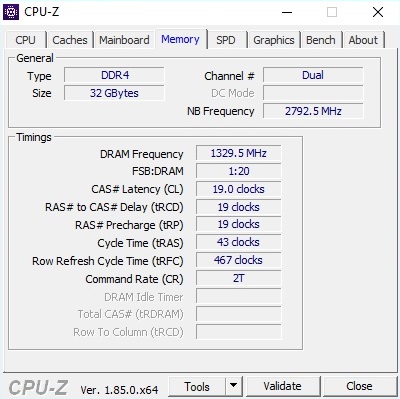
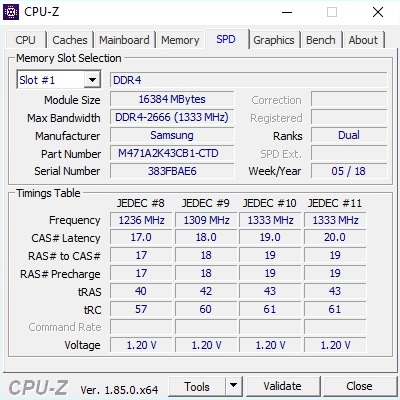
Those of you interested in the Tulpar 15 should take a look at the configurator on Monster’s website. GPU (GeForce GTX 1060) and CPU (Intel Core i7-8750H) are soldered onto the motherboard and are not replaceable, but the RAM (2x DDR4 for up to 32 GB) and mass storage (2x M.2 plus 1x 2.5-inch) can be individually configured. At the time of writing our review unit, equipped with 32 GB of RAM, a 480 GB SSD, and a 1 TB HDD, sold for around $2,000.
Its main competitors are similarly sized 15-inch laptops from our Slim & Light Top 10 list, such as the Max-Q-equipped Razer Blade 15, the MSI GS65 8RF, and the Gigabyte Aero 15X v8 or the Asus ROG GU501GM equipped with a full-fledged Pascal GPU.
| SD Card Reader | |
| average JPG Copy Test (av. of 3 runs) | |
| Gigabyte Aero 15X v8 (Toshiba Exceria Pro SDXC 64 GB UHS-II) | |
| Average of class Gaming (20.9 - 210, n=54, last 2 years) | |
| Monster Tulpar T5 V18.1.1 (Toshiba Exceria Pro SDXC 64 GB UHS-II) | |
| maximum AS SSD Seq Read Test (1GB) | |
| Gigabyte Aero 15X v8 (Toshiba Exceria Pro SDXC 64 GB UHS-II) | |
| Average of class Gaming (25.5 - 261, n=51, last 2 years) | |
| Monster Tulpar T5 V18.1.1 (Toshiba Exceria Pro SDXC 64 GB UHS-II) | |
Display
In addition to a conventional 60 Hz FHD display Monster also offers a 144 Hz FHD panel (LGD05C0). This particular panel can be found in many currently available gaming notebooks, for example the Razer Blade 15 or the Gigabyte Aero 15X.
| |||||||||||||||||||||||||
Brightness Distribution: 89 %
Center on Battery: 335 cd/m²
Contrast: 1015:1 (Black: 0.33 cd/m²)
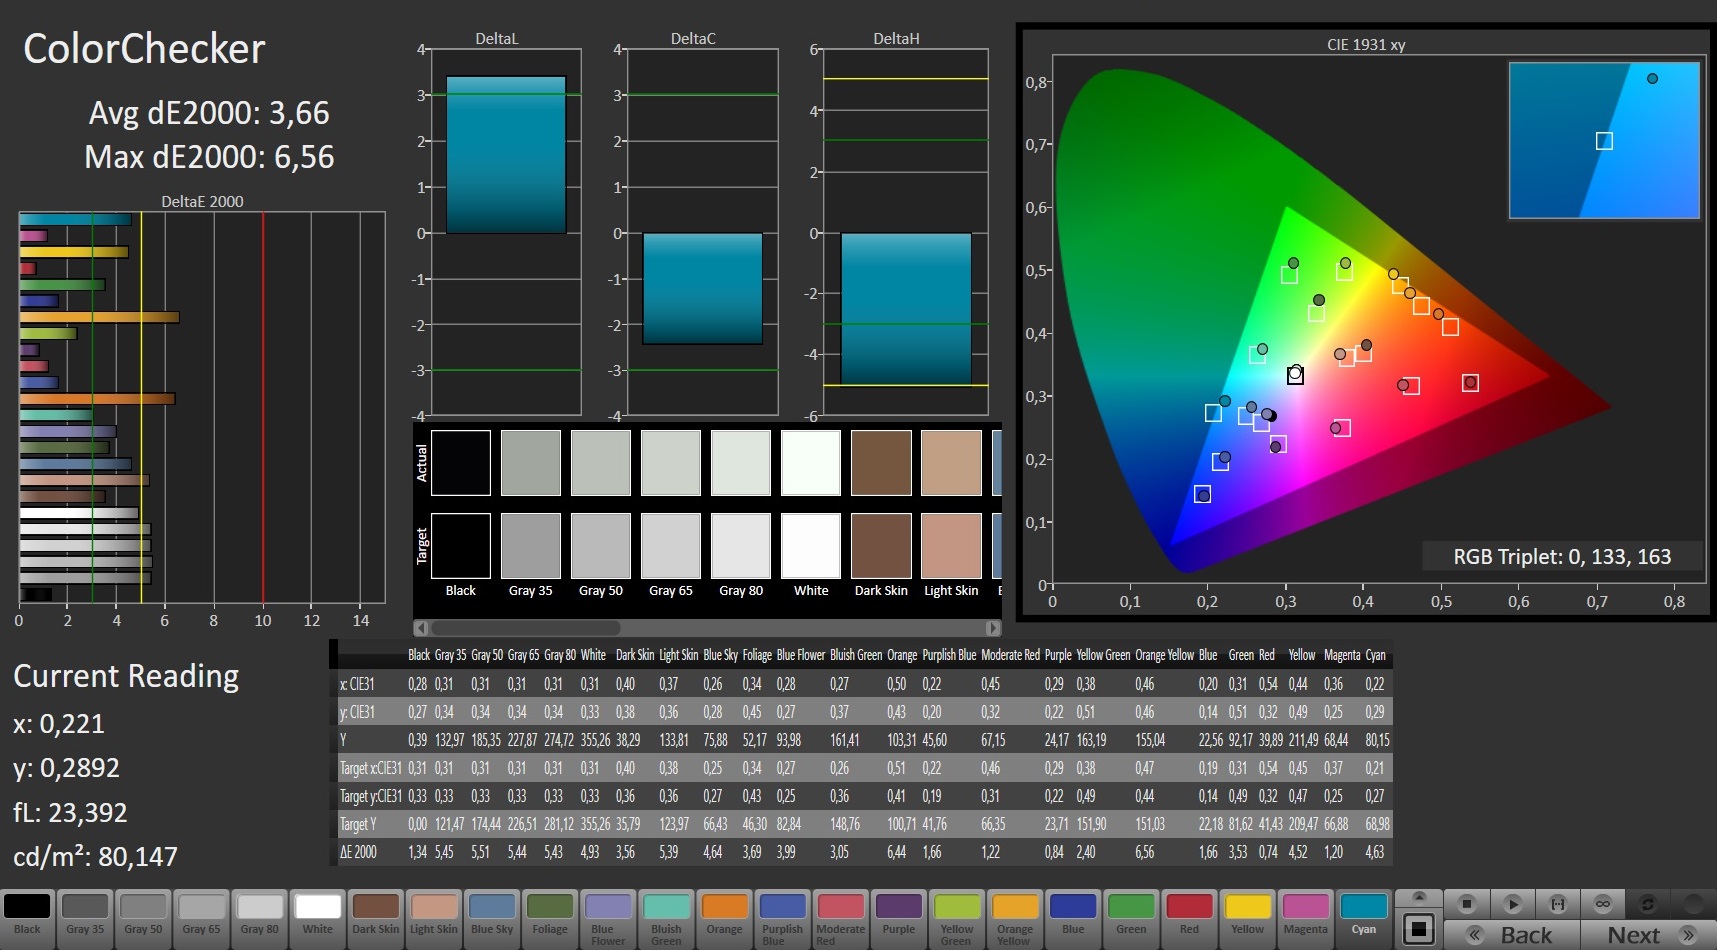
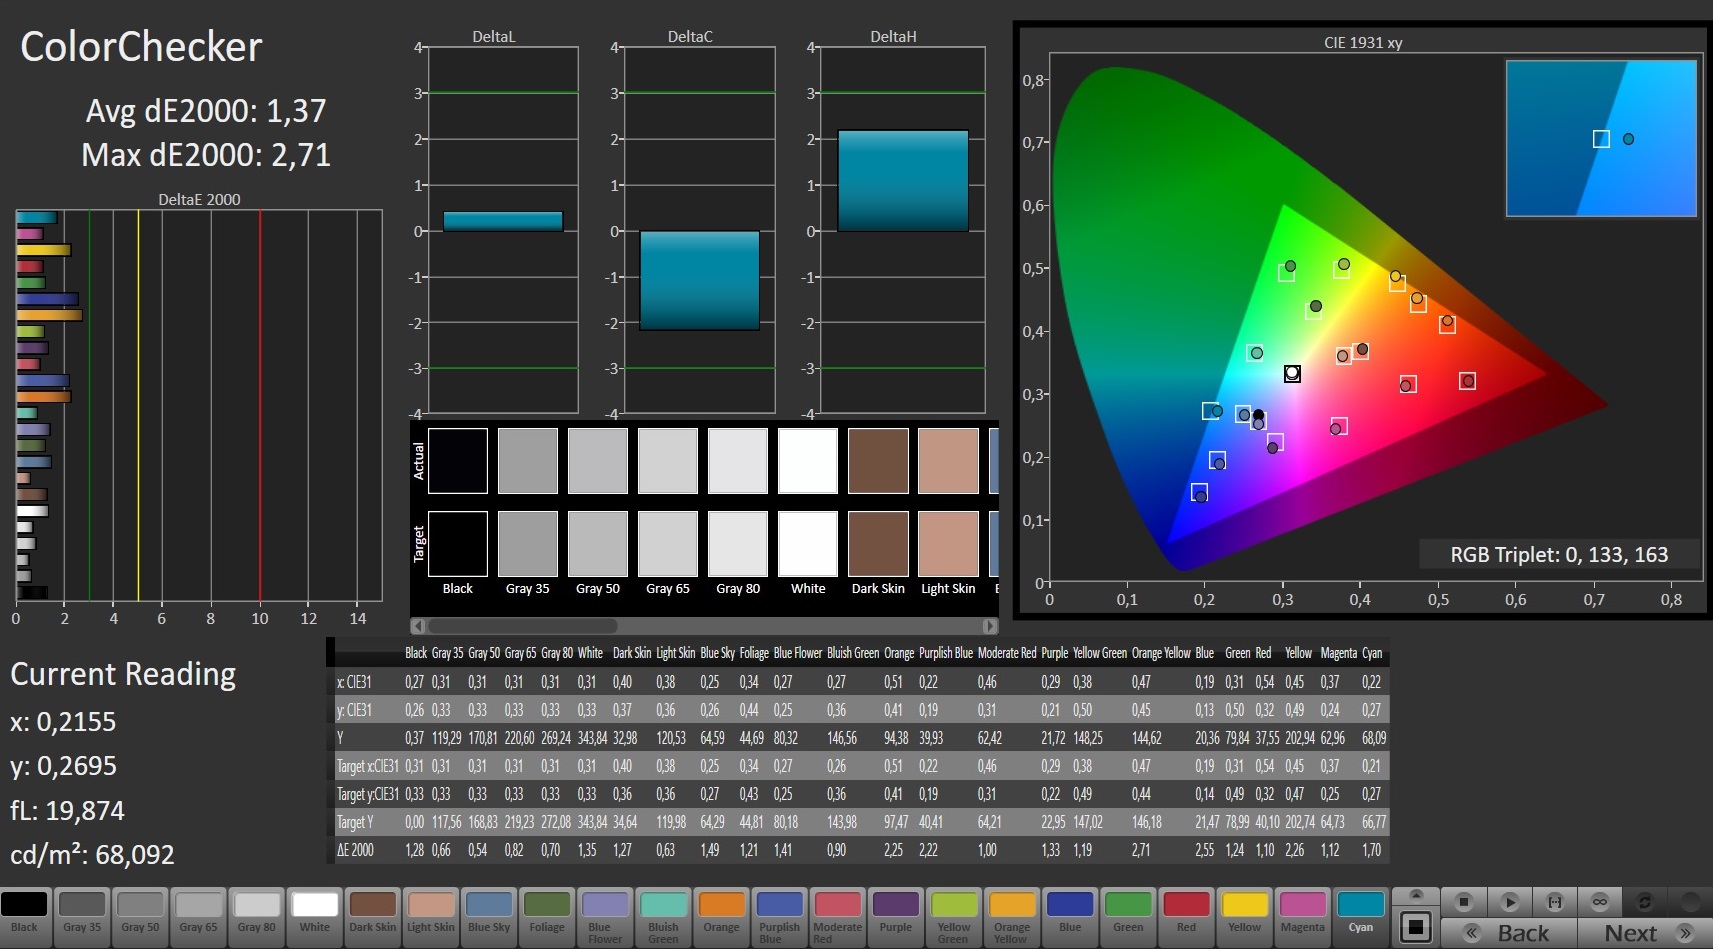
ΔE ColorChecker Calman: 3.66 | ∀{0.5-29.43 Ø4.73}
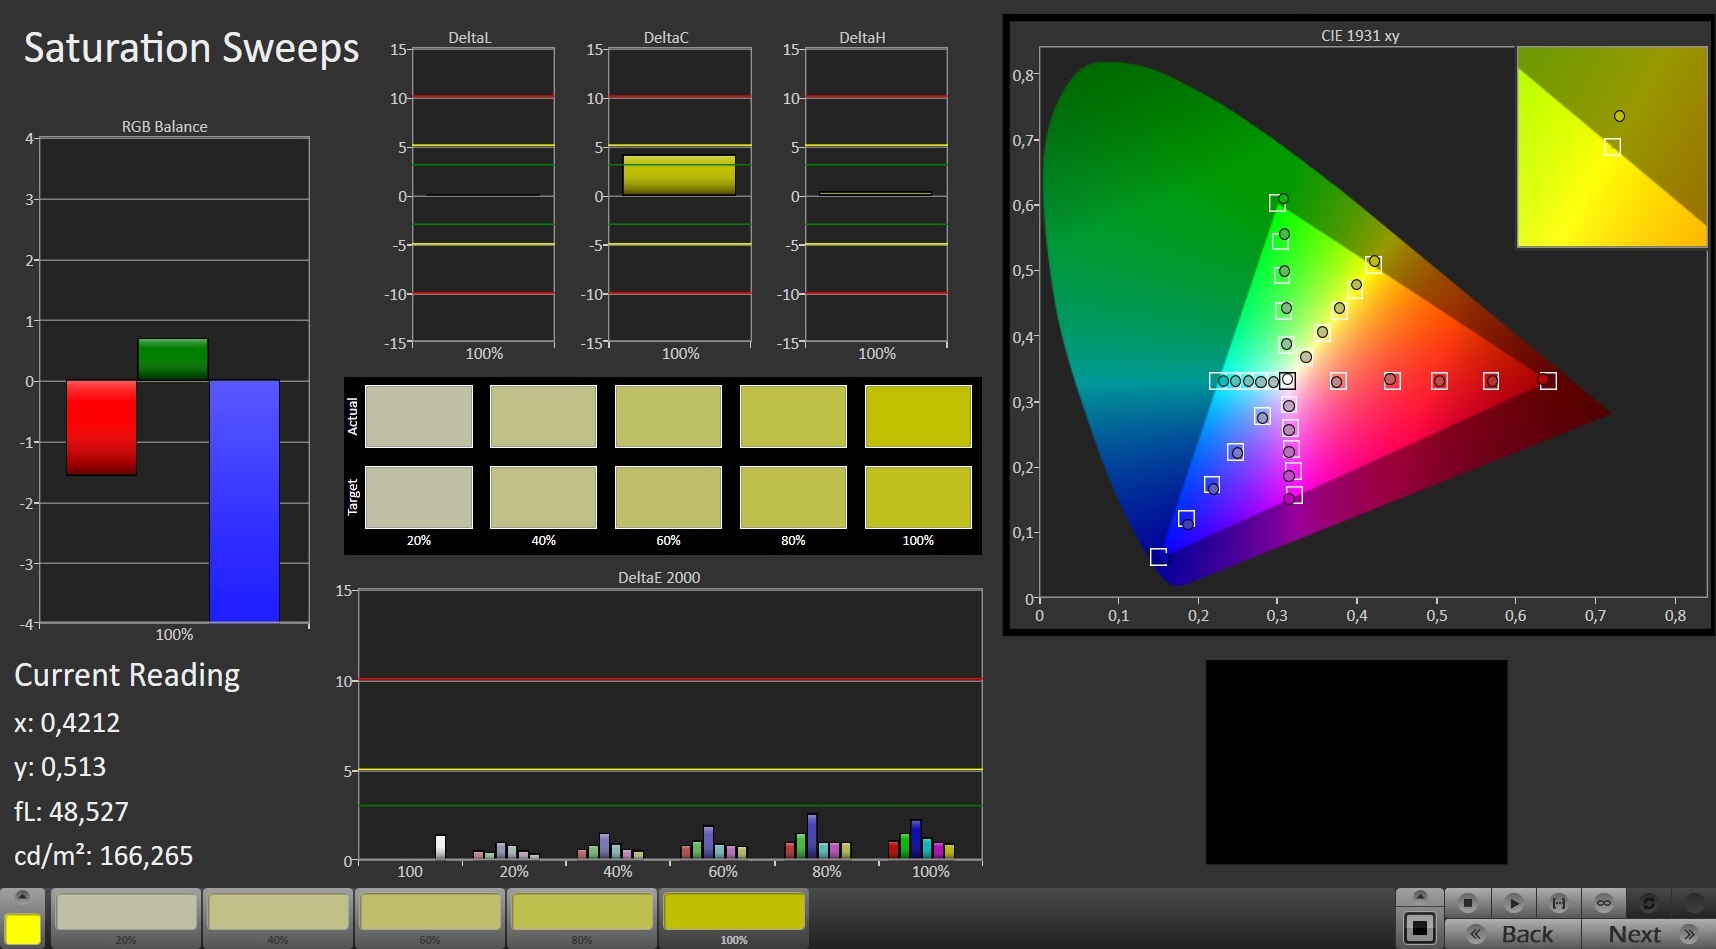
calibrated: 1.37
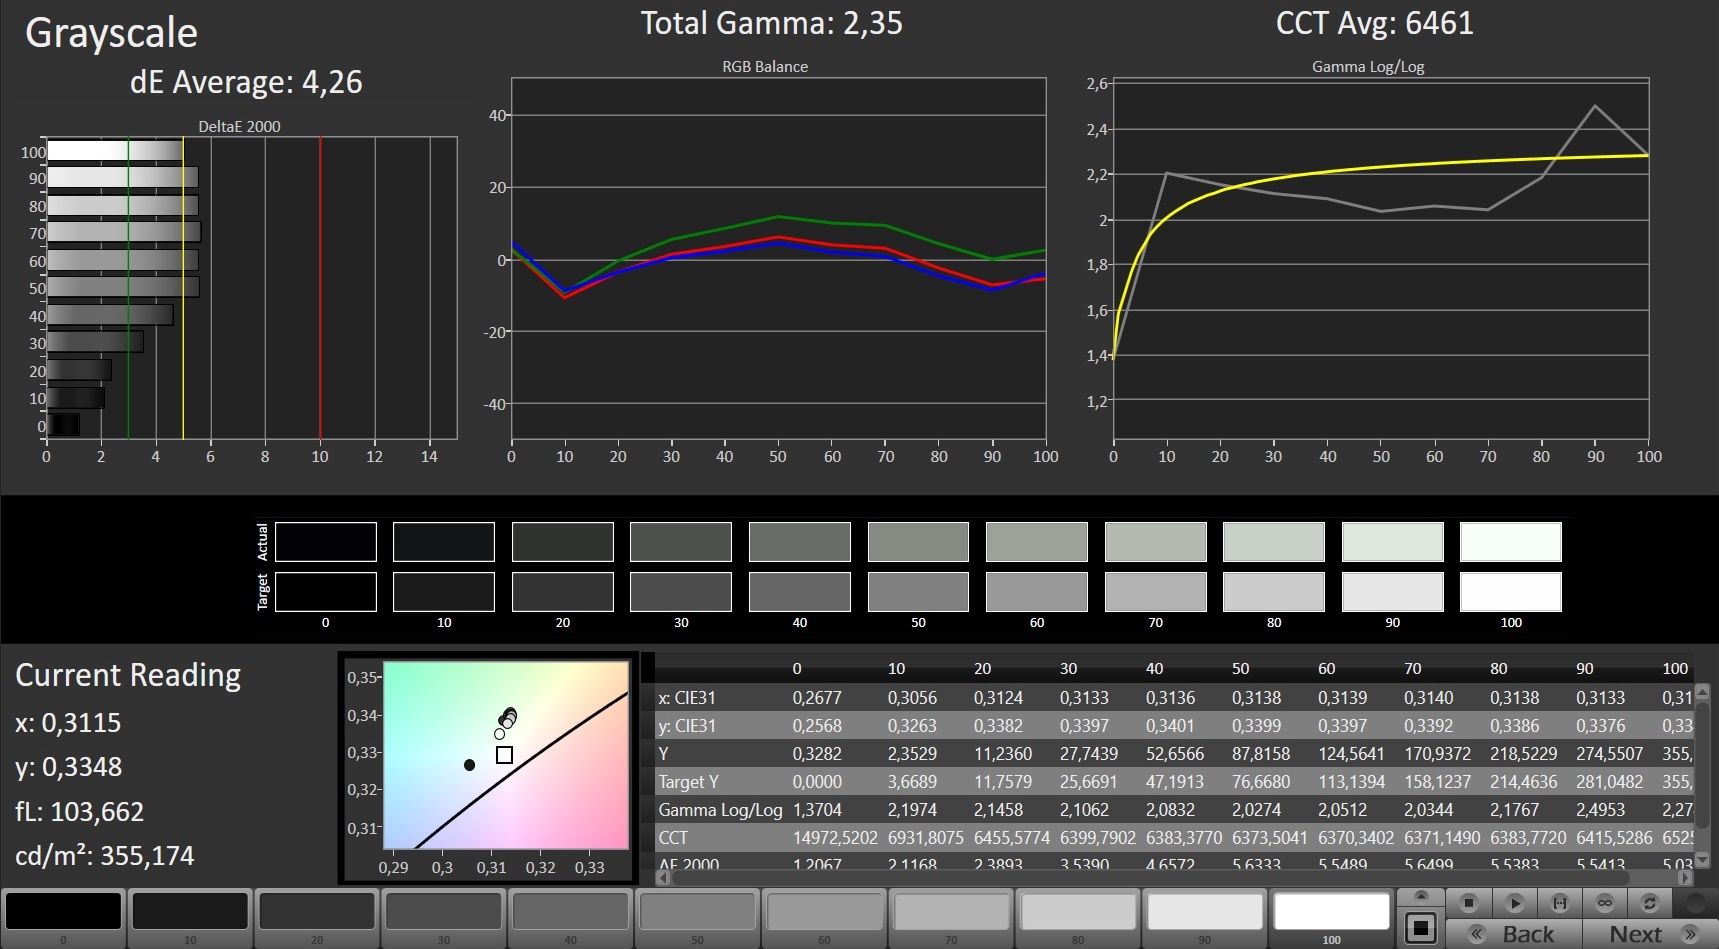
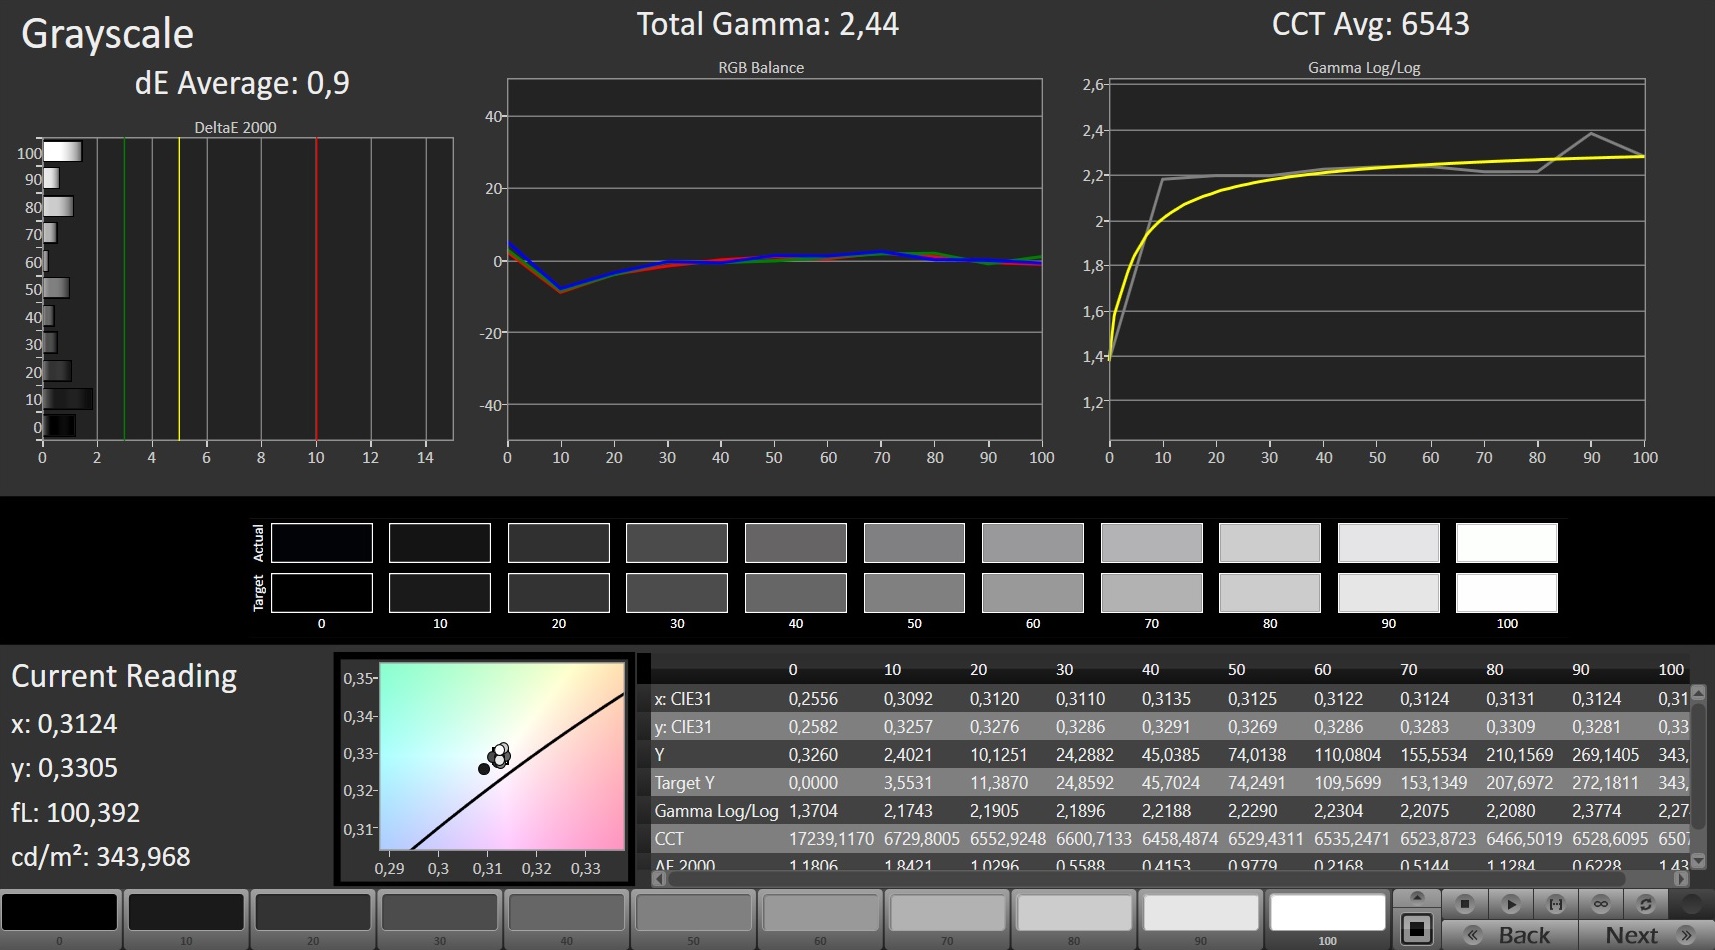
ΔE Greyscale Calman: 4.26 | ∀{0.09-98 Ø4.97}
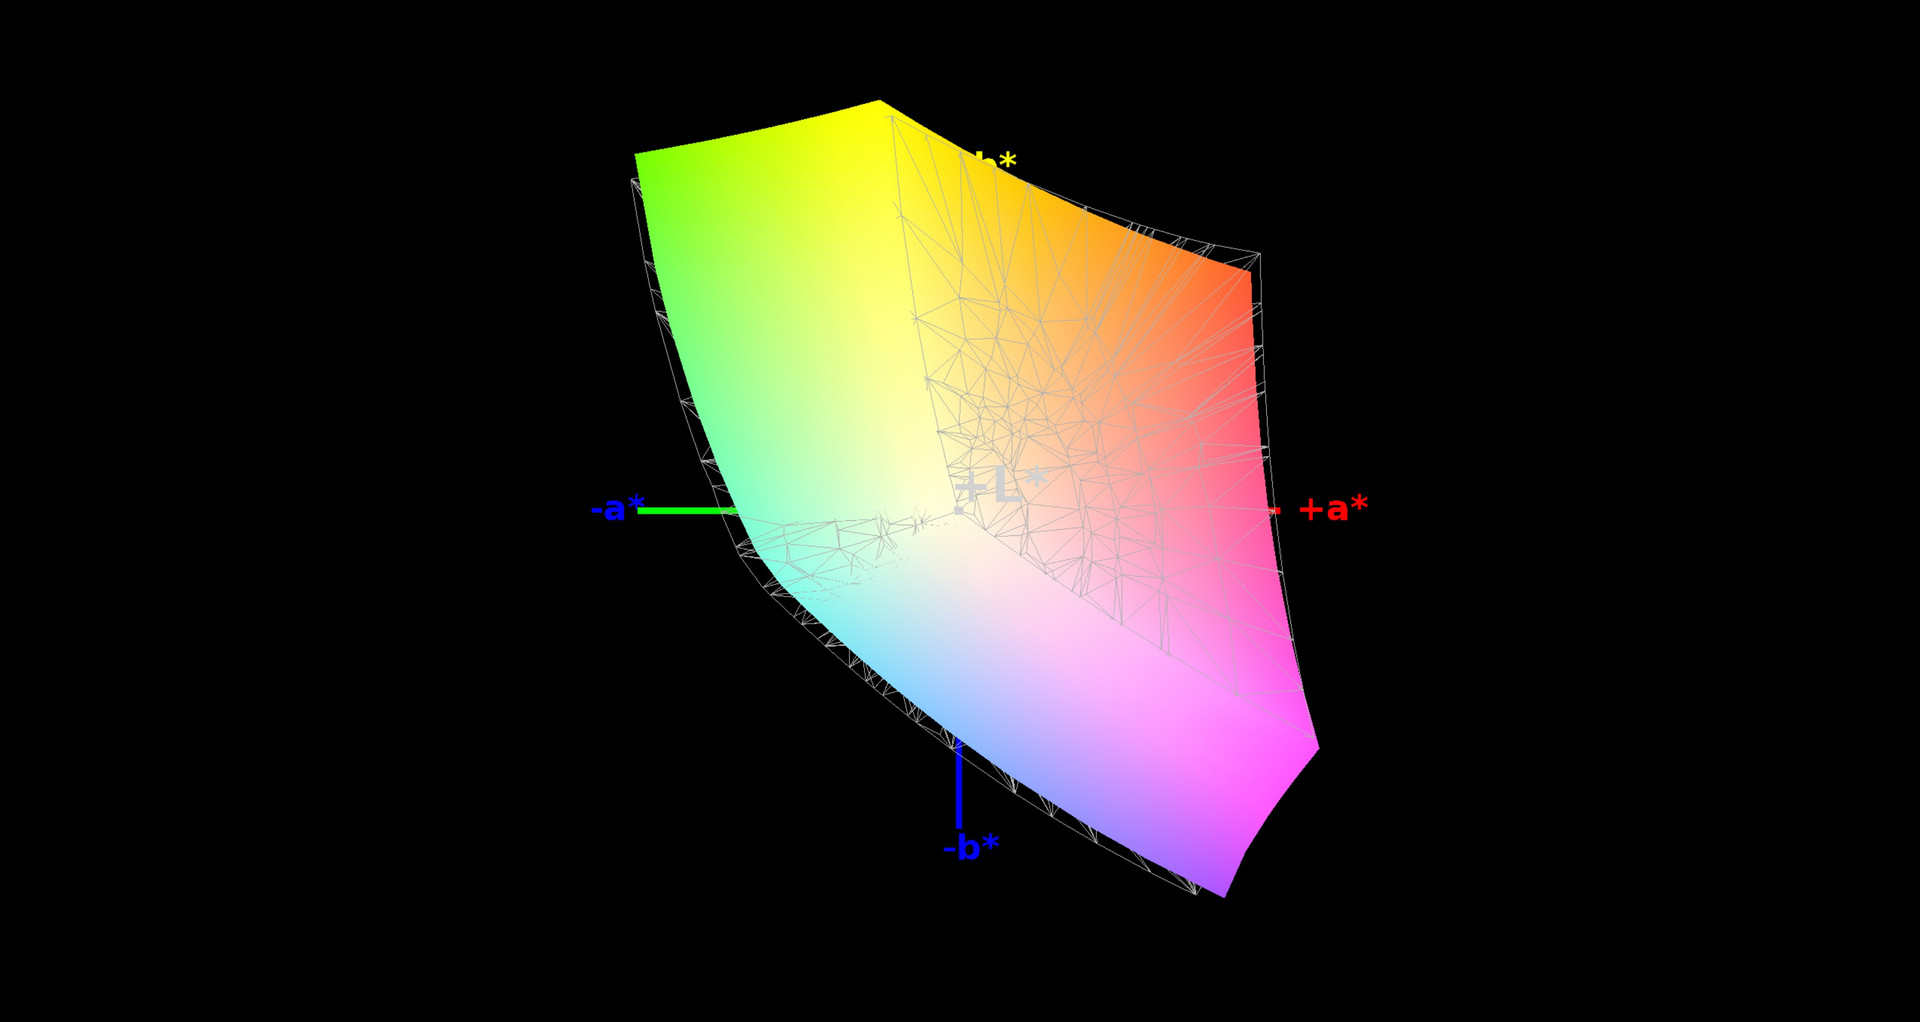
94% sRGB (Argyll 1.6.3 3D)
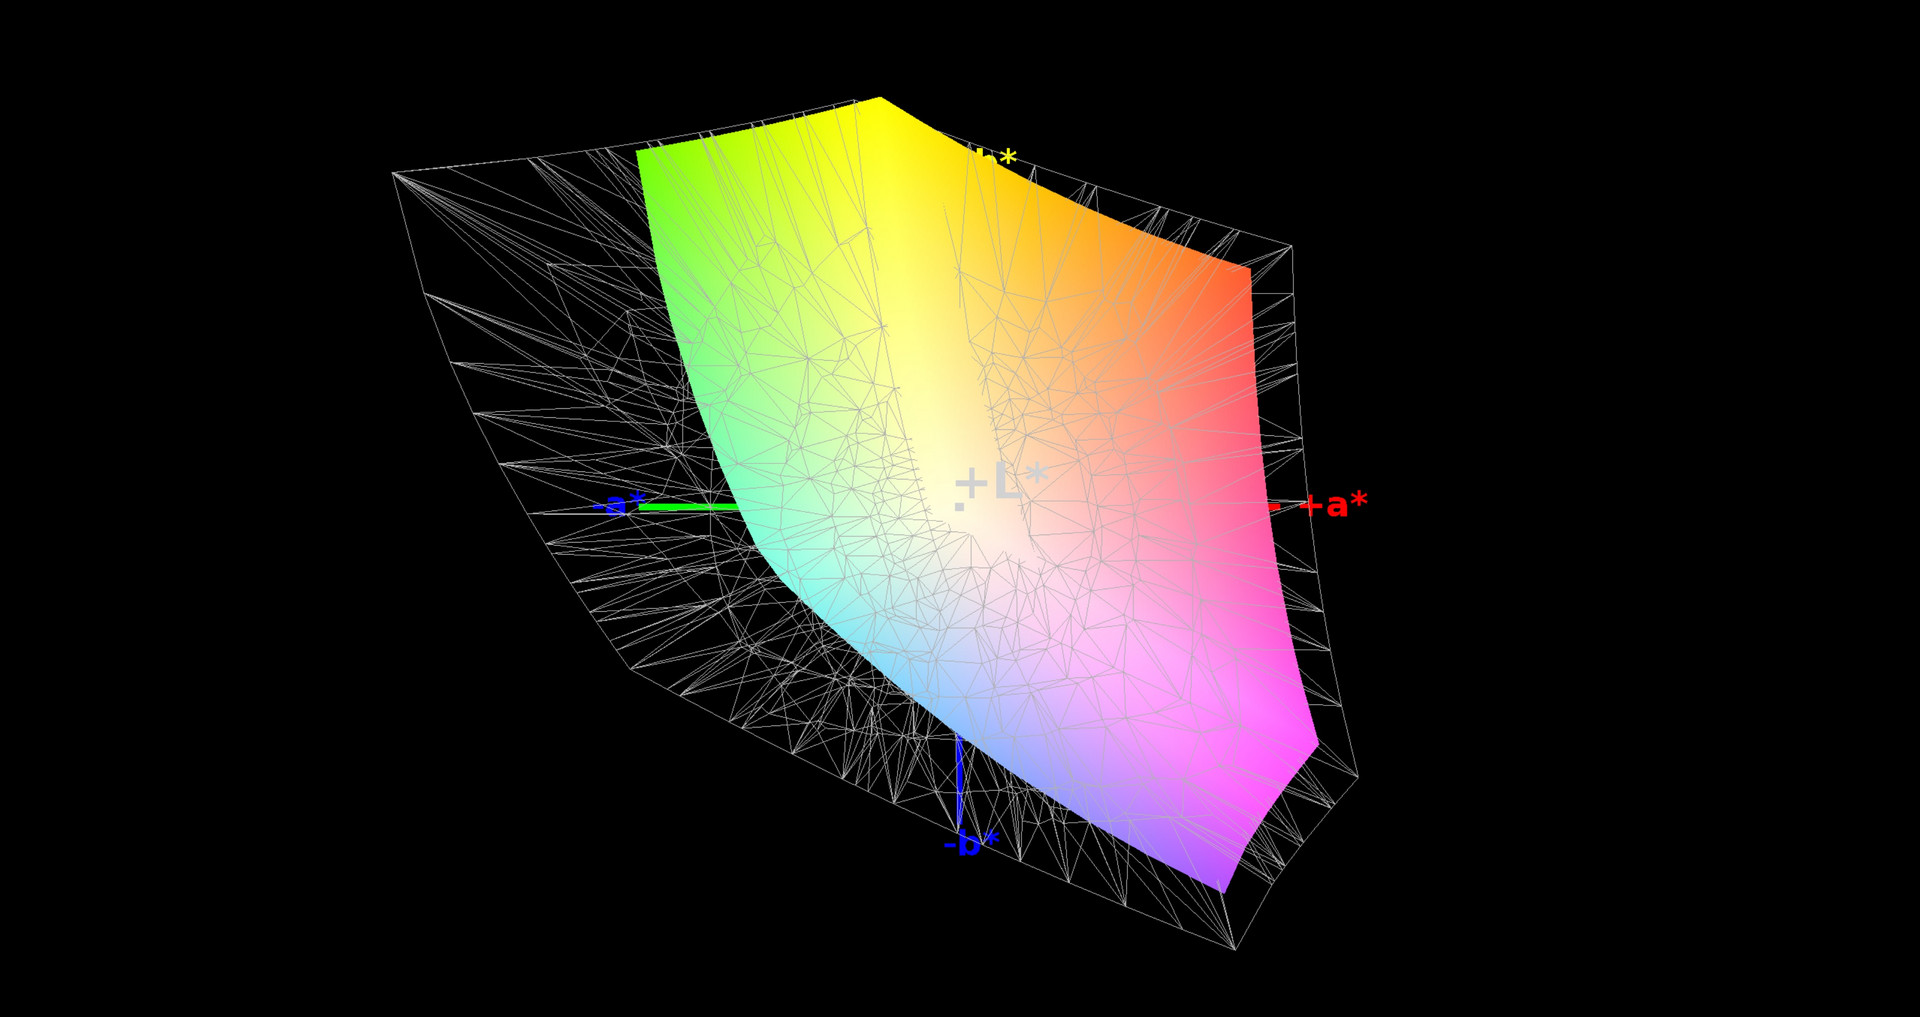
61% AdobeRGB 1998 (Argyll 1.6.3 3D)
66.3% AdobeRGB 1998 (Argyll 3D)
94.3% sRGB (Argyll 3D)
64.8% Display P3 (Argyll 3D)
Gamma: 2.35
CCT: 6461 K
| Monster Tulpar T5 V18.1.1 LGD05C0, IPS, 1920x1080 | Asus ROG GU501GM-BI7N8 AU Optronics AUO45ED, IPS, 1920x1080 | Razer Blade 15 GTX 1060 LGD05C0, IPS, 1920x1080 | MSI GS65 8RF-019DE Stealth Thin AU Optronics B156HAN08.0 (AUO80ED), IPS, 1920x1080 | Gigabyte Aero 15X v8 LGD05C0, IPS, 1920x1080 | |
|---|---|---|---|---|---|
| Display | -5% | -1% | 0% | -2% | |
| Display P3 Coverage (%) | 64.8 | 63.4 -2% | 64.4 -1% | 66.2 2% | 63.6 -2% |
| sRGB Coverage (%) | 94.3 | 87.7 -7% | 93.4 -1% | 92.1 -2% | 93.8 -1% |
| AdobeRGB 1998 Coverage (%) | 66.3 | 65.5 -1% | 67.2 1% | 64.9 -2% | |
| Response Times | -112% | 8% | -9% | 1% | |
| Response Time Grey 50% / Grey 80% * (ms) | 16 ? | 30.8 ? -93% | 13.6 ? 15% | 17.6 ? -10% | 16.8 ? -5% |
| Response Time Black / White * (ms) | 12 ? | 27.6 ? -130% | 12 ? -0% | 12.8 ? -7% | 11.2 ? 7% |
| PWM Frequency (Hz) | |||||
| Screen | -7% | 10% | 9% | 19% | |
| Brightness middle (cd/m²) | 335 | 286.7 -14% | 304.3 -9% | 254 -24% | 313 -7% |
| Brightness (cd/m²) | 315 | 281 -11% | 293 -7% | 262 -17% | 300 -5% |
| Brightness Distribution (%) | 89 | 92 3% | 80 -10% | 89 0% | 78 -12% |
| Black Level * (cd/m²) | 0.33 | 0.39 -18% | 0.38 -15% | 0.22 33% | 0.33 -0% |
| Contrast (:1) | 1015 | 735 -28% | 801 -21% | 1155 14% | 948 -7% |
| Colorchecker dE 2000 * | 3.66 | 4.17 -14% | 1.79 51% | 2.37 35% | 1.29 65% |
| Colorchecker dE 2000 max. * | 6.56 | 7.22 -10% | 3.69 44% | 4.71 28% | 2.04 69% |
| Colorchecker dE 2000 calibrated * | 1.37 | 1.84 -34% | |||
| Greyscale dE 2000 * | 4.26 | 2.5 41% | 1.1 74% | 1.58 63% | 0.69 84% |
| Gamma | 2.35 94% | 2.274 97% | 2.27 97% | 2.48 89% | 2.43 91% |
| CCT | 6461 101% | 6885 94% | 6665 98% | 6785 96% | 6550 99% |
| Color Space (Percent of AdobeRGB 1998) (%) | 61 | 57 -7% | 59.8 -2% | 60 -2% | 60 -2% |
| Color Space (Percent of sRGB) (%) | 94 | 87 -7% | 92.8 -1% | 92 -2% | 94 0% |
| Total Average (Program / Settings) | -41% /
-21% | 6% /
8% | 0% /
5% | 6% /
12% |
* ... smaller is better
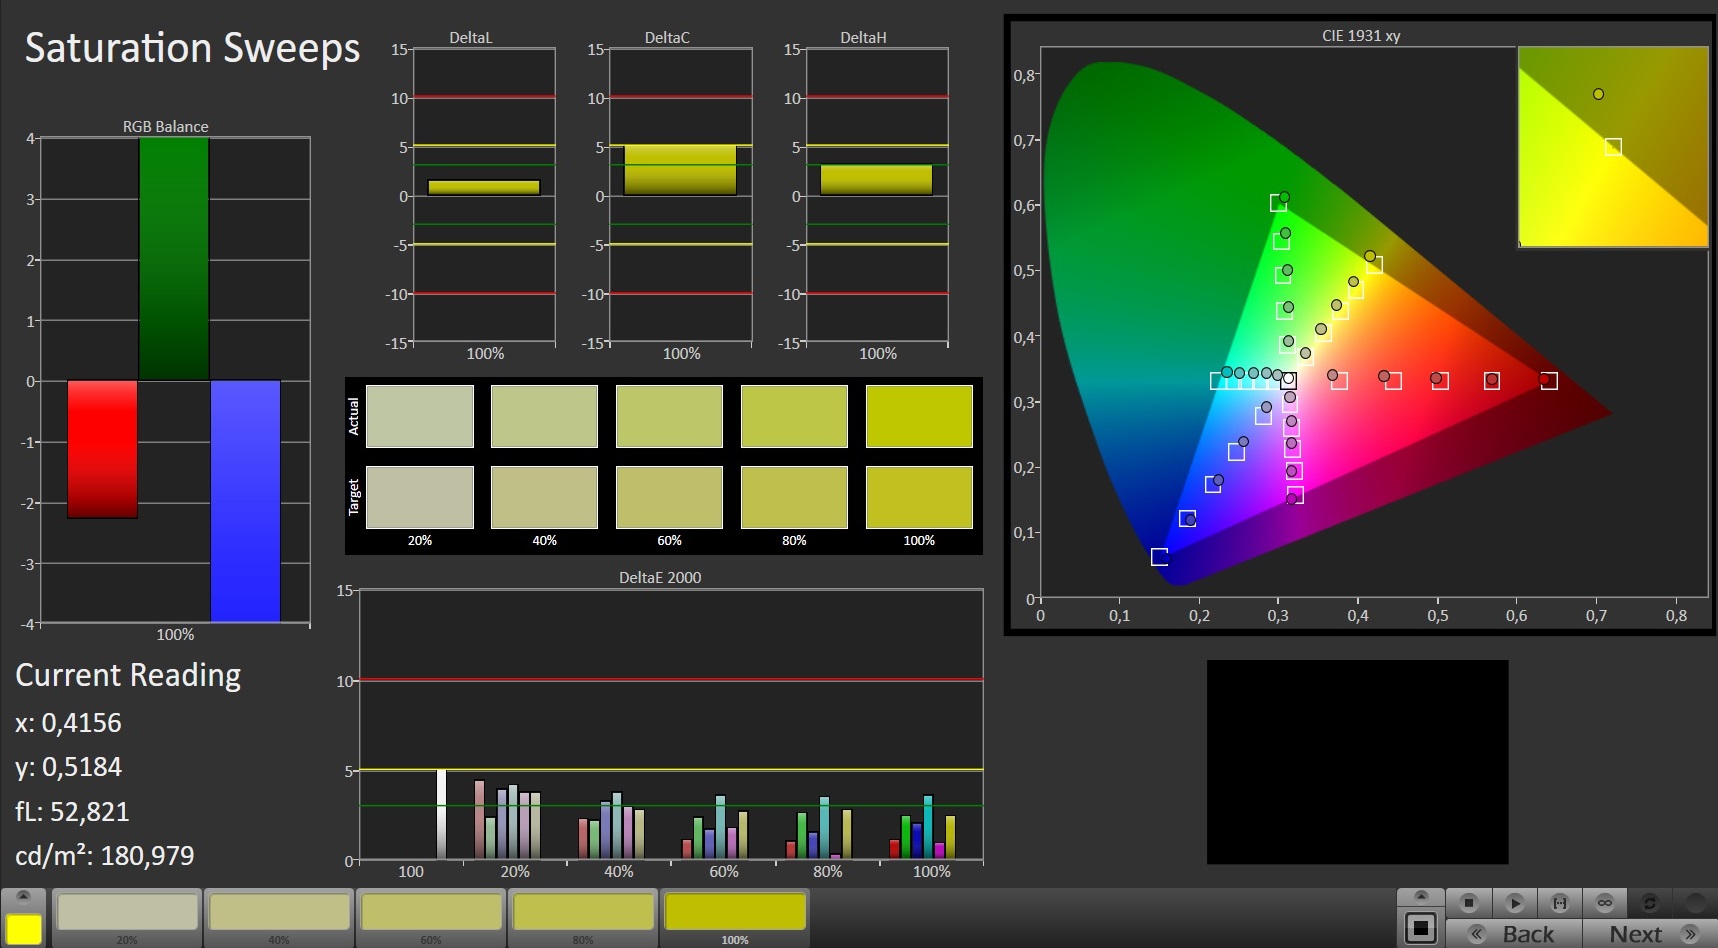
This choice is no surprise given the panel’s overall quality. Our review unit offered a respectable average brightness of 315 nits and a contrast ratio of 1,000:1 at a black level of 0.33 nits. At 94%, sRGB color-space coverage was very decent.
Viewing angles were very wide and the panel did not suffer from color distortions at acute angles.
Even the response times were surprisingly low for an IPS panel. 12 ms black-to-white and 16 ms gray-to-gray are more common for TN panels. Our only gripe with the display was the brightness distribution as it suffered from visible halations around the edges.
Display Response Times
| ↔ Response Time Black to White | ||
|---|---|---|
| 12 ms ... rise ↗ and fall ↘ combined | ↗ 6.8 ms rise | 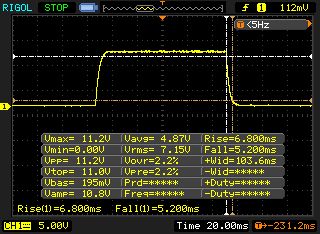 |
| ↘ 5.2 ms fall | ||
| The screen shows good response rates in our tests, but may be too slow for competitive gamers. In comparison, all tested devices range from 0.1 (minimum) to 240 (maximum) ms. » 31 % of all devices are better. This means that the measured response time is better than the average of all tested devices (19.9 ms). | ||
| ↔ Response Time 50% Grey to 80% Grey | ||
| 16 ms ... rise ↗ and fall ↘ combined | ↗ 8.4 ms rise | 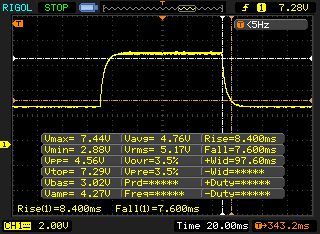 |
| ↘ 7.6 ms fall | ||
| The screen shows good response rates in our tests, but may be too slow for competitive gamers. In comparison, all tested devices range from 0.165 (minimum) to 636 (maximum) ms. » 30 % of all devices are better. This means that the measured response time is better than the average of all tested devices (31.1 ms). | ||
Screen Flickering / PWM (Pulse-Width Modulation)
| Screen flickering / PWM not detected | 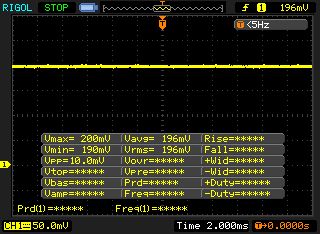 | ||
In comparison: 52 % of all tested devices do not use PWM to dim the display. If PWM was detected, an average of 7784 (minimum: 5 - maximum: 343500) Hz was measured. | |||
Performance
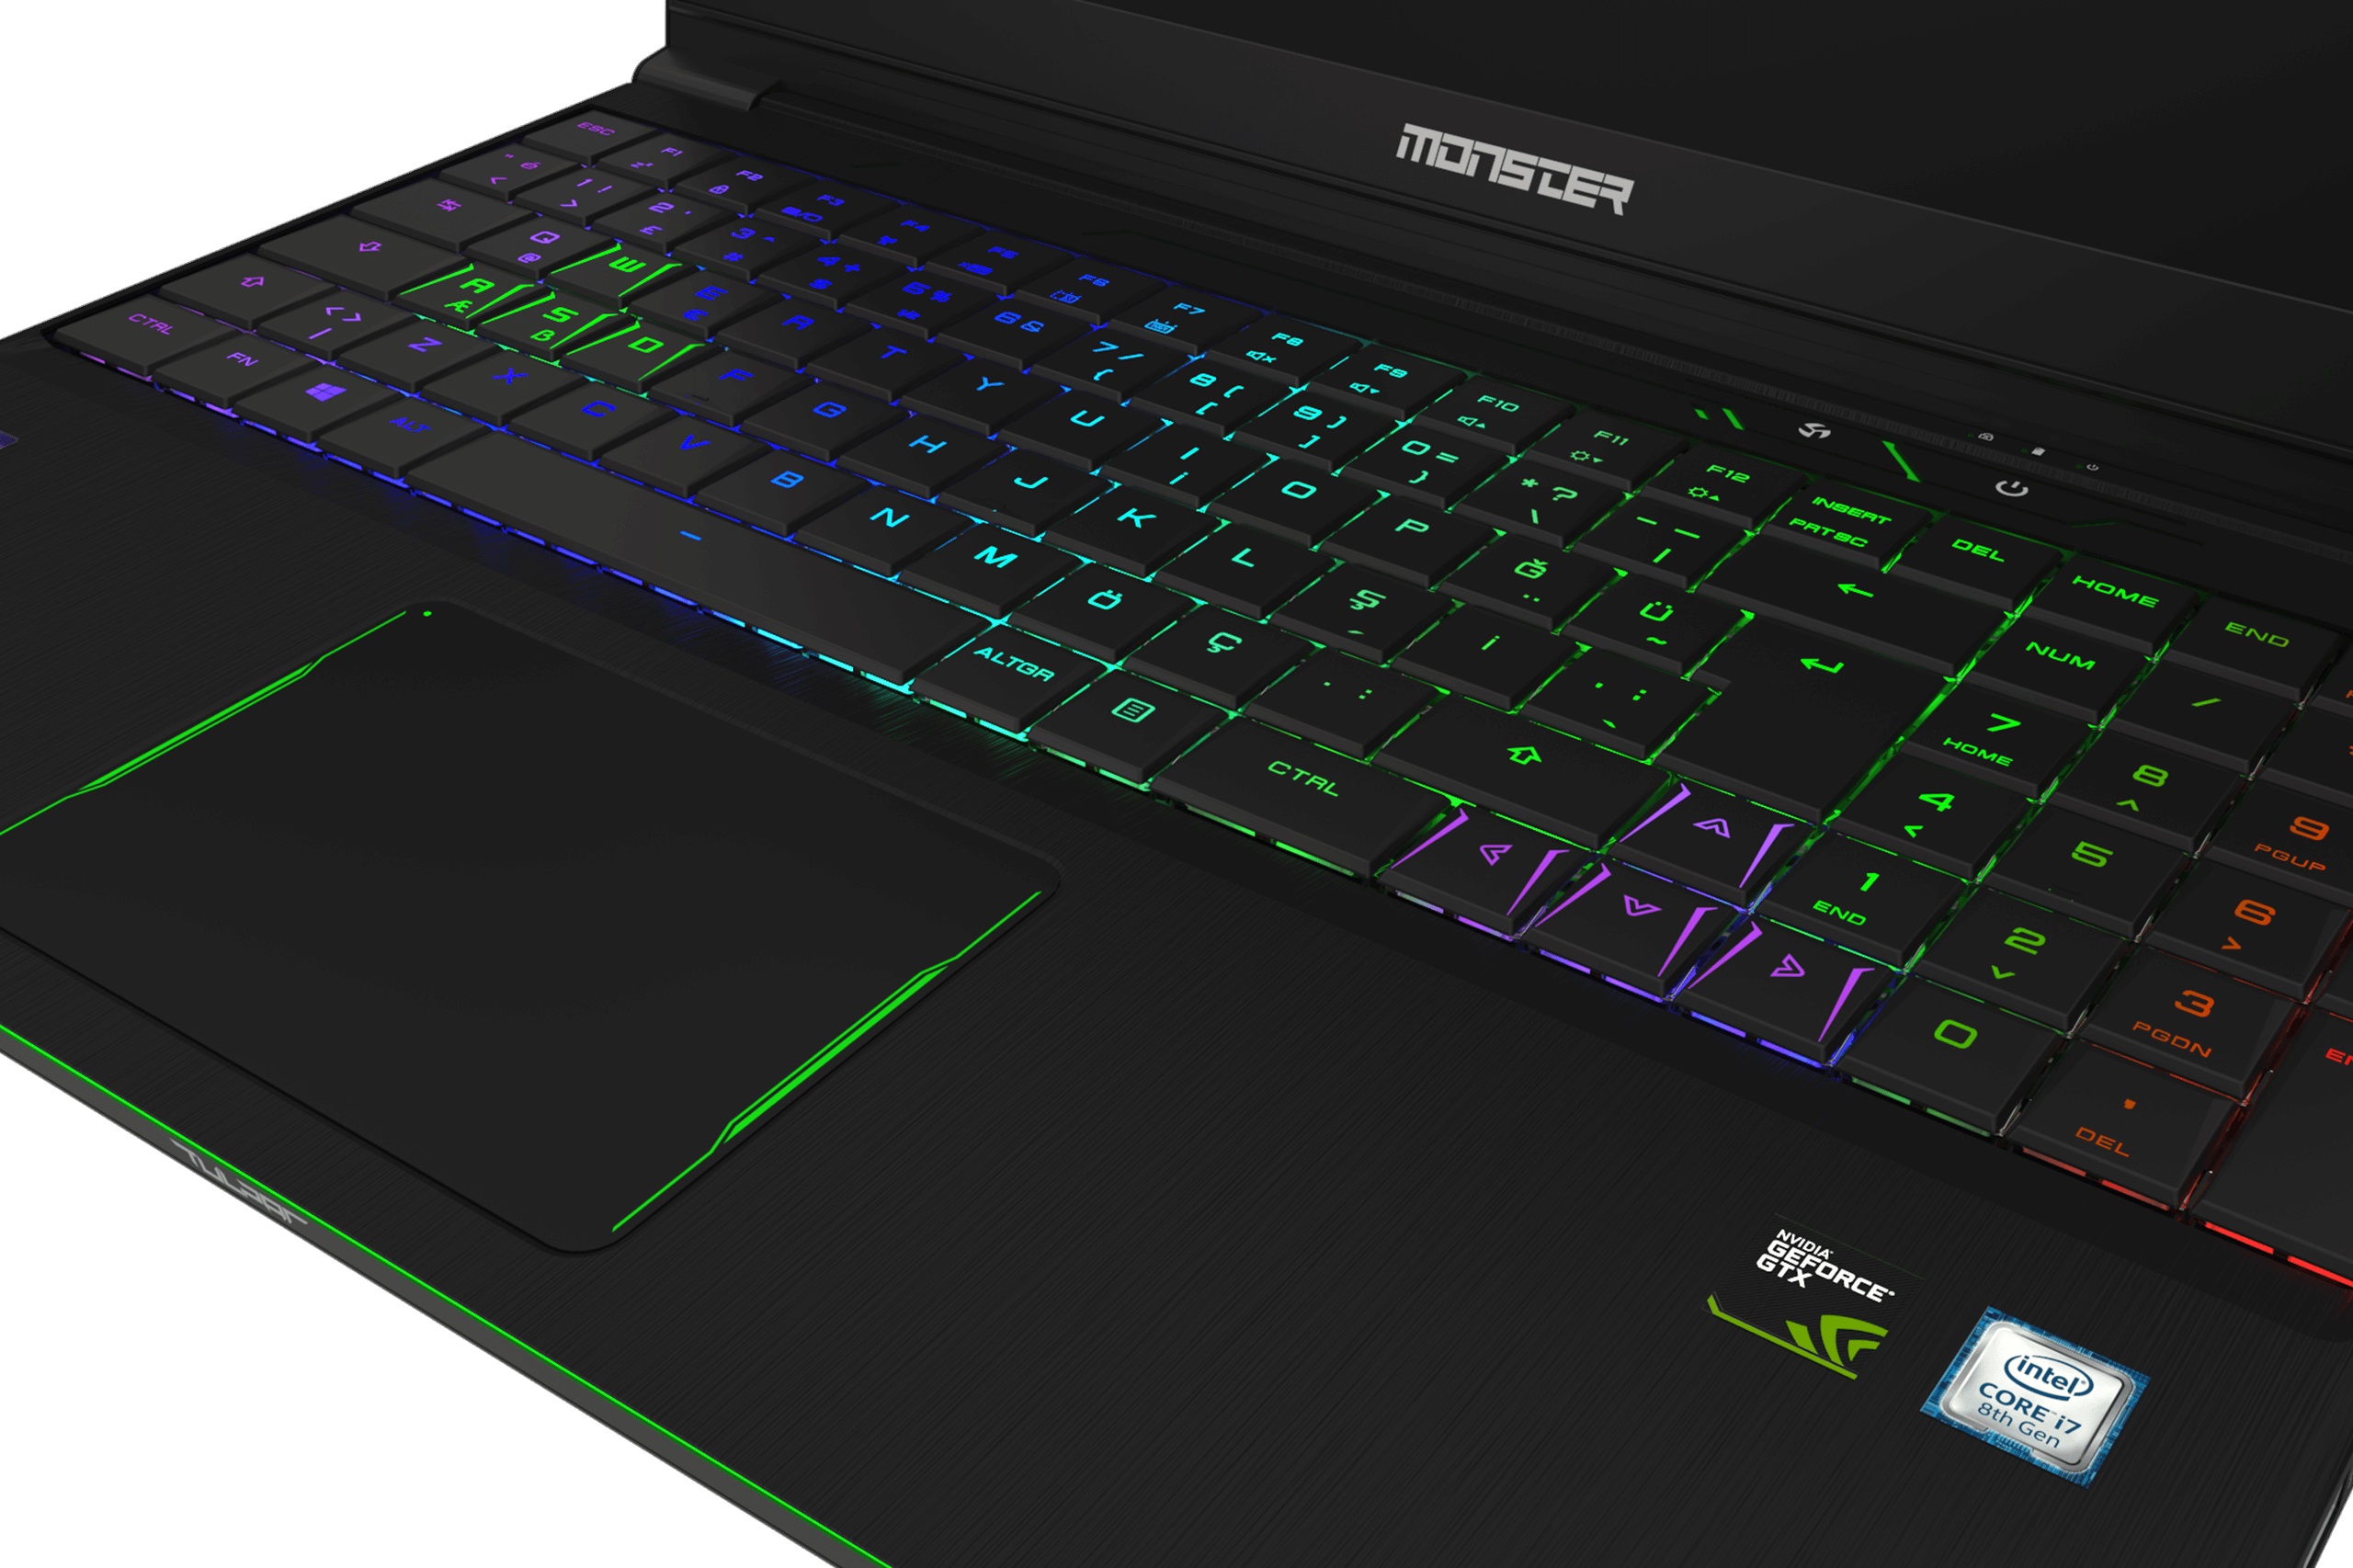
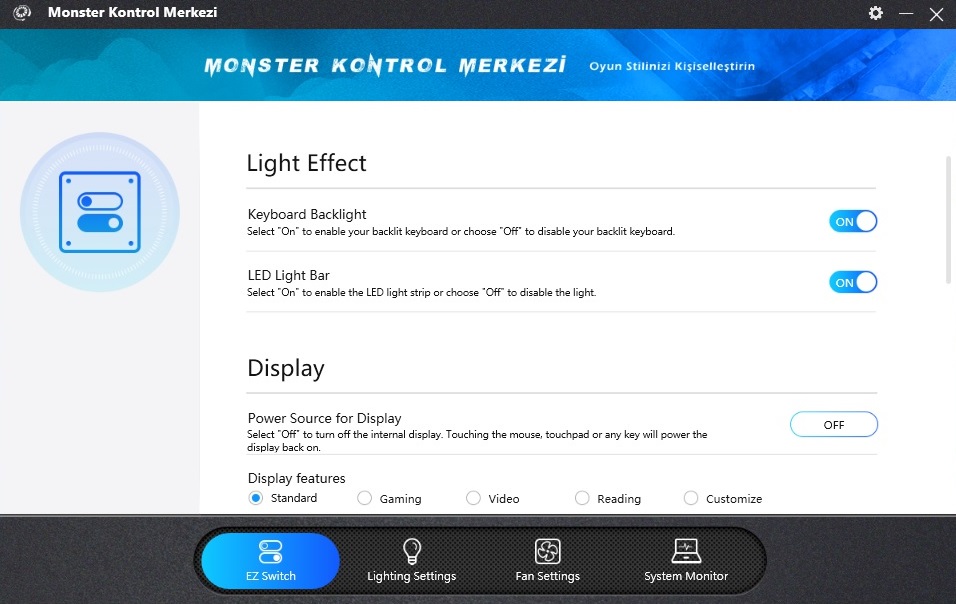
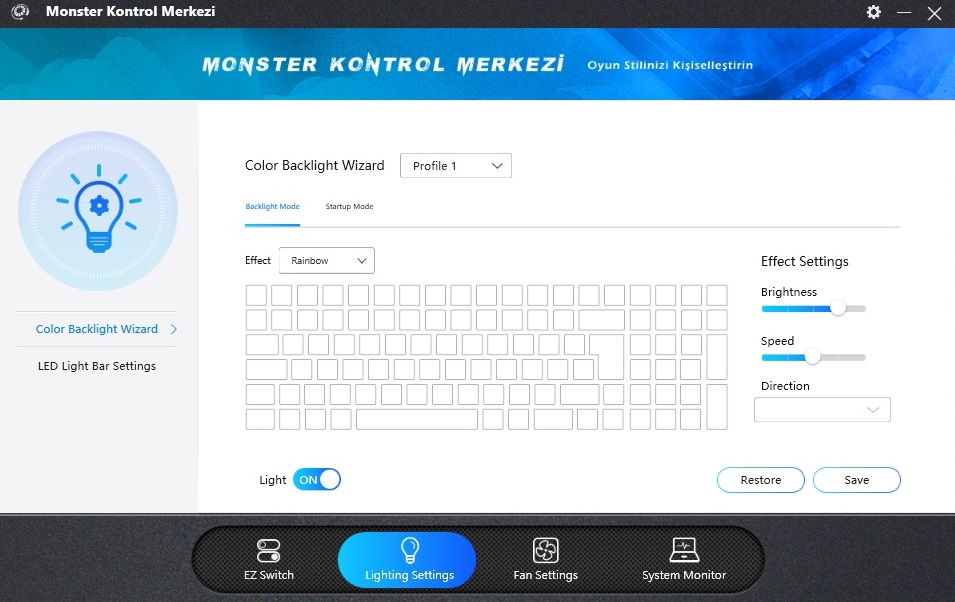
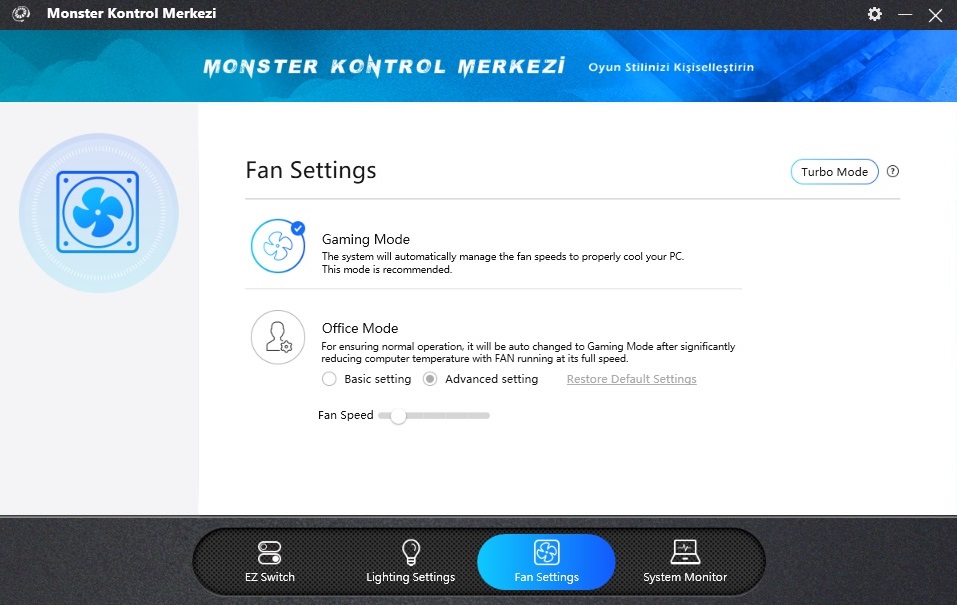
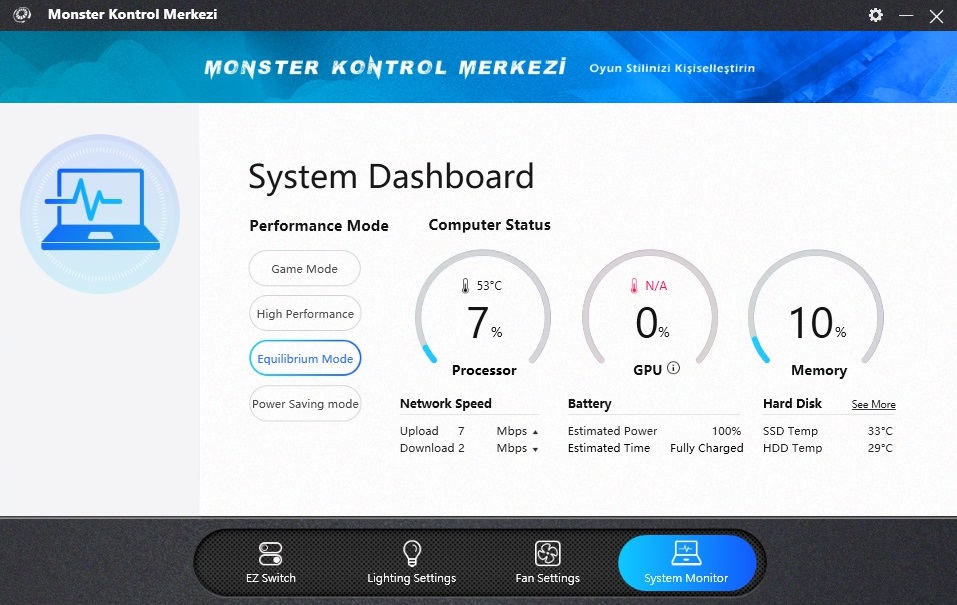
Like almost all modern gaming notebooks, the Tulpar T5 comes with its own set of tuning tools. The Control Center can be used to configure the keyboard backlight, the front-facing LED strip, the energy profile, and fan management. Our tests were performed with the fan profile set to “Gaming”. Keep in mind that the notebook might behave differently in the “Office” settings.
Despite being more akin to an office notebook in terms of size and weight the Tulpar T5 is a full-fledged 15-inch gaming powerhouse, especially when equipped with 16 or 32 GB of RAM and an NVMe PCIe SSD. Its hexa-core CPU and DirectX 12 GPU should offer plenty of oomph for years to come, at least when gaming in the panel’s native FHD resolution.
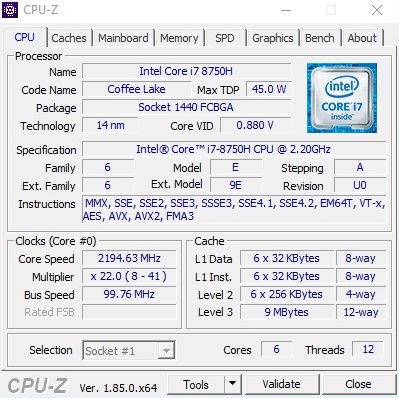
Processor
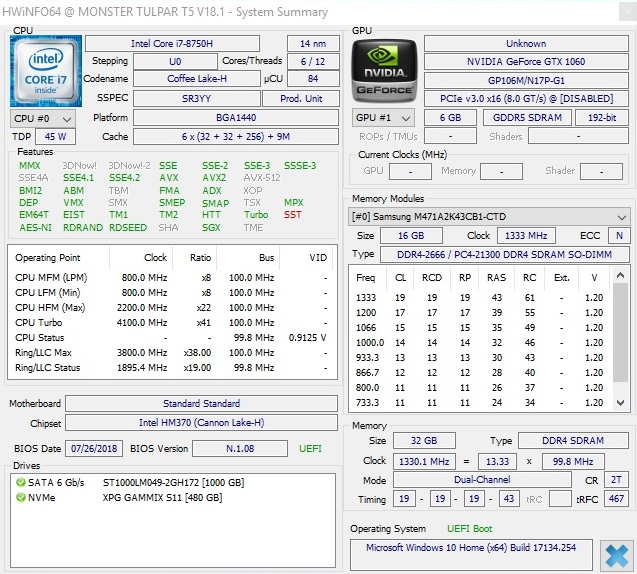
The notebook features a CPU from Intel’s current Coffee Lake generation. The Core i7-8750H has a total of six cores with support for Hyper-Threading (12 threads) and a turbo boost of up to 4.1 GHz (single-threaded load) or 3.9 GHz (multithreaded load).
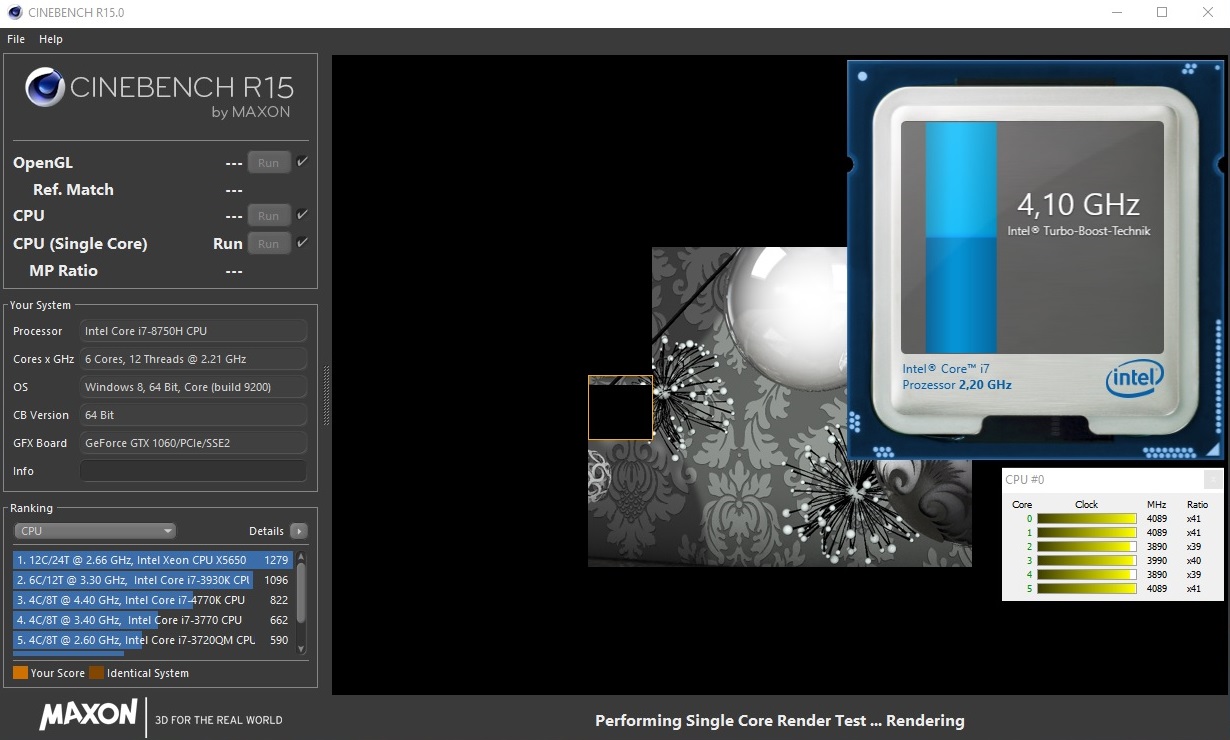
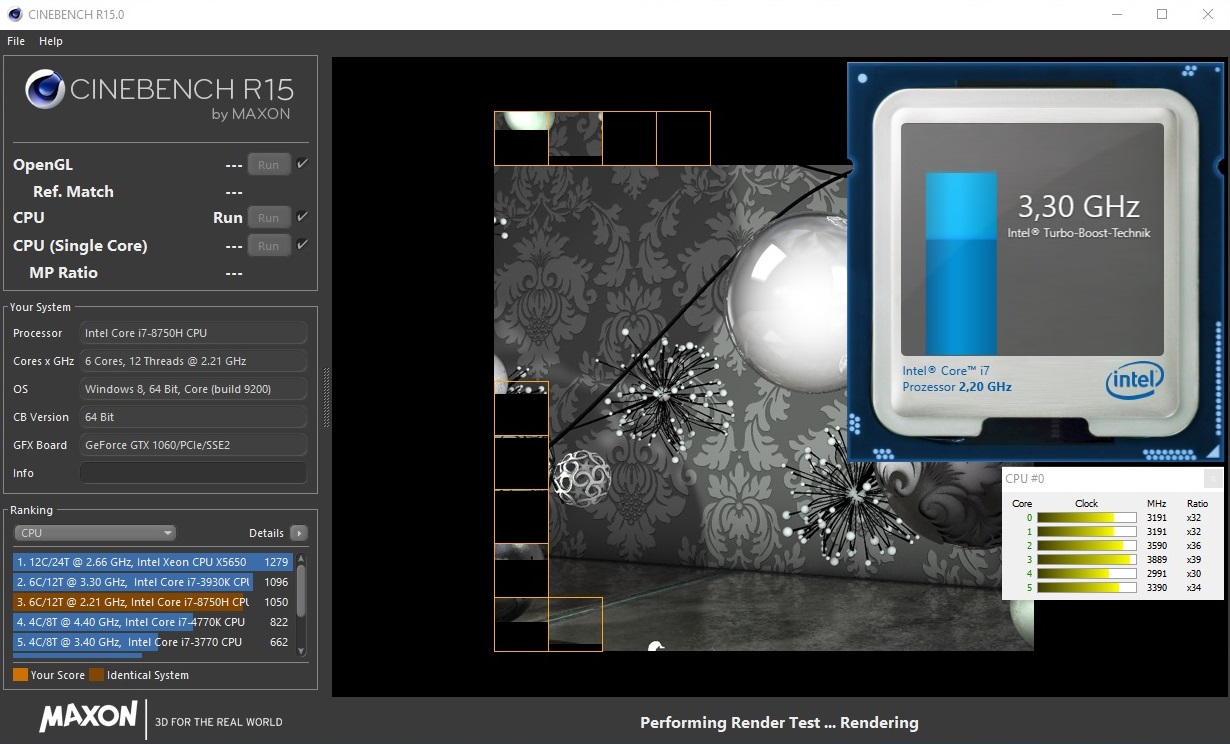
Unfortunately, it oscillated quite heavily during our benchmarks. For example, when running the Cinebench R15 multi-core test core frequencies fluctuated between 2.6 and 3.9 GHz (3.2 GHz on average). Accordingly, it was not surprising to find the Tulpar T5 trailing behind its similarly equipped competitors slightly.
We test long-term performance by running our Cinebench multi-core test in a loop. In this particular case we noticed a decline beginning with the second iteration, and scores settled at about 10% less than peak performance around the fourth run. Given the low initial base clock speed this result was somewhat disappointing. In the Tulpar T5’s defense we should add that almost all Coffee Lake laptops behave this way.
System Performance
All competitors were at a similarly high level in regard to system performance. Whether we were looking at PCMark 10 or PCMark 8 the final scores only differed by a few percentage points here and there. Thanks to their fast PCIe SSDs all the competitors offered a very fast and smooth Windows experience.
| PCMark 10 - Score | |
| Average of class Gaming (5828 - 11574, n=94, last 2 years) | |
| Razer Blade 15 GTX 1060 | |
| MSI GS65 8RF-019DE Stealth Thin | |
| Asus ROG GU501GM-BI7N8 | |
| Gigabyte Aero 15X v8 | |
| Monster Tulpar T5 V18.1.1 | |
| PCMark 8 Home Score Accelerated v2 | 4565 points | |
| PCMark 8 Work Score Accelerated v2 | 5486 points | |
| PCMark 10 Score | 4931 points | |
Help | ||
Storage Devices
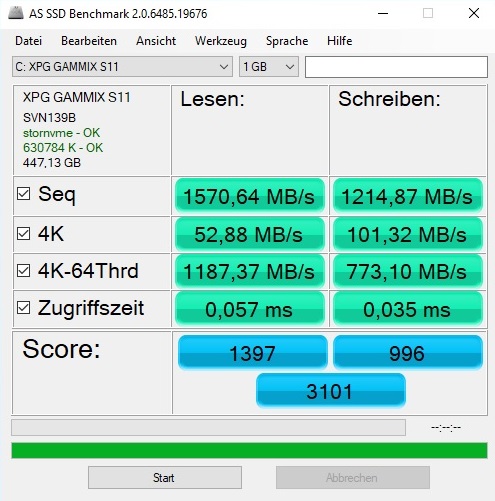
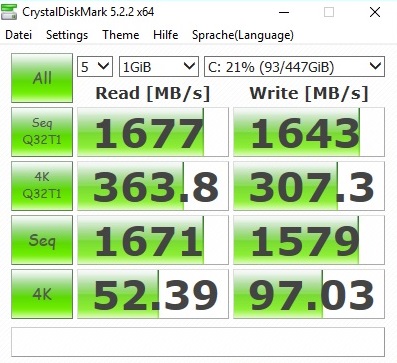
As mentioned before Windows 10 was installed on an M.2 480 GB SSD made by ADATA (XPG Gammix S11). The drive performed very well overall but was unable to keep up with the Samsung SSD that the Razer Blade 15 and the MSI GS65 were equipped with. It easily outperformed the Asus ROG GU501GM’s Kingston SSD though.
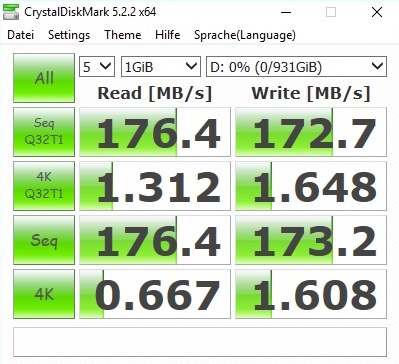
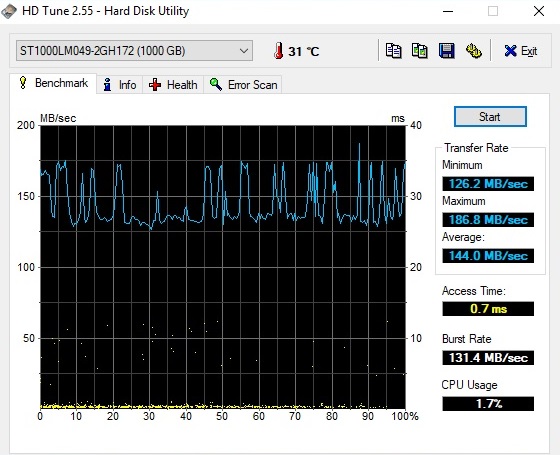
A second M.2 slot is available inside the Tulpar T5 as well, and in addition to the 2.5-inch SATA slot it can be used for additional storage. Our review unit was equipped with an extra 1 TB large Seagate Barracuda Pro HDD that operated at 7,200 RPM.
| Monster Tulpar T5 V18.1.1 ADATA XPG Gammix S11 480GB | Asus ROG GU501GM-BI7N8 Kingston RBUSNS8154P3128GJ | Razer Blade 15 GTX 1060 Samsung SSD PM981 MZVLB512HAJQ | MSI GS65 8RF-019DE Stealth Thin Samsung SSD PM981 MZVLB512HAJQ | Gigabyte Aero 15X v8 Toshiba NVMe THNSN5512GPU7 | |
|---|---|---|---|---|---|
| AS SSD | -59% | 28% | 24% | -12% | |
| Seq Read (MB/s) | 1571 | 841 -46% | 1820 16% | 1266 -19% | 2213 41% |
| Seq Write (MB/s) | 1215 | 404.7 -67% | 1917 58% | 1834 51% | 1163 -4% |
| 4K Read (MB/s) | 52.9 | 22.62 -57% | 48.56 -8% | 48.94 -7% | 23.36 -56% |
| 4K Write (MB/s) | 101.3 | 67.1 -34% | 99.2 -2% | 107.2 6% | 80.4 -21% |
| Score Read (Points) | 1397 | 377 -73% | 1407 1% | 1346 -4% | 1092 -22% |
| Score Write (Points) | 996 | 345 -65% | 1955 96% | 2051 106% | 939 -6% |
| Score Total (Points) | 3101 | 900 -71% | 4095 32% | 4122 33% | 2536 -18% |

GPU Performance
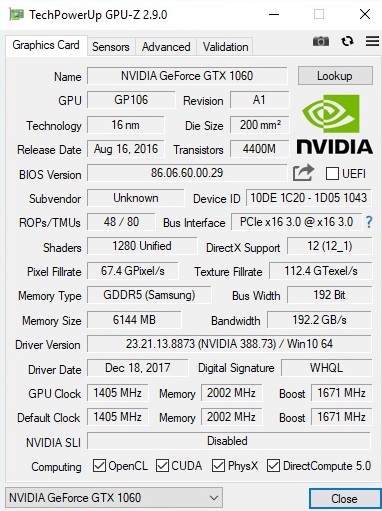
All things graphics-related were handled by the massively popular GeForce GTX 1060 high-end GPU based on Nvidia’s Pascal architecture. It comes with 1,280 shaders and has access to 6 GB of GDDR5 VRAM (192-bit interface).
It performed exactly as expected in our benchmarks, and its 3DMark 13 (Fire Strike) and 3DMark 11 scores were right where we would have expected them to be. A GeForce GTX 1070 Max-Q would have been around 30% faster while a GeForce GTX 1060 Max-Q would have performed similarly.
| 3DMark 11 Performance | 13166 points | |
| 3DMark Cloud Gate Standard Score | 31561 points | |
| 3DMark Fire Strike Score | 10195 points | |
Help | ||
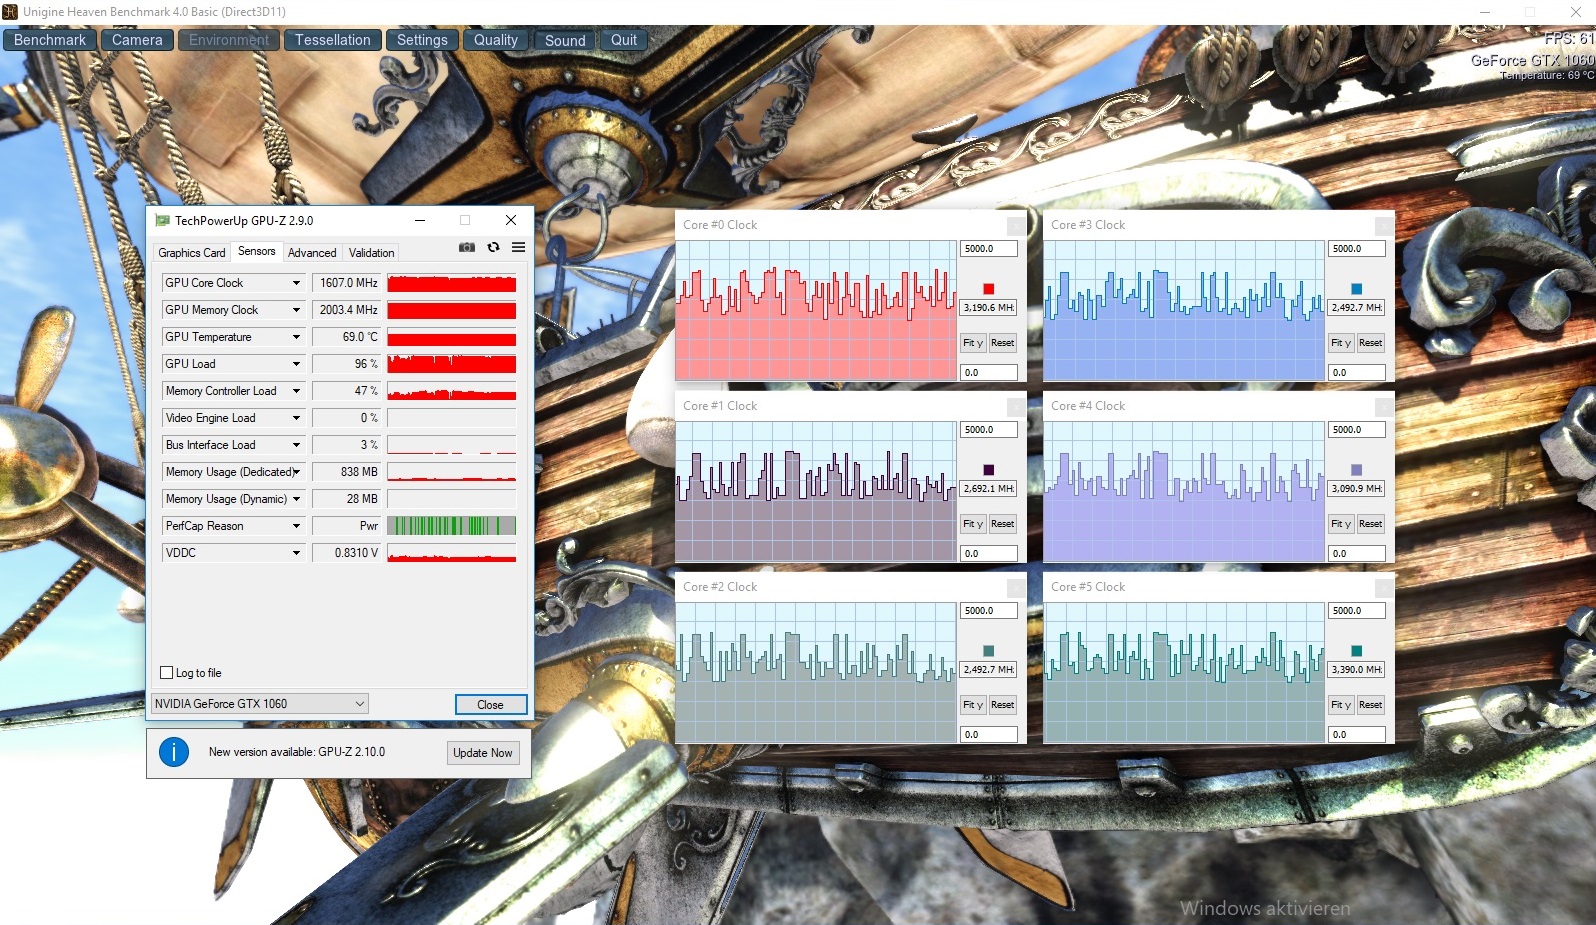
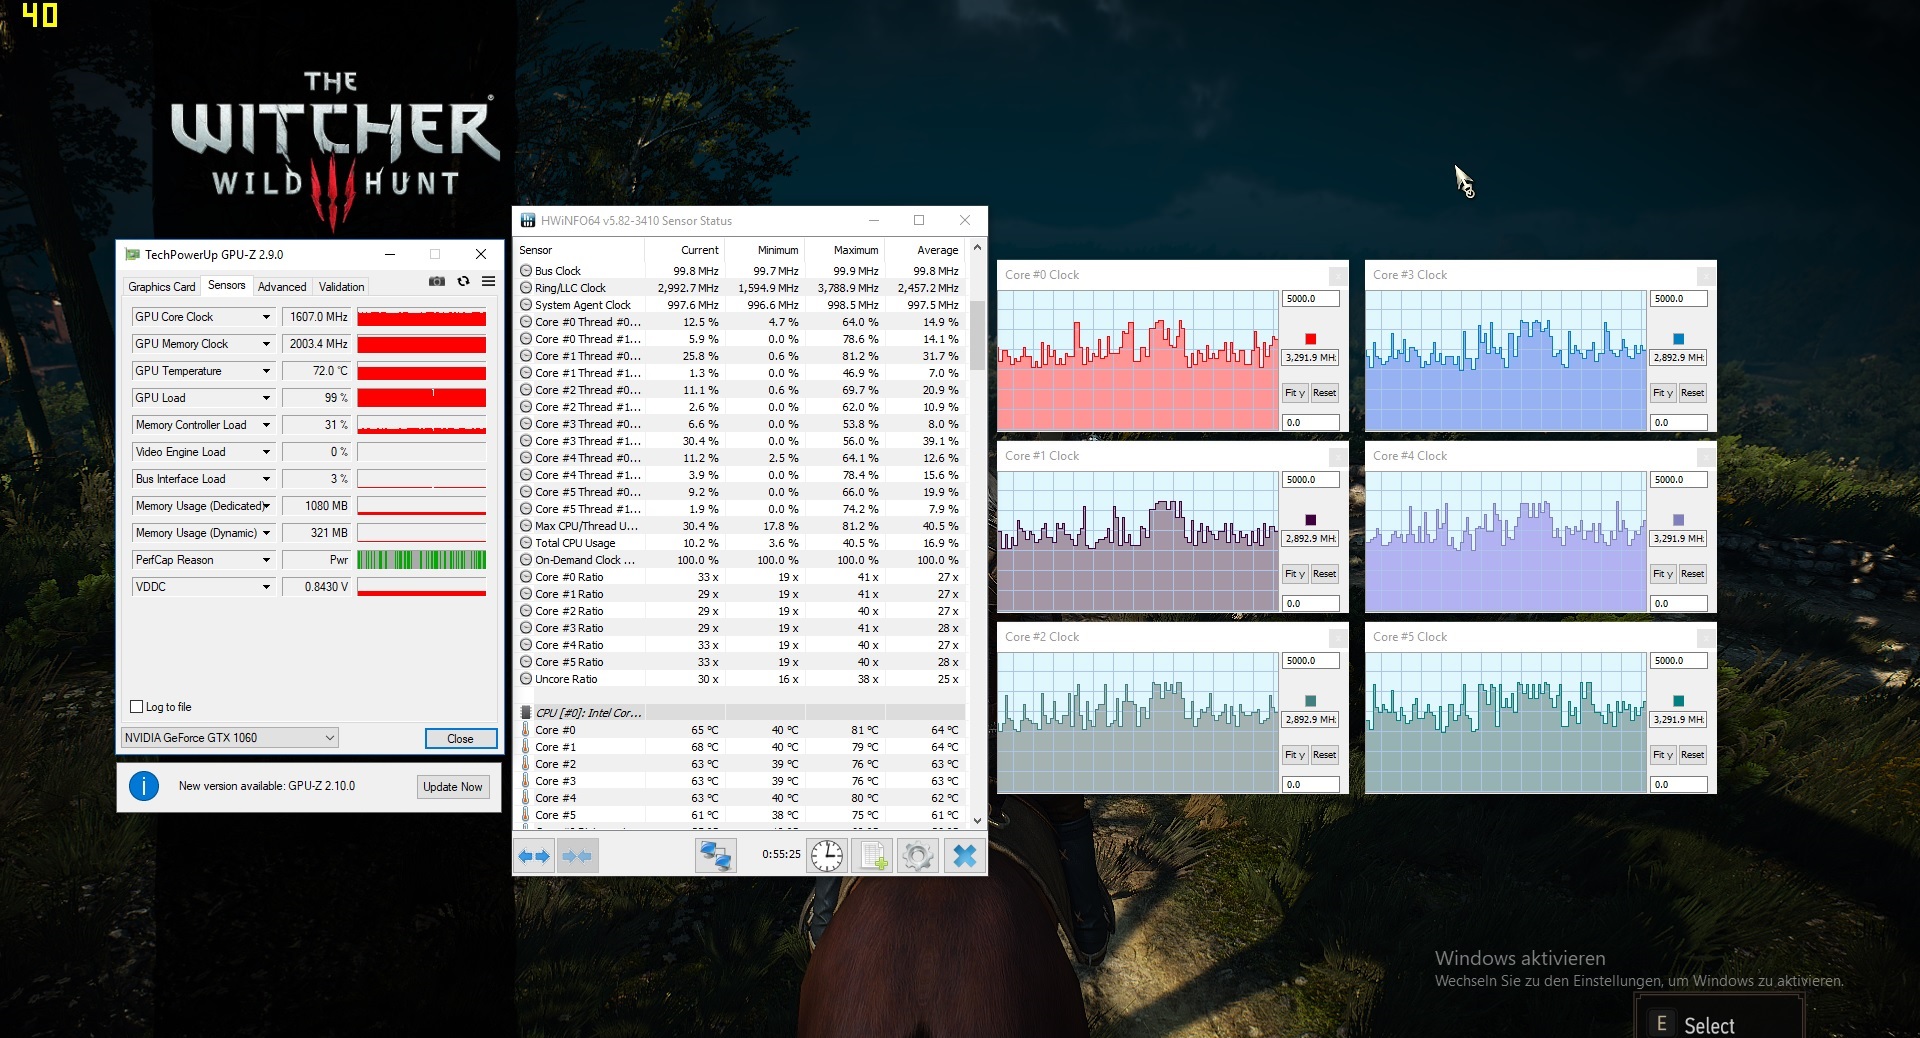
The automatic GPU overclocking worked flawlessly in our Tulpar T5 review unit. Even after 60 minutes of running The Witcher 3 in Ultra/FHD the GTX 1060 managed to run at almost 1,600 MHz (default: 1,405 MHz). However, it barely ever reached its theoretical peak of 1,911 MHz.
Gaming Performance
All current games run very smoothly with (very) high details when limited to FHD (1920x1080).
| The Witcher 3 | |
| 1920x1080 Ultra Graphics & Postprocessing (HBAO+) | |
| Average of class Gaming (95 - 240, n=8, last 2 years) | |
| MSI GS65 8RF-019DE Stealth Thin | |
| Gigabyte Aero 15X v8 | |
| Asus ROG GU501GM-BI7N8 | |
| Monster Tulpar T5 V18.1.1 | |
| Razer Blade 15 GTX 1060 | |
| 1920x1080 High Graphics & Postprocessing (Nvidia HairWorks Off) | |
| Average of class Gaming (181 - 341, n=3, last 2 years) | |
| MSI GS65 8RF-019DE Stealth Thin | |
| Gigabyte Aero 15X v8 | |
| Razer Blade 15 GTX 1060 | |
| Monster Tulpar T5 V18.1.1 | |
| Asus ROG GU501GM-BI7N8 | |
Relinquishing support for G-Sync makes perfect sense given the notebook’s comparatively high mobility, and it is offset by the fast 144 Hz panel. Movements on screen were often buttery smooth and much more so than on any 60 Hz panel.
| low | med. | high | ultra | |
|---|---|---|---|---|
| The Witcher 3 (2015) | 70.4 | 38.9 | ||
| FIFA 18 (2017) | 217 | 213 | ||
| Destiny 2 (2017) | 94.2 | 78.4 | ||
| Assassin´s Creed Origins (2017) | 65 | 54 | ||
| Need for Speed Payback (2017) | 82.1 | 77.1 | ||
| Star Wars Battlefront 2 (2017) | 74.8 | 62.3 | ||
| The Crew 2 (2018) | 59.4 | 58 | ||
| F1 2018 (2018) | 84 | 60 |
Emissions
System Noise
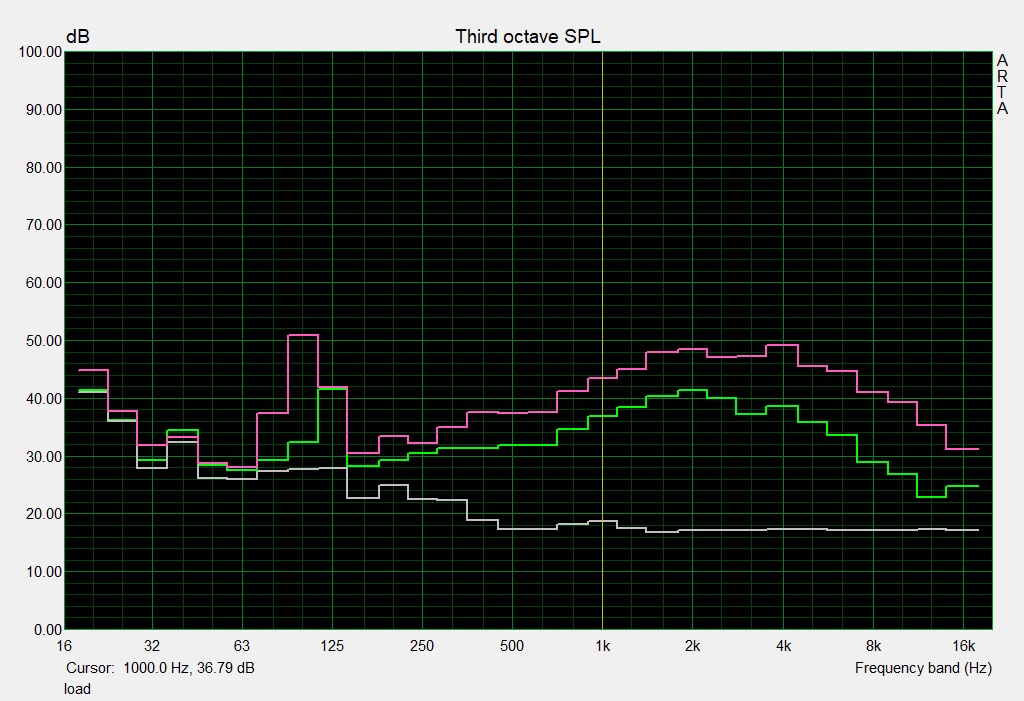
The Tulpar T5’s biggest weakness was by far its high level of noise. When running 3D applications the fans produced a sound pressure level of between 49 and 58 dB(A) (52 dB(A) @ The Witcher 3). Not only was this massively annoying, but it was also the loudest notebook in our comparison group. Gaming without a headset was nigh on impossible due to the massively oscillating and pumping fan noise that easily managed to overpower the speakers.
However, the CPU and GPU temperatures were comparatively low and thus proof that this high level of noise was rather moot. When running The Witcher 3 the GPU reached just 72 °C, and the CPU remained at between 60 and 70 °C. In other words: Tongfang, the manufacturer of this particular barebone, needs to address this issue as soon as possible.
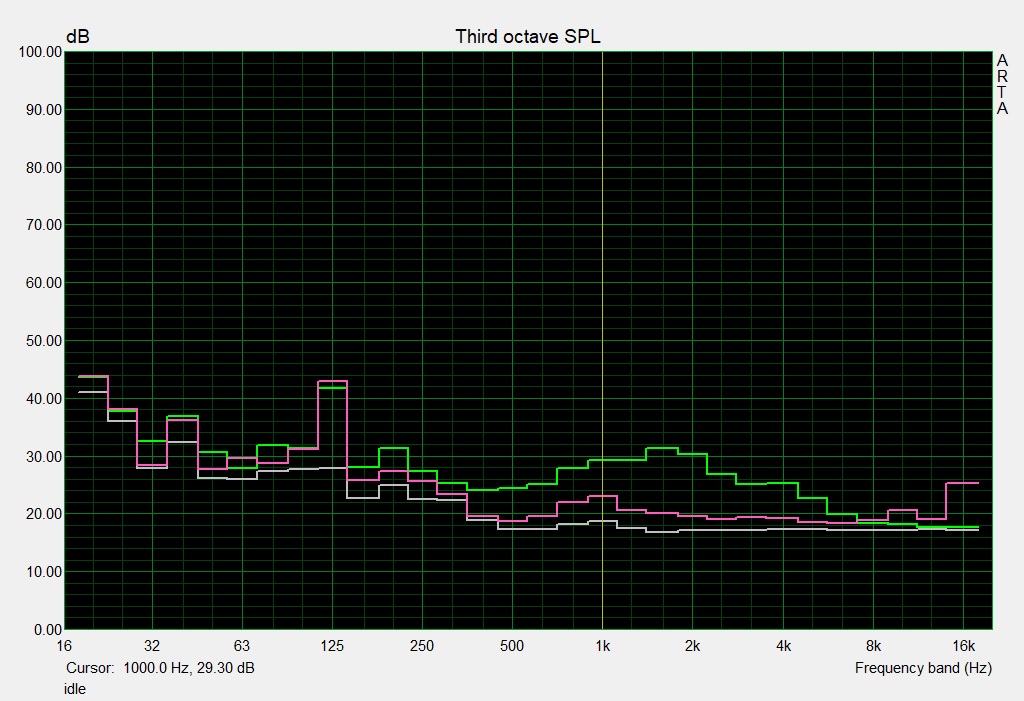
At least the 15-inch notebook did a lot better in idle and low-load scenarios where it remained mostly soundless save for the occasional revving up of the fans and the humming noise of the hard disk drive. Once the HDD powered down, the Tulpar T5 was completely silent.
Noise level
| Idle |
| 29 / 33 / 39 dB(A) |
| HDD |
| 33 dB(A) |
| Load |
| 49 / 58 dB(A) |
 | ||
30 dB silent 40 dB(A) audible 50 dB(A) loud |
||
min: | ||
| Monster Tulpar T5 V18.1.1 GeForce GTX 1060 Mobile, i7-8750H | Asus ROG GU501GM-BI7N8 GeForce GTX 1060 Mobile, i7-8750H | Razer Blade 15 GTX 1060 GeForce GTX 1060 Max-Q, i7-8750H | MSI GS65 8RF-019DE Stealth Thin GeForce GTX 1070 Max-Q, i7-8750H | Gigabyte Aero 15X v8 GeForce GTX 1070 Max-Q, i7-8750H | Average of class Gaming | |
|---|---|---|---|---|---|---|
| Noise | 5% | 10% | 10% | 3% | 15% | |
| off / environment * (dB) | 29 | 28.6 1% | 28.1 3% | 30 -3% | 29 -0% | 24.1 ? 17% |
| Idle Minimum * (dB) | 29 | 31.4 -8% | 28.1 3% | 30 -3% | 30 -3% | 25.8 ? 11% |
| Idle Average * (dB) | 33 | 31.4 5% | 33 -0% | 31 6% | 31 6% | 27.4 ? 17% |
| Idle Maximum * (dB) | 39 | 34.2 12% | 33.5 14% | 34 13% | 35 10% | 29.9 ? 23% |
| Load Average * (dB) | 49 | 42.8 13% | 42.2 14% | 43 12% | 49 -0% | 43 ? 12% |
| Witcher 3 ultra * (dB) | 52 | 50.9 2% | 45.3 13% | 42 19% | 51 2% | |
| Load Maximum * (dB) | 58 | 50.9 12% | 45.7 21% | 44 24% | 54 7% | 54 ? 7% |
* ... smaller is better
Temperature
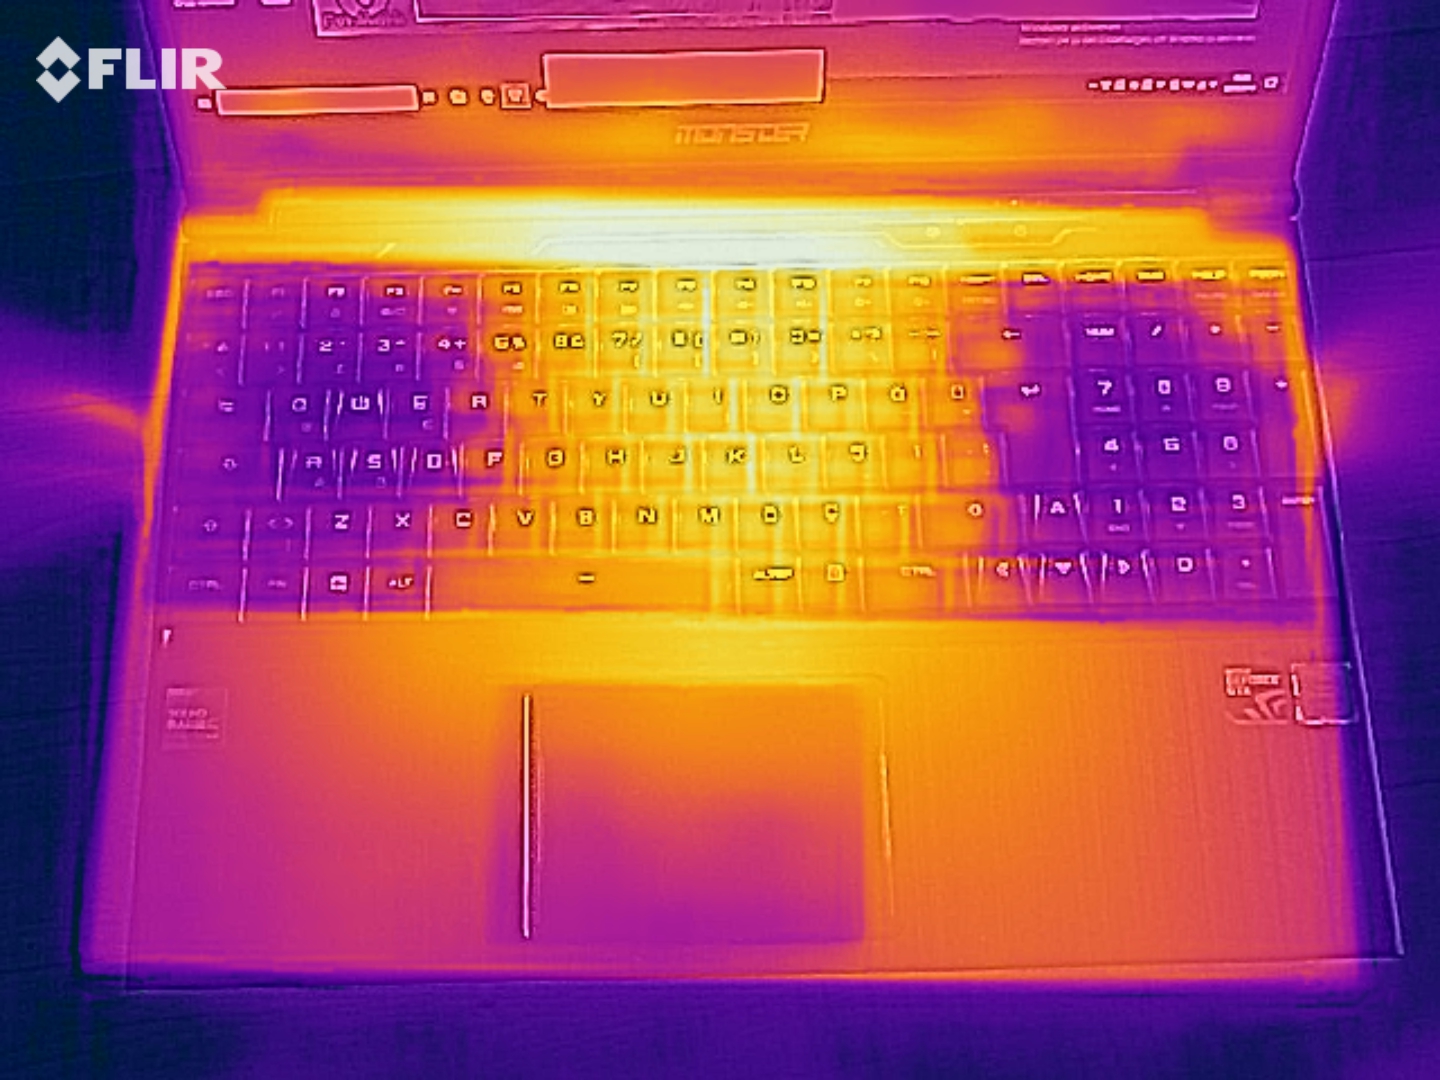
The temperatures left us with mixed feelings. On the one hand, surface temperatures reached up to 52 °C under load and even up to 65 °C near the metal grills at the bottom. Thus, gaming with the notebook on your lap will become quite toasty. Idle temperatures, on the other hand, remained fairly low and never exceeded 30 °C.
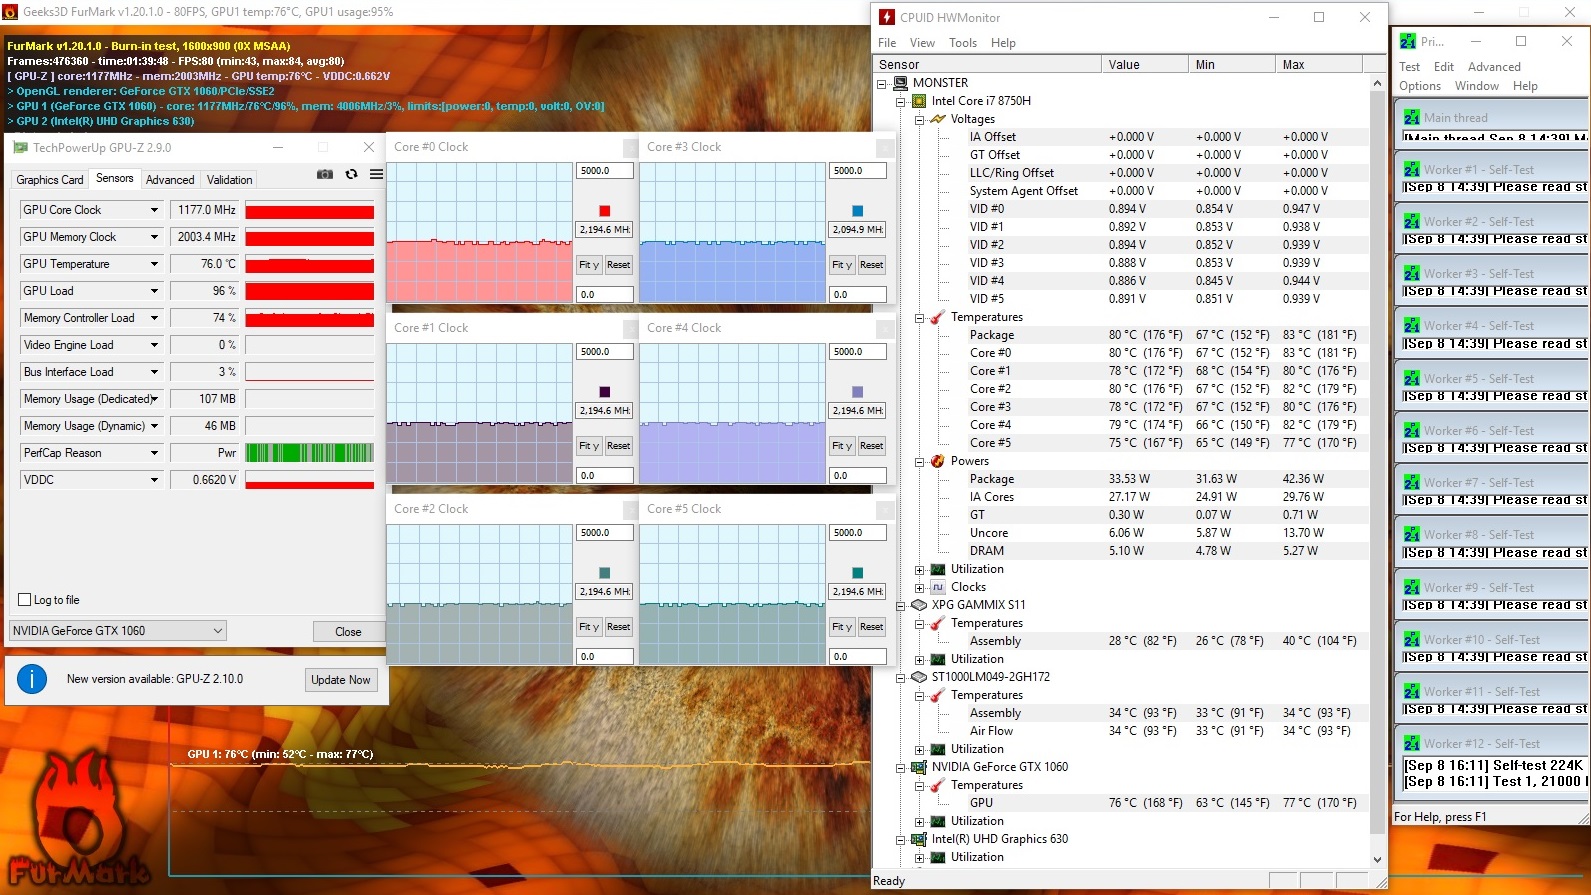
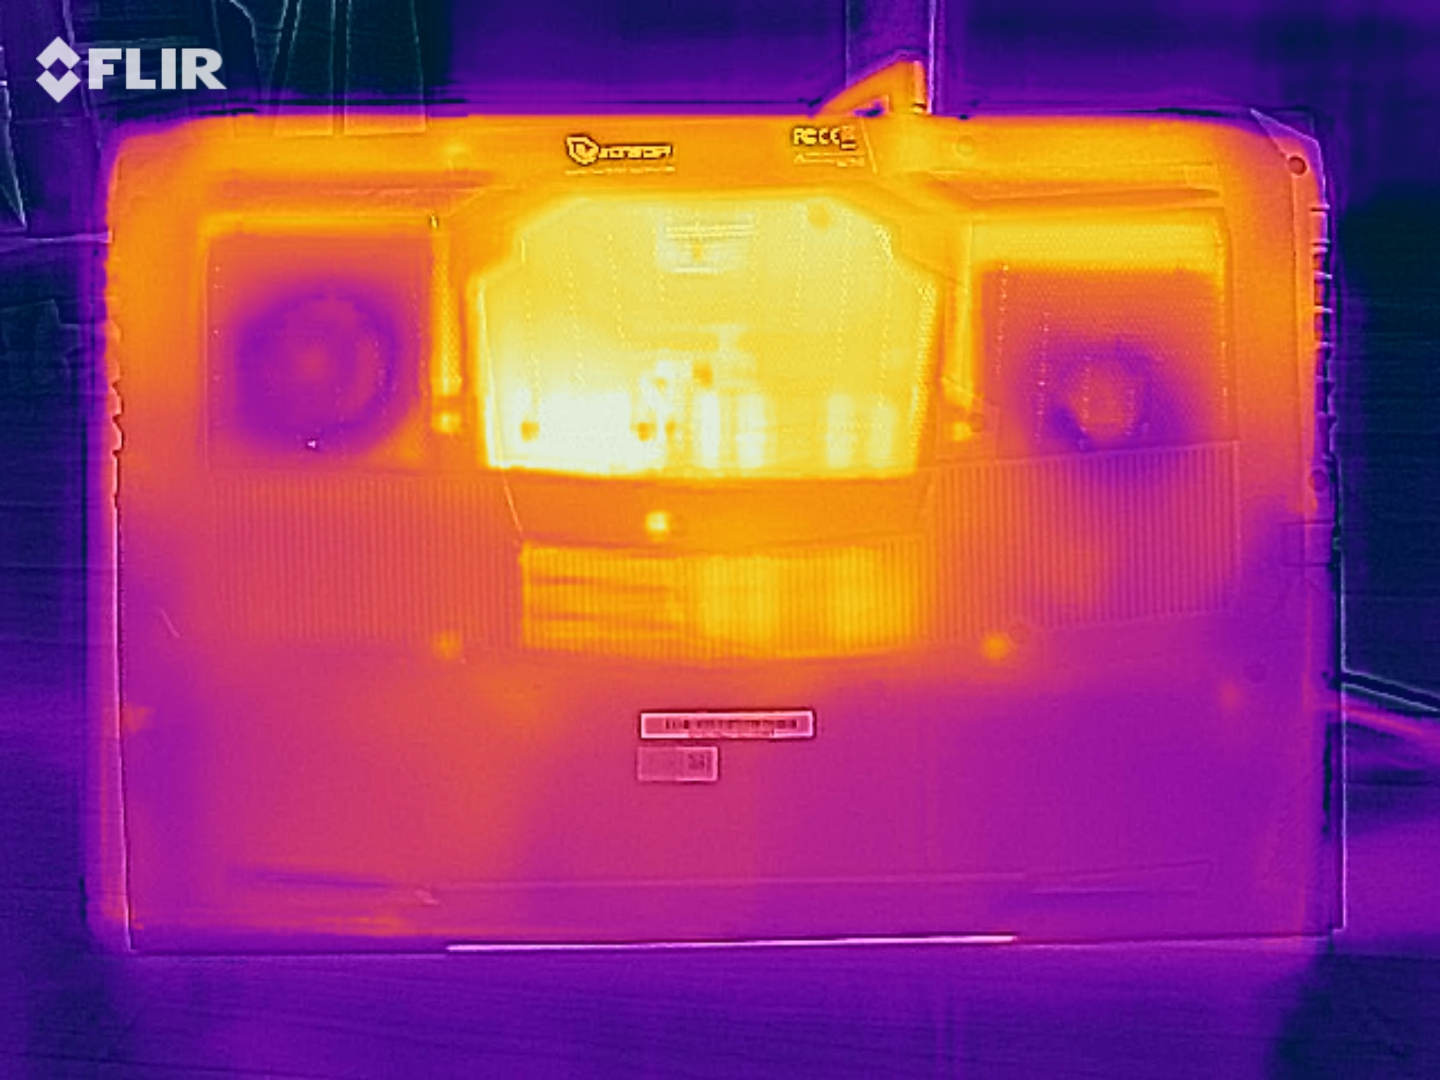
Cooling during our stress test was subpar, to say the least. When running FurMark and Prime95 both the CPU and GPU started to throttle, despite more than acceptable temperatures.
(-) The maximum temperature on the upper side is 52 °C / 126 F, compared to the average of 40.4 °C / 105 F, ranging from 21.2 to 68.8 °C for the class Gaming.
(-) The bottom heats up to a maximum of 65 °C / 149 F, compared to the average of 43.2 °C / 110 F
(+) In idle usage, the average temperature for the upper side is 28.4 °C / 83 F, compared to the device average of 33.9 °C / 93 F.
(-) Playing The Witcher 3, the average temperature for the upper side is 41.4 °C / 107 F, compared to the device average of 33.9 °C / 93 F.
(-) The palmrests and touchpad can get very hot to the touch with a maximum of 41 °C / 105.8 F.
(-) The average temperature of the palmrest area of similar devices was 28.8 °C / 83.8 F (-12.2 °C / -22 F).
| Monster Tulpar T5 V18.1.1 GeForce GTX 1060 Mobile, i7-8750H | Asus ROG GU501GM-BI7N8 GeForce GTX 1060 Mobile, i7-8750H | Razer Blade 15 GTX 1060 GeForce GTX 1060 Max-Q, i7-8750H | MSI GS65 8RF-019DE Stealth Thin GeForce GTX 1070 Max-Q, i7-8750H | Gigabyte Aero 15X v8 GeForce GTX 1070 Max-Q, i7-8750H | Average of class Gaming | |
|---|---|---|---|---|---|---|
| Heat | 9% | -1% | 12% | 3% | 5% | |
| Maximum Upper Side * (°C) | 52 | 43 17% | 51.2 2% | 49 6% | 53 -2% | 45.2 ? 13% |
| Maximum Bottom * (°C) | 65 | 46.6 28% | 55.2 15% | 63 3% | 65 -0% | 47.9 ? 26% |
| Idle Upper Side * (°C) | 30 | 29.2 3% | 31 -3% | 24 20% | 26 13% | 31.1 ? -4% |
| Idle Bottom * (°C) | 30 | 34 -13% | 35.6 -19% | 25 17% | 30 -0% | 34.2 ? -14% |
* ... smaller is better
Speaker
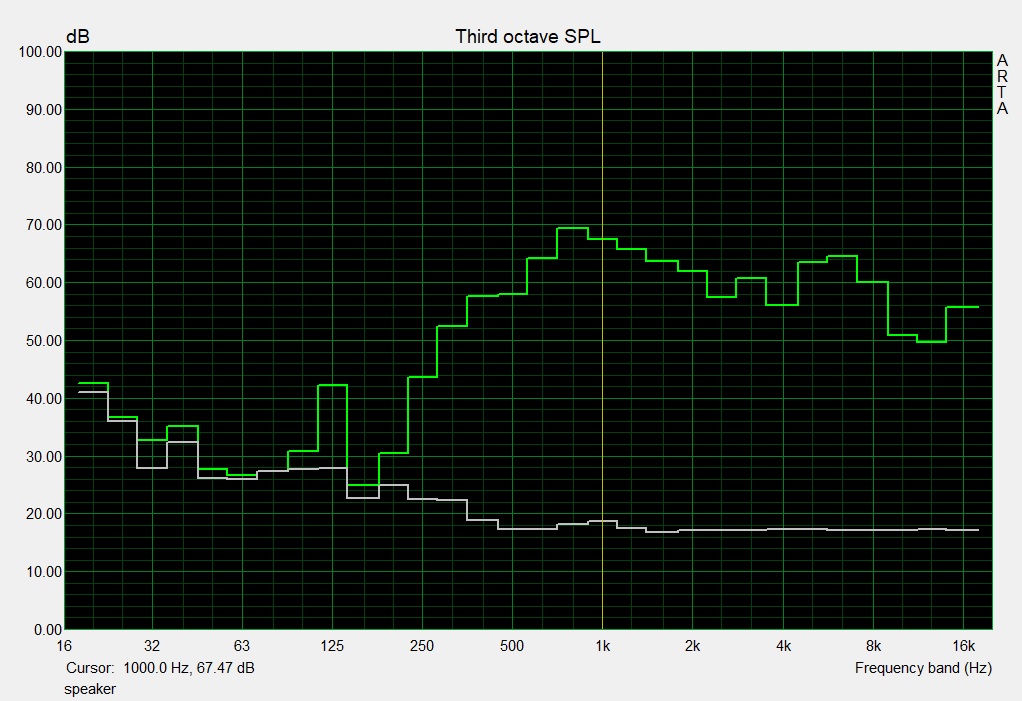
Monster Tulpar T5 V18.1.1 audio analysis
(±) | speaker loudness is average but good (75 dB)
Bass 100 - 315 Hz
(-) | nearly no bass - on average 20.2% lower than median
(-) | bass is not linear (24.7% delta to prev. frequency)
Mids 400 - 2000 Hz
(±) | higher mids - on average 5.8% higher than median
(±) | linearity of mids is average (7.6% delta to prev. frequency)
Highs 2 - 16 kHz
(+) | balanced highs - only 3.8% away from median
(±) | linearity of highs is average (12.2% delta to prev. frequency)
Overall 100 - 16.000 Hz
(±) | linearity of overall sound is average (24.3% difference to median)
Compared to same class
» 88% of all tested devices in this class were better, 3% similar, 9% worse
» The best had a delta of 6%, average was 18%, worst was 132%
Compared to all devices tested
» 74% of all tested devices were better, 6% similar, 21% worse
» The best had a delta of 4%, average was 24%, worst was 134%
Asus ROG GU501GM-BI7N8 audio analysis
(±) | speaker loudness is average but good (74.3 dB)
Bass 100 - 315 Hz
(+) | good bass - only 3.8% away from median
(±) | linearity of bass is average (10.3% delta to prev. frequency)
Mids 400 - 2000 Hz
(+) | balanced mids - only 2.3% away from median
(+) | mids are linear (5.1% delta to prev. frequency)
Highs 2 - 16 kHz
(+) | balanced highs - only 4.6% away from median
(+) | highs are linear (6.8% delta to prev. frequency)
Overall 100 - 16.000 Hz
(+) | overall sound is linear (12.6% difference to median)
Compared to same class
» 16% of all tested devices in this class were better, 3% similar, 81% worse
» The best had a delta of 6%, average was 18%, worst was 132%
Compared to all devices tested
» 11% of all tested devices were better, 2% similar, 86% worse
» The best had a delta of 4%, average was 24%, worst was 134%
Energy Management
Power Consumption
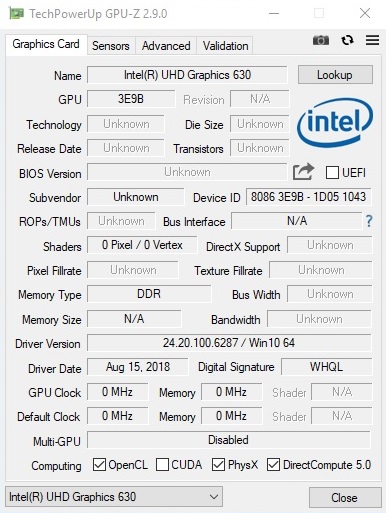
Thanks to Nvidia’s Optimus graphics-switching technology overall power consumption was comparatively low. With the Nvidia GPU disabled the 15-inch notebook even turned out to be one of the most efficient gaming notebooks in our comparison group (10-18 W when idle). Under load and with the dedicated GPU activated it was once again close to average and consumed between 93 and 152 W of power, which was very similar to the Asus ROG GU501GM (94-141 W). Interesting side note: While the Schenker XMG Neo’s peak power consumption was measured at 180 W the identical Tulpar T5 only managed to draw 150 W, which is borderline considering the device’s hardware.
| Off / Standby | |
| Idle | |
| Load |
|
Key:
min: | |
| Monster Tulpar T5 V18.1.1 GeForce GTX 1060 Mobile, i7-8750H | Asus ROG GU501GM-BI7N8 GeForce GTX 1060 Mobile, i7-8750H | Razer Blade 15 GTX 1060 GeForce GTX 1060 Max-Q, i7-8750H | MSI GS65 8RF-019DE Stealth Thin GeForce GTX 1070 Max-Q, i7-8750H | Gigabyte Aero 15X v8 GeForce GTX 1070 Max-Q, i7-8750H | Average of class Gaming | |
|---|---|---|---|---|---|---|
| Power Consumption | -24% | -19% | -3% | -26% | -42% | |
| Idle Minimum * (Watt) | 10 | 12.35 -23% | 14.9 -49% | 7 30% | 14 -40% | 13.2 ? -32% |
| Idle Average * (Watt) | 12 | 19.98 -67% | 17.5 -46% | 11 8% | 18 -50% | 18.9 ? -58% |
| Idle Maximum * (Watt) | 18 | 25.44 -41% | 19.2 -7% | 20 -11% | 22 -22% | 24.3 ? -35% |
| Load Average * (Watt) | 93 | 94.28 -1% | 103.2 -11% | 98 -5% | 91 2% | 108.3 ? -16% |
| Witcher 3 ultra * (Watt) | 110 | 132.9 -21% | 123.1 -12% | 132 -20% | 142 -29% | |
| Load Maximum * (Watt) | 152 | 140.63 7% | 132.7 13% | 182 -20% | 173 -14% | 254 ? -67% |
* ... smaller is better
Battery Life
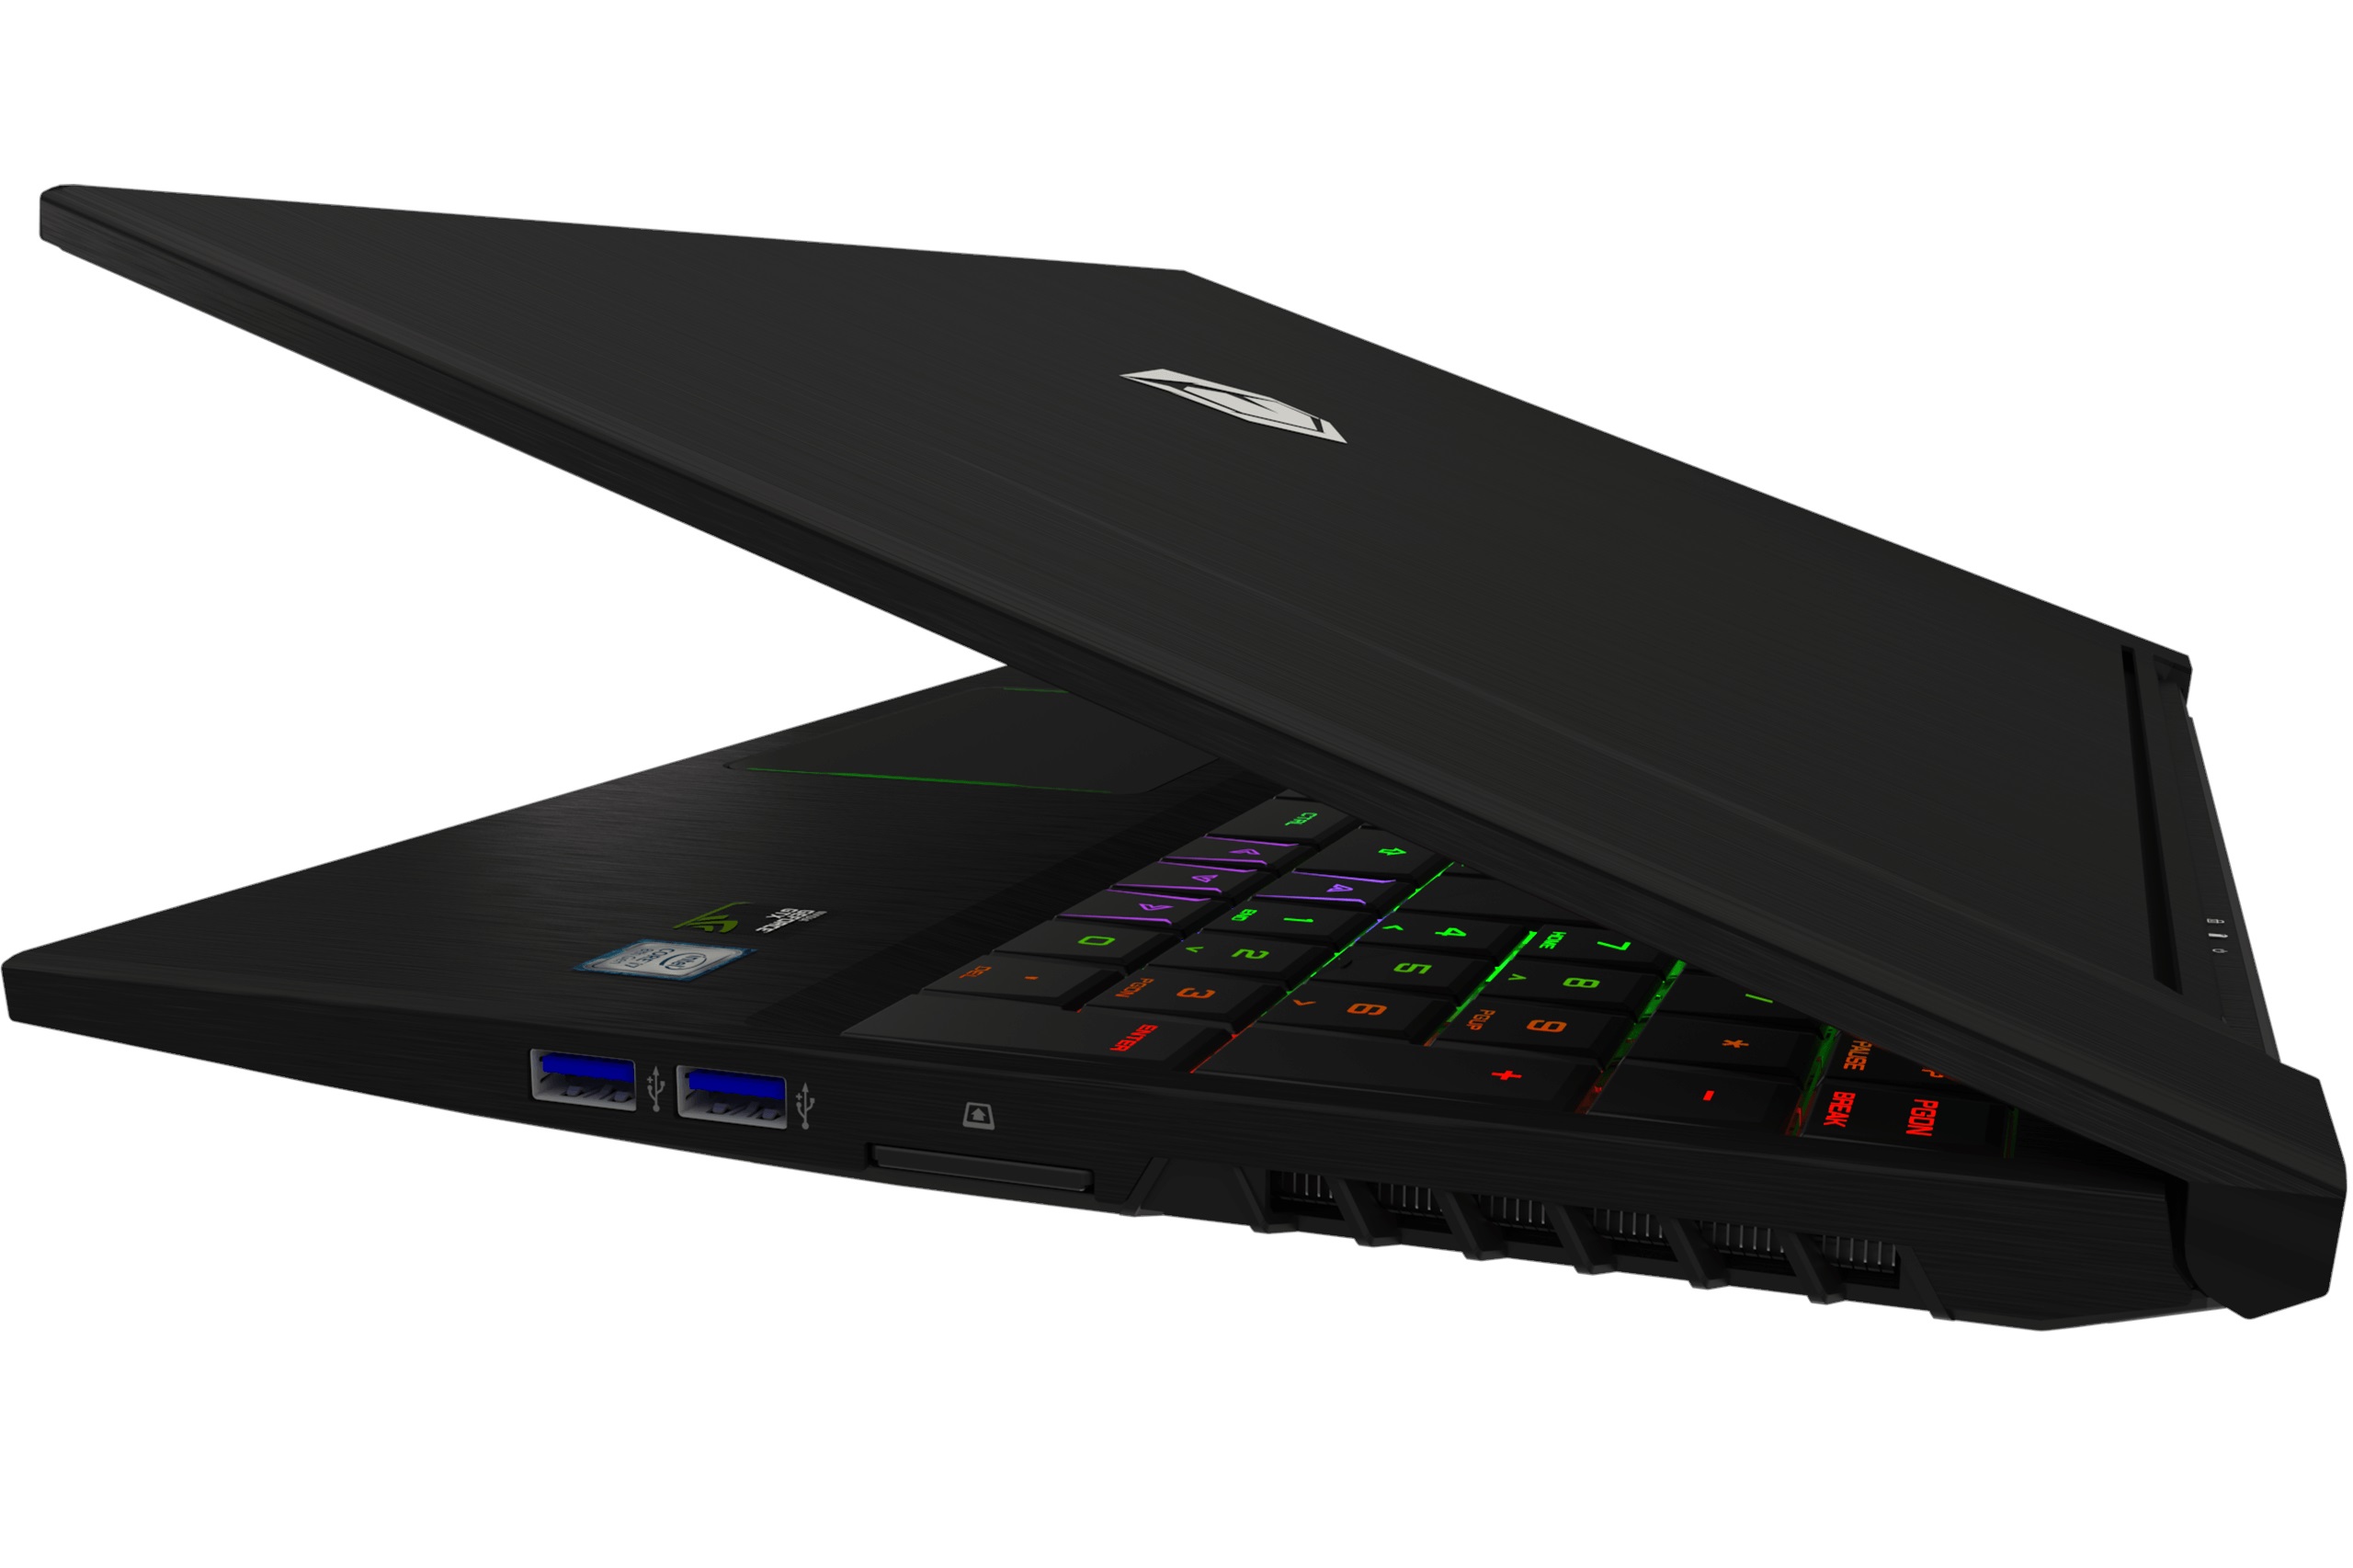
In addition to a quieter mode of operation we would have also wished for a bigger battery. The notebook’s very high level of portability (thickness: 2 cm; weight: 2 kg) is completely foiled by the tiny 46.7 Wh battery. A notebook that is easy to transport and might be of interest to gamers who like to travel should be equipped with a much larger battery. We would have been more than happy to sacrifice the 2.5-inch drive bay for additional battery capacity. In our Wi-Fi test at brightness normalized to 150 nits the Tulpar T5 lasted just 4 hours and was dwarfed by the competition that lasted between 6 and 8.5 hours in the exact same test.
| Monster Tulpar T5 V18.1.1 GeForce GTX 1060 Mobile, i7-8750H, 46.74 Wh | Asus ROG GU501GM-BI7N8 GeForce GTX 1060 Mobile, i7-8750H, 55 Wh | Razer Blade 15 GTX 1060 GeForce GTX 1060 Max-Q, i7-8750H, 80 Wh | MSI GS65 8RF-019DE Stealth Thin GeForce GTX 1070 Max-Q, i7-8750H, 82 Wh | Gigabyte Aero 15X v8 GeForce GTX 1070 Max-Q, i7-8750H, 94.24 Wh | Average of class Gaming | |
|---|---|---|---|---|---|---|
| Battery runtime | -22% | 63% | 32% | 104% | 43% | |
| Reader / Idle (h) | 5.1 | 4.5 -12% | 8.5 67% | 12.7 149% | 8.71 ? 71% | |
| WiFi v1.3 (h) | 4.1 | 4 -2% | 6.7 63% | 6 46% | 8.6 110% | 7.04 ? 72% |
| Load (h) | 1.7 | 0.8 -53% | 1.4 -18% | 2.6 53% | 1.47 ? -14% | |
| H.264 (h) | 5.9 | 8.4 | 8.26 ? |
Verdict
Pros
Cons
At the end of this review our verdict for the Tulpar T5 V18.1 is identical to the Schenker XMG Neo 15’s that is based on the same Tongfang GK5CN6Z barebone.
The very well-made 144 Hz IPS panel with considerably narrow display bezels and the RGB backlit mechanical keyboard certainly deserve praise. Other strengths include its low weight and low profile, which makes this 15-inch gaming notebook perfect for taking along trips.
However, the poor sound performance, the small battery, and the very poor fan control effectively prevented a better overall score. The device was extraordinarily loud when running 3D applications, which is certainly going to scare off a significant amount of potential buyers.
The Monster notebook would barely make our Slim & Light Top 10 list.
Monster Tulpar T5 V18.1.1
- 05/14/2020 v7 (old)
Florian Glaser
Price comparison

