Notebookcheck Logo

Qualcomm Snapdragon 450 vs Samsung Exynos 1380

Qualcomm Snapdragon 450

► remove from comparison Qualcomm SD 450

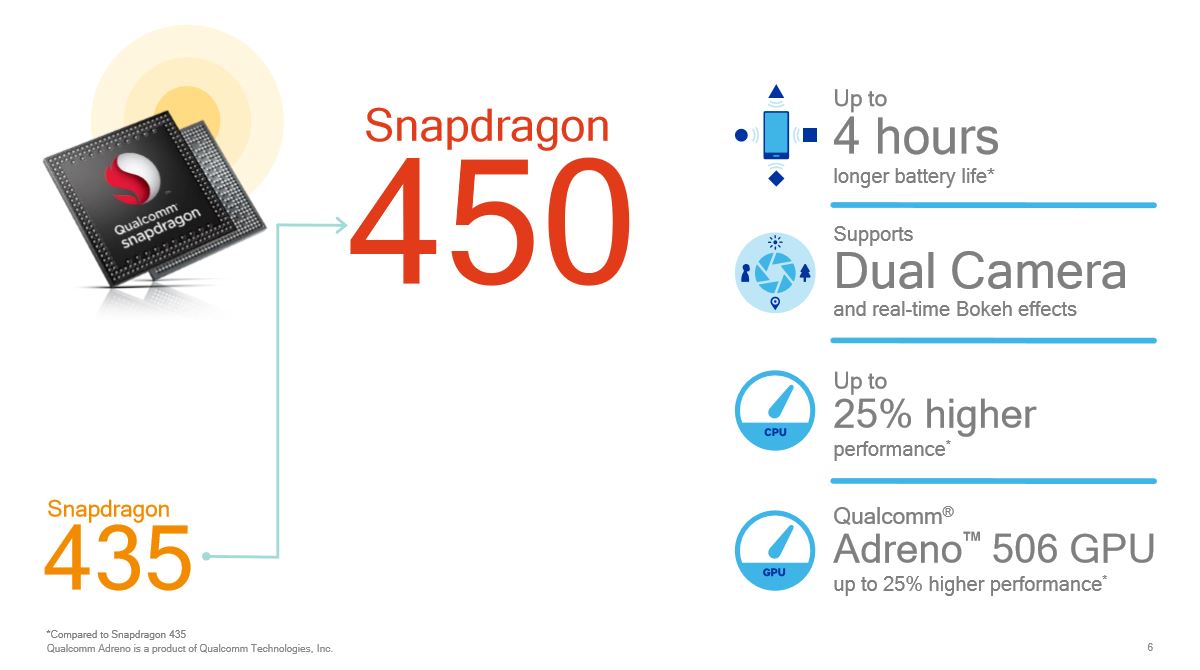
The Qualcomm Snapdragon 450 (SD450) is a lower mainstream SoC for (Android based) smartphones and tablets. It features eight ARM Cortex-A53 cores at up to 1.8 GHz and is already manufactured in the power efficient 14nm process. The integrated X9 LTE modem supports Cat. 7 with maximum transfer rates of 300 Mbps (downstream) and 150 Mbps (upstream). The SoC also includes an Adreno 506 GPU with support for Vulkan and OpenGL ES 3.1. WiFi 802.11ac (1x1, max 364 Mbps) and Bluetooth 4.1 are supported as well. The memory controller supports LPDDR3 (single channel) and the integrated video engine supports H.264 (encode and decode) and HEVC (only decode) in 1080p.

Samsung Exynos 1380

► remove from comparison Samsung Exynos 1380

The Samsung Exynos 1380 is a system on a chip (SoC) designed for mid-range smartphones and tablets running on the Android operating system. The CPU is made up of two clusters, each consisting of four cores. It features four Cortex-A78 performance cores (up to 2.4 GHz) and four Cortex-A55 power-saving cores (up to 2.0 GHz). The integrated graphics unit is an ARM Mali-G68 MP5 with speeds of up to 950 MHz.

The NPU's performance has been improved by around 14 percent compared to its predecessor, with a capacity of 4.9 TOPS. Displays with up to 144 Hz and Full HD+ resolution can now be used, and the chipset supports cameras with up to 200 MPix. The chipset also includes Wi-Fi 6 and Bluetooth 5.3. Both LPDDR4x and LPDDR5 can be used as RAM, and UFS 3.1 is possible as internal storage.

The integrated modem has significantly increased download speeds, supporting both 5G-Sub6 (download: up to 3.79 Gbps (+32%), upload: up to 1.28 Gbps) and 5G-mmWave (download: up to 3.67 Gbps (+75%), upload: up to 0.92 Gbps). The upload speed for LTE (Cat. 18, download: up to 1.2 Gbps, upload: up to 0.211 Gbps (+5%)) has only been slightly improved.

The Exynos 1380 is manufactured by Samsung using the 5-nm process.

ModelQualcomm Snapdragon 450Samsung Exynos 1380
SeriesQualcomm SnapdragonSamsung Exynos
CodenameCortex-A53ARM Cortex-A55 / A78
Series: Exynos ARM Cortex-A55 / A78
Qualcomm Snapdragon 630 compare2.2 GHz8 / 8 cores Cortex-A53
Qualcomm Snapdragon 626 compare2.2 GHz8 / 8 cores Cortex-A53
Qualcomm Snapdragon 625 compare2 GHz8 / 8 cores Cortex-A53
Qualcomm Snapdragon 439 compare2 GHz8 / 8 cores Cortex-A53
Qualcomm Snapdragon 450 « 1.8 GHz8 / 8 cores Cortex-A53
Qualcomm Snapdragon 429 compare2 GHz4 / 4 cores Cortex-A53
Qualcomm Snapdragon 617 MSM8952 compare1.5 GHz8 / 8 cores Cortex-A53
Qualcomm Snapdragon 616 MSM8939v2 compare1.7 GHz8 / 8 cores Cortex-A53
Qualcomm Snapdragon 615 MSM8939 compare1.7 GHz8 / 8 cores Cortex-A53
Qualcomm Snapdragon 610 MSM8936 compare1.7 GHz4 / 4 cores Cortex-A53
Qualcomm Snapdragon 435 compare1.4 GHz8 / 8 cores Cortex-A53
Qualcomm Snapdragon 430 (MSM8937) compare1.4 GHz8 / 8 cores Cortex-A53
Qualcomm Snapdragon 415 MSM8929 compare1.4 GHz8 / 8 cores Cortex-A53
Qualcomm Snapdragon 425 (MSM8917) compare1.4 GHz4 / 4 cores Cortex-A53
Qualcomm Snapdragon 410 MSM8916 compare1.4 GHz4 / 4 cores Cortex-A53
Qualcomm Snapdragon 410 APQ8016 compare1.2 GHz4 / 4 cores Cortex-A53
Samsung Exynos 1480 compare2.05 - 2.75 GHz8 / 8 cores ARM Cortex-A55 / A78
Samsung Exynos 1380 « 2 - 2.4 GHz8 / 8 cores ARM Cortex-A55 / A78
Clock1800 MHz2000 - 2400 MHz
Cores / Threads8 / 88 / 8
Technology14 nm5 nm
FeaturesAdreno 506 GPU, X9 LTE Modem (300 / 150 Mbps)NPU, Wi-Fi 802.11ax (2x2 MIMO), Bluetooth 5.3, FM Radio Rx, GNSS (GPS, Glonass, BeiDou, Galileo), Triple-ISP
iGPUQualcomm Adreno 506ARM Mali-G68 MP5 ( - 950 MHz)
ArchitectureARMARM
Announced
Manufacturerwww.qualcomm.comsemiconductor.samsung.com

Benchmarks

Performance Rating - Geekbench 5.5, PCM Work, Sling Shot Physics, Antutu v8 CPU - SD 450
0.2 pt (14%)
3DMark - 3DMark Ice Storm Extreme Physics
100%
1 SD 450 +
11735 Points (10%)
3DMark - 3DMark Ice Storm Unlimited Physics
100%
1 SD 450 +
min: 13596     avg: 14216     median: 14036.5 (12%)     max: 15273 Points
3DMark - 3DMark Sling Shot Extreme (ES 3.1) Unlimited Physics
min: 1529     avg: 1773     median: 1789.5 (21%)     max: 1826 Points
min: 4176     avg: 4349     median: 4386.5 (50%)     max: 4445 Points
Geekbench 6.2 - Geekbench 6.2 Single-Core
min: 1011     avg: 1016     median: 1014.5 (27%)     max: 1023 Points
Geekbench 6.2 - Geekbench 6.2 Multi-Core
min: 2858     avg: 2882     median: 2882.5 (11%)     max: 2906 Points
Geekbench 5.5 - Geekbench 5.1 - 5.4 64 Bit Single-Core
min: 131     avg: 140.3     median: 131 (6%)     max: 159 Points
Geekbench 5.5 - Geekbench 5.1 - 5.4 64 Bit Multi-Core
min: 493     avg: 631     median: 498 (1%)     max: 902 Points
Geekbench 5.0 - Geekbench 5.0 64 Bit Single-Core
786 Points (3%)
Geekbench 5.0 - Geekbench 5.0 64 Bit Multi-Core
2766 Points (9%)
min: 3550     avg: 3556     median: 3555.5 (36%)     max: 3561 Points
Geekbench 4.4 - Geekbench 4.1 - 4.4 64 Bit Multi-Core
min: 3272     avg: 3862     median: 3907 (4%)     max: 4022 Points
min: 11130     avg: 11160     median: 11160 (12%)     max: 11190 Points
Geekbench 4.0 - Geekbench 4.0 64 Bit Single-Core
100%
1 SD 450 +
min: 709     avg: 733     median: 732.5 (10%)     max: 756 Points
Geekbench 4.0 - Geekbench 4.0 64 Bit Multi-Core
100%
1 SD 450 +
min: 3625     avg: 3691     median: 3690.5 (9%)     max: 3756 Points
Geekbench 3 - Geekbench 3 64 Bit Multi-Core
100%
1 SD 450 +
min: 3963     avg: 3981     median: 3980.5 (6%)     max: 3998 Points
Geekbench 3 - Geekbench 3 64 Bit Single-Core
100%
1 SD 450 +
707 Points (11%)
Geekbench 2 - 32 Bit - Geekbench Stream
100%
1 SD 450 +
min: 737     avg: 747     median: 746.5 (6%)     max: 756 Points
Geekbench 2 - 32 Bit - Geekbench Memory
100%
1 SD 450 +
min: 1708     avg: 2113     median: 2112.5 (19%)     max: 2517 Points
Geekbench 2 - 32 Bit - Geekbench Floating Point
100%
1 SD 450 +
min: 5993     avg: 6011     median: 6010.5 (12%)     max: 6028 Points
Geekbench 2 - 32 Bit - Geekbench Integer
100%
1 SD 450 +
min: 3340     avg: 3381     median: 3381 (7%)     max: 3422 Points
Geekbench 2 - 32 Bit - Geekbench Total Score
100%
1 SD 450 +
min: 3683     avg: 3784     median: 3783.5 (10%)     max: 3884 Points
Mozilla Kraken 1.1 - Kraken 1.1 Total Score *
min: 11012     avg: 11506     median: 11492.5 (13%)     max: 11863 ms
min: 1099     avg: 1159     median: 1172.3 (1%)     max: 1208.8 ms
Sunspider - Sunspider 1.0 Total Score *
187 ms (2%)
Octane V2 - Octane V2 Total Score
min: 3470     avg: 3981     median: 3997 (4%)     max: 4115 Points
min: 33801     avg: 35093     median: 34758 (31%)     max: 36155 Points
WebXPRT 4 - WebXPRT 4 Score
min: 97     avg: 109.6     median: 108 (31%)     max: 123 Points
WebXPRT 3 - WebXPRT 3 Score
min: 28     avg: 31.3     median: 31.5 (7%)     max: 34 Points
min: 124     avg: 131.3     median: 125 (26%)     max: 145 Points
AnTuTu v6 - AnTuTu v6 Total Score
100%
1 SD 450 +
min: 54731     avg: 57703     median: 57827.5 (20%)     max: 60077 Points
AnTuTu v7 - AnTuTu v7 MEM
100%
1 SD 450 +
min: 4090     avg: 5355     median: 5158 (16%)     max: 7614 Points
AnTuTu v7 - AnTuTu v7 UX
100%
1 SD 450 +
min: 17204     avg: 19521     median: 19734 (24%)     max: 20891 Points
AnTuTu v7 - AnTuTu v7 GPU
100%
1 SD 450 +
min: 11937     avg: 12110     median: 12147 (4%)     max: 12208 Points
AnTuTu v7 - AnTuTu v7 CPU
100%
1 SD 450 +
min: 33473     avg: 34106     median: 33975 (21%)     max: 35092 Points
AnTuTu v7 - AnTuTu v7 Total Score
100%
1 SD 450 +
min: 56497     avg: 69869     median: 71167 (13%)     max: 73468 Points
AnTuTu v8 - AnTuTu v8 UX
100%
1 SD 450 +
min: 26309     avg: 28038     median: 28107 (24%)     max: 29697 Points
AnTuTu v8 - AnTuTu v8 MEM
100%
1 SD 450 +
min: 13168     avg: 16031     median: 15671 (13%)     max: 19253 Points
AnTuTu v8 - AnTuTu v8 GPU
100%
1 SD 450 +
min: 9371     avg: 9408     median: 9408 (2%)     max: 9444 Points
AnTuTu v8 - AnTuTu v8 CPU
100%
1 SD 450 +
min: 28376     avg: 35468     median: 38797 (14%)     max: 39230 Points
AnTuTu v8 - AnTuTu v8 Total Score
100%
1 SD 450 +
min: 89022     avg: 92277     median: 90185 (9%)     max: 97624 Points
Antutu v9 - AnTuTu v9 Total Score
min: 505141     avg: 510383     median: 508957 (31%)     max: 518476 Points
Antutu v9 - AnTuTu v9 CPU
min: 151517     avg: 153827     median: 154008 (42%)     max: 155773 Points
AndEBench - AndEBench Java
0 Iter./s (0%)
AndEBench - AndEBench Native
0 Iter./s (0%)
PassMark PerformanceTest Mobile V1 - PerformanceTest Mobile V1 CPU Tests
101906 Points (13%)
591842 Points (78%)
PCMark for Android - PCM f. Android Work 2.0 Battery Life
100%
1 SD 450 +
652 min (12%)
PCMark for Android - PCM f. Android Computer Vision
100%
1 SD 450 +
min: 2140     avg: 2239     median: 2157 (11%)     max: 2583 Points
PCMark for Android - PCM f. Android Storage
100%
1 SD 450 +
min: 3145     avg: 5094     median: 4391 (9%)     max: 7635 Points
PCMark for Android - PCM f. Android Storage 2.0 random write internal
min: 33.8     avg: 36.1     median: 34.9 (26%)     max: 39.6 MB/s
PCMark for Android - PCM f. Android Storage 2.0 seq write internal
min: 121     avg: 264.3     median: 228 (7%)     max: 444 MB/s
PCMark for Android - PCM f. Android Storage 2.0 random read internal
min: 32.3     avg: 34     median: 32.6 (40%)     max: 37.2 MB/s
PCMark for Android - PCM f. Android Storage 2.0 seq read internal
min: 478     avg: 482     median: 484 (13%)     max: 484 MB/s
PCMark for Android - PCM f. Android Storage 2.0 score
min: 12748     avg: 16900     median: 17384 (28%)     max: 20032 Points
PCMark for Android - PCM f. Android Work Score 3.0
min: 11259     avg: 12568     median: 13024 (60%)     max: 13488 Points
CrossMark - CrossMark Overall
min: 637     avg: 665     median: 665 (25%)     max: 703 Points
Power Consumption - Geekbench 5.5 Power Consumption 150cd *
min: 5.62     avg: 6.2     median: 5.9 (3%)     max: 7.1 Watt
Power Consumption - Idle Power Consumption 150cd 1min *
min: 1.084     avg: 1.7     median: 1.5 (2%)     max: 2.42 Watt

Average Benchmarks Qualcomm Snapdragon 450 → 100% n=10

Average Benchmarks Samsung Exynos 1380 → 436% n=10

- Range of benchmark values for this graphics card
- Average benchmark values for this graphics card
* Smaller numbers mean a higher performance
1 This benchmark is not used for the average calculation

Add one or more devices and compare

In the following list you can select (and also search for) devices that should be added to the comparison. You can select more than one device.

restrict list:

show all (including archived), 2024, 2023
v1.27
log 15. 19:49:51

#0 checking url part for id 9946 +0s ... 0s

#1 checking url part for id 15010 +0s ... 0s

#2 not redirecting to Ajax server +0s ... 0s

#3 did not recreate cache, as it is less than 5 days old! Created at Thu, 13 Jun 2024 05:33:43 +0200 +0.001s ... 0.001s

#4 composed specs +0.018s ... 0.019s

#5 did output specs +0s ... 0.019s

#6 getting avg benchmarks for device 9946 +0.012s ... 0.031s

#7 got single benchmarks 9946 +0.04s ... 0.07s

#8 getting avg benchmarks for device 15010 +0.003s ... 0.073s

#9 got single benchmarks 15010 +0.014s ... 0.088s

#10 got avg benchmarks for devices +0s ... 0.088s

#11 No cached benchmark found, getting uncached values +0.153s ... 0.24s

#12 No cached benchmark found, getting uncached values +0.002s ... 0.242s

#13 min, max, avg, median took s +0.038s ... 0.28s

#14 return log +0.051s ... 0.331s

Please share our article, every link counts!
> Expert Reviews and News on Laptops, Smartphones and Tech Innovations > Benchmarks / Tech > Processor Comparison - Head 2 Head
Redaktion, 2017-09- 8 (Update: 2023-07- 1)