

NVIDIA Quadro T2000 (Laptop) vs AMD Radeon RX 6450M
NVIDIA Quadro T2000 (Laptop)
► remove from comparisonThe Nvidia Quadro T2000 for laptops is a professional mobile graphics card that is based on the Turing architecture (TU117 chip). It is based on the consumer desktop GTX 1650 Ti with comparable clock speeds and therefore currently between a mobile GTX 1650 and GTX 1660 Ti. The chip is manufactured in 12nm FinFET at TSMC.
The GPU features 1024 shaders, 64 texture mapping units and 32 ROPs. The 4 GB GDDR5 memory is connected with a 128-bit memory interface and clocked at 2000 MHz. At a TGP of 60W, the clock speeds are specified from 1575 MHz (base) to 1785 MHz (boost).
The Turing generation did not only introduce raytracing for the RTX cards, but also optimized the architecture of the cores and caches. According to Nvidia the CUDA cores offer now a concurrent execution of floating point and integer operations for increased performance in compute-heavy workloads of modern games. Furthermore, the caches were reworked (new unified memory architecture with twice the cache compared to Pascal). This leads to up to 50% more instructions per clock and a 40% more power efficient usage compared to Pascal. In contrary to the faster Quadro RTX cards (e.g. Quadro RTX 3000), the T1000 and T2000 don not feature raytracing and Tensor cores.
AMD Radeon RX 6450M
► remove from comparison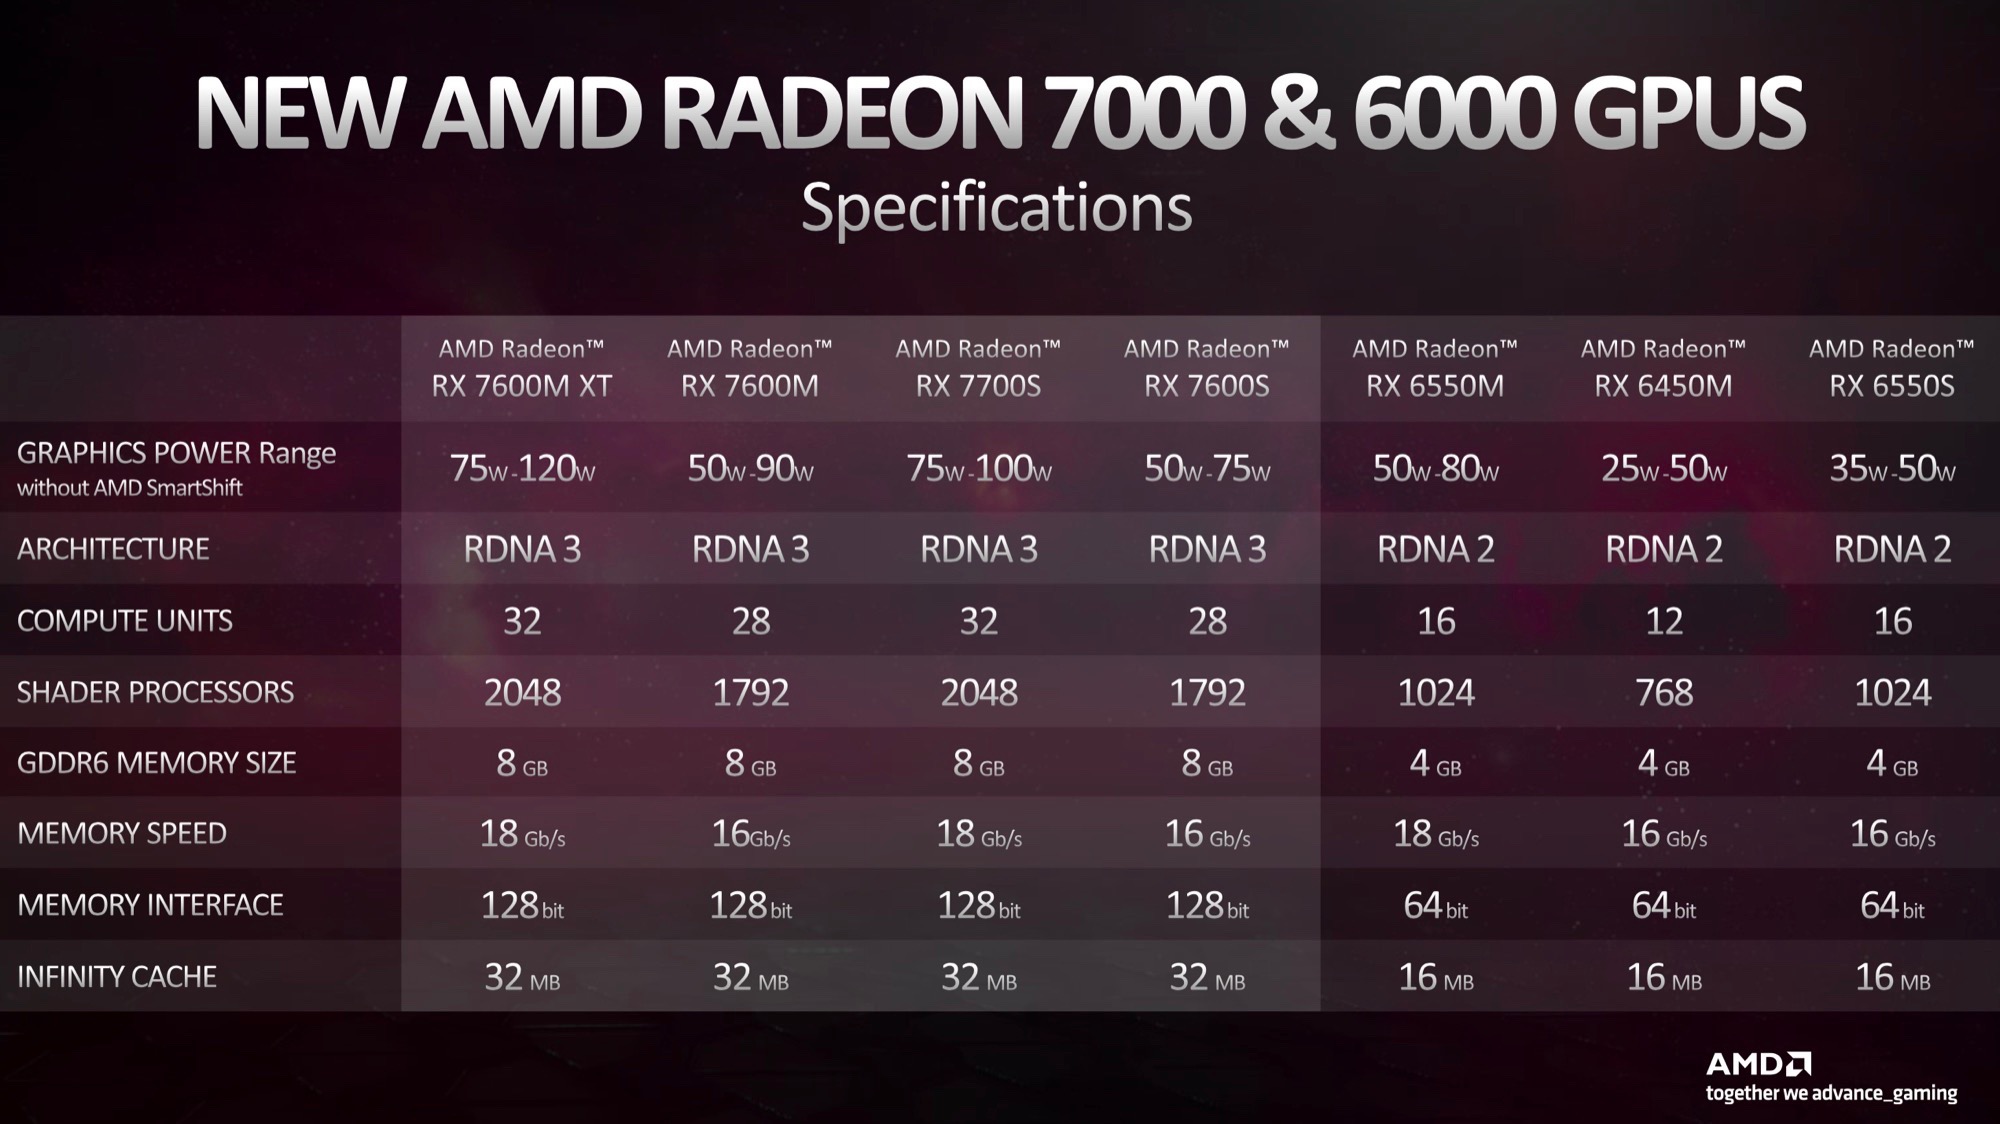
The AMD Radeon RX 6450M is a mobile entry-level graphics card based on the Navi 24 chip (RDNA 2 architecture) manufactured in the modern 6nm process. It features 768 cores (12 CUs - compute units) and 4 GB of fast GDDR6 graphics memory connected with a small 64 Bit memory bus. The chip also includes 16 MB Infinity Cache. The game clock speed is specified at 2220 MHz.
The performance should be slightly better than the old RX 6300M (slower clocked, but higher memory bandwidth) and therefore positioned in the entry level. This means, the GPU is best suited for 1080p gaming in medium to high detail settings.
The Navi 24 chip is manufactured at TSMC in the modern 6nm process and the 6450M can be configured from 25 - 50 Watt TGP.
| NVIDIA Quadro T2000 (Laptop) | AMD Radeon RX 6450M | |||||||||||||||||||||||||||||||||||||||||||||||||||||||||||||||||||||||||||||||||||||||||||||||||
| Radeon RX 6000M Series |
|
| ||||||||||||||||||||||||||||||||||||||||||||||||||||||||||||||||||||||||||||||||||||||||||||||||
| Codename | N19P-Q3 | |||||||||||||||||||||||||||||||||||||||||||||||||||||||||||||||||||||||||||||||||||||||||||||||||
| Architecture | Turing | RDNA 2 | ||||||||||||||||||||||||||||||||||||||||||||||||||||||||||||||||||||||||||||||||||||||||||||||||
| Pipelines | 1024 - unified | 768 - unified | ||||||||||||||||||||||||||||||||||||||||||||||||||||||||||||||||||||||||||||||||||||||||||||||||
| Core Speed | 1575 - 1785 (Boost) MHz | 2000 - 2220 (Boost) MHz | ||||||||||||||||||||||||||||||||||||||||||||||||||||||||||||||||||||||||||||||||||||||||||||||||
| Memory Speed | 8000 MHz | 18000 MHz | ||||||||||||||||||||||||||||||||||||||||||||||||||||||||||||||||||||||||||||||||||||||||||||||||
| Memory Bus Width | 128 Bit | 64 Bit | ||||||||||||||||||||||||||||||||||||||||||||||||||||||||||||||||||||||||||||||||||||||||||||||||
| Memory Type | GDDR5 | GDDR6 | ||||||||||||||||||||||||||||||||||||||||||||||||||||||||||||||||||||||||||||||||||||||||||||||||
| Max. Amount of Memory | 4 GB | 4 GB | ||||||||||||||||||||||||||||||||||||||||||||||||||||||||||||||||||||||||||||||||||||||||||||||||
| Shared Memory | no | no | ||||||||||||||||||||||||||||||||||||||||||||||||||||||||||||||||||||||||||||||||||||||||||||||||
| API | DirectX 12_1, OpenGL 4.6 | DirectX 12_2, Shader 6.4, OpenGL 4.6 | ||||||||||||||||||||||||||||||||||||||||||||||||||||||||||||||||||||||||||||||||||||||||||||||||
| Power Consumption | 60 Watt | 25 Watt (25 - 50 Watt TGP) | ||||||||||||||||||||||||||||||||||||||||||||||||||||||||||||||||||||||||||||||||||||||||||||||||
| Transistors | 4.7 Billion | |||||||||||||||||||||||||||||||||||||||||||||||||||||||||||||||||||||||||||||||||||||||||||||||||
| technology | 12 nm | 6 nm | ||||||||||||||||||||||||||||||||||||||||||||||||||||||||||||||||||||||||||||||||||||||||||||||||
| Notebook Size | medium sized | |||||||||||||||||||||||||||||||||||||||||||||||||||||||||||||||||||||||||||||||||||||||||||||||||
| Date of Announcement | 27.05.2019 | 05.01.2023 | ||||||||||||||||||||||||||||||||||||||||||||||||||||||||||||||||||||||||||||||||||||||||||||||||
| Cache | L3: 16 MB | |||||||||||||||||||||||||||||||||||||||||||||||||||||||||||||||||||||||||||||||||||||||||||||||||
| Features | DisplayPort 1.4 w/DFSC, HDMI 2.0b, Radeon Media Engine (H.264 4K150 decode, 4K90 encode / H.265 4K90 decode, 4K60 encode / VP9 4K90 decode) | |||||||||||||||||||||||||||||||||||||||||||||||||||||||||||||||||||||||||||||||||||||||||||||||||
| Link to Manufacturer Page | www.amd.com |
Benchmarks
specvp12 sw-03 + NVIDIA Quadro T2000 (Laptop)
Cinebench R15 OpenGL 64 Bit + NVIDIA Quadro T2000 (Laptop)
Average Benchmarks NVIDIA Quadro T2000 (Laptop) → 0% n=0
* Smaller numbers mean a higher performance
1 This benchmark is not used for the average calculation
For more games that might be playable and a list of all games and graphics cards visit our Gaming List