Notebookcheck Logo

YMTC PC005 256GB vs Silicon Motion AZW 256G M.2280 NVMe 4X 200725 D

YMTC PC005 256GB

► remove from comparison  PC005-256GB

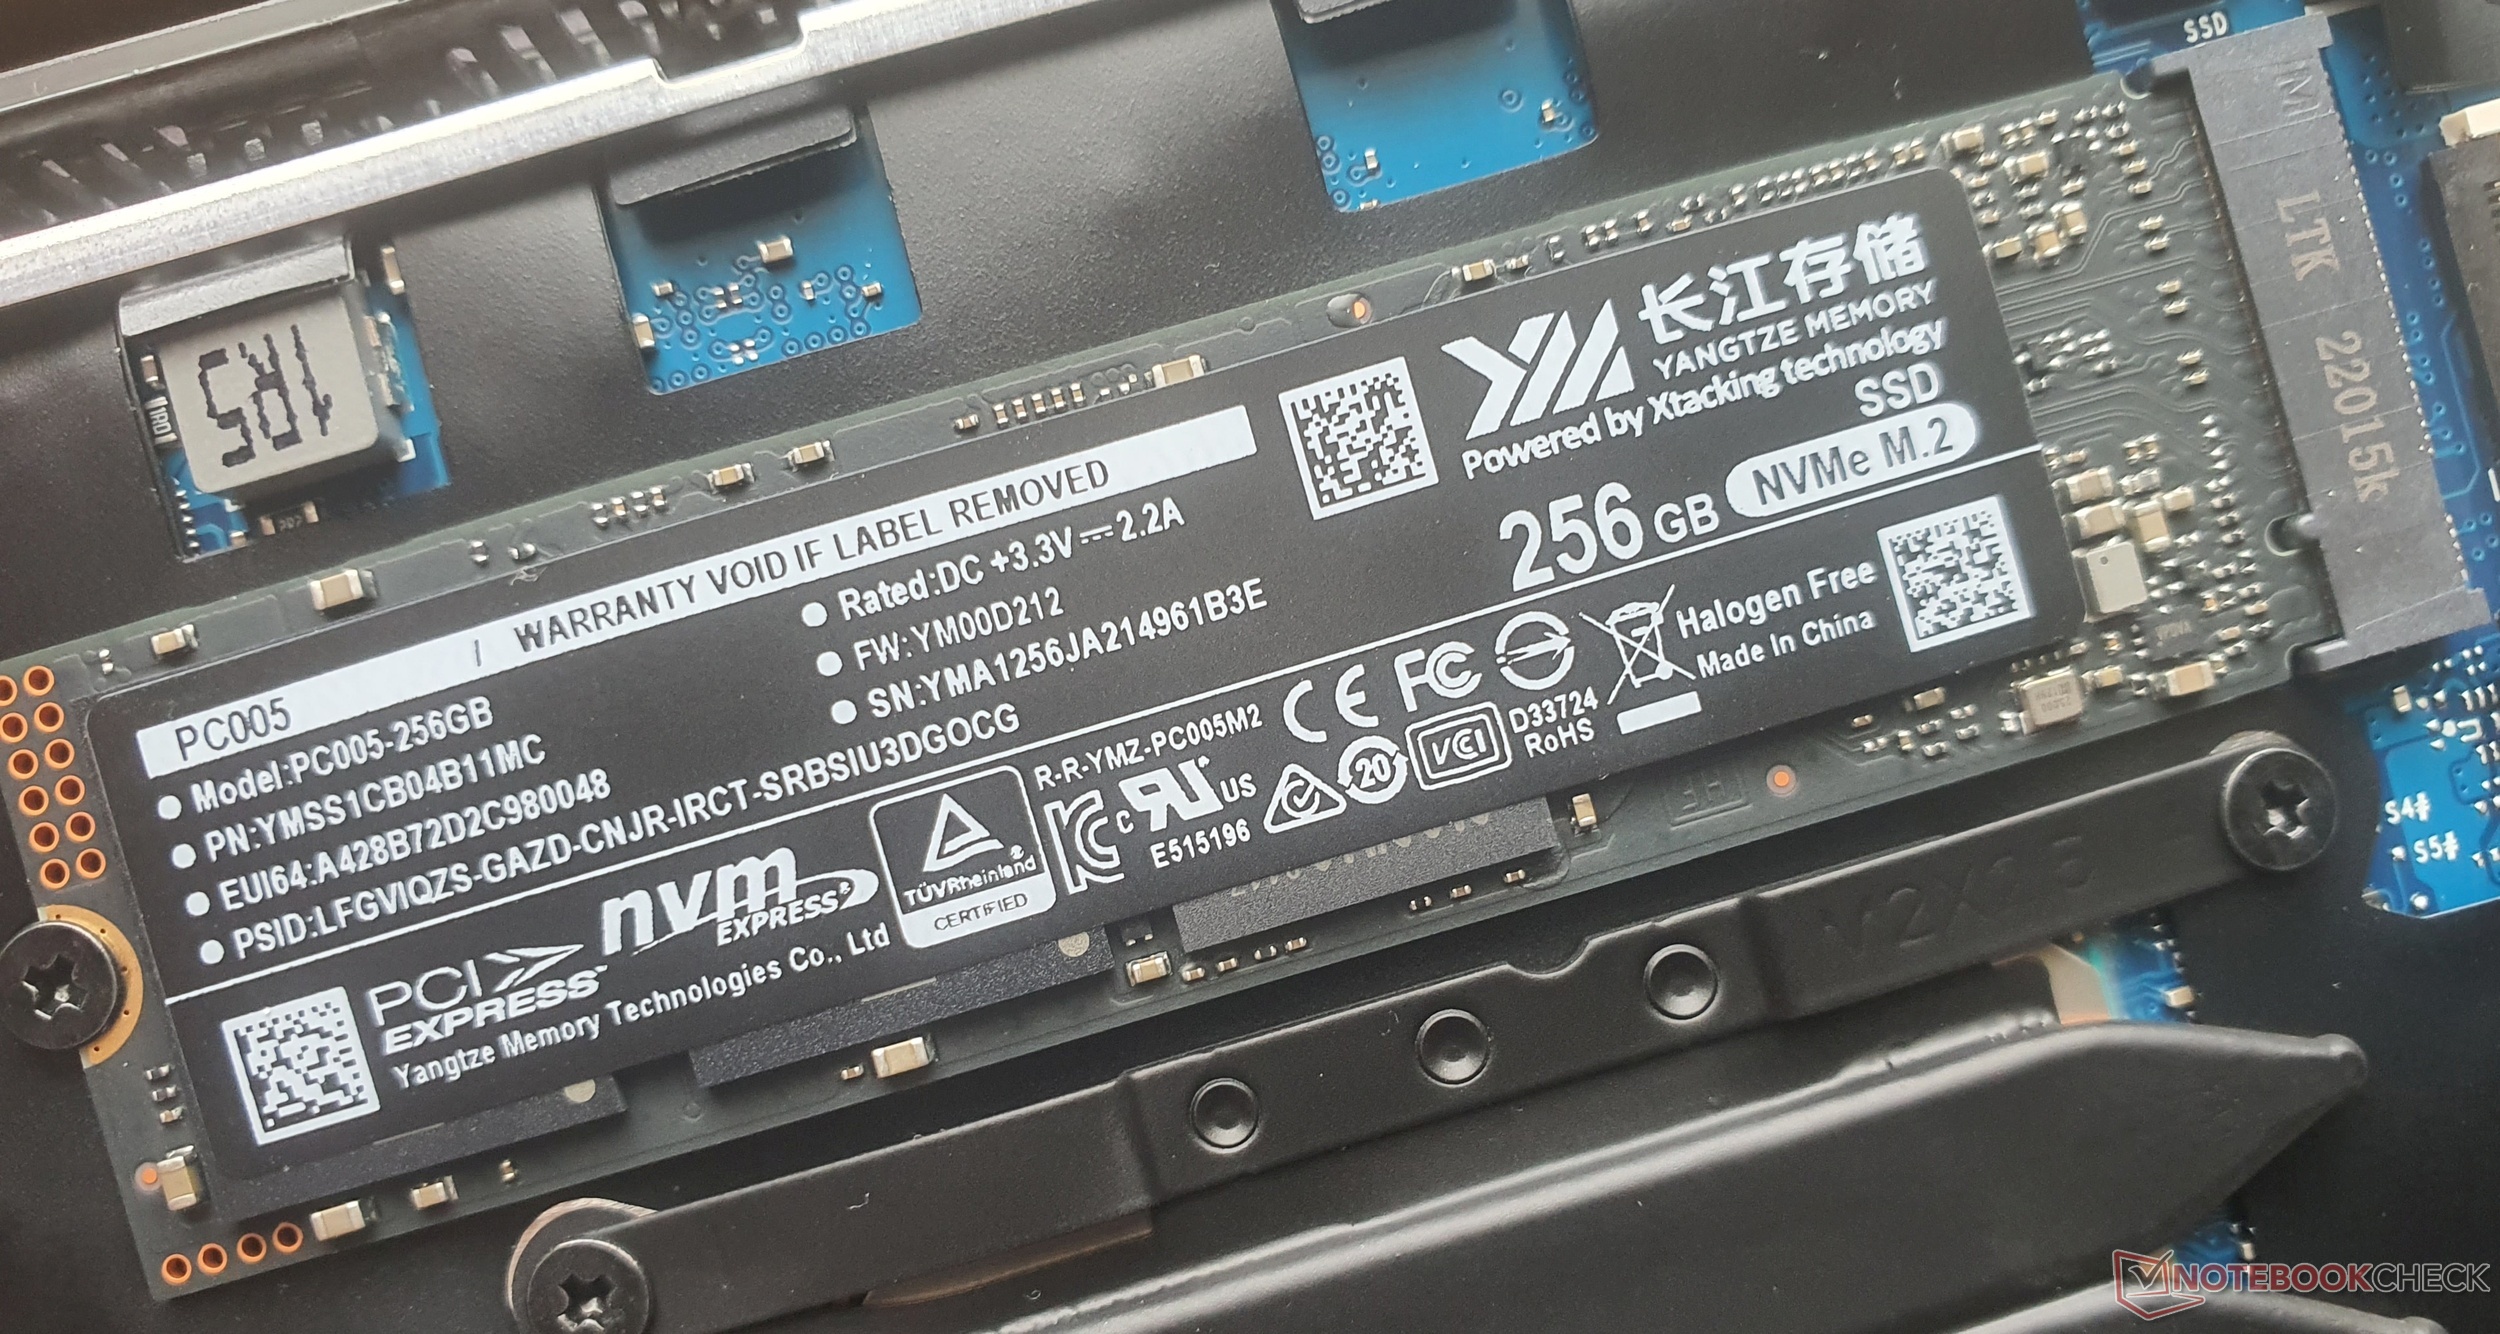
The YMTC PC005 256 GB (PC005-256GB, YMSS1CB04B11MC) is an entry level NVMe M.2 2280 SSD by Yangtze Memory.

Silicon Motion AZW 256G M.2280 NVMe 4X 200725 D

► remove from comparison  AZW 256G M.2280

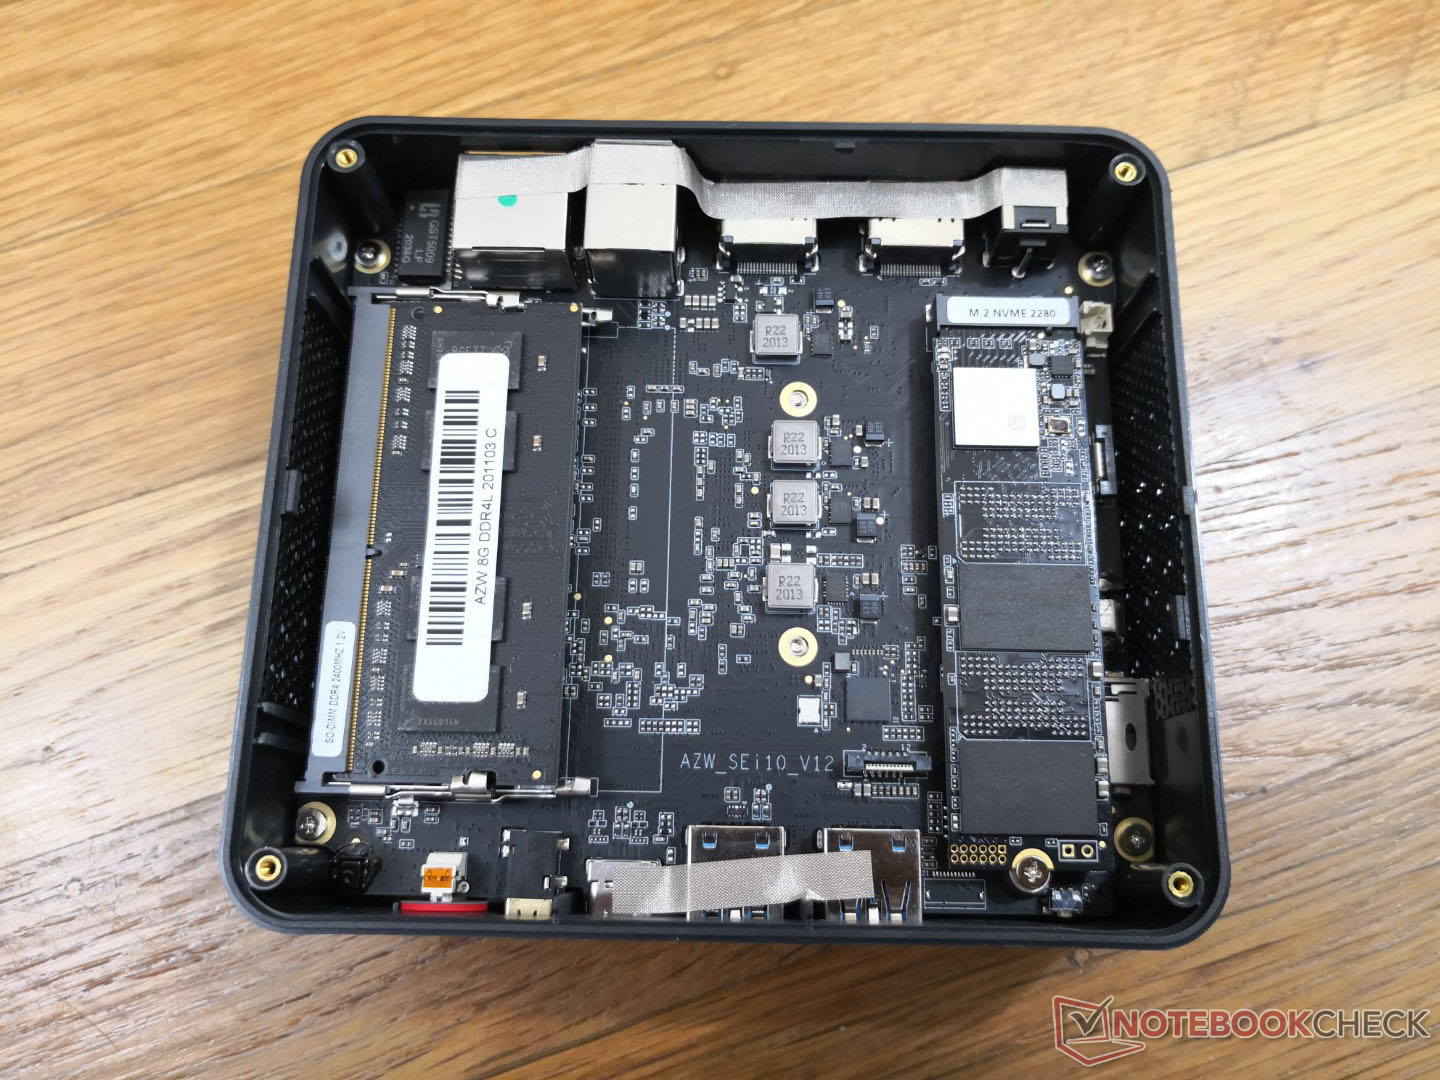
The Silicon Motion AZW 256 GB M.2 2280 NVMe SSD is an entry level M.2 2280 NVMe SSD. Our test sample used the T0214B0L firmware and was identified only by SSD 256GB in Windows 10.

YMTC PC005 256GBSilicon Motion AZW 256G M.2280 NVMe 4X 200725 D
TypeSSDSSD
SizeM.2 2280M.2 2280
Capacity256 GB256 GB
InterfaceNVMeNVMe
Announced17.02.2023 26.12.2020

Benchmarks

Performance Rating - DiskSpd - PC005-256GB
22.1 pt (25%)
Restrict / Search: Model: Max. age: years
Performance Rating - DiskSpd - AZW 256G M.2280
16.5 pt (19%)
Seagate ST1000LM014 Solid State Hybrid Drive
0.717 -96%
...
WDC PC SN530 SDBQNPZ-512G
16.1 -2%
WDC PC SN520 SDAPNUW-512G
16.2 -2%
Samsung SSD 950 Pro 512GB m.2 NVMe
16.2 -2%
16.2 -2%
16.3 -1%
16.3 -1%
WDC PC SN520 SDAPMUW-512
16.4 -1%
16.4 -1%
16.4 -1%
Silicon Motion AZW 256G M.2280 NVMe 4X 200725 D
16.5
16.6 1%
16.6 1%
16.7 1%
16.8 2%
16.8 2%
16.8 2%
16.8 2%
AirDisk AFF 10-512G
16.8 2%
Kingston OM8PCP3512F-AB
16.9 2%
...
Kingston Fury Renegade G5 4TB
87.8 432%
0%
100%
Restrict / Search: Model: Max. age: years
AS SSD - Copy Game
387 MB/s (6%)
364.4 MB/s (6%)
AS SSD - Copy Program
296 MB/s (11%)
121.1 MB/s (4%)
AS SSD - Copy ISO
1127 MB/s (4%)
1160 MB/s (4%)
AS SSD - Score Total
1930 Points (12%)
AS SSD - Score Write
619 Points (9%)
AS SSD - Score Read
919 Points (15%)
AS SSD - Access Time Write *
0 ms (0%)
AS SSD - Access Time Read *
0.1 ms (0%)
AS SSD - 4K-64 Write
365 MB/s (6%)
154.8 MB/s (3%)
AS SSD - 4K-64 Read
586 MB/s (12%)
357.3 MB/s (7%)
AS SSD - 4K Write
165.3 MB/s (32%)
66.2 MB/s (13%)
AS SSD - 4K Read
55.2 MB/s (18%)
33.1 MB/s (11%)
AS SSD - Sequential Write
886 MB/s (8%)
323.5 MB/s (3%)
AS SSD - Sequential Read
2780 MB/s (22%)
CrystalDiskMark 5.2 / 6 - CDM 5/6 Write 4K
203 MB/s (18%)
CrystalDiskMark 5.2 / 6 - CDM 5/6 Read 4K
63.2 MB/s (2%)
CrystalDiskMark 5.2 / 6 - CDM 5 Write Seq
1114 MB/s (6%)
CrystalDiskMark 5.2 / 6 - CDM 5 Read Seq
1765 MB/s (19%)
CrystalDiskMark 5.2 / 6 - CDM 5/6 Write 4K Q32T1
423.9 MB/s (9%)
CrystalDiskMark 5.2 / 6 - CDM 5/6 Read 4K Q32T1
389.2 MB/s (6%)
CrystalDiskMark 5.2 / 6 - CDM 5/6 Write Seq Q32T1
1104 MB/s (7%)
CrystalDiskMark 5.2 / 6 - CDM 5/6 Read Seq Q32T1
1990 MB/s (11%)
DiskSpd - DiskSpd 4k_q1t1_write
238 MB/s (55%)
DiskSpd - DiskSpd 4k_q1t1_read
49.6 MB/s (14%)
48.3 MB/s (14%)
DiskSpd - DiskSpd 4k_q32t16_write
692 MB/s (10%)
DiskSpd - DiskSpd 4k_q32t16_read
724 MB/s (9%)
DiskSpd - DiskSpd seq_write
1126 MB/s (11%)
DiskSpd - DiskSpd seq_read
2155 MB/s (23%)
1341 MB/s (14%)
DiskSpd - DiskSpd seq_q8t1_write
1219 MB/s (8%)
DiskSpd - DiskSpd seq_q8t1_read
2592 MB/s (16%)
1709 MB/s (11%)
DiskSpd - DiskSpd Loop seq_q8t1_read
2607 MB/s (16%)
1674 MB/s (10%)
- Range of benchmark values for this graphics card
red legend - Average benchmark values for this graphics card
* Smaller numbers mean a higher performance

Average Benchmarks

YMTC PC005 256GB → 100% n=23

Silicon Motion AZW 256G M.2280 NVMe 4X 200725 D → 62% n=23

Average of the median scores above. 1 ... This benchmark is not used for the average calculation

Add one or more devices and compare

In the following list you can select (and also search for) devices that should be added to the comparison. You can select more than one device.

restrict list:
v1.35
log 06. 12:23:26

#0 ran 0s before starting gpusingle class +0s ... 0s

#1 checking url part for id 3944 +0s ... 0s

#2 checking url part for id 3593 +0s ... 0s

#3 redirected to Ajax server, took 1780741406s time from redirect:0 +0s ... 0s

#4 did not recreate cache, as it is less than 5 days old! Created at Mon, 01 Jun 2026 22:56:29 +0200 +0s ... 0s

#5 composed specs +0.003s ... 0.003s

#6 did output specs +0s ... 0.003s

#7 getting avg benchmarks for device 3944 +0.005s ... 0.008s

#8 got single benchmarks 3944 +0.001s ... 0.009s

#9 getting avg benchmarks for device 3593 +0.003s ... 0.013s

#10 got single benchmarks 3593 +0.001s ... 0.014s

#11 got avg benchmarks for devices +0s ... 0.014s

#12 min, max, avg, median took s +0.052s ... 0.066s

#13 return log +0.369s ... 0.435s

Google LogoAdd as a preferred source on Google
Mail Logo
> Expert Reviews and News on Laptops, Smartphones and Tech Innovations > Benchmarks / Tech > HDD/SSD Comparison - Head 2 Head
Redaktion, 2017-09- 8 (Update: 2023-07- 1)