Notebookcheck Logo

Apple M2 vs Apple M3 vs Apple M4 (10 cores)

Apple M2

► remove from comparison Apple M2

The Apple M2 is a System on a Chip (SoC) from Apple that is found in the late 2022 MacBook Air and, MacBook Pro 13. It offers 8 cores divided in four performance cores and four power-efficiency cores. The big cores offer 192 KB instruction cache, 128 KB data cache, and 16 MB shared L2 cache (up from 12 MB). The four efficiency cores are a lot smaller and offer only 128 KB instruction cache, 64 KB data cache, and 4 MB shared cache. The efficiency cores (E cluster) clock with  up to 2,4 GHz, the performance cores (P cluster) with up to 3,5 GHz and therefore higher than the M1 cores. The architecture should be similar to the A15 (iPhone 13) with Avalanche and Blizzard cores.

The chip features a unified memory architecture for the CPU and GPU cores and supports up to 24 GB LPDDR5-6400 for a bandwidth of up to 100GB/s.

According to Apple, the M2 offers a 18% higher CPU performance at the same power consumption level compared to the Apple M1. In our tests, the MacBook Pro 13 with active cooling was able to reach the 18% in Geekbench Multi. In other benchmarks we measured 12 to 15% gains compared to the M1. Therefore, the performance is now near the M1 Pro with 8 cores. The passively cooled MacBook Air may however suffer from throttling in longer load scenarios.

The integrated graphics card in the M2 offers 8 or 10 cores and a peak performance of 3.6 TFLOPs.

Furthermore, the SoC integrates a fast 16 core neural engine with a peak performance of 16 TOPS (for AI hardware acceleration), a secure enclave (e.g., for encryption), Thunderbolt / USB 4 controller, an ISP, and media de- and encoders.

The Apple M2 includes 20 billion transistors (up from the 16 billion of the M1) and is manufactured in the second generation 5nm process at TSMC (most likely N5P). The power consumption is rated at 20W what we also measured under CPU load.

Apple M3

► remove from comparison Apple M3

The Apple M3 is a system on a chip (SoC) from Apple for notebooks that was introduced in late 2023. It integrates a new 8-core CPU with 4 performance cores with up to 4.06 GHz and 4 efficiency cores running at up to 2.75 GHz. Apple claims that the CPU is up to 20% faster than in the old Apple M2 (3.5 GHz)

Due to the higher clock speeds and architecture improvements, the processor performance is also significantly better than the M2 in benchmarks (see e.g. Geekbench below) and can keep up with the fastest CPUs in short single-core tests (like the Raptor Lake i9-13950HX).

The M3 also integrates a new graphics adapter with dynamic caching, mesh shading and ray tracing acceleration called Apple M3 10-Core GPU. According to Apple, it is 20% faster than the GPU in the M2. The chip integrates again 10 GPU cores, but the cheaper variant only offers 8 cores (e.g. in the entry iMac). Later in early 2025 Apple also introduced a 9-core variant in the new iPad Air models. Furthermore, the GPU only supports 2 displays (an additional 6K60 display to the internal one).

Both GPU and CPU can access the unified memory on the package together. It is still available in 8, 16 and 24 GB variants and offers the same 100 GB/s maximum bandwidth (unlike the Pro models that feature a reduced memory bandwidth). 

The integrated 16-core Neural Engine has also been revised and now offers 18 TOPS peak performance (versus 15.8 TOPS in the M2 but 35 TOPS in the new A17 Pro). The video engine now supports AV1 decoding in hardware. H.264, HEVC and ProRes (RAW) can still be decoded and encoded.

Unfortunately, the integrated wireless network module only supports Wi-Fi 6E (no Wi-Fi 7) and due to the support of only a single external monitor, the chip also has to make do with no Thunderbolt 4 (Thunderbolt 3 / USB 4 support only for up to 40 Gbit/s).

The chip is manufactured on the current 3nm TSMC process (N3B most likely) and contains 25 billion transistors (+25% vs. Apple M2). The 3nm process should also contribute to the excellent efficiency of the chip. Under load, the M3 CPU consumes approximately 20 Watt.

Apple M4 (10 cores)

► remove from comparison Apple M4 (10 cores)

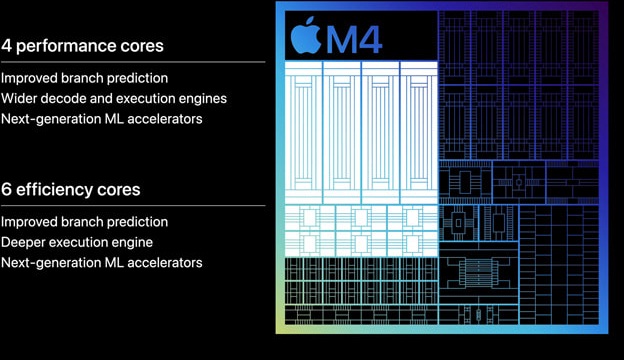
The 10-core Apple M4 is an impressively fast ARM architecture processor (SoC) sporting 4 performance and 6 efficient CPU cores along with a 16-core neural engine and a 10-core GPU with hardware RT support and other modern features. On-package 7500 MT/s LPDDR5x RAM, USB 4 support and Thunderbolt 4 support are onboard as well, as are Wi-Fi 6E and Bluetooth 5.3.

The M4 debuted in May 2024 as part of an iPad launch event; its 4 performance cores run at up to 4.4 GHz, representing a healthy improvement over the M3 (10-core GPU) and its 4.06 GHz top clock speed. Besides, this new chip also has 6 efficient cores at its disposal that run at up to 2.9 GHz. The M3 had to make do with 4 performance cores and 4 efficient cores, for reference.

Architecture and Features

The new CPU cores run at faster clock speeds than what the M3 was capable of while also featuring some minor architectural improvements. A heavily customized version of ARM's v9.4-A microarchitecture is reportedly employed here. The M4 comes with on-package LPDDR5x-7500 RAM (120 GB/s) whereas the M3 was limited to 6400 MT/s. The updated NPU delivers up to 38 TOPS of performance for AI workloads.

Performance

In 2024 iPad Pros, the 3 nm chip is 10% to 20% faster than the M3 (10 GPU cores) in both multi-thread and single-thread short-term workloads. It also delivers about 10% higher multi-thread performance than the 9-core M4. This puts the 10-core part on an equal footing with the Ryzen 7 7745HX, Core i7-13705H and other higher-end x86 processors released in 2023 and 2024.

iPad Pros come with no active cooling solution however Mac minis and MacBook Pros do have one and the latest iMacs probably do as well. As our Fall 2024 Mac mini review shows, the M4's short-term performance doesn't benefit much from the presence of a fan, however its sustained performance benefits tremendously.

Graphics

The M4 GPU (10 cores) has hardware support for ray tracing as well as mesh shading and other modern technologies. It supports external displays with resolutions as high as 8K.

The graphics adapter runs at higher clock speeds than what the (otherwise identical) 10-core GPU built into the 9-core M4 can muster. As our Mac mini 2024 review confirmed, its performance is good enough to run many 2023 and 2024 games at 1080p on low or medium quality settings.

Much like it is with CPU performance, M4-powered iPad Pros will be much slower in long-term GPU-intensive workloads than iMacs, Mac minis and MacBook Pros due to the lack of proper cooling.

Power consumption

This specific M4 chip is found in 2024 iPad Pros, 2024 iMacs, 2024 Mac minis and 2024 MacBook Pros. Within the thin metal cases of the iPads - no active cooling - the chip's sustained power consumption hovers in the 4 W - 5 W area, with short-term peaks of up to 14 W possible. However, Mac minis and MacBook Pros do have an active cooling solution (and the new iMacs probably do, too) meaning the power consumption figures are several times higher. In our Fall 2024 Mac mini review, the SoC consumed 30 W to 40 W when under high loads.

The M4 is built with a "second generation" 3 nm TSMC process which is still cutting-edge as of late 2024.

ModelApple M2Apple M3Apple M4 (10 cores)
SeriesApple M2Apple M3Apple M4
Series: M4
Apple M2 Max2.42 - 3.7 GHz12 / 12 cores48 MB L3
Apple M2 Pro2.42 - 3.5 GHz12 / 12 cores24 MB L3
Apple M2 Pro 10-Core2.42 - 3.7 GHz10 / 10 cores24 MB L3
Apple M2 « 2.42 - 3.48 GHz8 / 8 cores8 MB L3
Apple M3 Max 16-Core2.75 - 4.06 GHz16 / 16 cores
Apple M3 Max 14-Core2.75 - 4.06 GHz14 / 14 cores
Apple M3 Pro 12-Core2.75 - 4.06 GHz12 / 12 cores
Apple M3 Pro 11-Core2.75 - 4.06 GHz11 / 11 cores
Apple M3 « 2.75 - 4.06 GHz8 / 8 cores
Apple M4 Max (16 cores)2.59 - 4.51 GHz16 / 16 cores
Apple M4 Max (14 cores)2.59 - 4.51 GHz14 / 14 cores
Apple M4 Pro (14 cores)2.59 - 4.51 GHz14 / 14 cores
Apple M4 Pro (12 cores)2.59 - 4.51 GHz12 / 12 cores
Apple M4 (10 cores) « 2.89 - 4.46 GHz10 / 10 cores
Apple M4 (9 cores)2.9 - 4.4 GHz9 / 9 cores
Apple M4 (8 cores)2.9 - 4 GHz8 / 8 cores
Clock2424 - 3480 MHz2748 - 4056 MHz2890 - 4464 MHz
L1 Cache2 MB
L2 Cache20 MB4 MB4 MB
L3 Cache8 MB
Cores / Threads8 / 88 / 8
4 x 4.1 GHz Apple M3 P-Core
4 x 2.7 GHz Apple M3 E-Core
10 / 10
4 x 4.5 GHz Apple M4 P-Core
6 x 2.9 GHz Apple M4 E-Core
TDP20 Watt40 Watt
Transistors20000 Million25000 Million28 Million
Technology5 nm3 nm3 nm
FeaturesARMv8 Instruction SetARMv8 Instruction SetUnified Memory LPDDR5X-7500 (120 GB/s), 16-Core Neural Engine, Media Engine (Encoding / Decoding: H.264, HEVC, ProRes, ProRes RAW, AV1 Decoding only)
iGPUApple M2 10-Core GPU ( - 1398 MHz)Apple M3 10-Core GPUApple M4 10-core GPU
ArchitectureARMARMARM
Announced
Manufacturerwww.apple.comwww.apple.com
TDP Turbo PL240 Watt

Benchmarks

Cinebench 2024 - Cinebench 2024 CPU Single Core
100%
M2 +
121 Points (68%)
117%
M3 +
min: 140     avg: 141     median: 141 (79%)     max: 142 Points
min: 173     avg: 174.2     median: 174 (98%)     max: 177 Points
Cinebench 2024 - Cinebench 2024 CPU Multi Core
100%
M2 +
513 Points (10%)
117%
M3 +
min: 576     avg: 622     median: 599.5 (11%)     max: 712 Points
min: 815     avg: 921     median: 958 (18%)     max: 986 Points
Cinebench R23 - Cinebench R23 Multi Core
100%
M2 +
min: 8517     avg: 8654     median: 8667 (8%)     max: 8772 Points
119%
M3 +
min: 10074     avg: 10275     median: 10298 (10%)     max: 10454 Points
min: 12335     avg: 13338     median: 13833 (13%)     max: 13845 Points
Cinebench R23 - Cinebench R23 Single Core
100%
M2 +
min: 1580     avg: 1595     median: 1585 (67%)     max: 1638 Points
120%
M3 +
min: 1900     avg: 1901     median: 1900 (80%)     max: 1904 Points
min: 2165     avg: 2202     median: 2173 (91%)     max: 2269 Points
Cinebench R20 - Cinebench R20 CPU (Single Core)
100%
M2 +
min: 216     avg: 370.8     median: 381 (42%)     max: 446 Points
132%
M3 +
504 Points (55%)
565 Points (62%)
Cinebench R20 - Cinebench R20 CPU (Multi Core)
100%
M2 +
min: 2231     avg: 2325     median: 2324 (6%)     max: 2416 Points
121%
M3 +
2818 Points (7%)
3642 Points (9%)
Cinebench R15 - Cinebench R15 CPU Multi 64 Bit
100%
M2 +
min: 1209.9     avg: 1222     median: 1215 (8%)     max: 1243 Points
123%
M3 +
1499 Points (9%)
min: 1901     avg: 1907     median: 1907 (12%)     max: 1913 Points
Cinebench R15 - Cinebench R15 CPU Single 64 Bit
100%
M2 +
min: 222     avg: 223.8     median: 223 (62%)     max: 229 Points
122%
M3 +
271 Points (75%)
min: 300     avg: 302     median: 302 (84%)     max: 304 Points
Blender - Blender 3.3 Classroom CPU *
100%
M2 +
min: 540     avg: 620     median: 619.5 (8%)     max: 702 Seconds
120%
M3 +
min: 491     avg: 590     median: 517 (7%)     max: 761 Seconds
min: 389     avg: 397     median: 397 (5%)     max: 405 Seconds
Blender - Blender 2.79 BMW27 CPU *
100%
1 M2 +
min: 549     avg: 614     median: 597 (4%)     max: 713 Seconds
121%
1 M3 +
min: 474     avg: 509     median: 494 (3%)     max: 558 Seconds
Geekbench 6.4 - Geekbench 6.4 Single-Core
100%
M2 +
min: 2587     avg: 2609     median: 2599 (65%)     max: 2650 Points
118%
M3 +
min: 2994     avg: 3057     median: 3054 (76%)     max: 3130 Points
min: 3655     avg: 3747     median: 3748.5 (94%)     max: 3838 Points
Geekbench 6.4 - Geekbench 6.4 Multi-Core
100%
M2 +
min: 10034     avg: 10083     median: 10089 (39%)     max: 10120 Points
119%
M3 +
min: 11752     avg: 11921     median: 11966 (46%)     max: 12066 Points
min: 14690     avg: 14978     median: 14987.5 (58%)     max: 15173 Points
Geekbench 5.5 - Geekbench 5.1 - 5.5 64 Bit Single-Core
100%
1 M2 +
min: 1887     avg: 1914     median: 1915.5 (75%)     max: 1953 Points
118%
1 M3 +
min: 1286     avg: 2092     median: 2256 (88%)     max: 2350 Points
Geekbench 5.5 - Geekbench 5.1 - 5.5 64 Bit Multi-Core
100%
1 M2 +
min: 8491     avg: 8812     median: 8956 (16%)     max: 8994 Points
118%
1 M3 +
min: 10402     avg: 10603     median: 10570 (19%)     max: 10774 Points
Mozilla Kraken 1.1 - Kraken 1.1 Total Score *
100%
M2 +
min: 440     avg: 450.1     median: 449.2 (1%)     max: 466.8 ms
124%
M3 +
min: 322.8     avg: 350.3     median: 362.8 (0%)     max: 373.2 ms
min: 262     avg: 277.7     median: 265.4 (0%)     max: 318.8 ms
Octane V2 - Octane V2 Total Score
100%
M2 +
min: 72484     avg: 75019     median: 74878 (57%)     max: 78736 Points
129%
M3 +
min: 92645     avg: 95595     median: 96622 (73%)     max: 98093 Points
min: 105178     avg: 111471     median: 110817 (84%)     max: 118492 Points
WebXPRT 4 - WebXPRT 4 Score
100%
M2 +
min: 223     avg: 237.8     median: 235 (65%)     max: 256 Points
134%
M3 +
min: 313     avg: 314     median: 314 (86%)     max: 315 Points
min: 315     avg: 335     median: 334 (92%)     max: 348 Points
WebXPRT 3 - WebXPRT 3 Score
100%
M2 +
min: 342     avg: 366.5     median: 376 (68%)     max: 387 Points
118%
M3 +
min: 423     avg: 438.7     median: 445 (80%)     max: 448 Points
min: 430     avg: 467.6     median: 478 (86%)     max: 482 Points
Antutu v9 - AnTuTu v9 Total Score
100%
1 M2 +
min: 1257990     avg: 1337360     median: 1337360 (65%)     max: 1416730 Points
Antutu v9 - AnTuTu v9 CPU
100%
1 M2 +
min: 294643     avg: 298254     median: 298254 (74%)     max: 301865 Points
Antutu v10 - AnTuTu v10 Total Score
100%
M2 +
min: 1936540     avg: 1954930     median: 1961470 (65%)     max: 1966790 Points
107%
M3 +
min: 2045290     avg: 2096340     median: 2096340 (70%)     max: 2147390 Points
2716980 Points (90%)
Antutu v10 - AnTuTu v10 CPU
100%
M2 +
min: 535127     avg: 540446     median: 537292 (16%)     max: 548919 Points
103%
M3 +
min: 538633     avg: 555031     median: 555030 (16%)     max: 571428 Points
743583 Points (22%)
PassMark PerformanceTest Mobile V1 - PerformanceTest Mobile V1 CPU Tests
100%
1 M3 +
min: 21270     avg: 21339     median: 21339 (3%)     max: 21408 Points
CrossMark - CrossMark Overall
100%
M2 +
min: 1437     avg: 1515     median: 1507 (56%)     max: 1585 Points
123%
M3 +
min: 1847     avg: 1850     median: 1847 (69%)     max: 1857 Points
min: 1944     avg: 2015     median: 2038 (76%)     max: 2066 Points
Power Consumption - Cinebench R15 Multi Power Consumption - external Monitor *
100%
1 M2 +
29 Watt (5%)
Power Consumption - Geekbench 5.5 Power Consumption 150cd *
100%
1 M2 +
min: 6.86     avg: 8.3     median: 8.4 (4%)     max: 9.71 Watt
106%
1 M3 +
min: 7.79     avg: 7.9     median: 7.9 (3%)     max: 8.01 Watt
6.8 Watt (3%)
Power Consumption - Idle Power Consumption - external Monitor *
100%
1 M2 +
min: 2.03     avg: 2.6     median: 2.4 (2%)     max: 3.98 Watt
87%
1 M3 +
min: 2.63     avg: 2.8     median: 2.8 (2%)     max: 2.87 Watt
min: 2.68     avg: 3.1     median: 2.8 (2%)     max: 4.09 Watt
Power Consumption - Idle Power Consumption 150cd 1min *
100%
1 M2 +
min: 1.631     avg: 3.5     median: 3.6 (4%)     max: 5.32 Watt
92%
1 M3 +
min: 2.6     avg: 3.7     median: 3.9 (4%)     max: 4.7 Watt
min: 2.68     avg: 3.9     median: 4.1 (5%)     max: 4.76 Watt
Power Consumption - Power Efficiency - Cinebench R15 Multi external Monitor
100%
1 M2 +
42.4 Points per Watt (32%)

Average Benchmarks Apple M2 → 100% n=18

Average Benchmarks Apple M3 → 120% n=18

Average Benchmarks Apple M4 (10 cores) → 148% n=18

- Range of benchmark values for this graphics card
red legend - Average benchmark values for this graphics card
* Smaller numbers mean a higher performance
1 This benchmark is not used for the average calculation

v1.33
log 31. 05:38:46

#0 ran 0s before starting gpusingle class +0s ... 0s

#1 checking url part for id 14521 +0s ... 0s

#2 checking url part for id 15110 +0s ... 0s

#3 checking url part for id 17538 +0s ... 0s

#4 redirected to Ajax server, took 1753933126s time from redirect:0 +0s ... 0s

#5 did not recreate cache, as it is less than 5 days old! Created at Thu, 31 Jul 2025 05:18:39 +0200 +0s ... 0s

#6 composed specs +0.01s ... 0.01s

#7 did output specs +0s ... 0.011s

#8 getting avg benchmarks for device 14521 +0.001s ... 0.011s

#9 got single benchmarks 14521 +0.009s ... 0.02s

#10 getting avg benchmarks for device 15110 +0.001s ... 0.021s

#11 got single benchmarks 15110 +0.007s ... 0.028s

#12 getting avg benchmarks for device 17538 +0.001s ... 0.028s

#13 got single benchmarks 17538 +0.006s ... 0.034s

#14 got avg benchmarks for devices +0s ... 0.034s

#15 min, max, avg, median took s +0.029s ... 0.064s

#16 return log +0s ... 0.064s

Please share our article, every link counts!
Mail Logo
> Expert Reviews and News on Laptops, Smartphones and Tech Innovations > Benchmarks / Tech > Processor Comparison - Head 2 Head
Redaktion, 2017-09- 8 (Update: 2023-07- 1)