

Apple M2 10-Core GPU vs Apple M1 7-Core GPU vs Apple M1 8-Core GPU
Apple M2 10-Core GPU
► remove from comparison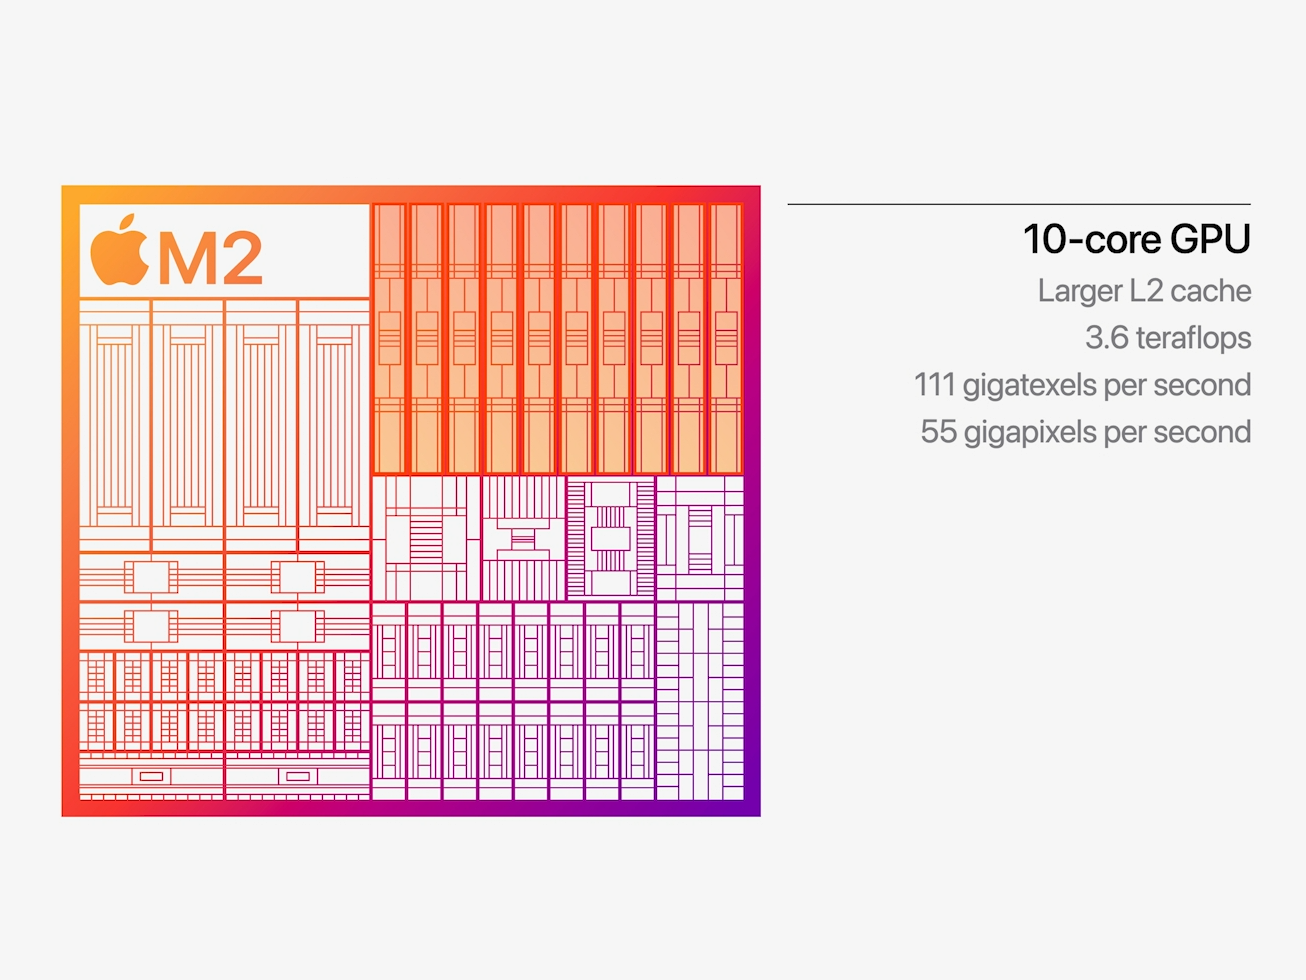
The Apple M2 GPU is an integrated graphics card offering 10 cores designed by Apple and integrated in the Apple M2 SoC. It uses the unified memory architecture of the M2 SoC (up to 24 GB LPDDR5-6400 with 100 GB/s bandwidth) and should offer 160 execution units.
According to Apple it offers a 25% higher performance at slightly higher power consumption. The theoretical performance is rated at 3.6 Teraflops and therefore 1 TFLOP higher than the M1 8-core GPU. In our benchmarks, the GPU was able to top the M1 with up to 40%, but still stays behind the 14-core GPU in the M1 Pro. Compared to other iGPUs from AMD and Intel, the M2 benefits greatly from the unified memory architecture and the high bandwidth.
The M2 chip is manufactured in the second generation 5nm process at TSMC (most likely N5P). The power consumption is around 13.5 Watt (in our tests under load of the MBP13) and up to 15W according to Apple.
Apple M1 7-Core GPU
► remove from comparison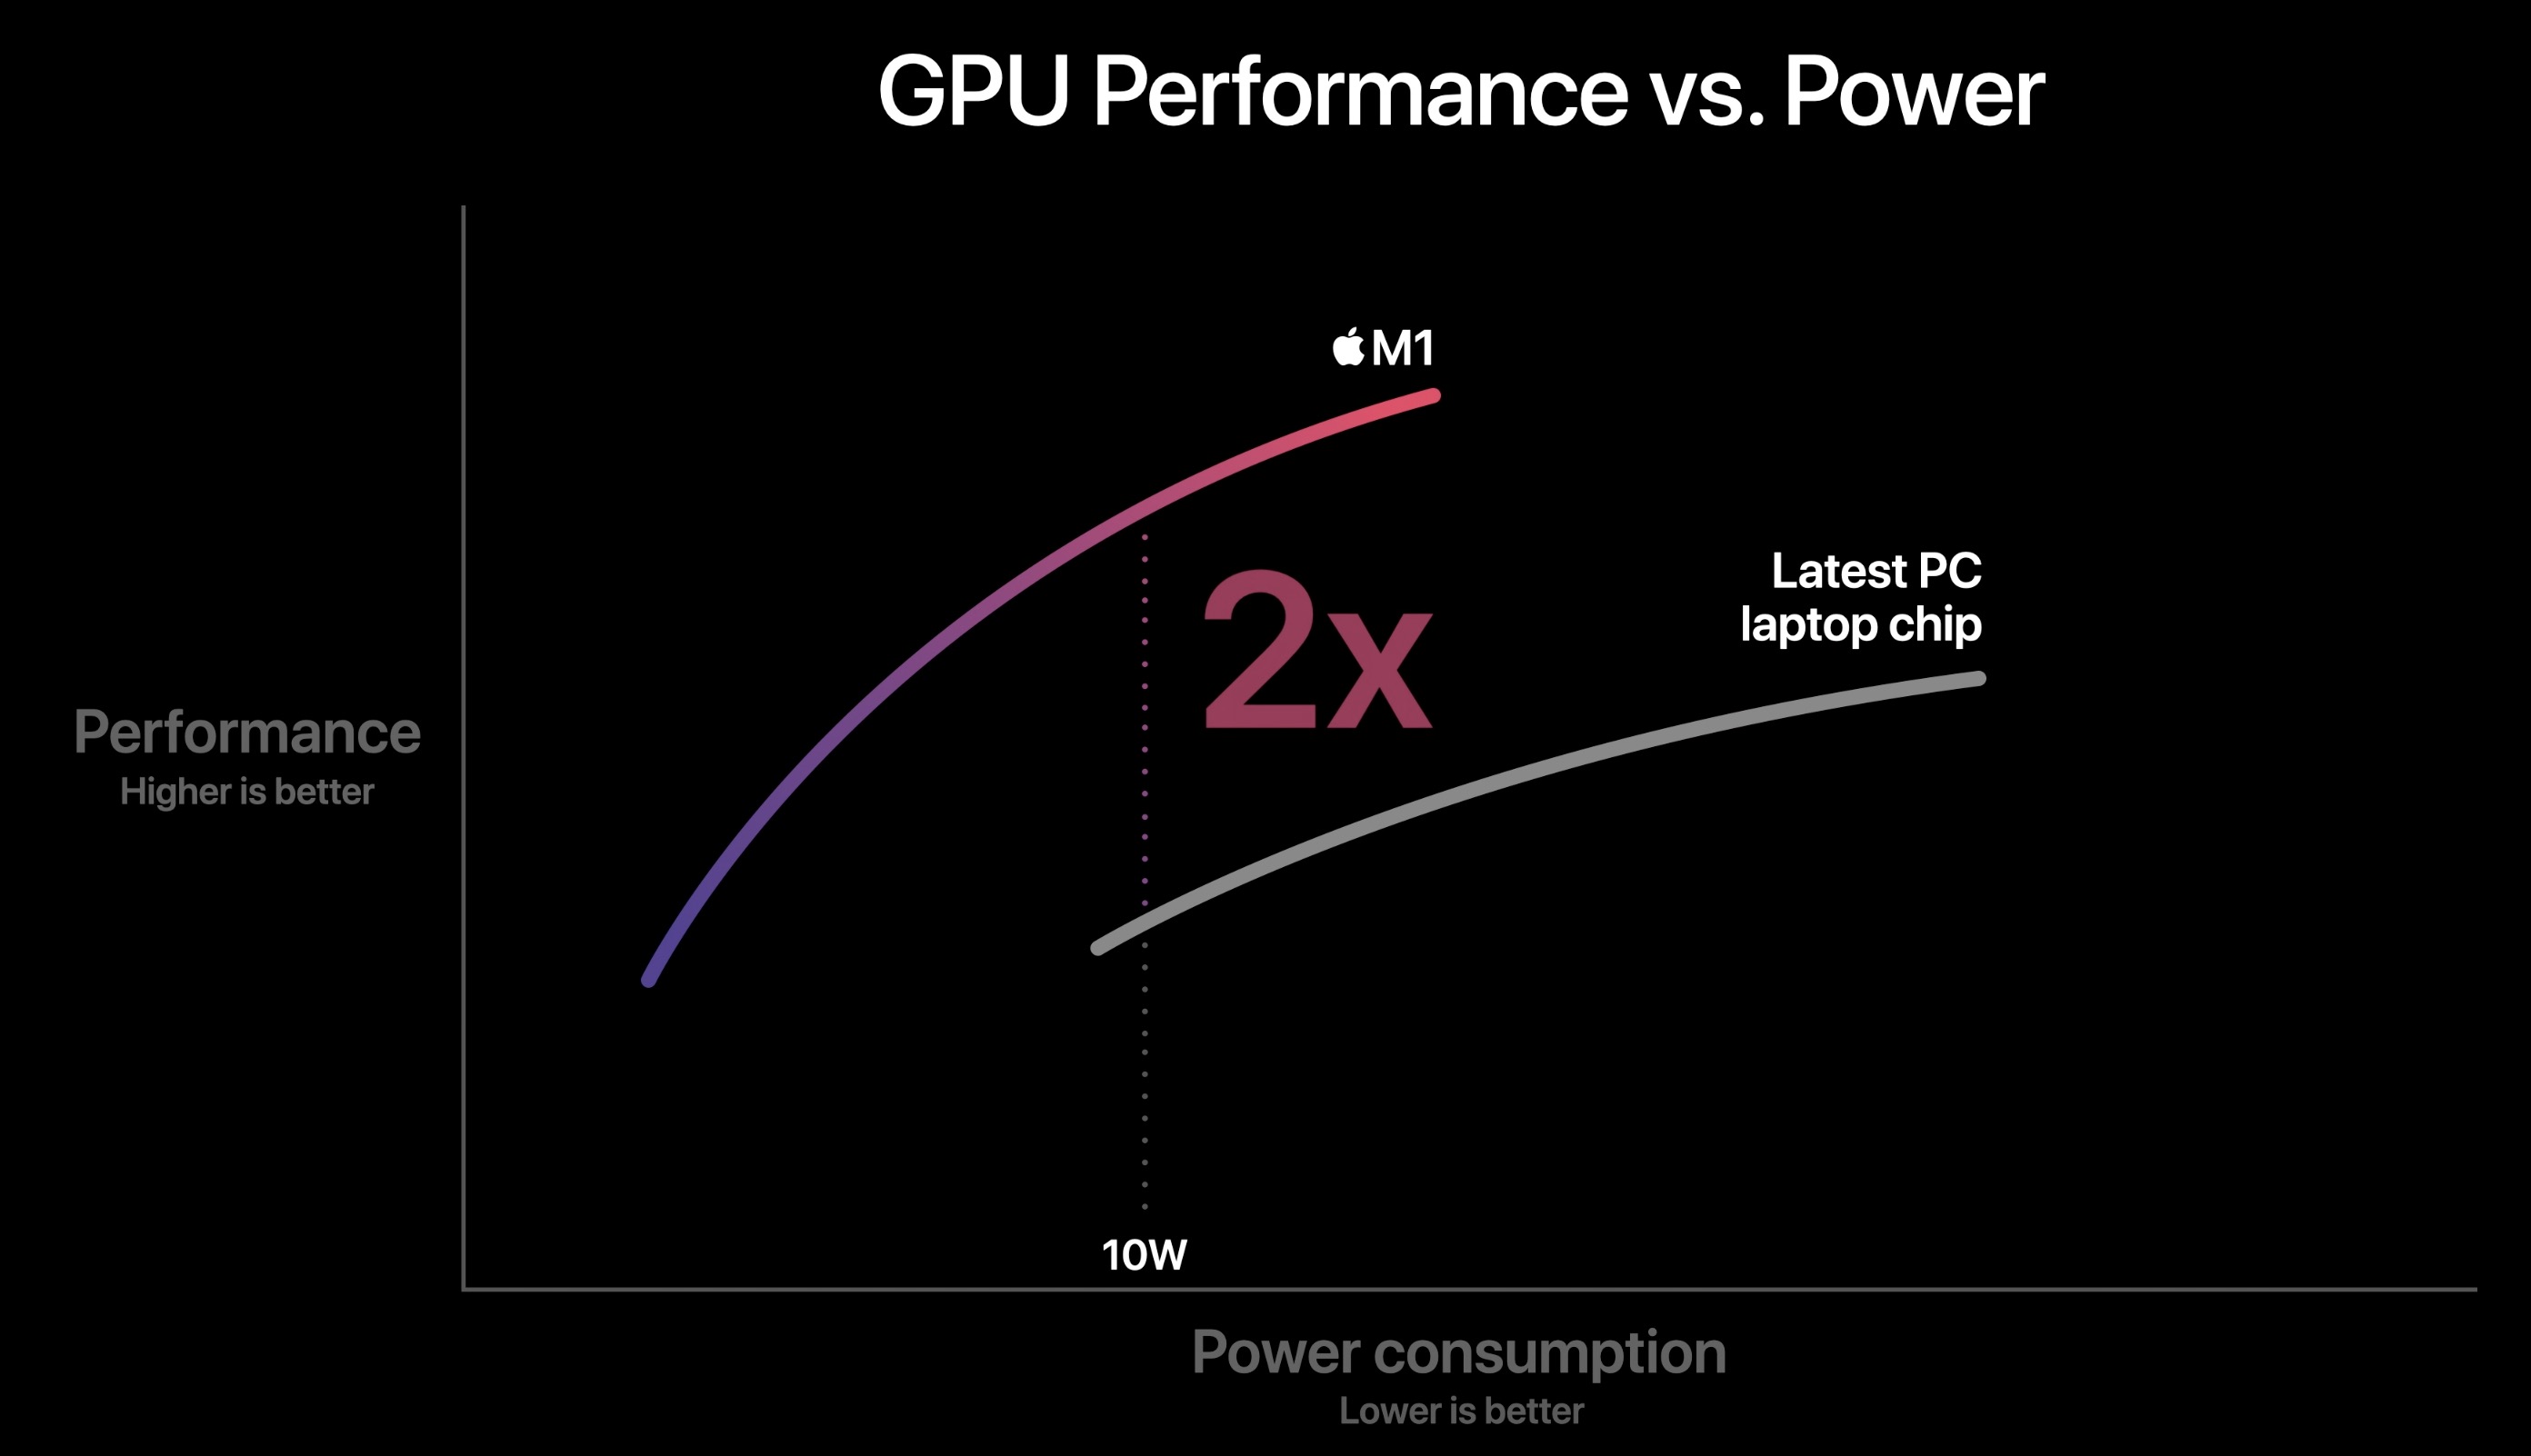
The Apple M1 GPU is an integrated graphics card offering 7 cores (1 deactivated core in the entry MacBook Air) designed by Apple and integrated in the Apple M1 SoC. According to Apple it is faster and more energy efficient as competing products (like the Tiger Lake Xe GPU). The peak performance of the high end variant with 8 cores is 2.6 teraflops, therefore the 7 core version should offer around 2.3 teraflops. Thanks to the unified memory architecture it should have fast access to the RAM.
The Apple M1 is manufactured in the modern 5nm process at TSMC and should offer an excellent energy efficiency.
Apple M1 8-Core GPU
► remove from comparisonThe Apple M1 GPU is an integrated graphics card offering 8 cores (1 deactivated core in the entry MacBook Air) designed by Apple and integrated in the Apple M1 SoC. According to Apple it is faster and more energy efficient as competing products (like the Tiger Lake Xe GPU). The peak performance of the high end variant is 2.6 teraflops and thanks to the unified memory architecture it should have fast access to the RAM.
The Apple M1 is manufactured in the modern 5nm process at TSMC and should offer an excellent energy efficiency. According to internal tools, the M1 GPU uses under load approximately 10 Watt (11.5 Watt package power including the RAM).
| Apple M2 10-Core GPU | Apple M1 7-Core GPU | Apple M1 8-Core GPU | |||||||||||||||||||||||||||||||||||||||||||||||||||||||
| Apple M1 Series |
|
|
| ||||||||||||||||||||||||||||||||||||||||||||||||||||||
| Pipelines | 10 - unified | 7 - unified | 8 - unified | ||||||||||||||||||||||||||||||||||||||||||||||||||||||
| Core Speed | 1398 (Boost) MHz | 1278 MHz | 1278 MHz | ||||||||||||||||||||||||||||||||||||||||||||||||||||||
| Memory Type | LPDDR5-6400 | LPDDR4X-4266 | LPDDR4X-4266 | ||||||||||||||||||||||||||||||||||||||||||||||||||||||
| Shared Memory | no | no | no | ||||||||||||||||||||||||||||||||||||||||||||||||||||||
| Power Consumption | 15 Watt | 10 Watt | |||||||||||||||||||||||||||||||||||||||||||||||||||||||
| technology | 5 nm | 5 nm | 5 nm | ||||||||||||||||||||||||||||||||||||||||||||||||||||||
| Date of Announcement | 06.06.2022 | 10.11.2020 | 10.11.2020 | ||||||||||||||||||||||||||||||||||||||||||||||||||||||
| Predecessor | M1 8-Core GPU | ||||||||||||||||||||||||||||||||||||||||||||||||||||||||
| Theoretical Performance | 2.6 TFLOPS FP32 |
|
| |||||||||||||||||
Benchmarks
Cinebench R15 OpenGL 64 Bit + Apple M2 10-Core GPU
GFXBench T-Rex HD Offscreen C24Z16 + Apple M2 10-Core GPU
Average Benchmarks Apple M2 10-Core GPU → 100% n=10
Average Benchmarks Apple M1 7-Core GPU → 73% n=10
Average Benchmarks Apple M1 8-Core GPU → 75% n=10
* Smaller numbers mean a higher performance
1 This benchmark is not used for the average calculation
Game Benchmarks
The following benchmarks stem from our benchmarks of review laptops. The performance depends on the used graphics memory, clock rate, processor, system settings, drivers, and operating systems. So the results don't have to be representative for all laptops with this GPU. For detailed information on the benchmark results, click on the fps number.

Diablo Immortal
2022
League of Legends: Wild Rift
2020
Call of Duty Mobile
2020


Hearthstone
2020
Borderlands 3
2019


PUBG Mobile
2018World of Tanks Blitz
2018
F1 2017
2017
Civilization 6
2016

The Witcher 3
2015
Asphalt 8: Airborne
2013
Asphalt 9: Legends
2013Counter-Strike: GO
2012
Batman: Arkham City
2011Average Gaming Apple M2 10-Core GPU → 100%
Average Gaming 30-70 fps → 100%
Average Gaming Apple M1 7-Core GPU → 72%
Average Gaming 30-70 fps → 76%
Average Gaming Apple M1 8-Core GPU → 88%
Average Gaming 30-70 fps → 91%
| Apple M2 10-Core GPU | Apple M1 7-Core GPU | Apple M1 8-Core GPU | |||||||||||||||||||
|---|---|---|---|---|---|---|---|---|---|---|---|---|---|---|---|---|---|---|---|---|---|
| low | med. | high | ultra | QHD | 4K | low | med. | high | ultra | QHD | 4K | low | med. | high | ultra | QHD | 4K | ||||
| Diablo Immortal | 59.3 | ||||||||||||||||||||
| Call of Duty Mobile | 118.8 | 58.5 | 60 | 60 | |||||||||||||||||
| Genshin Impact | 65 | 60 | |||||||||||||||||||
| Armajet | 118.4 | 60 | |||||||||||||||||||
| Borderlands 3 | 64 | 35 | 25 | 16 | 45.2 | 28 | 17.7 | 48 | 29 | 20 | |||||||||||
| Total War: Three Kingdoms | 113 | 44 | 27 | 19 | 95.2 | 26.3 | 17.4 | 98 | 35 | 22 | 15 | ||||||||||
| Shadow of the Tomb Raider | 79 | 35 | 31 | 27 | 20 | 65 | 22 | 69 | 32 | 30 | 38 | ||||||||||
| PUBG Mobile | 39.8 | 39 | 40 | 42 | |||||||||||||||||
| The Witcher 3 | 34 | 28 | |||||||||||||||||||
| Asphalt 8: Airborne | 67.7 | ||||||||||||||||||||
| Asphalt 9: Legends | 44.2 | ||||||||||||||||||||
| Apple M2 10-Core GPU | Apple M1 7-Core GPU | Apple M1 8-Core GPU | |||||||||||||||||||
| low | med. | high | ultra | QHD | 4K | low | med. | high | ultra | QHD | 4K | low | med. | high | ultra | QHD | 4K | < 30 fps < 60 fps < 120 fps ≥ 120 fps | 4 | 3 | 2 4 2 | 4 2 1 | 1 | | < 30 fps < 60 fps < 120 fps ≥ 120 fps | 1 2 | 3 | 2 | | | | < 30 fps < 60 fps < 120 fps ≥ 120 fps | 2 2 | 1 2 | 2 2 2 | 1 2 2 | | |
For more games that might be playable and a list of all games and graphics cards visit our Gaming List