
Intel Core Ultra 9 285K VS AMD Ryzen 9 9950X3D
Bogdan Solca 👁 Published 🇷🇺 🇫🇷 ...
Verdict
One year after the Intel Arrow Lake-S launch, the Core Ultra 9 285K sees noticeable performance improvements without affecting power efficiency. Are these improvements enough to make it a worthy opponent for the AMD Ryzen 9 9950X3D, considering at launch, the Core Ultra 9 285K could not even beat the previous gen i9-14900K? It looks like they are, according to our latest tests. While the Intel CPU still lags behind overall, it definitely caught up to the point where most differences amount to single-digit percentages.
The Ryzen 9 9950X3D is still considerably faster in heavy compute loads as demonstrated by the AIDA64 tests, and proves to be more suitable for gaming scenarios especially where Nvidia DLSS shenanigans are not activated. However, synthetic 3D rendering benchmarks show that the two competitors should be much closer to each other.
On the Intel side, the Core Ultra 9 285K keeps its power efficiency crown in most scenarios including gaming. Despite the increased RAM bandwidth, heavy compute loads are still slower compared to the AMD competition, but real world productivity and content creation scenarios continue to favor Intel. The gaming situation is definitely better compared to what it used to be one year ago, as the Core Ultra 9 285K now lags behind the 9950X3D by single-digit margins, and even manages to win in some cases where Nvidia DLSS is enabled. SSD performance is also slightly better on the Team Blue side.
When it first launched in late October 2024, the Intel Core Ultra 9 285K was praised for its power efficiency improvements, yet the performance uplift over the previous gen i9-14900K was almost non-existent, even looking like a downgrade in gaming scenarios. Over the course of 2025, Intel has released quite a few microcode improvements, which translated into ~9% performance increase and better power efficiency in Linux. Is this true for Windows, as well? This is the question that inspired this test. Due to the GPU differences between our original test system (RTX 4090) and the XMG systems used for this test (RTX 5090), 3D rendering performance including games was not be explored.
We decided to pit the Core Ultra 9 285K against AMD’s Ryzen 9 9950X3D, as they represent the pinnacle for the current desktop generation from both companies. Granted, the two models are not in the same price bracket (the Intel CPU costs $100 less) and the core configuration differs. Nonetheless, the Ryzen 9 9950X3D has received some stability updates since its launch in March 2025 as well, so a retest seemed appropriate.
Testing platforms
This test was made possible thanks to our friends at XMG / Schenker who provided both test systems that are based on their Trinity X models. Specs and pricing for the XMG Trinity X - Intel and the XMG Trinity X - AMD systems can be found on Bestware.
With the exception of the motherboards and obviously the CPUs, the two PC builds were designed to resemble each other as much as possible in order to strictly focus on CPU performance differences. As such, both systems feature an Asus TUF Gaming RTX 5090 GPU, 64 GB DDR5-6000 CL 30 from Corsair, a 2 TB Samsung 9100 Pro PCIe 5.0 NVMe SSD, the same Corsair iCUE Link Titan 360 RX AIO cooler, same Be Quiet! case fans, the same Corsair RM1000e PSU and finally the same HAVN HS 420 case (black and white variants).
Both systems were tested on Windows 11 25H2 with the latest security updates. Additionally, the High Performance power profile was activated, and both systems had the latest BIOS and chipset drivers installed. We are aware that AMD may still recommend the Balanced power profile for games mostly, but it made sense to choose the High Performance profile for both systems especially given the substantial number of synthetic benchmarks.
Compute performance
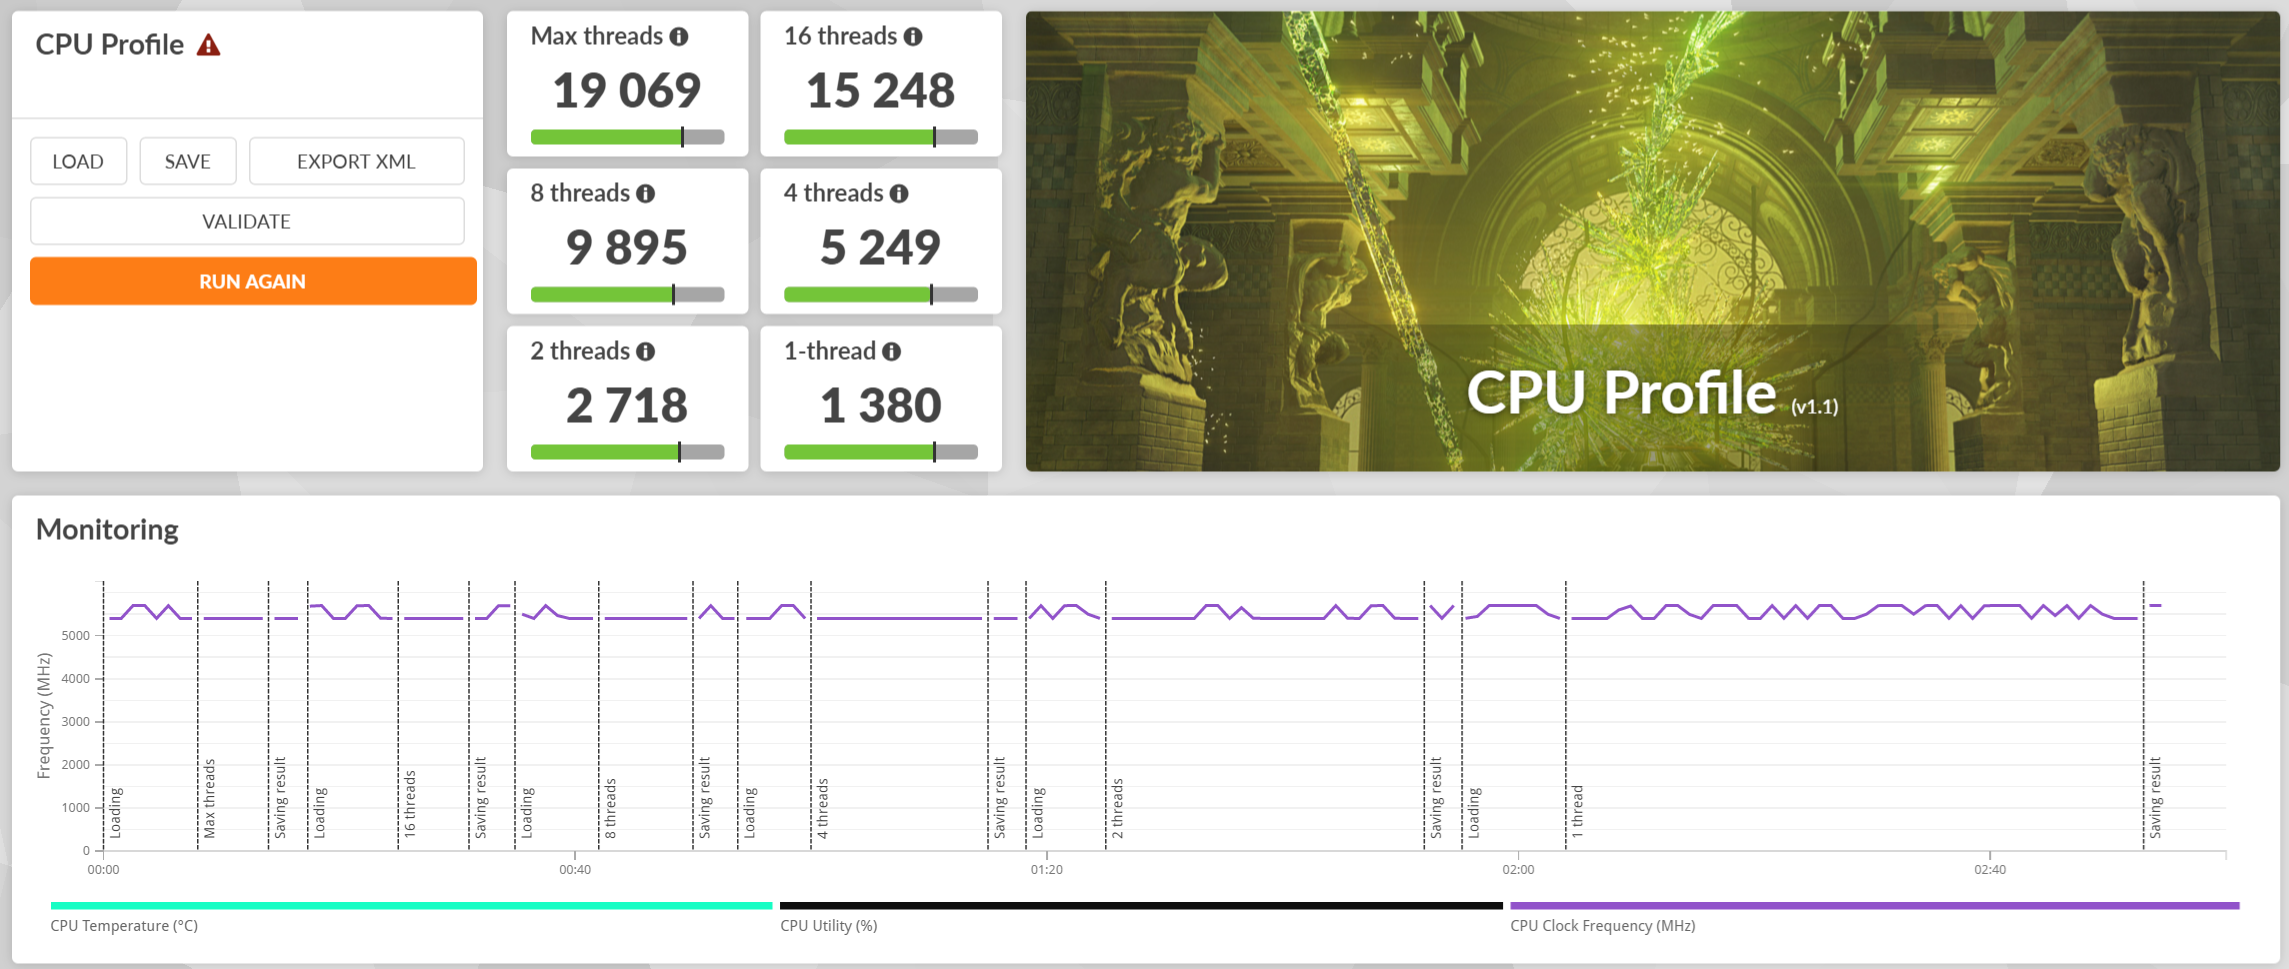
Despite not exactly comparing apples to apples, as the Intel Core Ultra 9 285K integrates a hybrid core cluster with 24 cores and no hyperthreading and the AMD Ryzen 9 9950X3D features 16 cores, the two processors trade blows in most workloads. We can see the latest Intel microcode offers noticeably better performance in GeekBench 6.5 multi-core (6% boost) and PCMark 10 (5% boost in Digital Content / 61% boost in Productivity / 4% boost in Essentials) over the initial microcode, but the two versions are mostly on par otherwise.
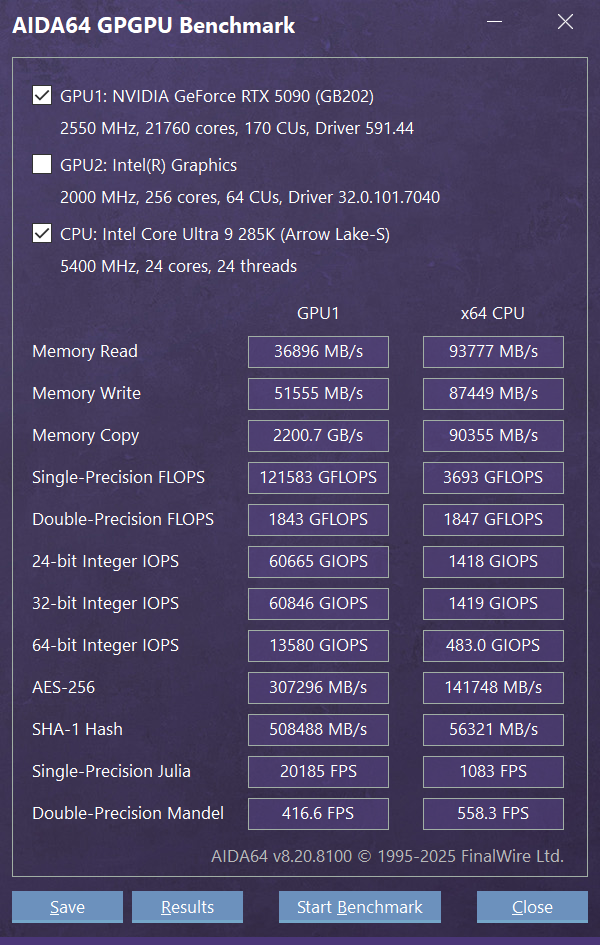
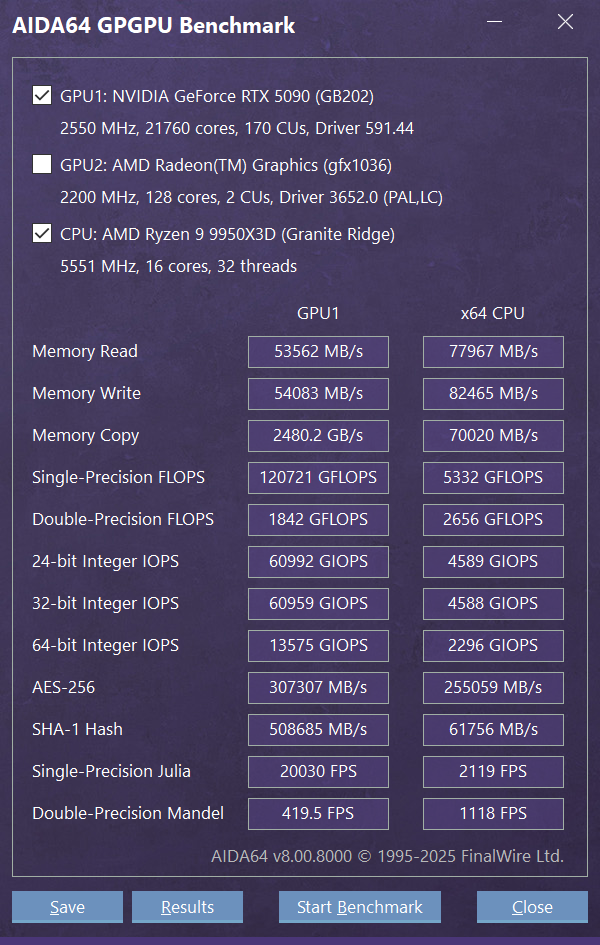
On the AMD side, the Ryzen 9 9950X3D dominates the AIDA CPU tests, even though the RAM Read and Copy speeds are 15-20% slower compared to the Intel platform. There are some notable gains on the latest revision code in the FPU Julia and Mandel AIDA tests, but overall the improvements are in the single digits over the original revision.


| PassMark PerformanceTest V11 - Passmark Rating 11.1 (sort by value) | |
| XMG Trinity X - AMD Ryzen 9 9950X3D | |
| XMG Trinity X - Intel Core Ultra 9 285K | |
* ... smaller is better
Storage performance
While both systems support PCIe 5.0 SSDs, it looks like the Intel motherboard is somehow limiting the PCIe 5.0 X4 slot as CrystalDiskMark reports that the maximum read speed reaches just above 12 GB/s instead of 14 GB/s. This limitation does not prove to be a problem in tests simulating real world use cases, however. In fact, the Intel system is 13% faster in the 3DMark storage test and 4% faster in the DirectStorage test.


| 3DMark | |
| Storage Score | |
| XMG Trinity X - Intel | |
| XMG Trinity X - AMD | |
| DirectStorage | |
| XMG Trinity X - Intel | |
| XMG Trinity X - AMD | |
3D rendering performance
Analyzing the most popular tests in the 3DMark suite, we see the two systems going neck and neck in 4K tests like Steel Nomad and Time Spy Extreme, as well as in the 1440p Speed Way test. On the other hand, the Intel system is dominating the Port Royal and Time Spy 1440p tests with performance gaps of up to 29%.
In SpecViewPerf 15, the two systems trade blows, but AMD has a slight edge.
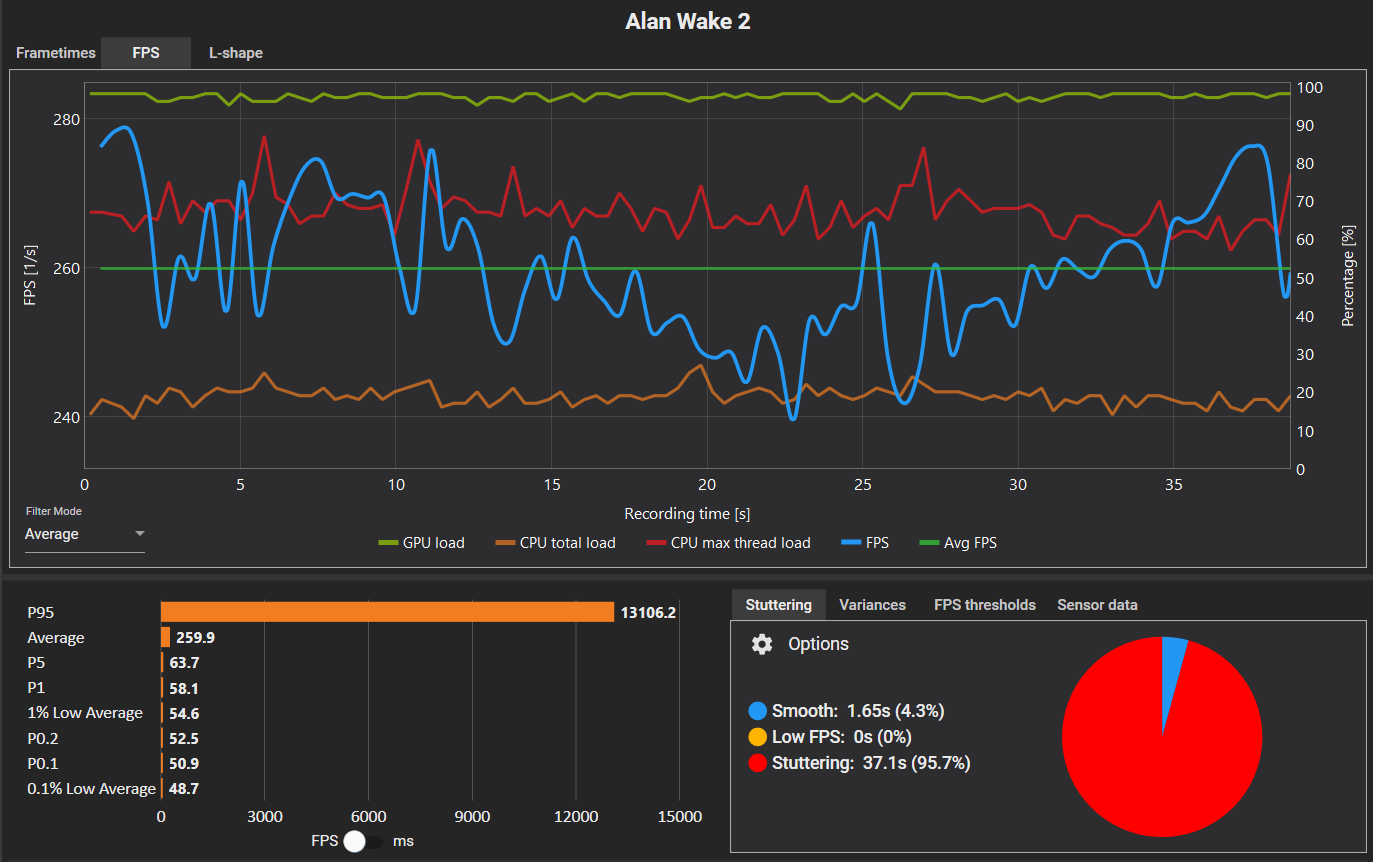
For 4K non-DLSS gaming with all other settings on maximum, the AMD system is leading in 6 of the 8 titles although only by a small margin, with the exception of Cyberpunk 2077 where the AMD's system RTX 5090 somehow recorded almost double the performance of the Intel platform's RTX 5090. When DLSS Quality and frame generation are enabled along with path tracing and ray reconstruction wherever available, the situation is more balanced as the two systems each win in 4 titles. Two titles stand out here: in Alan Wake 2, the Intel platform is 56.85% faster, while the AMD one is 81.83% faster in Cyberpunk 2077. Otherwise the differences are in single digits.
Generative AI capabilities were also tested with ComfyUI and Wan 2.2 image-to-video. The RTX 5090 paired with either of the CPUs was able to render a 10 second mp4 video with different resolutions as follows:
- 480 x 704 in 5 minutes
- 672 x 992 in 7 minutes 28 seconds
- 800 x 1152 in 10 minutes 55 seconds
| 3DMark / Port Royal Graphics | |
| XMG Trinity X - Intel | |
| XMG Trinity X - AMD | |
| 3DMark / Speed Way Score | |
| XMG Trinity X - AMD | |
| XMG Trinity X - Intel | |
| 3DMark / Steel Nomad Score | |
| XMG Trinity X - Intel | |
| XMG Trinity X - AMD | |
| 3DMark / Time Spy Score | |
| XMG Trinity X - Intel | |
| XMG Trinity X - AMD | |
| 3DMark / Time Spy Graphics | |
| XMG Trinity X - Intel | |
| XMG Trinity X - AMD | |
| 3DMark / Time Spy CPU | |
| XMG Trinity X - Intel | |
| XMG Trinity X - AMD | |
| 3DMark / Time Spy Extreme Score | |
| XMG Trinity X - AMD | |
| XMG Trinity X - Intel | |
| 3DMark / Time Spy Extreme Graphics | |
| XMG Trinity X - AMD | |
| XMG Trinity X - Intel | |
| 3DMark / Time Spy Extreme CPU | |
| XMG Trinity X - Intel | |
| XMG Trinity X - AMD | |
| SPECviewperf 15 / 3ds Max 2023 (3dsmax-08) | |
| XMG Trinity X - AMD | |
| XMG Trinity X - Intel | |
| SPECviewperf 15 / Blender 3.6 (blender-01) | |
| XMG Trinity X - Intel | |
| XMG Trinity X - AMD | |
| SPECviewperf 15 / Catia V5 (catia-07) | |
| XMG Trinity X - AMD | |
| XMG Trinity X - Intel | |
| SPECviewperf 15 / Creo 9 (creo-04) | |
| XMG Trinity X - AMD | |
| XMG Trinity X - Intel | |
| SPECviewperf 15 / OpendTect (energy-04) | |
| XMG Trinity X - Intel | |
| XMG Trinity X - AMD | |
| SPECviewperf 15 / Enscape 4.0 (enscape-01) | |
| XMG Trinity X - AMD | |
| XMG Trinity X - Intel | |
| SPECviewperf 15 / Maya 2025 (maya-07) | |
| XMG Trinity X - AMD | |
| XMG Trinity X - Intel | |
| SPECviewperf 15 / Tuvok (medical-04) | |
| XMG Trinity X - Intel | |
| XMG Trinity X - AMD | |
| SPECviewperf 15 / Solidworks 2024 (solidworks-08) | |
| XMG Trinity X - AMD | |
| XMG Trinity X - Intel | |
| SPECviewperf 15 / Unreal Engine 5.4.2 (unreal_engine-01) | |
| XMG Trinity X - AMD | |
| XMG Trinity X - Intel | |
Gaming performance
Alan Wake 2


Black Myth: Wukong


Cyberpunk 2077


Doom - The Dark Ages


Forza Horizon 5


Red Dead Redemption 2


S.T.A.L.K.E.R. 2 - Heart of Chernobyl


The Last of Us Part I


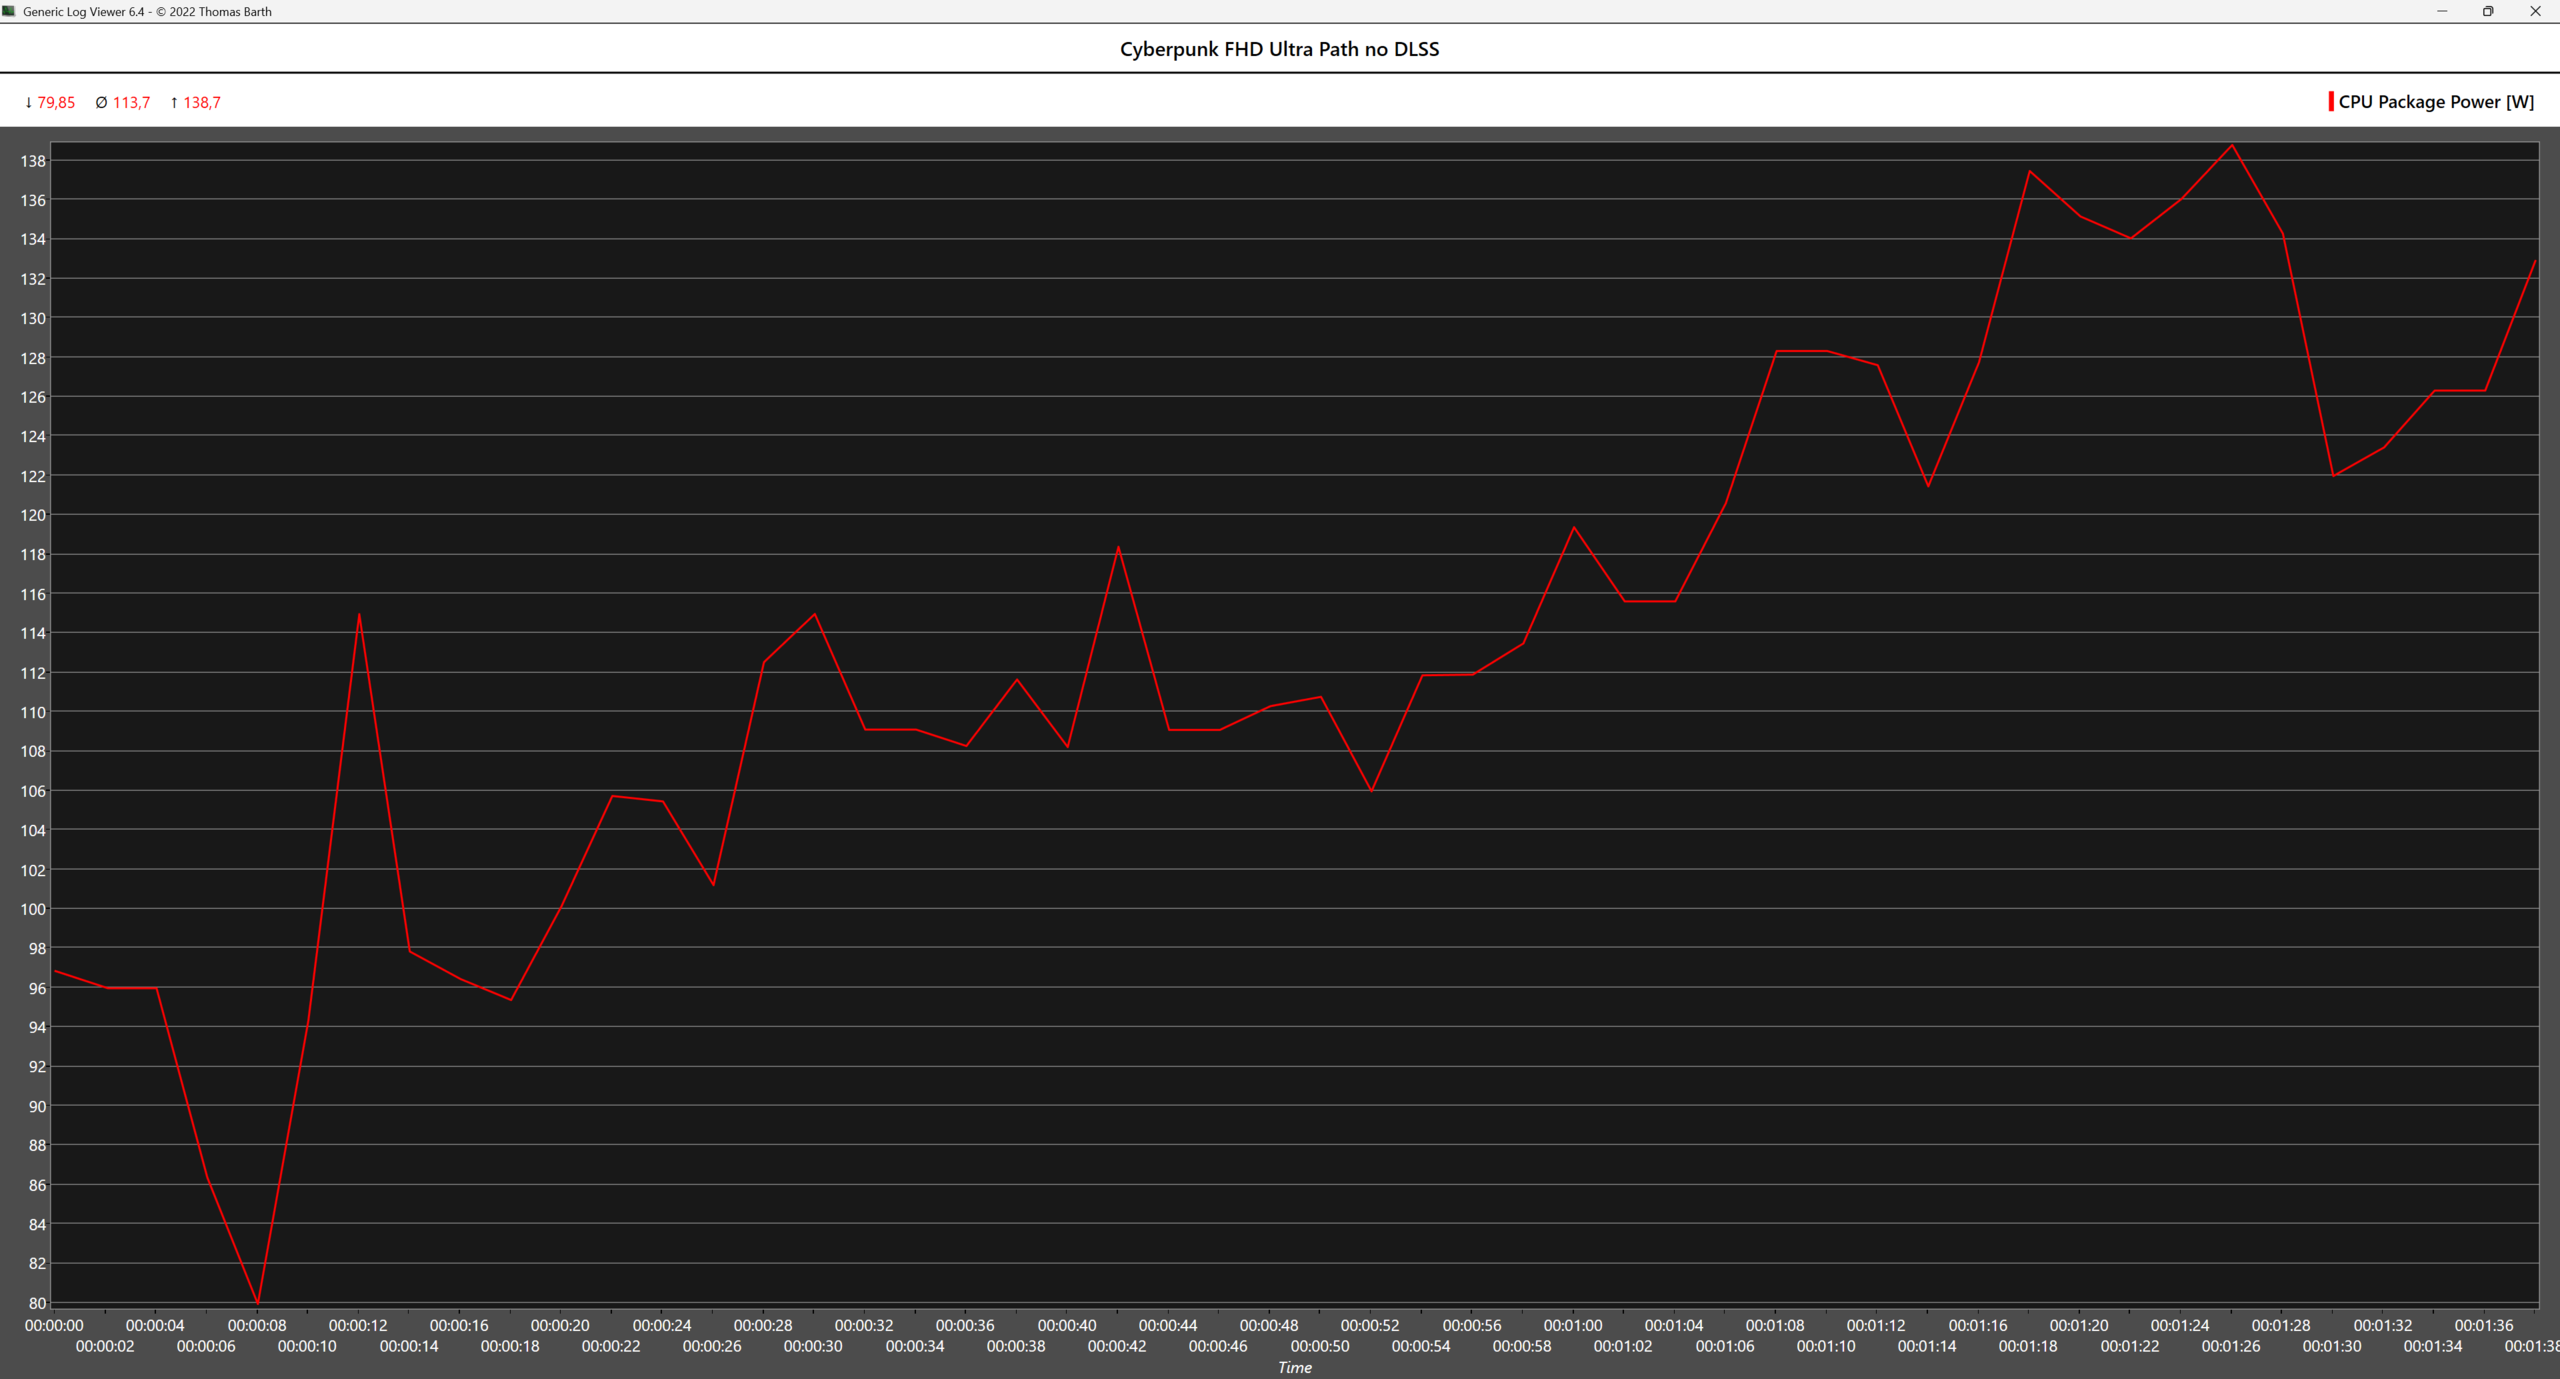
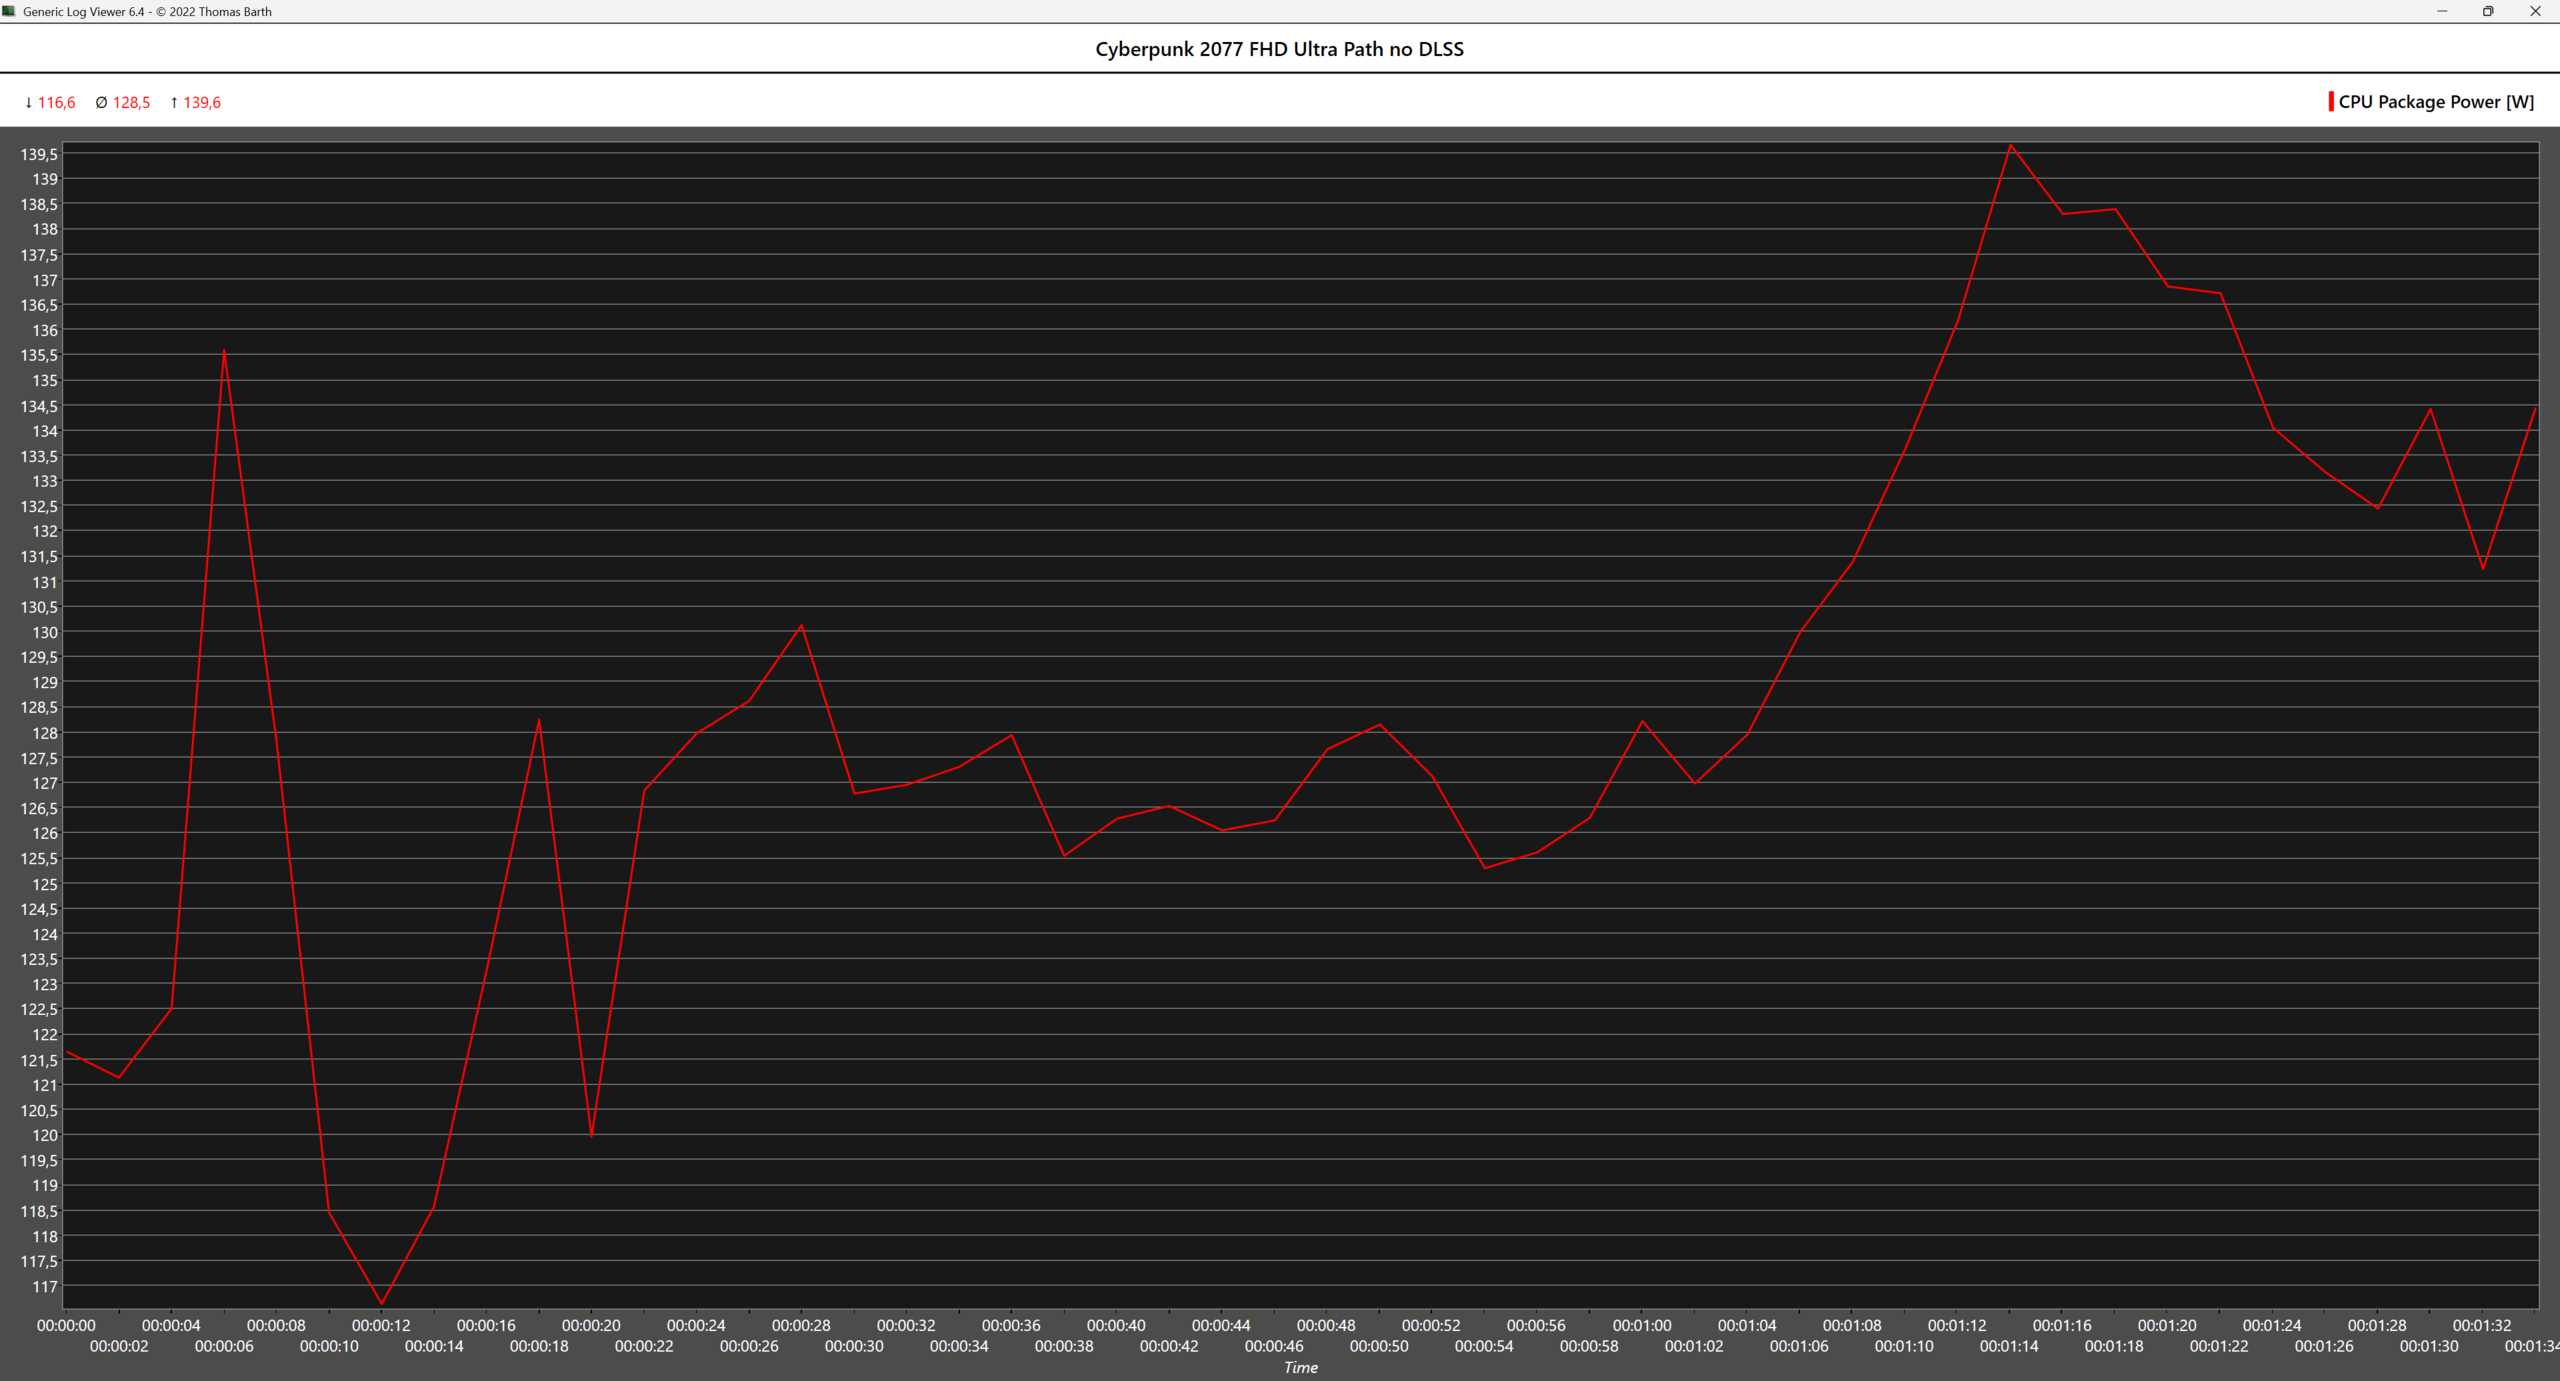
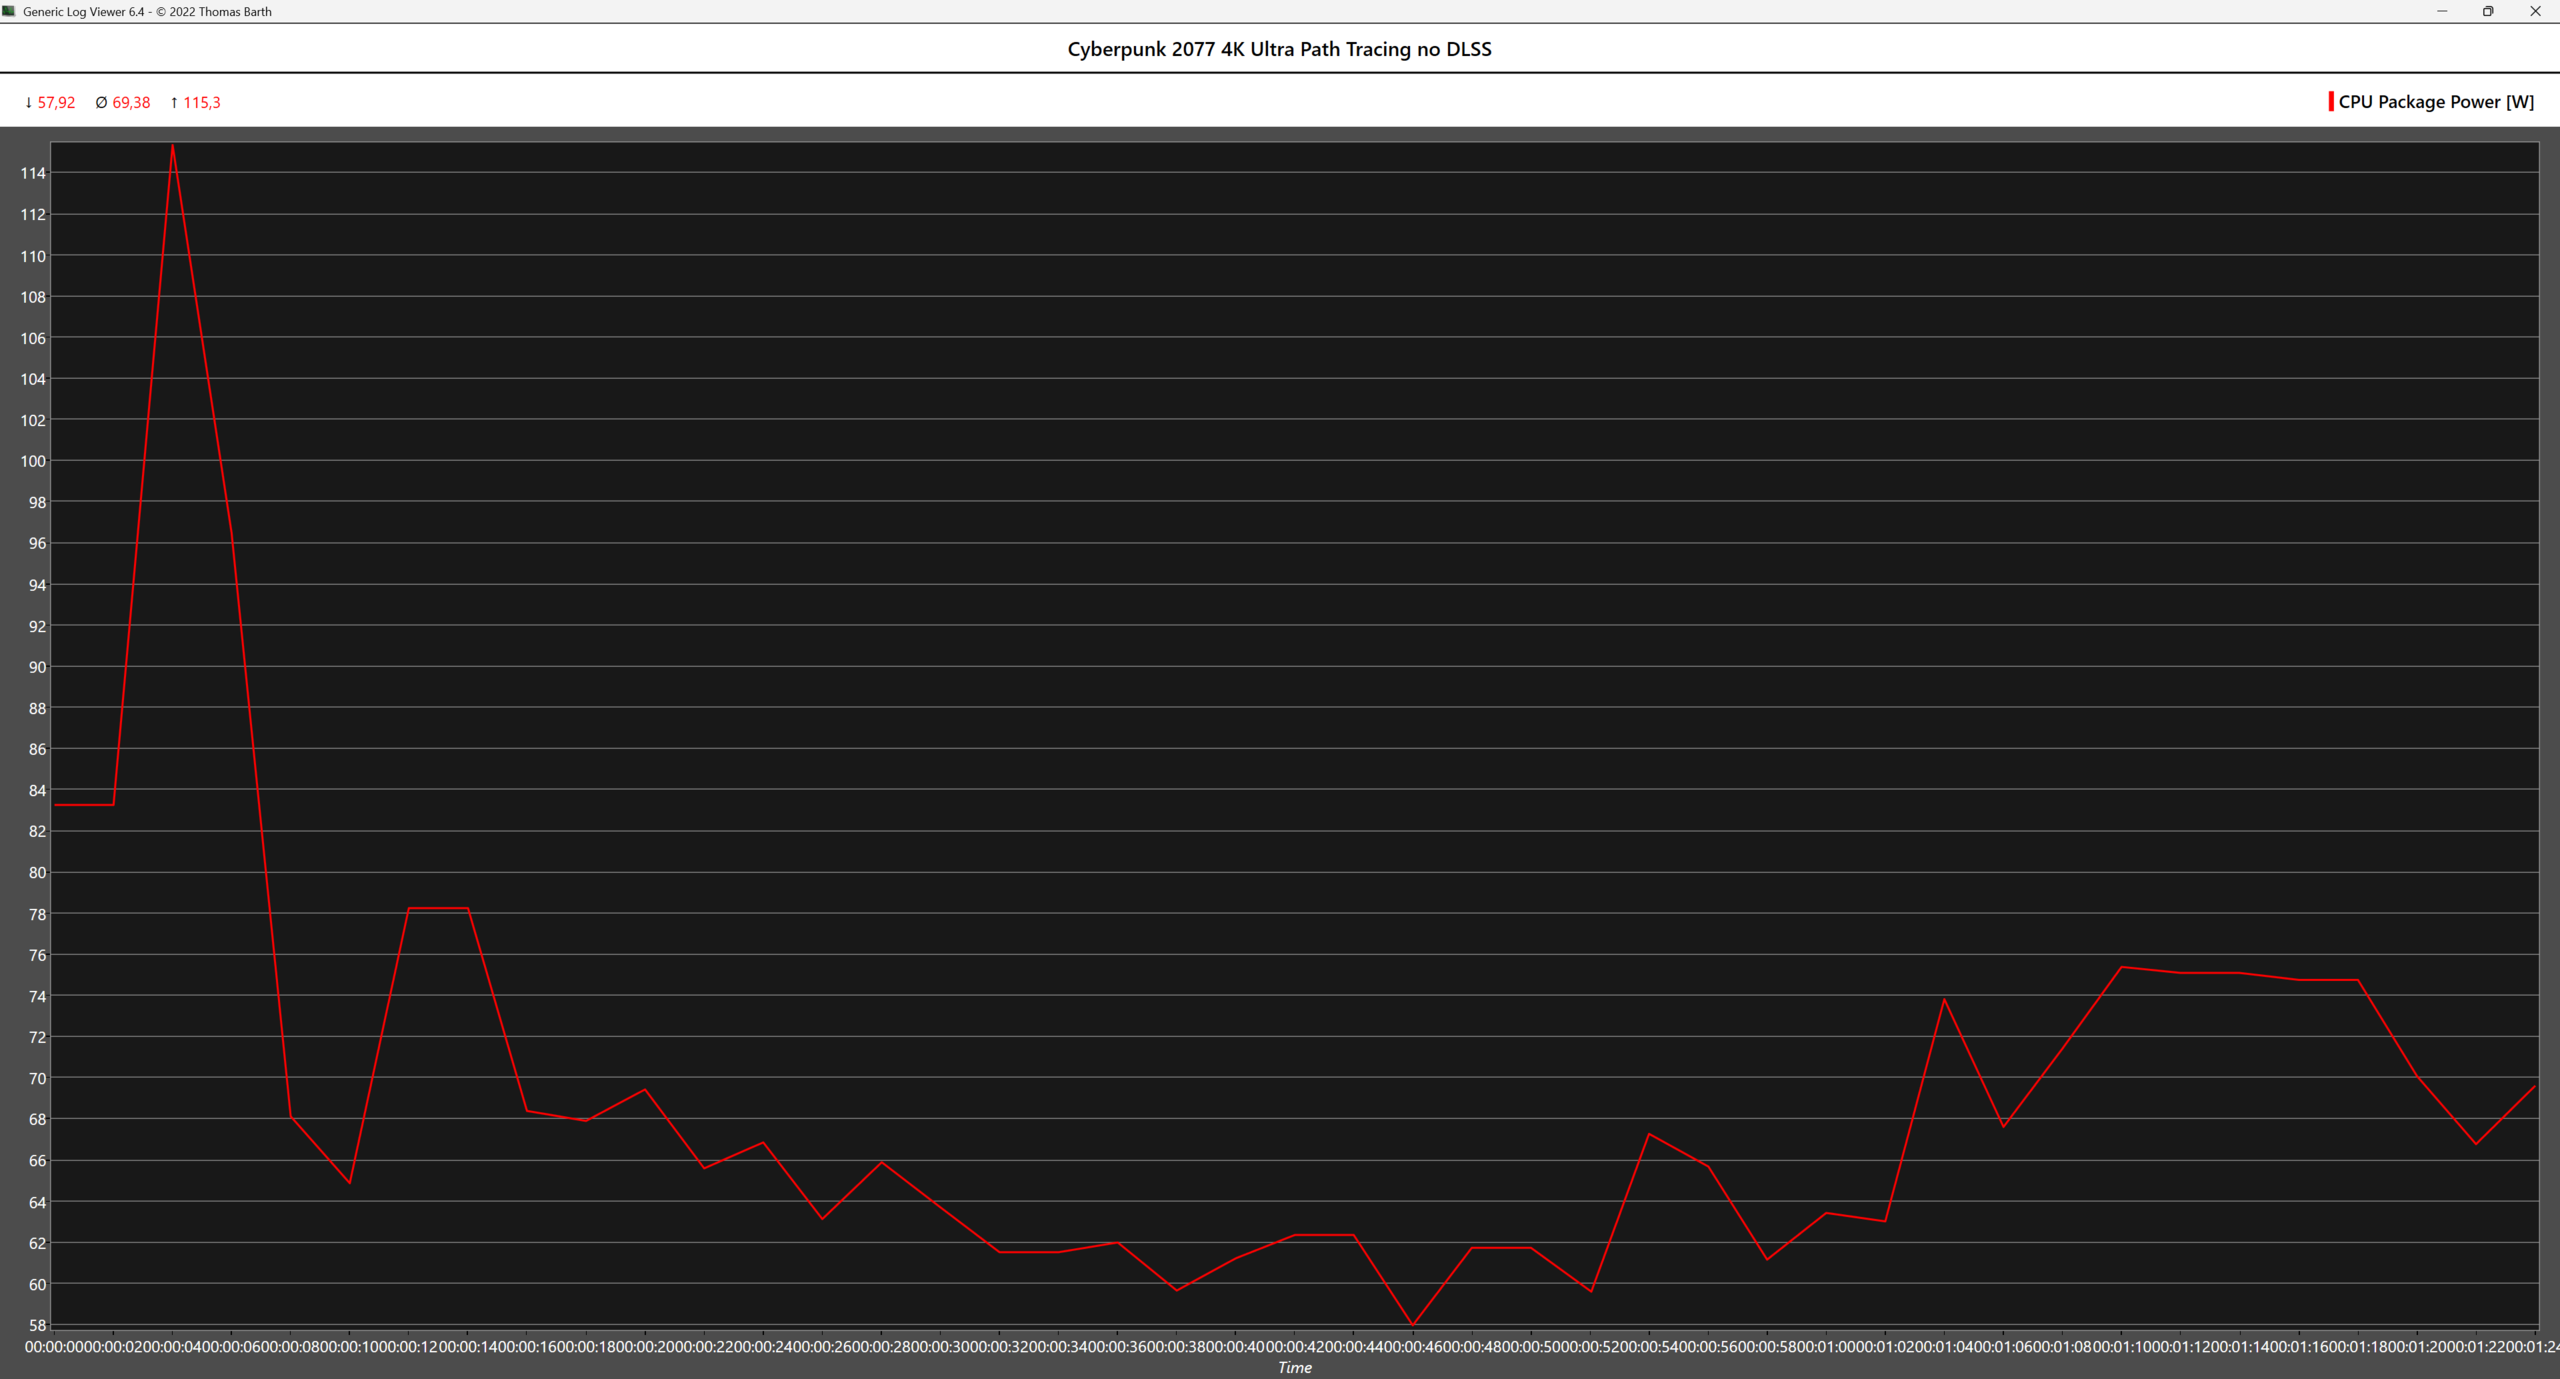
Power consumption
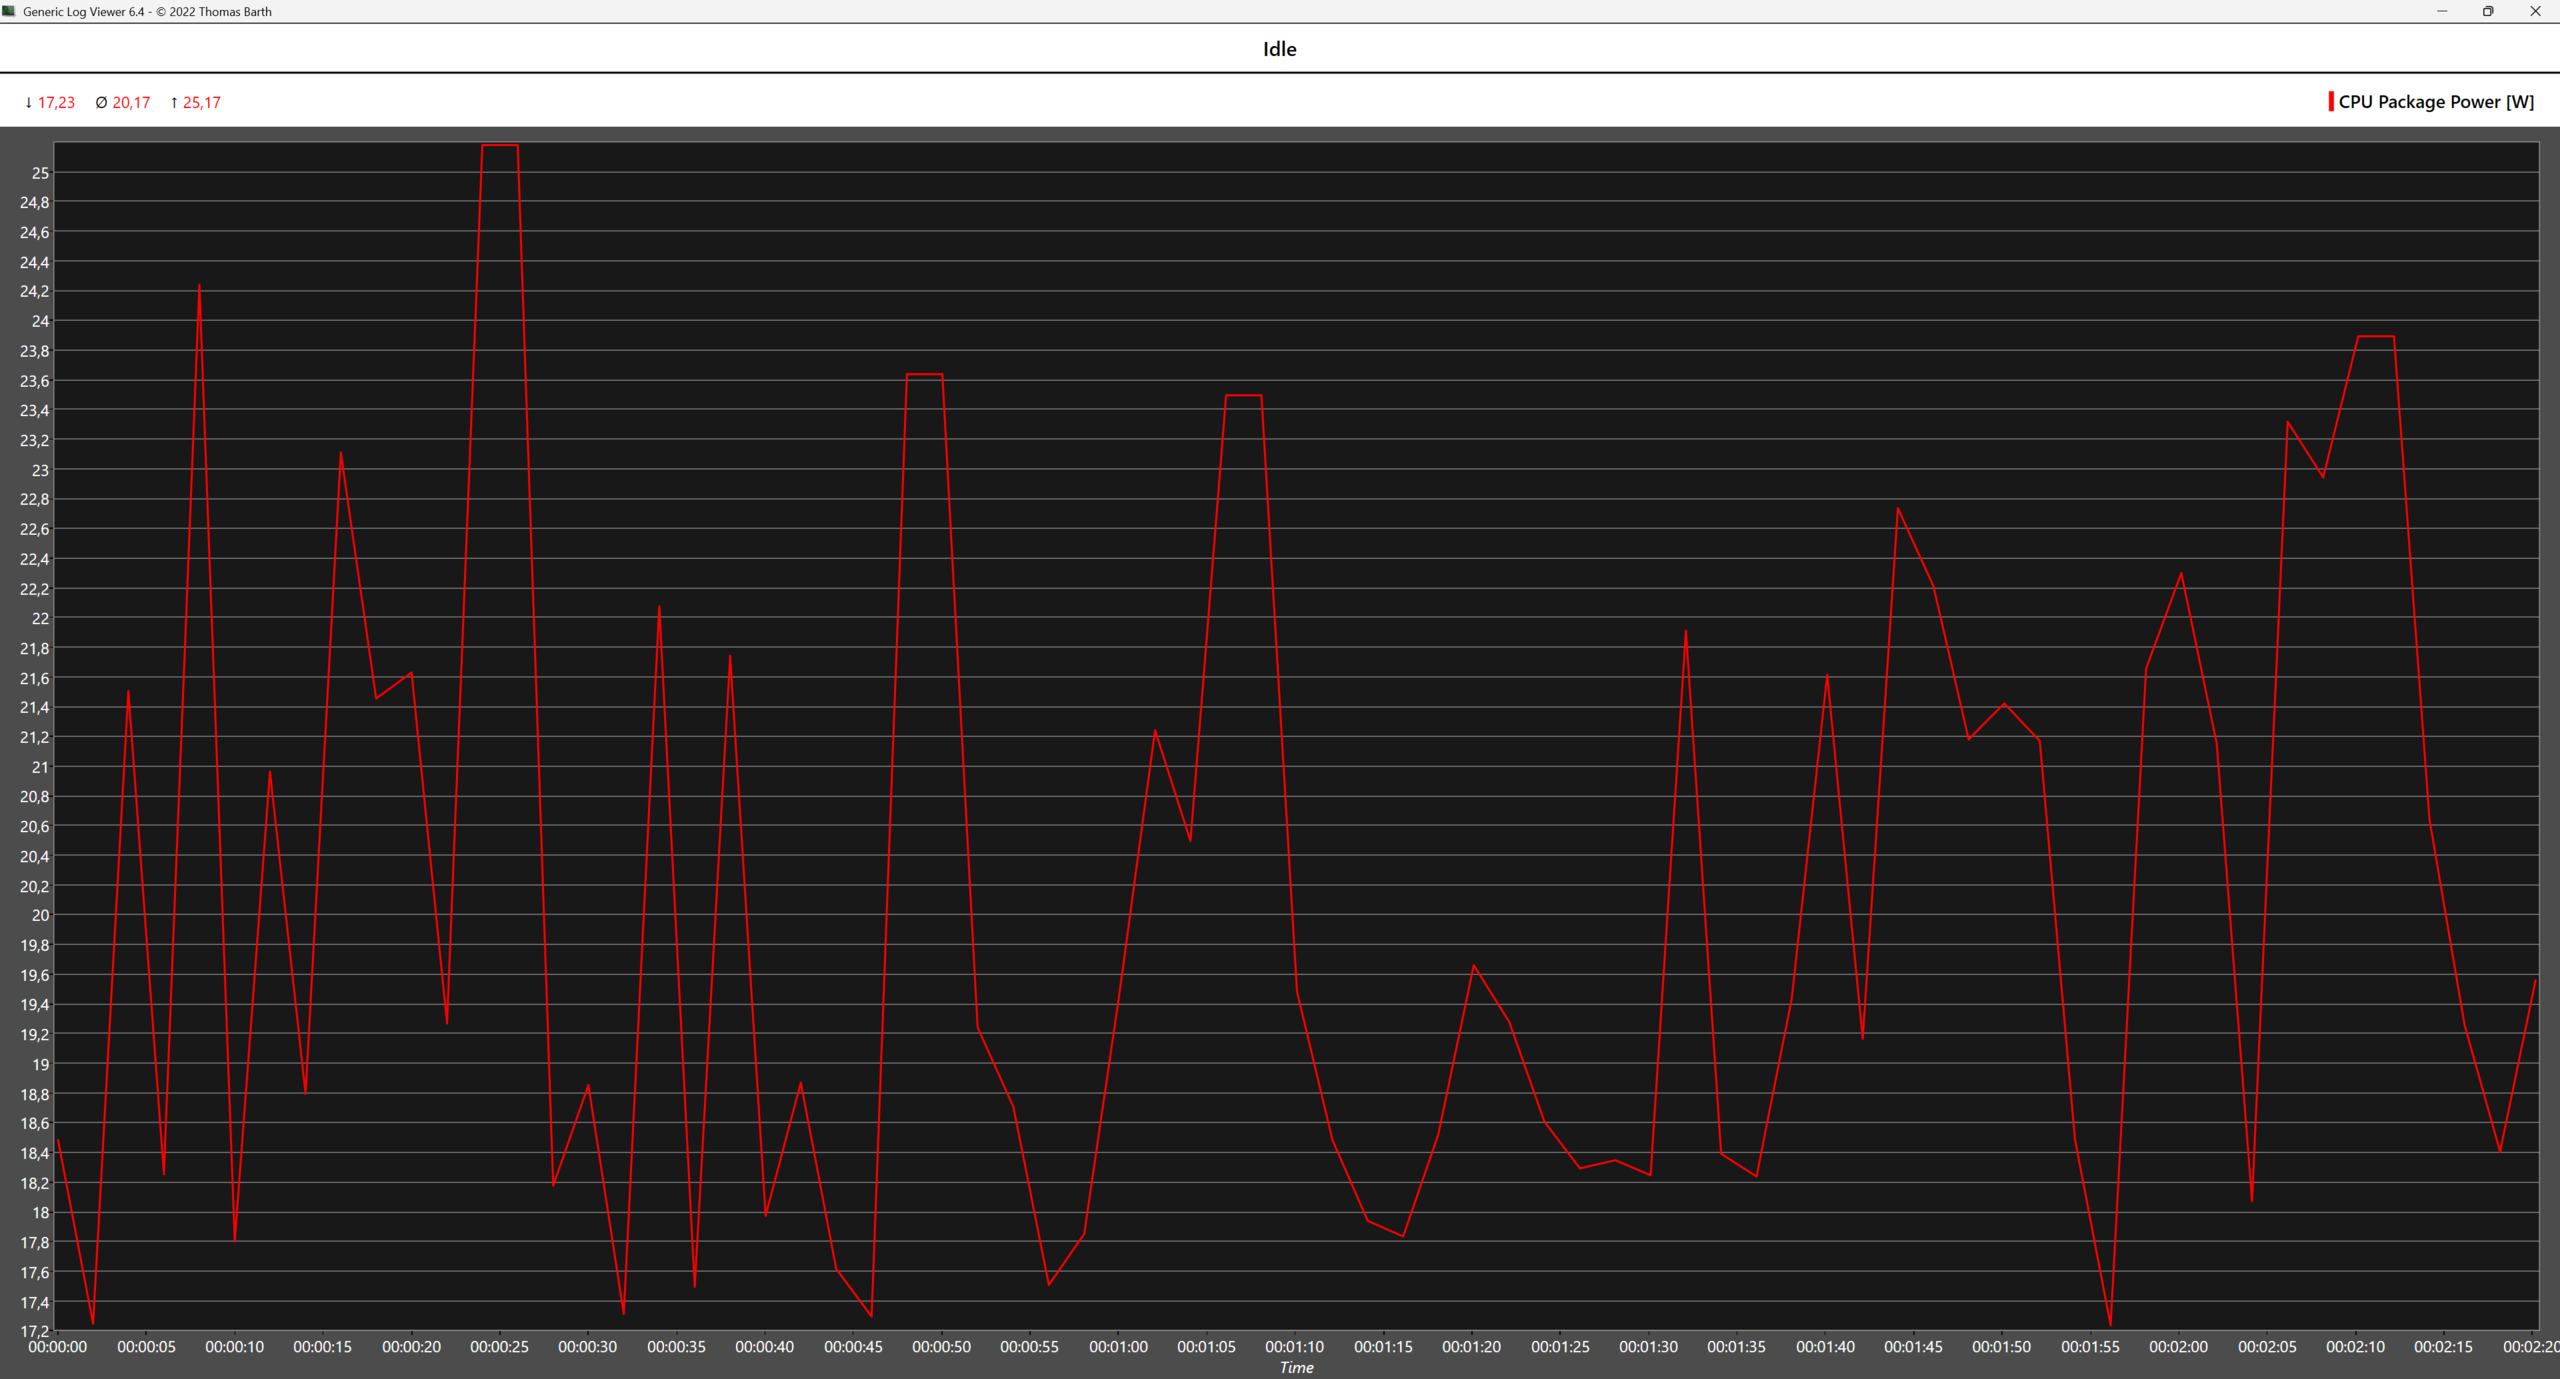
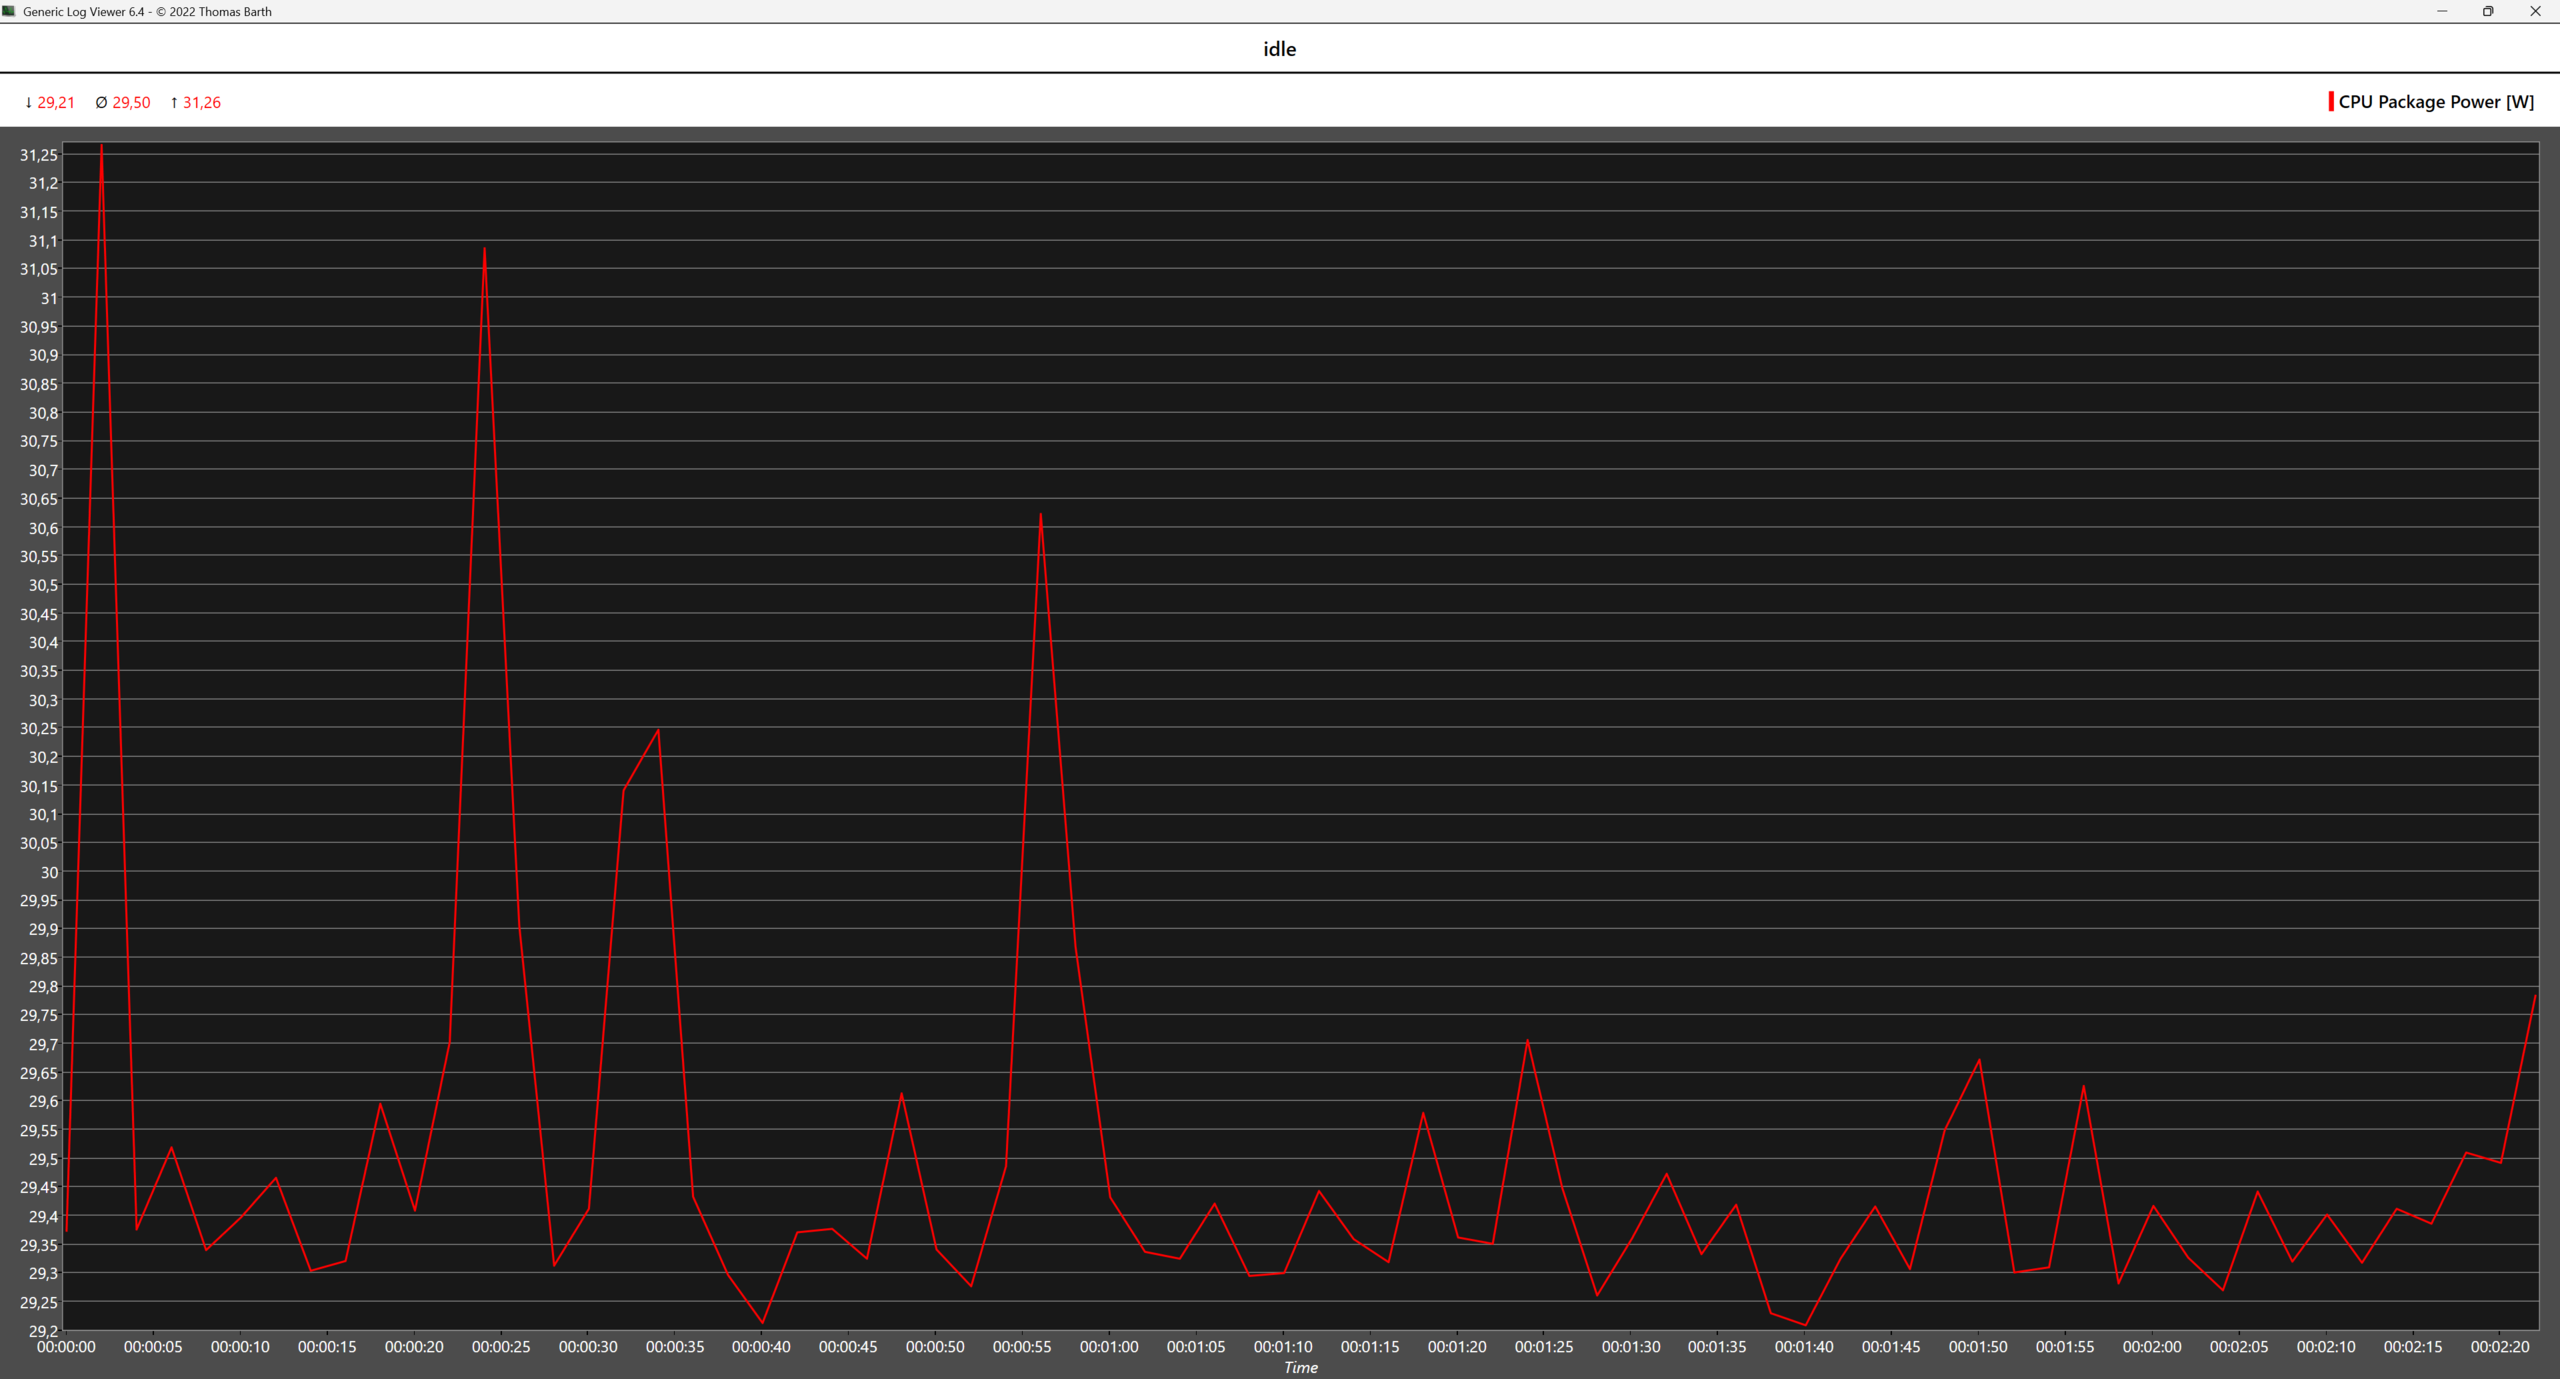
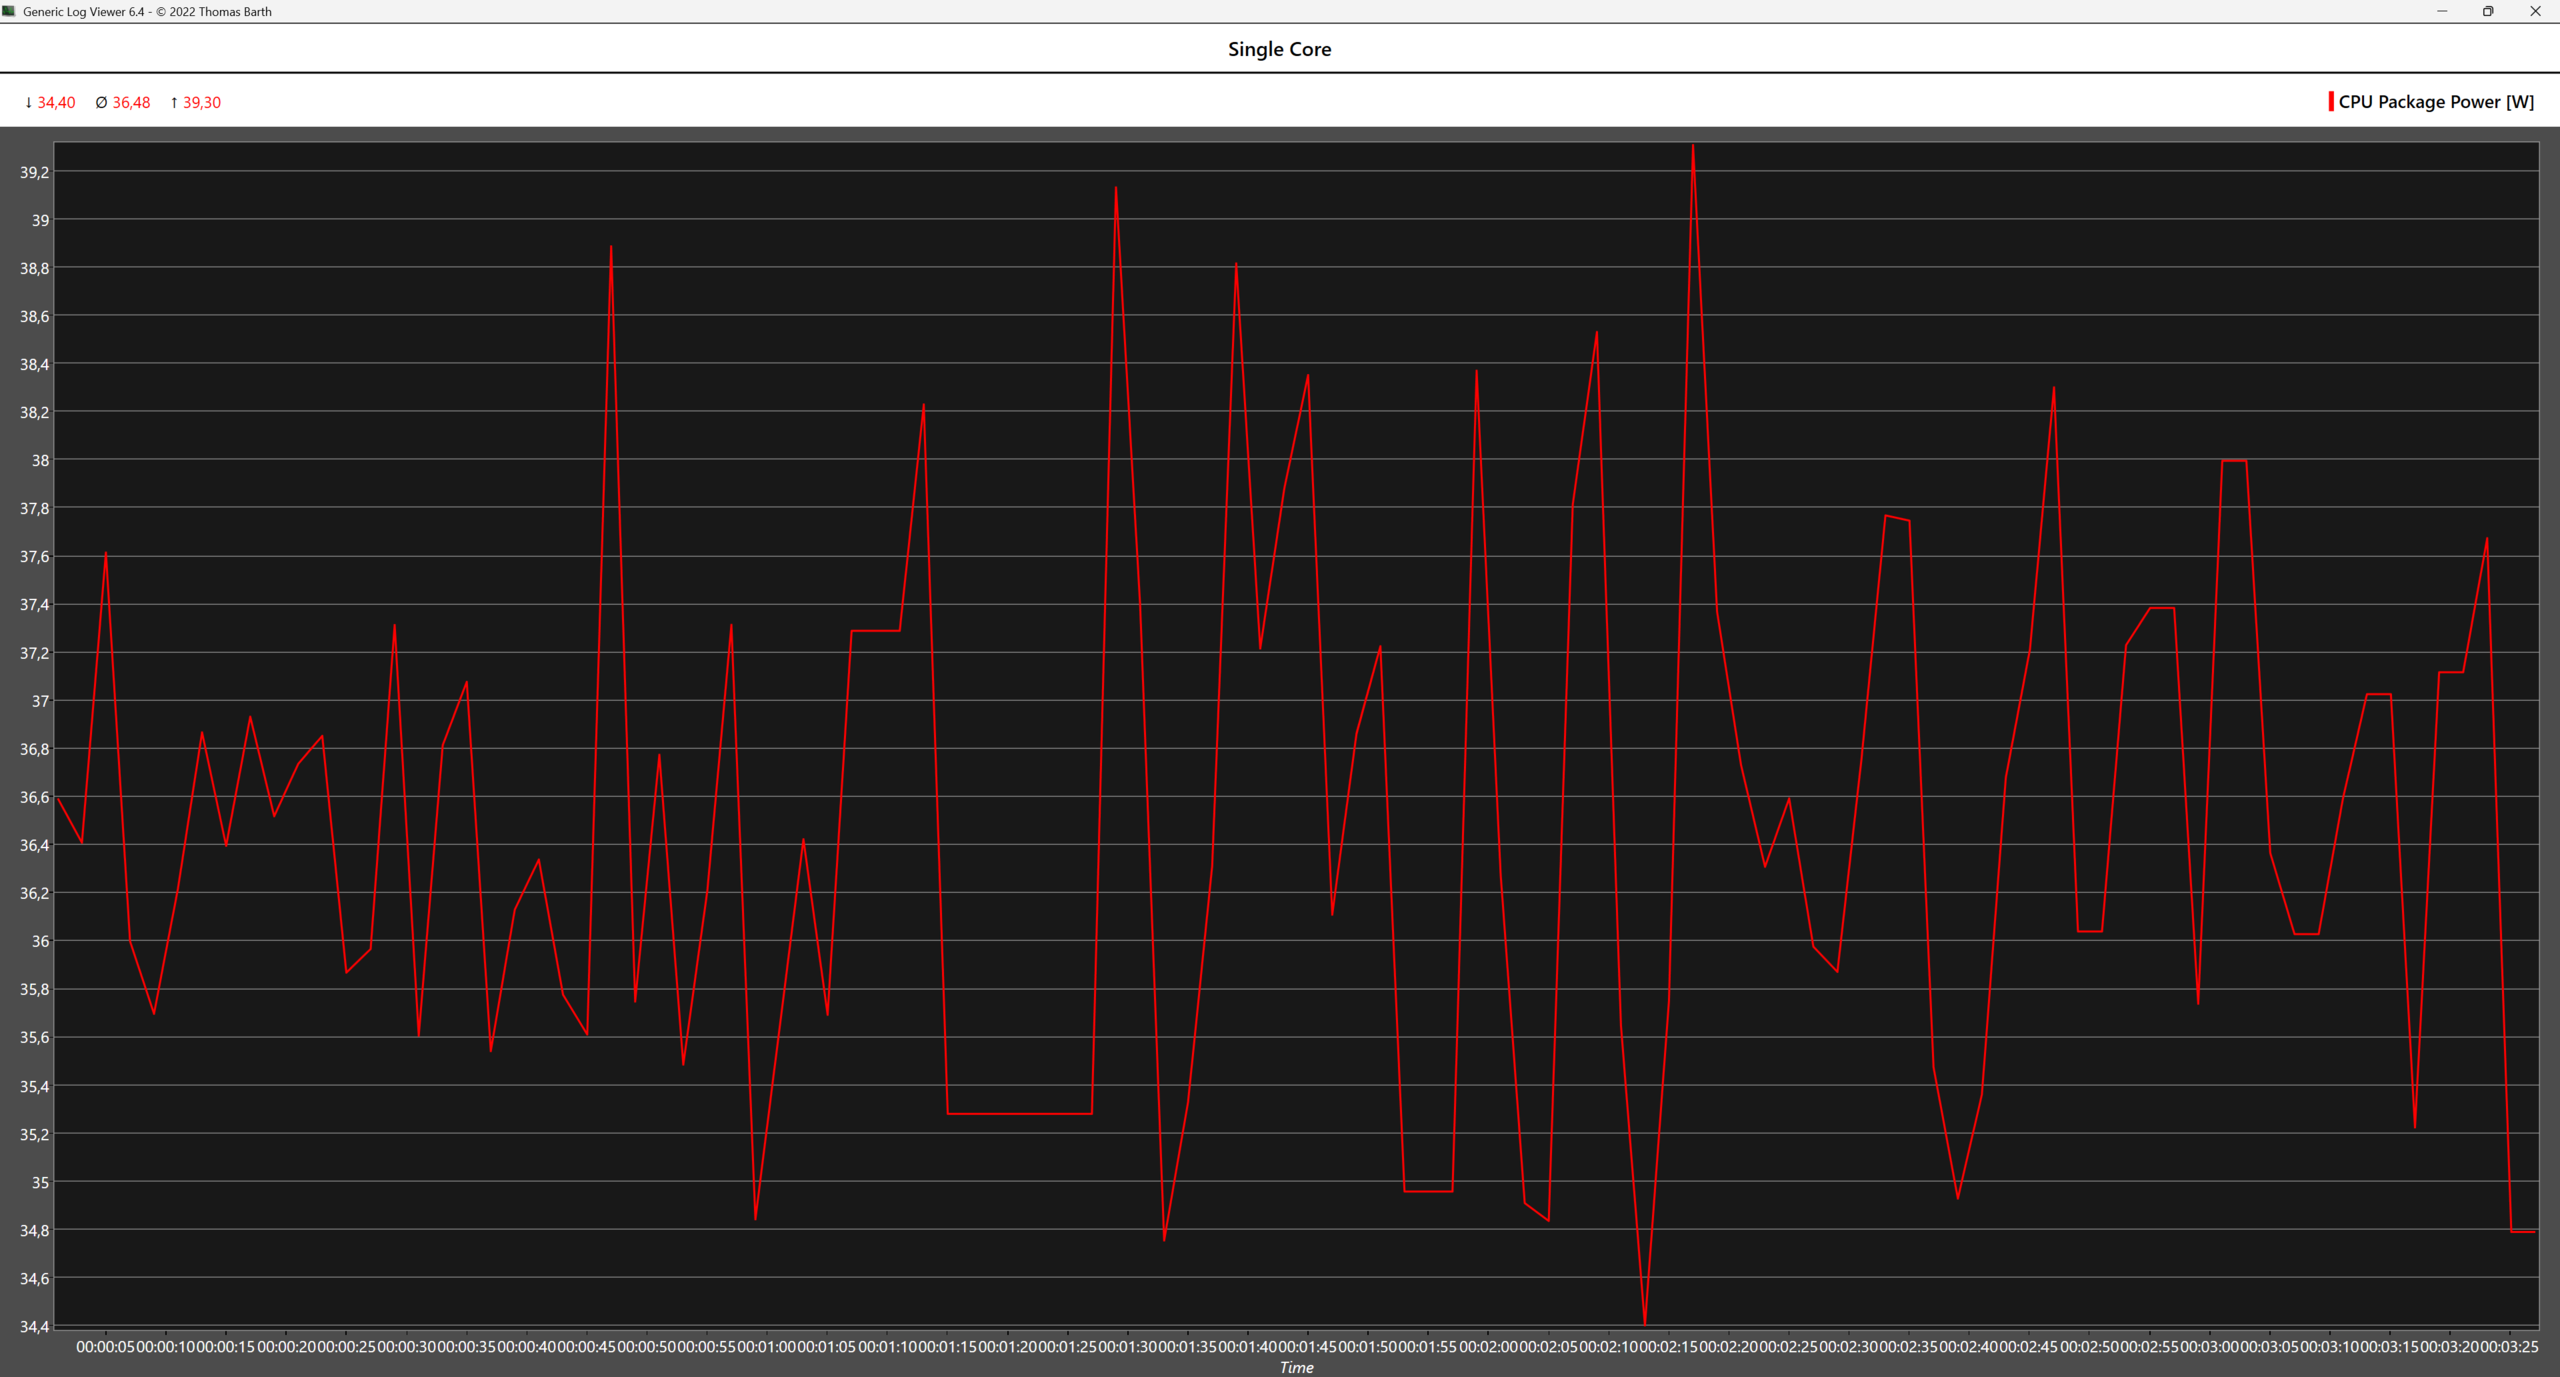
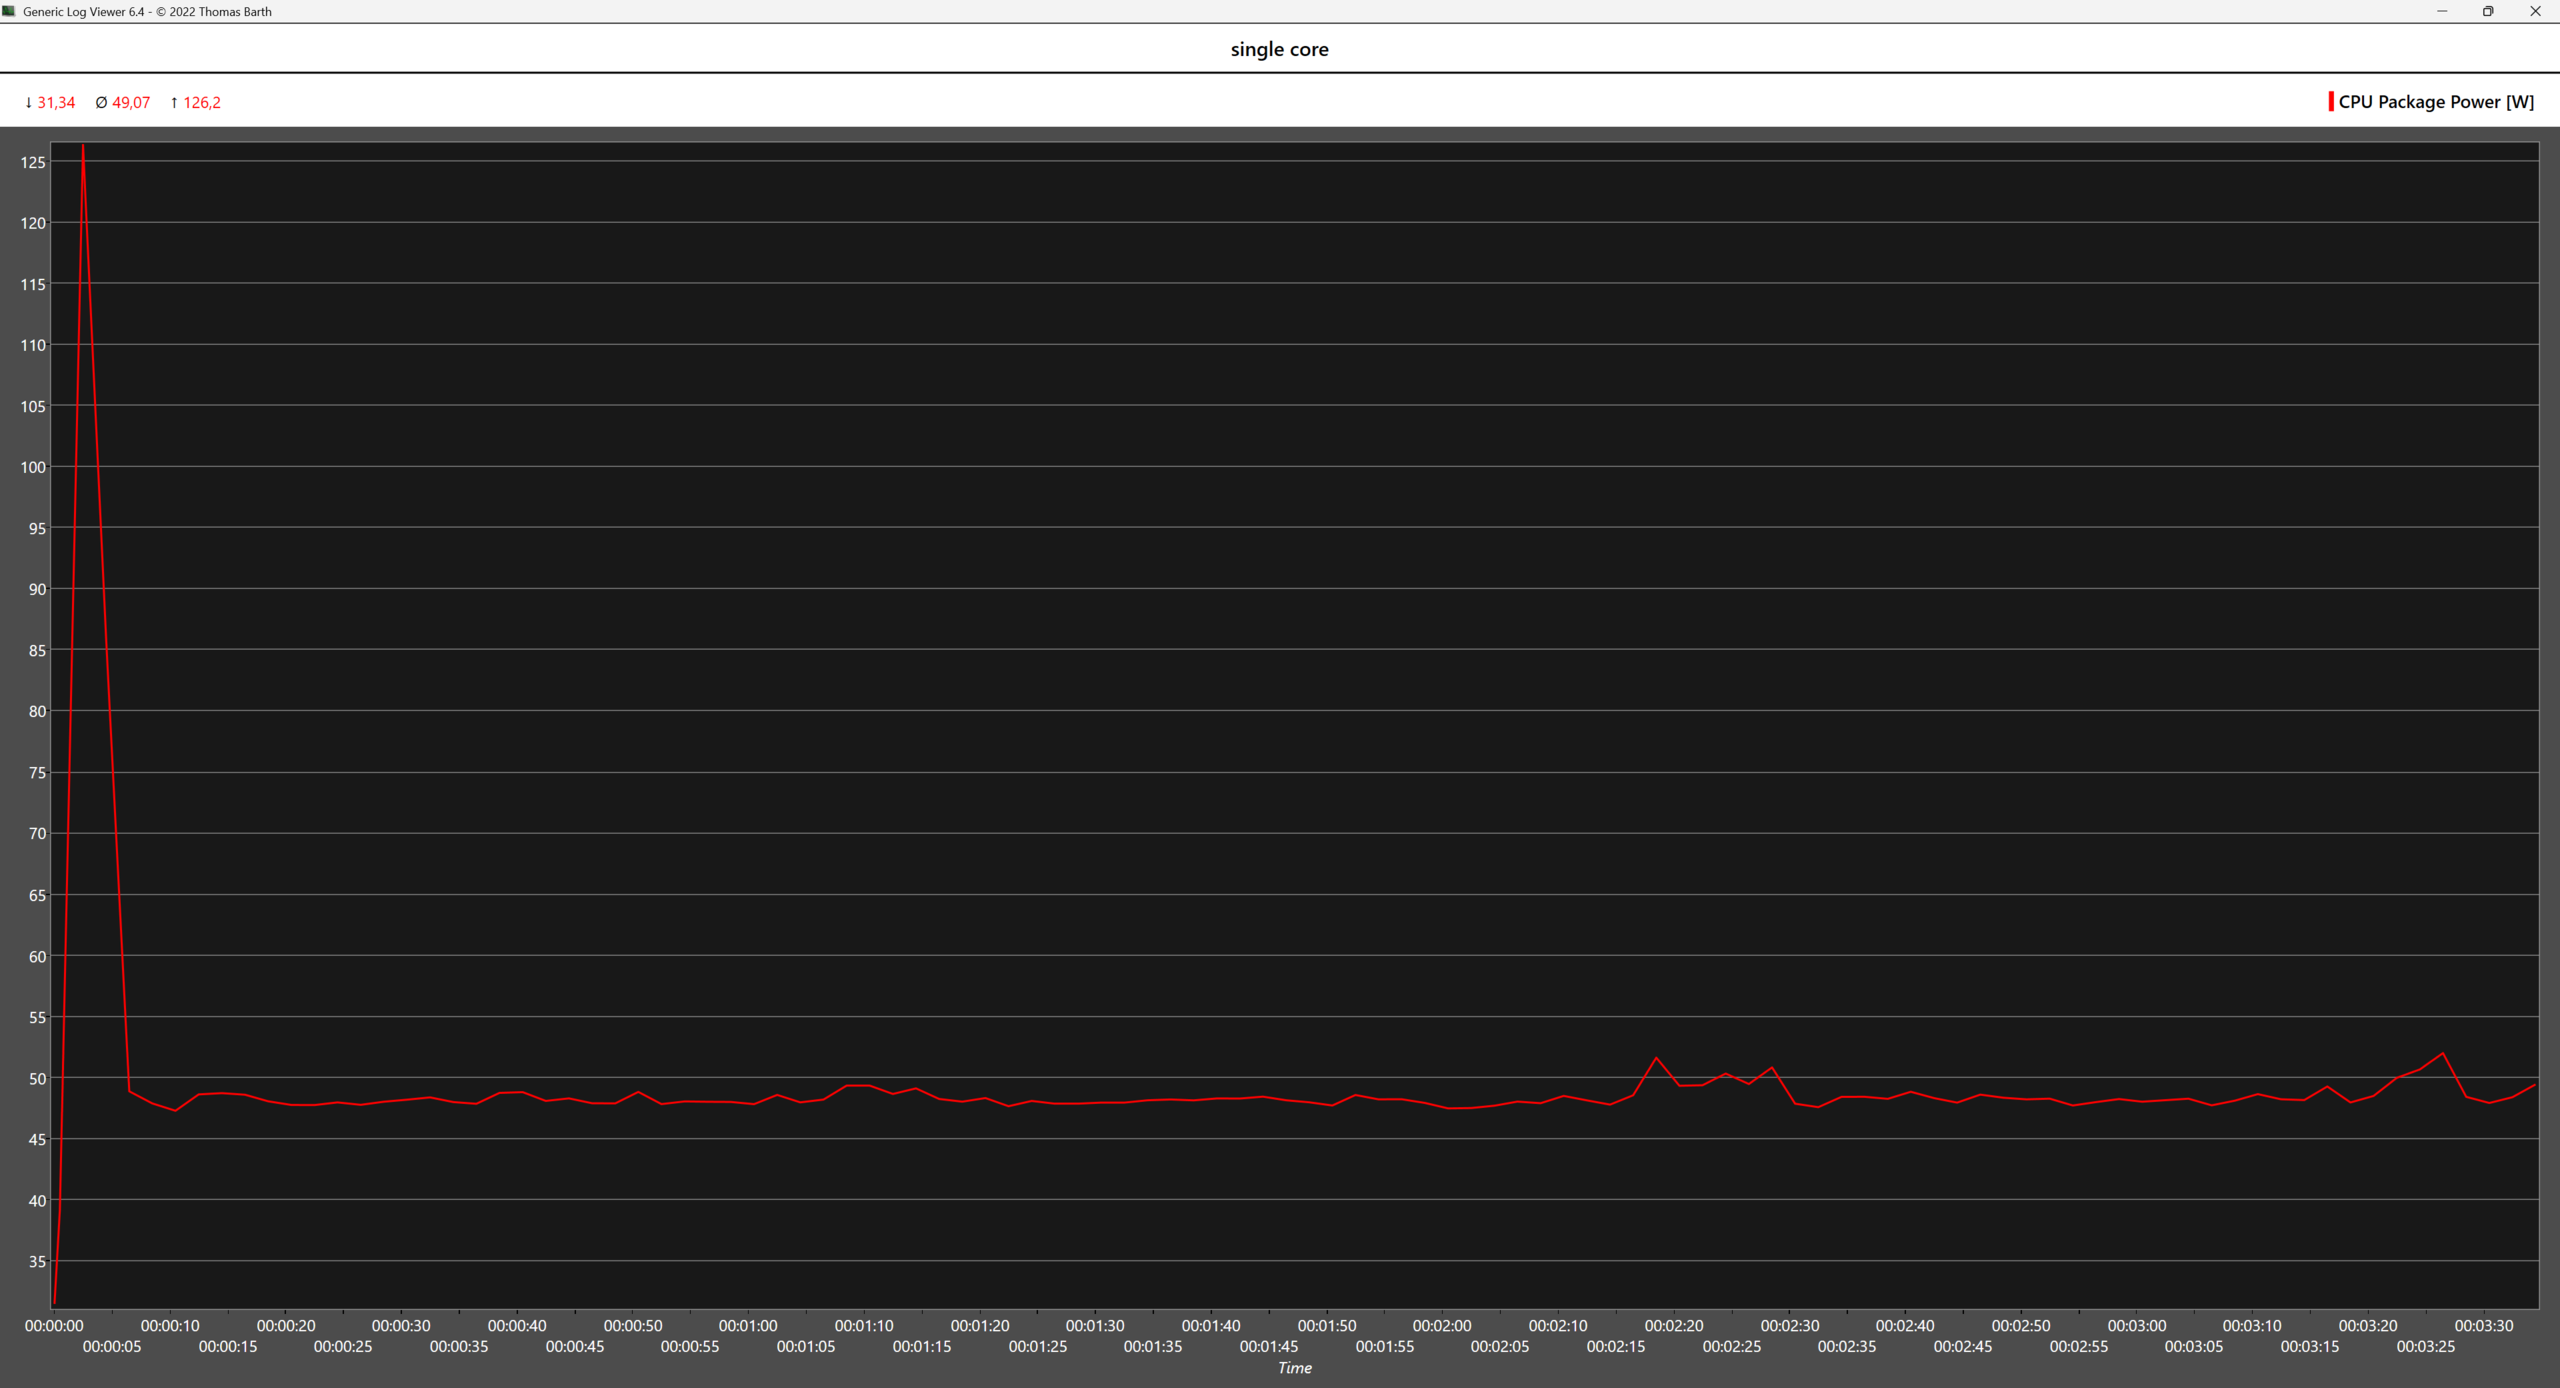
When not under heavy loads, the Intel processor appears to be a bit more power efficient than its AMD competitor. Thus, in idle and single core scenarios, and even in most gaming tests where the GPU is doing most of the work, the Intel CPU consumes 20-30 W less on average. The AMD power draw can be improved to the point where it mostly matches the Intel CPU if the Balanced power profile is activated in Windows 11, and its performance in games does not seem to be affected, but this may have some negative impact on productivity and content creation workloads.
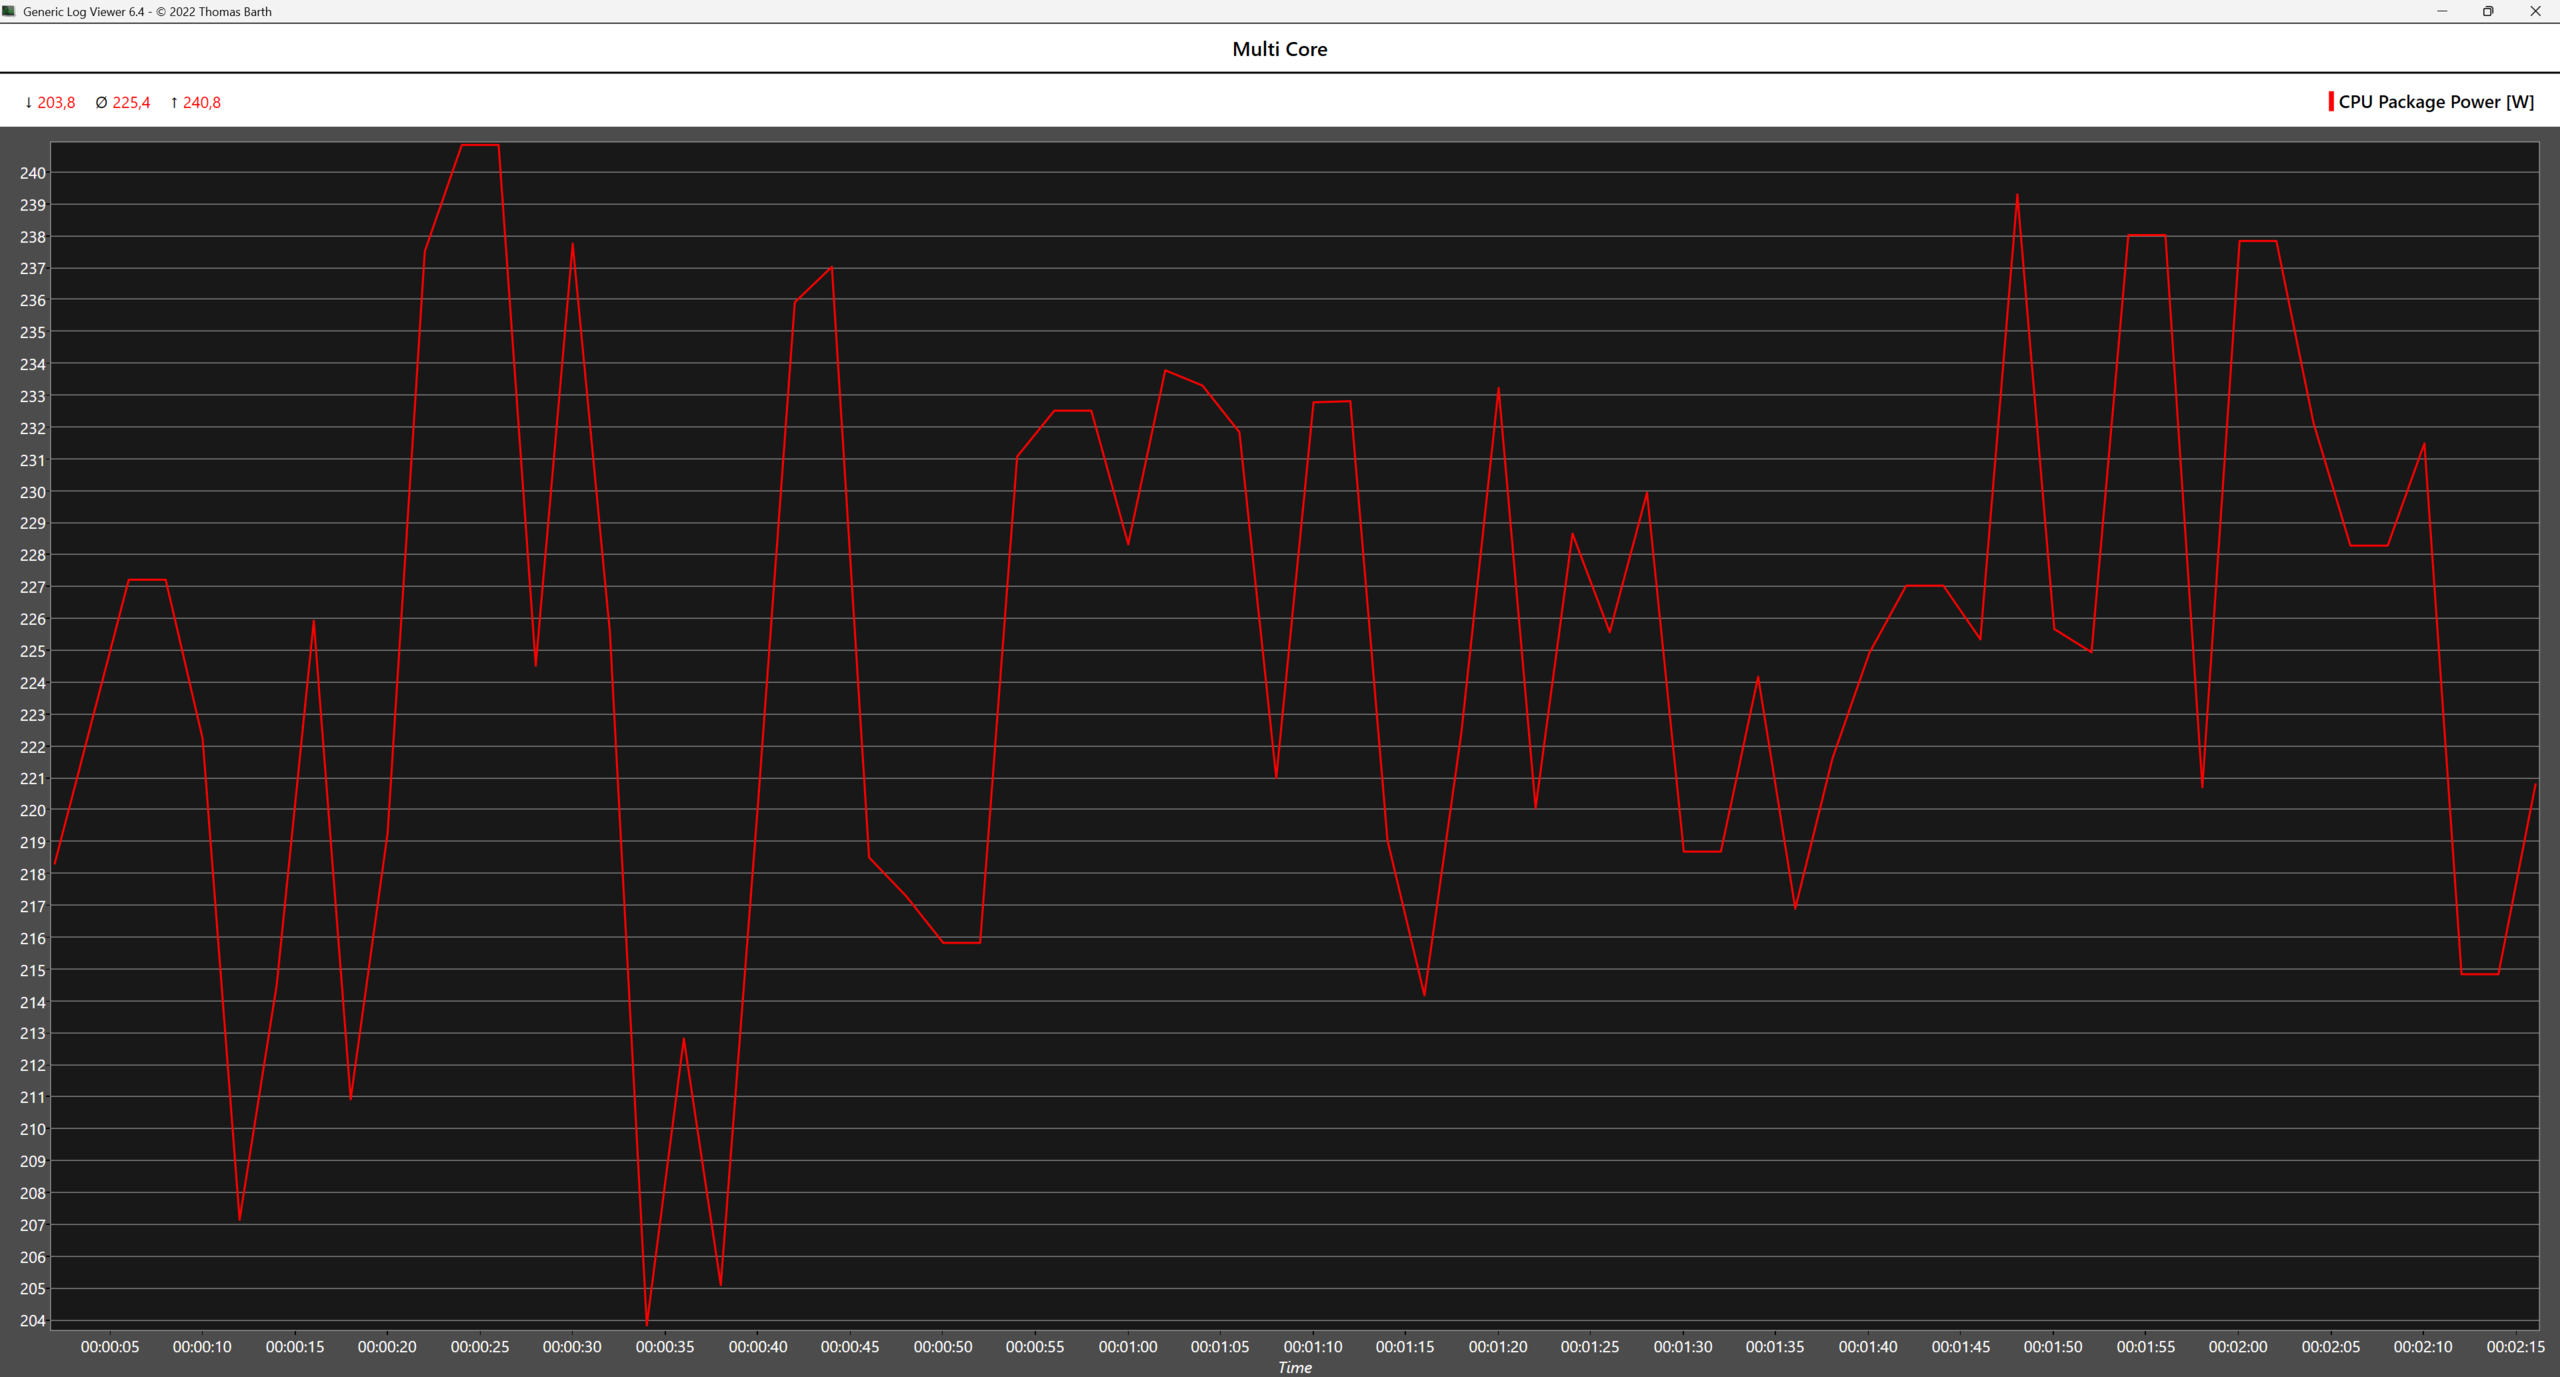
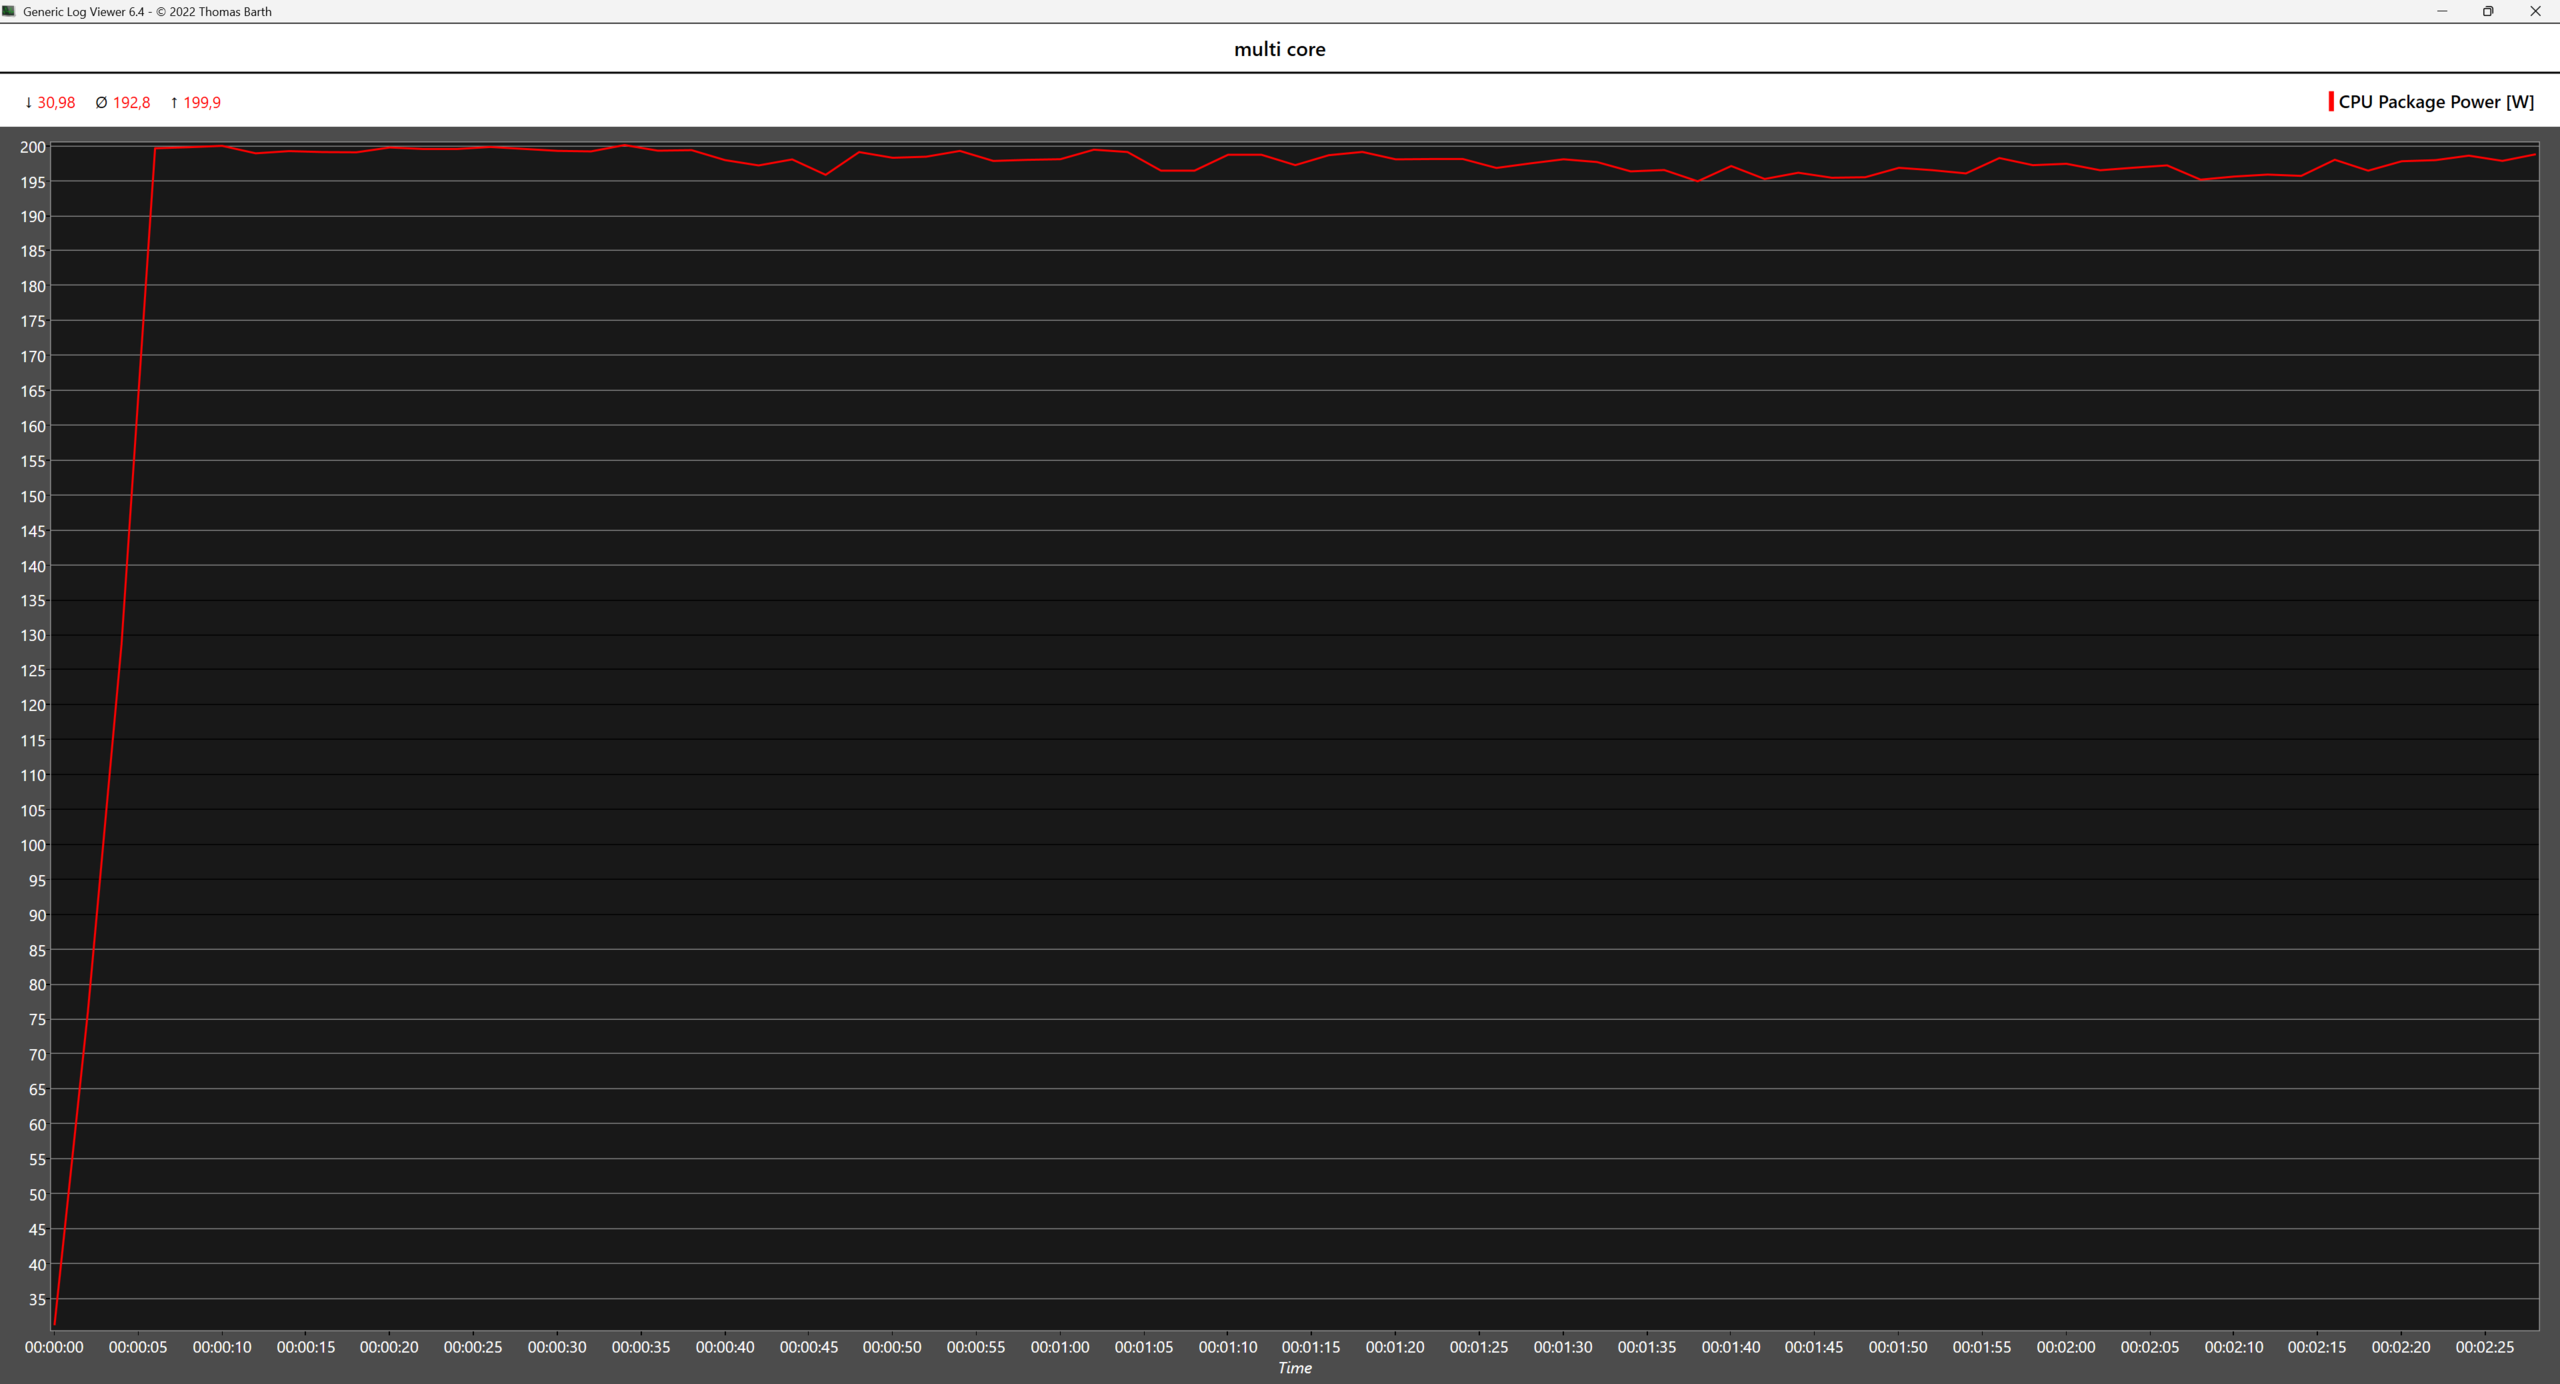
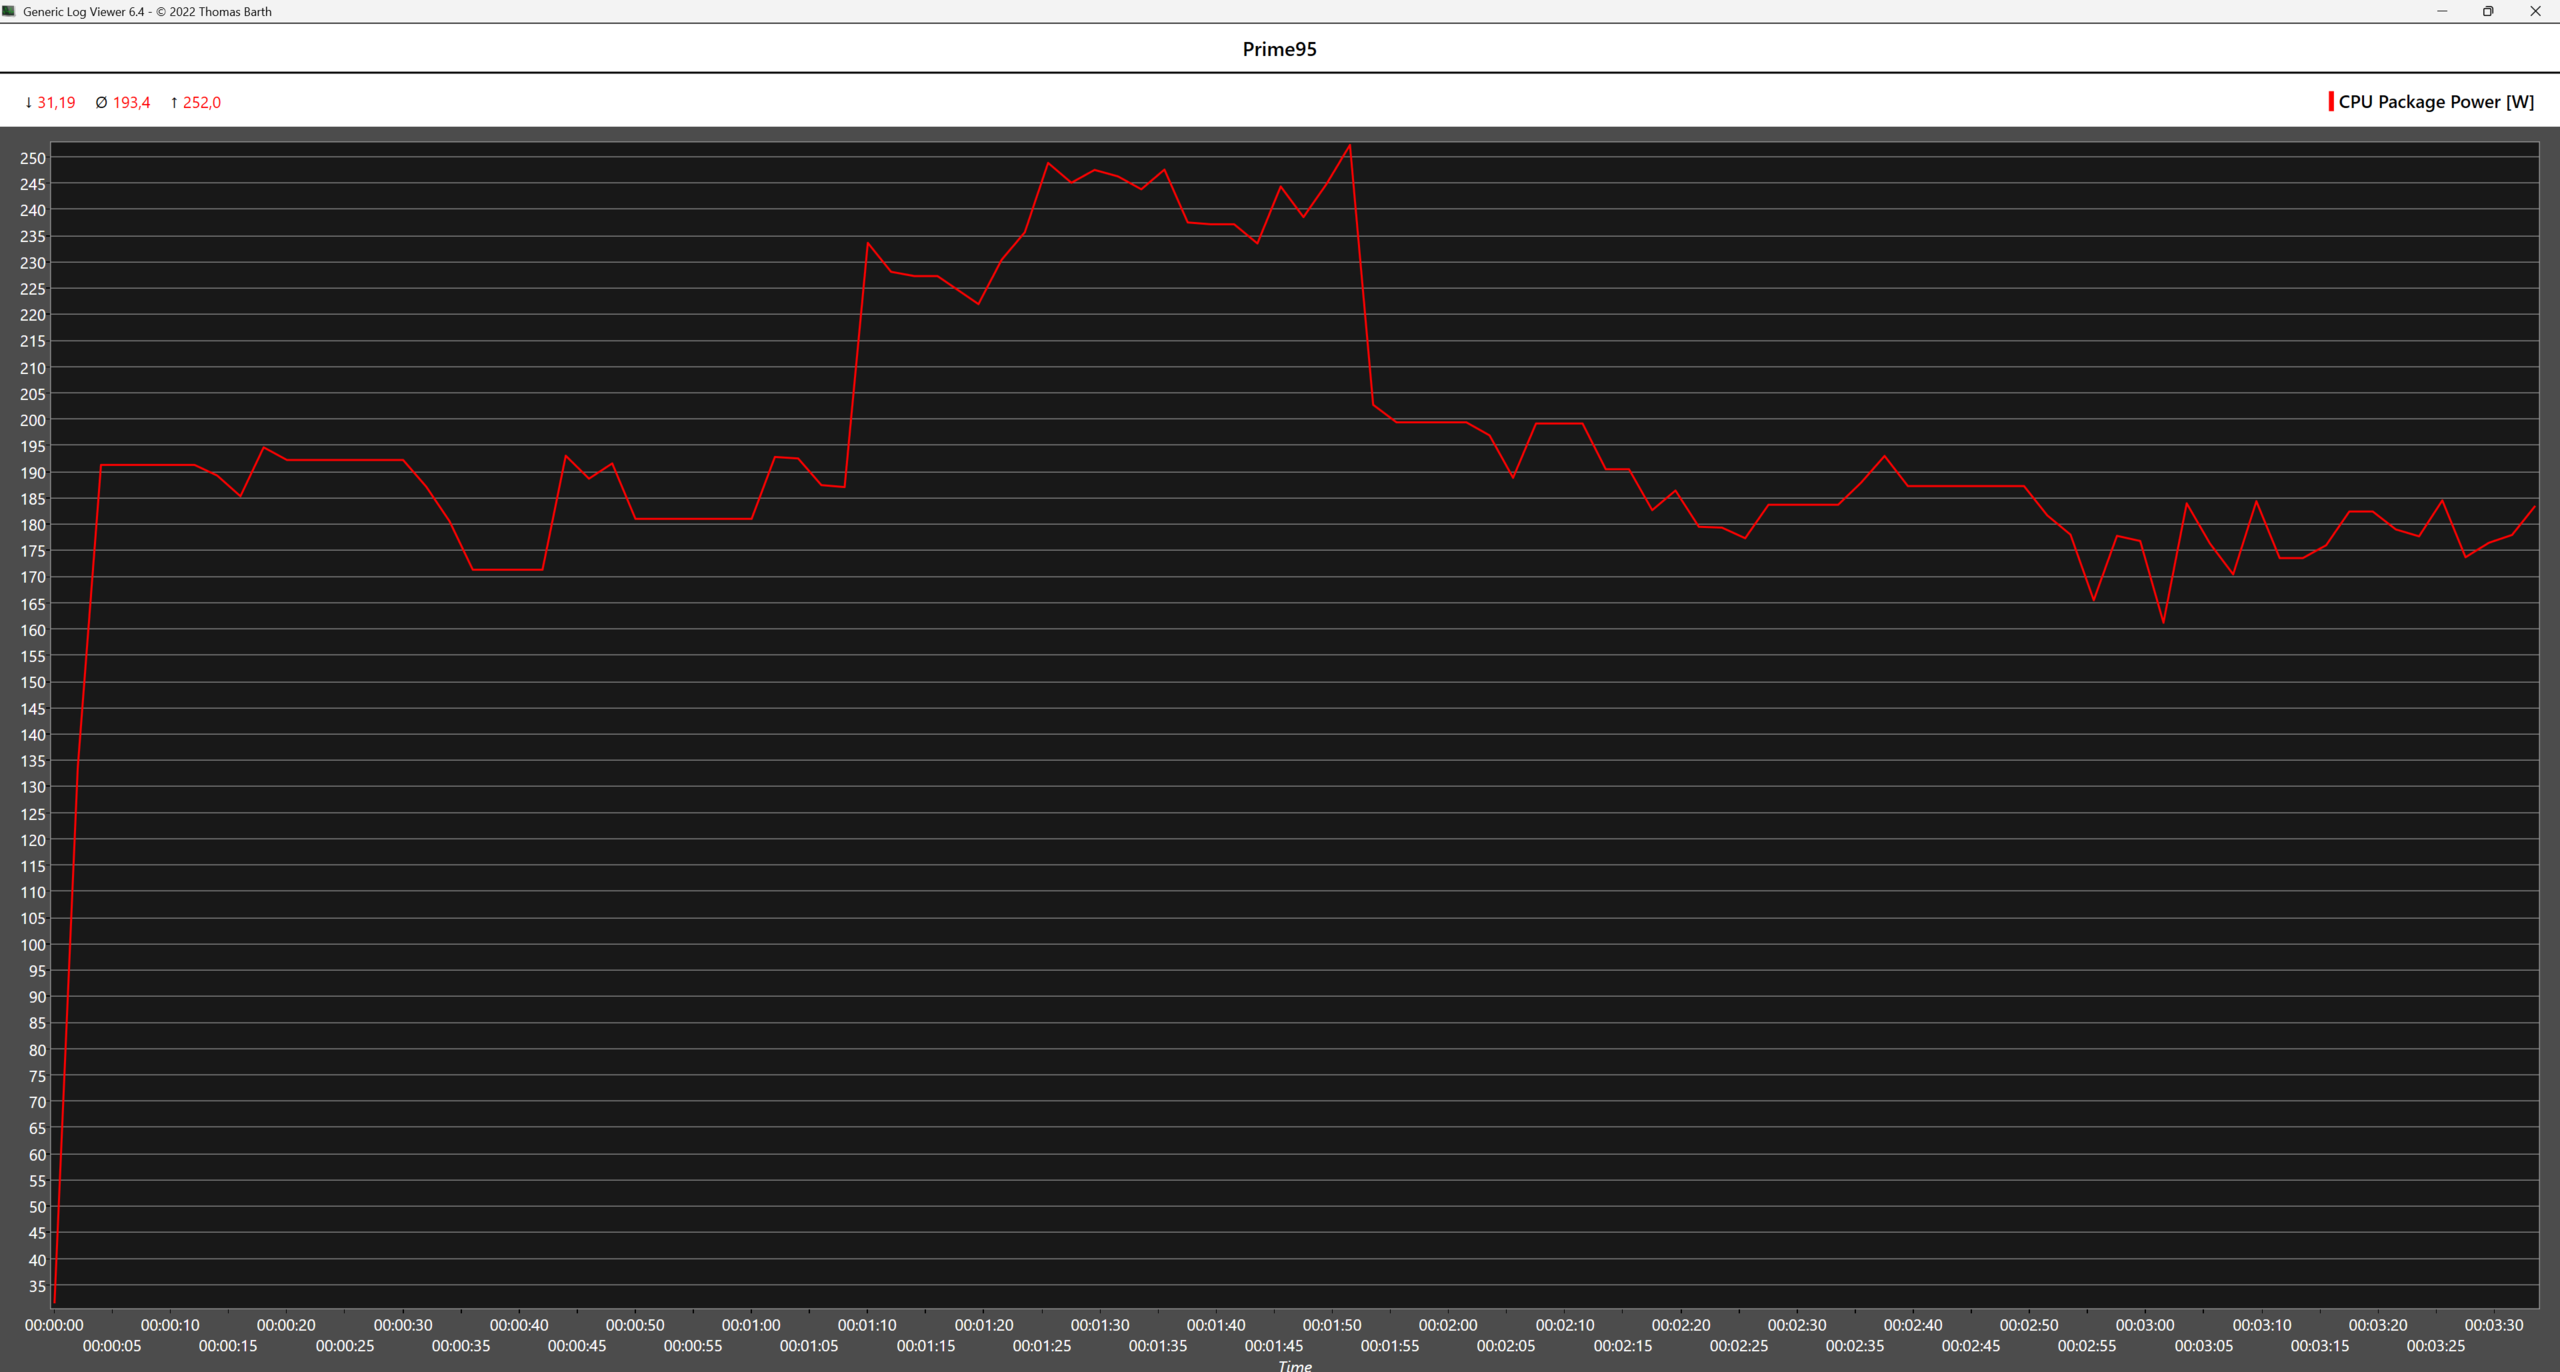
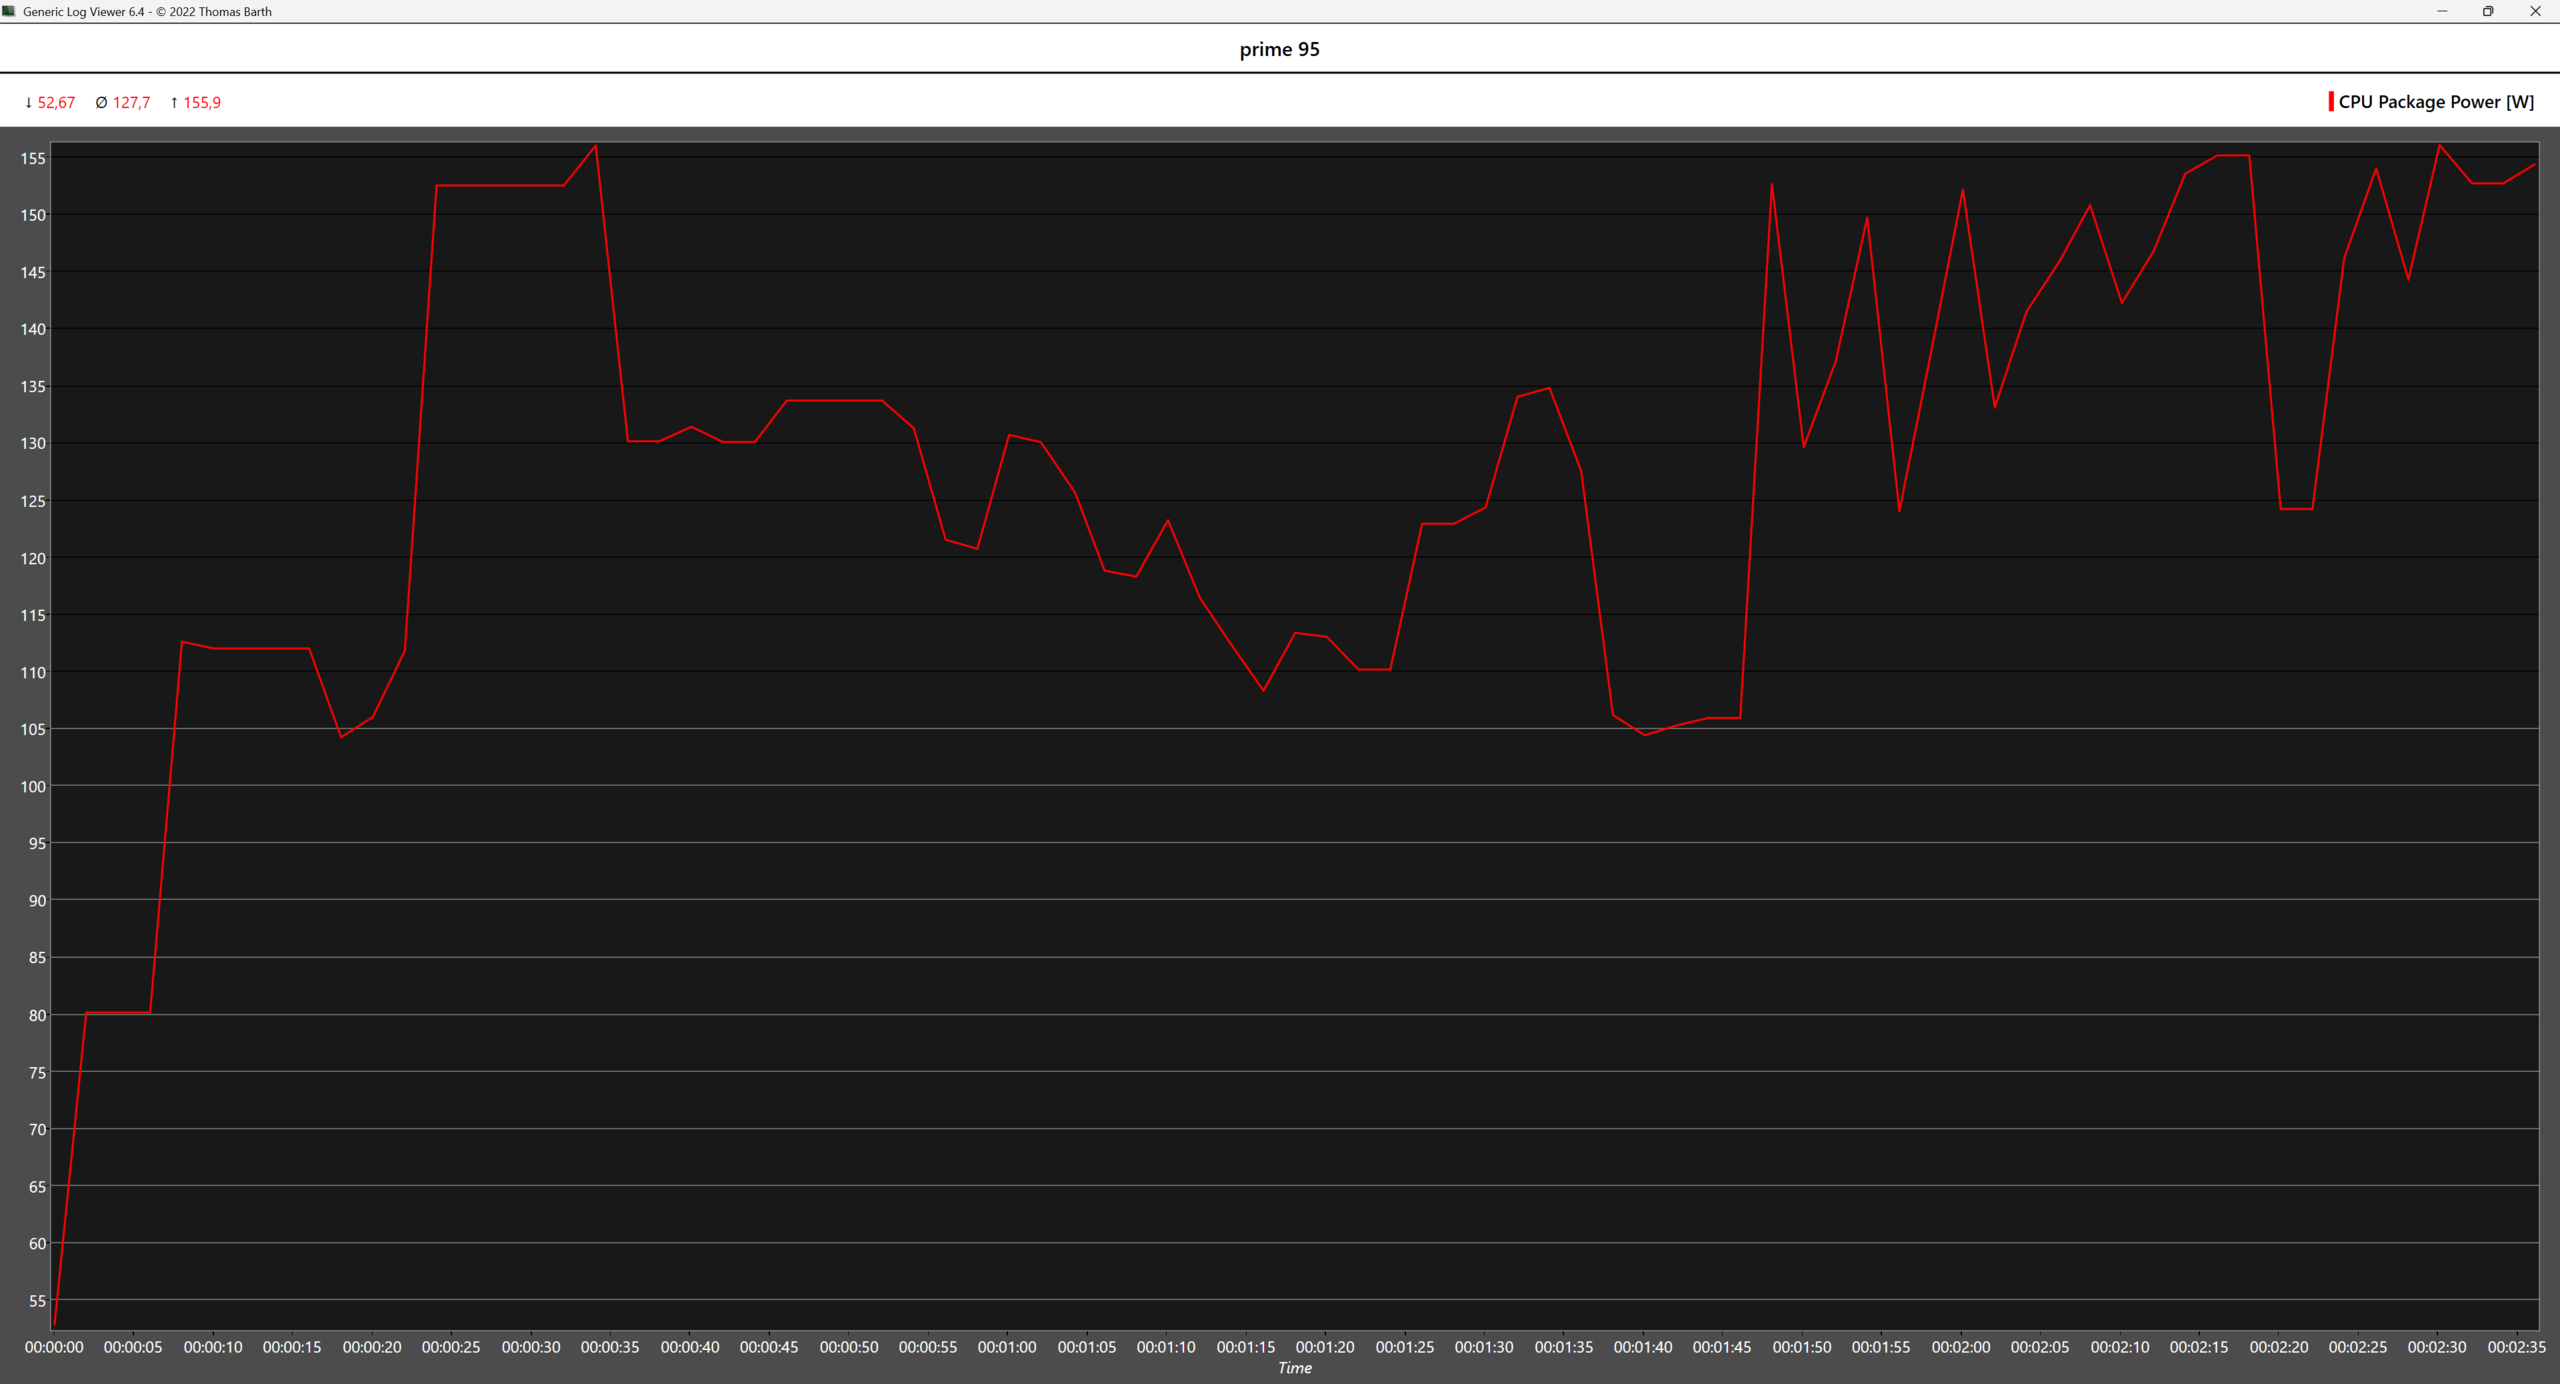
In scenarios where all cores are utilized such as the multi core stress test of Cinebench 2024 or the Prime 95 large FTT test, the AMD CPU emerges less power hungry even under the High Performance power profile. In Prime 95, the AMD CPU consumes 65 less W on average compared to the Intel one, while the Intel CPU also enters thermal throttling state and almost hits TJMAX in the first minute of the test, with the temperatures gradually getting lower afterwards. These extreme cases are not very likely to happen in real world scenarios, though.


Transparency
The selection of devices to be reviewed is made by our editorial team. The test sample was provided to the author as a loan by the manufacturer or retailer for the purpose of this review. The lender had no influence on this review, nor did the manufacturer receive a copy of this review before publication. There was no obligation to publish this review. As an independent media company, Notebookcheck is not subjected to the authority of manufacturers, retailers or publishers.
This is how Notebookcheck is testing
Every year, Notebookcheck independently reviews hundreds of laptops and smartphones using standardized procedures to ensure that all results are comparable. We have continuously developed our test methods for around 20 years and set industry standards in the process. In our test labs, high-quality measuring equipment is utilized by experienced technicians and editors. These tests involve a multi-stage validation process. Our complex rating system is based on hundreds of well-founded measurements and benchmarks, which maintains objectivity. Further information on our test methods can be found here.
