Notebookcheck Logo

AMD A6-4400M vs Intel Core 2 Duo T8100 vs Intel Core 2 Duo T6600

AMD A6-4400M

► remove from comparison AMD A6-4400M

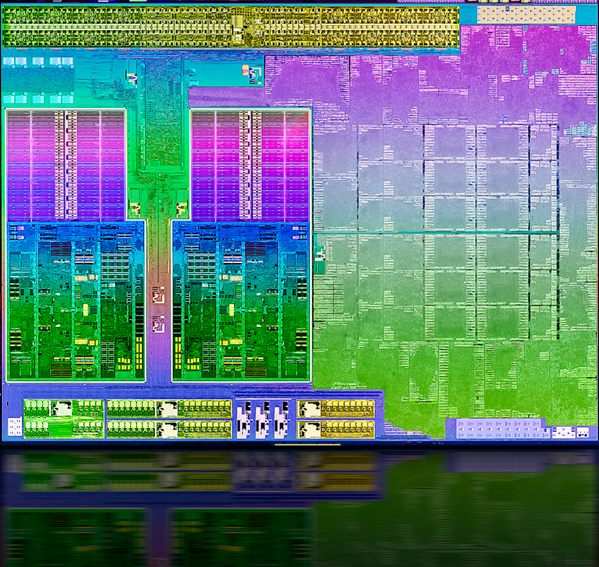
The AMD A6-4400M is a mobile dual-core processor based on the Trinity architecture. Officially introduced in Q2 2012, it is the direct successor to the Llano A-series of APUs (Accelerated Processing Unit). The processing unit is manufactured in 32nm SOI and integrates a 2.7 GHz CPU (up to 3.2 GHz w/ Turbo Core) with a Radeon HD 7520G GPU alongside a dual-channel memory controller, video de- and encoders and a northbridge.

The CPU cores are based on a reworked Bulldozer architecture, called Piledriver. Although marketed as a dual-core processor, the A6-4400M includes only one module with two integer-cores and one floating-point core. As a result, the CPU is not a true dual-core processor.

When compared to previous Bulldozer cores, AMD has managed to improve upon the IPC (instructions per clock) performance of Trinity cores while allowing for higher clock frequencies. However, when compared to its Llano predecessor, the multithreaded performance of Trinity has only been slightly improved. The enhanced Turbo Core 3.0 feature functions well in speeding up single threaded performance, although it is still not on the same level as Intel’s Turbo Boost equivalent. Regardless, AMD has managed to include other features as well, such as the AVX extension (including FMA) and support for AES encryption.

In terms of raw general performance, the A6-4400M performs similar to the Llano-based A4-3330MX. Single-threaded workloads can especially benefit from the new architecture and the updated Turbo Core functionality. If compared to Intels Pentium-series, the A6-4400M offers less performance in most cases. Nonetheless, CPU performance from the AMD processor should be sufficient for all daily workloads like Office and Internet browsing, but will reach its limits in more demanding applications.

The integrated DirectX 11-compatible Radeon HD 7520G offers only 192 shader cores of the Trinity chip (7660G: 384) and, thanks to Turbo Core, will operate anywhere between 497 to 686 MHz depending on the current application demand. On average, the performance of the HD 7520G GPU should be somewhere between the Llano-based Radeon HD 6620G and the HD Graphics 4000 as found in Intel’s Ivy Bridge.

The power consumption of the A6-4400M APU is rated at 35 Watt TDP and is therefore comparable to dual-core Ivy Bridge processors. Consequently, the A6-4400M is best suited for 14-inch notebooks or larger.

Intel Core 2 Duo T8100

► remove from comparison

The Intel Core 2 Duo T8100 is a mid-range dual-core processor for laptops from 2008. It is based on the Penryn core and offers all functions that were available at that time (e.g. Virtualization VT-x).

Intel Core 2 Duo T6600

► remove from comparison

The Intel Core 2 Duo T6600 is an entry to mid-range dual core processor for laptops. It is based on the Penryn architecture, but features only 2 MB level 2 cache and a mediocre clock rate of 2.2 GHz. Compared to the similar T6670, the T6600 does not feature Virtualization features in hardware and is speced at a lower maximum temperature.

The performance should be suited for non demanding applications like office, internet, entry level video editing or image correction. CPU intense games may be limited by the power of the T6600.

ModelAMD A6-4400MIntel Core 2 Duo T8100Intel Core 2 Duo T6600
CodenameTrinityPenrynPenryn
SeriesAMD AMD A-SeriesIntel Core 2 DuoIntel Core 2 Duo
Series: Core 2 Duo Penryn
AMD A10-4600M2.3 - 3.2 GHz4 / 4 cores
AMD A10-4657M2.3 - 3.2 GHz4 / 4 cores
AMD A10-4655M2 - 2.8 GHz4 / 4 cores
AMD A8-4500M1.9 - 2.8 GHz4 / 4 cores
AMD A8-4557M1.9 - 2.8 GHz4 / 4 cores
AMD A8-4555M1.6 - 2.4 GHz4 / 4 cores
AMD A6-4400M « 2.7 - 3.2 GHzcores
AMD A4-4300M2.5 - 3 GHzcores
AMD A6-4455M2.1 - 2.6 GHzcores
AMD A4-4355M1.9 - 2.4 GHzcores
Intel Core 2 Duo T99003.06 GHz2 / 2 cores
Intel Core 2 Duo T98002.92 GHz2 / 2 cores
Intel Core 2 Duo P97002.8 GHz2 / 2 cores
Intel Core 2 Duo T96002.8 GHz2 / 2 cores
Intel Core 2 Duo P96002.66 GHz2 / 2 cores
Intel Core 2 Duo T95502.66 GHz2 / 2 cores
Intel Core 2 Duo T95002.6 GHz2 / 2 cores
Intel Core 2 Duo SP96002.53 GHz2 / 2 cores
Intel Core 2 Duo P95002.53 GHz2 / 2 cores
Intel Core 2 Duo T94002.53 GHz2 / 2 cores
Intel Core 2 Duo P88002.66 GHz2 / 2 cores
Intel Core 2 Duo T93002.5 GHz2 / 2 cores
Intel Core 2 Duo P87002.53 GHz2 / 2 cores
Intel Core 2 Duo SP94002.4 GHz2 / 2 cores
Intel Core 2 Duo P86002.4 GHz2 / 2 cores
Intel Core 2 Duo T83002.4 GHz2 / 2 cores
Intel Core 2 Duo SP93002.26 GHz2 / 2 cores
Intel Core 2 Duo P84002.26 GHz2 / 2 cores
Intel Core 2 Duo P75702.26 GHz2 / 2 cores
Intel Core 2 Duo P75502.26 GHz2 / 2 cores
Intel Core 2 Duo T67702.3 GHz2 / 2 cores
Intel Core 2 Duo SL96002.13 GHz2 / 2 cores
Intel Core 2 Duo P74502.13 GHz2 / 2 cores
Intel Core 2 Duo T66702.2 GHz2 / 2 cores
Intel Core 2 Duo T66002.2 GHz2 / 2 cores
Intel Core 2 Duo T8100 « 2.1 GHz2 / 2 cores
Intel Core 2 Duo P73702 GHz2 / 2 cores
Intel Core 2 Duo P73502 GHz2 / 2 cores
Intel Core 2 Duo T65702.1 GHz2 / 2 cores
Intel Core 2 Duo T65002.1 GHz2 / 2 cores
Intel Core 2 Duo SL94001.86 GHz2 / 2 cores
Intel Core 2 Duo SL93801.8 GHz2 / 2 cores
Intel Core 2 Duo T64002 GHz2 / 2 cores
Intel Core 2 Duo SL93001.6 GHz2 / 2 cores
Intel Core 2 Duo SU96001.6 GHz2 / 2 cores
Intel Core 2 Duo SU94001.4 GHz2 / 2 cores
Intel Core 2 Duo SU73001.3 GHz2 / 2 cores
Intel Core 2 Duo SU93001.2 GHz2 / 2 cores
Intel Core 2 Duo T99003.06 GHz2 / 2 cores
Intel Core 2 Duo T98002.92 GHz2 / 2 cores
Intel Core 2 Duo P97002.8 GHz2 / 2 cores
Intel Core 2 Duo T96002.8 GHz2 / 2 cores
Intel Core 2 Duo P96002.66 GHz2 / 2 cores
Intel Core 2 Duo T95502.66 GHz2 / 2 cores
Intel Core 2 Duo T95002.6 GHz2 / 2 cores
Intel Core 2 Duo SP96002.53 GHz2 / 2 cores
Intel Core 2 Duo P95002.53 GHz2 / 2 cores
Intel Core 2 Duo T94002.53 GHz2 / 2 cores
Intel Core 2 Duo P88002.66 GHz2 / 2 cores
Intel Core 2 Duo T93002.5 GHz2 / 2 cores
Intel Core 2 Duo P87002.53 GHz2 / 2 cores
Intel Core 2 Duo SP94002.4 GHz2 / 2 cores
Intel Core 2 Duo P86002.4 GHz2 / 2 cores
Intel Core 2 Duo T83002.4 GHz2 / 2 cores
Intel Core 2 Duo SP93002.26 GHz2 / 2 cores
Intel Core 2 Duo P84002.26 GHz2 / 2 cores
Intel Core 2 Duo P75702.26 GHz2 / 2 cores
Intel Core 2 Duo P75502.26 GHz2 / 2 cores
Intel Core 2 Duo T67702.3 GHz2 / 2 cores
Intel Core 2 Duo SL96002.13 GHz2 / 2 cores
Intel Core 2 Duo P74502.13 GHz2 / 2 cores
Intel Core 2 Duo T66702.2 GHz2 / 2 cores
Intel Core 2 Duo T6600 « 2.2 GHz2 / 2 cores
Intel Core 2 Duo T81002.1 GHz2 / 2 cores
Intel Core 2 Duo P73702 GHz2 / 2 cores
Intel Core 2 Duo P73502 GHz2 / 2 cores
Intel Core 2 Duo T65702.1 GHz2 / 2 cores
Intel Core 2 Duo T65002.1 GHz2 / 2 cores
Intel Core 2 Duo SL94001.86 GHz2 / 2 cores
Intel Core 2 Duo SL93801.8 GHz2 / 2 cores
Intel Core 2 Duo T64002 GHz2 / 2 cores
Intel Core 2 Duo SL93001.6 GHz2 / 2 cores
Intel Core 2 Duo SU96001.6 GHz2 / 2 cores
Intel Core 2 Duo SU94001.4 GHz2 / 2 cores
Intel Core 2 Duo SU73001.3 GHz2 / 2 cores
Intel Core 2 Duo SU93001.2 GHz2 / 2 cores
Clock2700 - 3200 MHz2100 MHz2200 MHz
L2 Cache1 MB3 MB2 MB
Cores / Threads22 / 22 / 2
TDP35 Watt35 Watt35 Watt
Transistors1303 Million410 Million410 Million
Technology32 nm45 nm45 nm
Die Size246 mm2107 mm2107 mm2
FeaturesSSE (1, 2, 3, 3S, 4.1, 4.2, 4A), x86-64, AES, AVX, FMAVirtualization VT-x, Enhanced Speedstep, Execute Disable Bit, Idle StatesIntel 64, Enhanced Speedstep, Execute Disable Bit, SSE4.1
iGPUAMD Radeon HD 7520G (496 - 685 MHz)
Architecturex86x86x86
Announced
FSB800800
Voltage1.000V-1.250V V1.00-1.25V V
max. Temp.105 °C105 °C
SocketBGA479, PGA478PGA478
$209 U.S.
Manufacturerark.intel.comark.intel.com
L1 Cache128 KB

Benchmarks

Cinebench R11.5 - Cinebench R11.5 CPU Multi 64 Bit
min: 0.98     avg: 1.1     median: 1.1 (1%)     max: 1.14 Points
Cinebench R11.5 - Cinebench R11.5 CPU Single 64 Bit
0.8 Points (19%)
Cinebench R10 - Cinebench R10 Rend. Single (32bit)
min: 1829     avg: 2225     median: 2292 (14%)     max: 2384 Points
min: 2217     avg: 2310     median: 2320 (14%)     max: 2357 Points
min: 2308     avg: 2391     median: 2355 (14%)     max: 2631 Points
Cinebench R10 - Cinebench R10 Rend. Multi (32bit)
min: 3096     avg: 3344     median: 3407 (2%)     max: 3413 Points
min: 4102     avg: 4251     median: 4282 (3%)     max: 4332 Points
min: 4335     avg: 4525     median: 4472 (3%)     max: 4833 Points
Cinebench R10 - Cinebench R10 Rend. Multi (64bit)
min: 4161     avg: 4482     median: 4589 (3%)     max: 4590 Points
106%
1 T6600 +
min: 4229     avg: 4727     median: 4864.5 (3%)     max: 4948 Points
Cinebench R10 - Cinebench R10 Rend. Single (64bit)
min: 2948     avg: 3063     median: 3069.5 (4%)     max: 3165 Points
80%
1 T6600 +
min: 2257     avg: 2454     median: 2463 (3%)     max: 2633 Points
wPrime 2.10 - wPrime 2.0 1024m *
min: 1399     avg: 1528     median: 1520.5 (18%)     max: 1673 s
67%
1 T6600 +
min: 1190     avg: 2015     median: 2269 (27%)     max: 2331 s
wPrime 2.10 - wPrime 2.0 32m *
min: 42     avg: 47.1     median: 46.8 (9%)     max: 52.9 s
37.5 s (8%)
min: 37     avg: 63.1     median: 71.1 (14%)     max: 73.3 s
WinRAR - WinRAR 4.0
min: 1070     avg: 1353     median: 1353 (2%)     max: 1636 Points
X264 HD Benchmark 4.0 - x264 Pass 2
7.6 fps (0%)
X264 HD Benchmark 4.0 - x264 Pass 1
38.8 fps (1%)
TrueCrypt - TrueCrypt Serpent
min: 0.072     avg: 0.1     median: 0.1 (2%)     max: 0.0778 GB/s
TrueCrypt - TrueCrypt Twofish
min: 0.128     avg: 0.1     median: 0.1 (2%)     max: 0.135 GB/s
TrueCrypt - TrueCrypt AES
min: 0.63     avg: 0.7     median: 0.7 (2%)     max: 0.689 GB/s
3DMark 06 - CPU - 3DMark 06 - CPU
min: 1781     avg: 1800     median: 1804 (4%)     max: 1811 Points
min: 1764     avg: 1851     median: 1878 (4%)     max: 1909 Points
min: 1852     avg: 1942     median: 1947 (4%)     max: 1989 Points
Super Pi mod 1.5 XS 1M - Super Pi mod 1.5 XS 1M *
min: 31     avg: 32.7     median: 31.6 (7%)     max: 36.48 s
min: 23     avg: 23.4     median: 23.1 (5%)     max: 24.23 s
min: 22     avg: 23     median: 23 (5%)     max: 24 s
Super Pi mod 1.5 XS 2M - Super Pi mod 1.5 XS 2M *
min: 70     avg: 73.3     median: 70.9 (3%)     max: 81.3 s
min: 54.6     avg: 55.2     median: 55 (2%)     max: 56 s
min: 54     avg: 59     median: 60.5 (3%)     max: 61 s
Super Pi Mod 1.5 XS 32M - Super Pi mod 1.5 XS 32M *
min: 1798     avg: 1848     median: 1806.5 (8%)     max: 1980 s
1347 s (6%)
min: 1322     avg: 1334     median: 1334.5 (6%)     max: 1343 s
SiSoft Sandra Dhrystone (MIPS) - SiSoft Sandra Dhrystone (MIPS)
18210 MIPS (9%)
19291 MIPS (9%)
min: 20109     avg: 20199     median: 20216 (10%)     max: 20254 MIPS
SiSoft Sandra Whetstone (MFLOPS) - SiSoft Sandra Whetstone (MFLOPS)
12380 MFLOPS (9%)
15392 MFLOPS (12%)
min: 14760     avg: 15060     median: 15119.5 (12%)     max: 15241 MFLOPS
PCMark 05 - PCMark 05 - Standard
100%
1 T8100 +
min: 3250     avg: 4504     median: 4605 (10%)     max: 5677 Points
103%
1 T6600 +
min: 3511     avg: 4691     median: 4746.5 (10%)     max: 5758 Points
Windows Vista Experience Index - Windows Vista Leistungsindex - Prozessor
100%
1 T8100 +
min: 4     avg: 4.8     median: 5 (71%)     max: 5.1 Points
Windows 7 Experience Index - Win7 CPU
min: 5.5     avg: 5.6     median: 5.6 (72%)     max: 5.6 Points
102%
1 T6600 +
min: 5.6     avg: 5.7     median: 5.7 (73%)     max: 5.7 Points
3DMark Vantage - 3DM Vant. Perf. CPU no Physx
min: 3183     avg: 3308     median: 3304 (3%)     max: 3451 Points
4046 Points (3%)
min: 4198     avg: 4217     median: 4216.5 (3%)     max: 4235 Points
3DMark 11 - 3DM11 Performance Physics
min: 1193     avg: 1380     median: 1403 (3%)     max: 1512 Points
3DMark - 3DMark Ice Storm Physics
13531 Points (11%)
3DMark - 3DMark Cloud Gate Physics
1004 Points (3%)

Average Benchmarks AMD A6-4400M → 100% n=10

Average Benchmarks Intel Core 2 Duo T8100 → 121% n=10

Average Benchmarks Intel Core 2 Duo T6600 → 116% n=10

- Range of benchmark values for this graphics card
red legend - Average benchmark values for this graphics card
* Smaller numbers mean a higher performance
1 This benchmark is not used for the average calculation

v1.33
log 11. 15:59:58

#0 ran 0s before starting gpusingle class +0s ... 0s

#1 checking url part for id 3101 +0s ... 0s

#2 checking url part for id 380 +0s ... 0s

#3 checking url part for id 485 +0s ... 0s

#4 redirected to Ajax server, took 1757599198s time from redirect:0 +0s ... 0s

#5 did not recreate cache, as it is less than 5 days old! Created at Wed, 10 Sep 2025 11:38:25 +0200 +0s ... 0s

#6 composed specs +0.006s ... 0.007s

#7 did output specs +0s ... 0.007s

#8 getting avg benchmarks for device 3101 +0.001s ... 0.007s

#9 got single benchmarks 3101 +0.008s ... 0.016s

#10 getting avg benchmarks for device 380 +0.001s ... 0.016s

#11 got single benchmarks 380 +0.011s ... 0.027s

#12 getting avg benchmarks for device 485 +0.001s ... 0.028s

#13 got single benchmarks 485 +0.012s ... 0.04s

#14 got avg benchmarks for devices +0s ... 0.04s

#15 min, max, avg, median took s +0.022s ... 0.062s

#16 return log +0s ... 0.062s

Please share our article, every link counts!
Mail Logo
> Expert Reviews and News on Laptops, Smartphones and Tech Innovations > Benchmarks / Tech > Processor Comparison - Head 2 Head
Redaktion, 2017-09- 8 (Update: 2023-07- 1)