Notebookcheck Logo

AMD A10-9600P vs AMD A10-8700P vs AMD Pro A8-8600B

AMD A10-9600P

► remove from comparison AMD A10-9600P

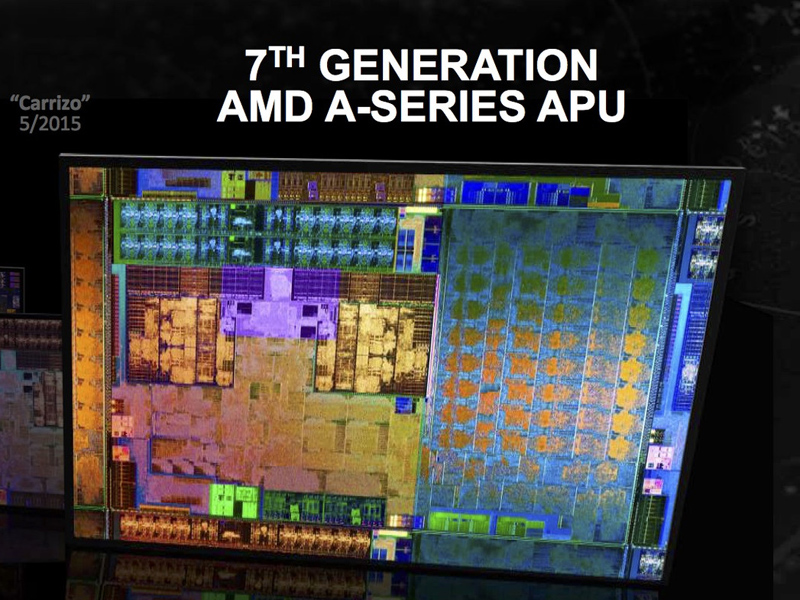
The AMD A10-9600P is a mid-range APU of the Bristol Ridge series (7th generation of APUs) with 4 CPU-cores (two Excavator modules) clocked at 2.4 - 3.3 GHz. It was announced in mid 2016 and is based on the same silicon as Carrizo but with more and refined features. It is a ULV-chip with a TDP of 15 Watt and integrates a Radeon R5 graphics card (384 shader cores / 6 compute cores) and a dual-channel DDR4-1866 memory controller. As Carrizo its a full featured SoC that offers all I/O ports on the chip.

The A10-9600P is slightly faster than the old 15-Watt top model of Carrizo, the FX-8800P. Therefore, the CPU performance is similar to a Broadwell 15 Watt Core i3 like The i3-5010U. See our Bristol Ridge article for more information on the architecture and improvements compared to Carrizo.

AMD A10-8700P

► remove from comparison AMD A10-8700P

The AMD A10-8700P is a mid-range Carrizo APU of 2015 for mainstream laptops. It is a SoC containing two Excavator CPU modules (with 4 integer and 2 FP units counted as 4 compute cores), a Radeon R7 graphics card with 6 compute cores (384 shaders), a DDR3-2133 (35 Watt cTDP) memory controller and a video engine (including UVD 6 with hardware HEVC / H.265 decoding).

The performances of the CPU and GPU cores depend on the configurable TDP. This cTDP can range from 12 to 35 Watts depending on the cooling solution and size of the laptop. Thus, clock speeds of the compute cores will vary. E.g., the GPU can score between 1764 points (15 Watts) to 2359 points (+34% with 35 Watt cTDP) in 3DMark 11 (P). CPU performance with a 35 Watt cTDP should be slightly above the Kaveri A10-7400P. If configured at 15 Watts, the CPU should be clearly slower as the Boost speed cannot be maintained for extended periods.

More technical details and features of the 6th generation of APUs (Carrizo) can be found in our launch article.

AMD Pro A8-8600B

► remove from comparison AMD Pro A8-8600B

The AMD Pro A8-8600B is a mid-range Carrizo APU of 2015 for business laptops. It is a SoC that contains two Excavator CPU modules (with 4 integer and 2 FP units counted as 4 compute cores), a Radeon R7 graphics card with 6 compute cores (384 shaders), a DDR3-2133 (35 Watt cTDP) memory controller and a video engine (including UVD 6 with hardware HEVC / H.265 decoding). Compared to the faster A10-8700P, the A8-8600B features a slower clocked CPU and GPU. It is similar to the consumer version, the A8-8600P, but offers business support and a ensure a long-tail support program. 

The performances of the CPU and GPU cores depend on the configurable TDP. This cTDP can range from 12 to 35 Watts depending on the cooling solution and size of the laptop. The faster Carrizo models gain about 35% in 3DMark 11 depending on the cTDP and results for the A8-8600B model should be similar.

More technical details and features of the 6th generation of APUs (Carrizo) can be found in our launch article.

ModelAMD A10-9600PAMD A10-8700PAMD Pro A8-8600B
CodenameBristol RidgeCarrizoCarrizo
SeriesAMD Bristol RidgeAMD CarrizoAMD Carrizo
Series: Carrizo Carrizo
AMD FX-9830P3 - 3.7 GHz4 / 4 cores
AMD PRO A12-9830B3 - 3.7 GHz4 / 4 cores
AMD FX-9800P2.7 - 3.6 GHz4 / 4 cores
AMD PRO A12-9800B2.7 - 3.6 GHz4 / 4 cores
AMD A12-9720P2.7 - 3.6 GHz4 / 4 cores
AMD A12-9700P2.5 - 3.4 GHz4 / 4 cores
AMD A10-9620P2.5 - 3.4 GHz4 / 4 cores
AMD A10-9600P « 2.4 - 3.3 GHz4 / 4 cores
AMD PRO A8-9600B2.4 - 3.3 GHz4 / 4 cores
AMD FX-8800P2.1 - 3.4 GHz4 / 4 cores
AMD Pro A12-8800B2.1 - 3.4 GHz4 / 4 cores
AMD A10-8700P « 1.8 - 3.2 GHz4 / 4 cores
AMD Pro A10-8700B1.8 - 3.2 GHz4 / 4 cores
AMD A8-8600P1.6 - 3 GHz4 / 4 cores
AMD Pro A8-8600B1.6 - 3 GHz4 / 4 cores
AMD A6-8500P1.6 - 3 GHz2 / 2 cores
AMD Pro A6-8500B1.6 - 3 GHz2 / 2 cores
AMD FX-8800P2.1 - 3.4 GHz4 / 4 cores
AMD Pro A12-8800B2.1 - 3.4 GHz4 / 4 cores
AMD A10-8700P1.8 - 3.2 GHz4 / 4 cores
AMD Pro A10-8700B1.8 - 3.2 GHz4 / 4 cores
AMD A8-8600P1.6 - 3 GHz4 / 4 cores
AMD Pro A8-8600B « 1.6 - 3 GHz4 / 4 cores
AMD A6-8500P1.6 - 3 GHz2 / 2 cores
AMD Pro A6-8500B1.6 - 3 GHz2 / 2 cores
Clock2400 - 3300 MHz1800 - 3200 MHz1600 - 3000 MHz
L2 Cache2 MB2 MB2 MB
Cores / Threads4 / 44 / 44 / 4
TDP15 Watt15 Watt15 Watt
Transistors3100 Million3100 Million3100 Million
Technology28 nm28 nm28 nm
Die Size250 mm2
max. Temp.90 °C
FeaturesDual-Channel DDR3/DDR4-1866 Memory Controller, PCIe 3.0 x8HSA 1.0HSA 1.0
iGPUAMD Radeon R5 (Bristol Ridge) ( - 720 MHz)AMD Radeon R6 (Carrizo) ( - 800 MHz)AMD Radeon R6 (Carrizo) ( - 720 MHz)
Architecturex86x86x86
Announced
Manufacturerproducts.amd.comproducts.amd.com
SocketFP4 BGAFP4 BGA

Benchmarks

Cinebench R15 - Cinebench R15 CPU Multi 64 Bit
min: 195     avg: 211     median: 216 (1%)     max: 217 Points
min: 175     avg: 190.1     median: 194 (1%)     max: 198 Points
181 Points (1%)
Cinebench R15 - Cinebench R15 CPU Single 64 Bit
min: 70     avg: 74.8     median: 76 (21%)     max: 77 Points
min: 59     avg: 67.6     median: 69 (19%)     max: 75 Points
69 Points (19%)
Cinebench R11.5 - Cinebench R11.5 CPU Multi 64 Bit
min: 2.59     avg: 2.6     median: 2.6 (3%)     max: 2.6 Points
min: 2.12     avg: 2.3     median: 2.3 (3%)     max: 2.36 Points
2.2 Points (3%)
Cinebench R11.5 - Cinebench R11.5 CPU Single 64 Bit
min: 0.87     avg: 0.9     median: 0.9 (21%)     max: 0.9 Points
min: 0.68     avg: 0.8     median: 0.9 (20%)     max: 0.89 Points
0.8 Points (19%)
Cinebench R10 - Cinebench R10 Rend. Single (32bit)
min: 2340     avg: 2439     median: 2447 (15%)     max: 2520 Points
min: 2170     avg: 2294     median: 2334 (14%)     max: 2389 Points
2111 Points (13%)
Cinebench R10 - Cinebench R10 Rend. Multi (32bit)
min: 5913     avg: 6467     median: 6508 (5%)     max: 6939 Points
min: 4808     avg: 6140     median: 6394 (5%)     max: 6443 Points
5885 Points (4%)
Cinebench R10 - Cinebench R10 Rend. Multi (64bit)
min: 8279     avg: 8769     median: 8924.5 (6%)     max: 8949 Points
Cinebench R10 - Cinebench R10 Rend. Single (64bit)
min: 3080     avg: 3212     median: 3251.5 (4%)     max: 3264 Points
wPrime 2.10 - wPrime 2.0 1024m *
534 s (6%)
min: 507     avg: 536     median: 509 (6%)     max: 591 s
587 s (7%)
wPrime 2.10 - wPrime 2.0 32m *
15.3 s (3%)
min: 16.56     avg: 17.1     median: 17.2 (3%)     max: 17.47 s
18.8 s (4%)
WinRAR - WinRAR 4.0
1526 Points (2%)
min: 1293     avg: 1316     median: 1328 (2%)     max: 1328 Points
1330 Points (2%)
X264 HD Benchmark 4.0 - x264 Pass 2
16.3 fps (0%)
min: 15     avg: 15.1     median: 15.1 (0%)     max: 15.23 fps
13.5 fps (0%)
X264 HD Benchmark 4.0 - x264 Pass 1
85.4 fps (2%)
min: 72.2     avg: 73.5     median: 73.7 (2%)     max: 74.4 fps
67.5 fps (2%)
TrueCrypt - TrueCrypt Serpent
0.2 GB/s (6%)
min: 0.18     avg: 0.2     median: 0.2 (5%)     max: 0.188 GB/s
0.2 GB/s (5%)
TrueCrypt - TrueCrypt Twofish
0.3 GB/s (6%)
min: 0.28     avg: 0.3     median: 0.3 (5%)     max: 0.303 GB/s
0.3 GB/s (5%)
TrueCrypt - TrueCrypt AES
1.5 GB/s (4%)
min: 1.4     avg: 1.5     median: 1.5 (4%)     max: 1.5 GB/s
1.3 GB/s (3%)
3DMark 06 - CPU - 3DMark 06 - CPU
min: 2969     avg: 3224     median: 3287 (7%)     max: 3352 Points
min: 2776     avg: 2985     median: 2977.5 (6%)     max: 3186 Points
Super Pi mod 1.5 XS 1M - Super Pi mod 1.5 XS 1M *
18.7 s (4%)
min: 19.91     avg: 20.6     median: 20.5 (4%)     max: 22.25 s
21.7 s (5%)
Super Pi mod 1.5 XS 2M - Super Pi mod 1.5 XS 2M *
41.3 s (2%)
min: 44.38     avg: 46.1     median: 44.8 (2%)     max: 50.4 s
46.7 s (2%)
Super Pi Mod 1.5 XS 32M - Super Pi mod 1.5 XS 32M *
942 s (4%)
min: 954     avg: 984     median: 964 (4%)     max: 1072 s
1006 s (4%)
3DMark Vantage - 3DM Vant. Perf. CPU no Physx
min: 7115     avg: 7516     median: 7515.5 (6%)     max: 7916 Points
min: 6309     avg: 6653     median: 6586 (5%)     max: 7129 Points
3DMark 11 - 3DM11 Performance Physics
min: 2246     avg: 2418     median: 2387 (6%)     max: 2634 Points
min: 1794     avg: 2134     median: 2150.5 (5%)     max: 2310 Points
2034 Points (5%)
3DMark - 3DMark Ice Storm Physics
min: 21570     avg: 23140     median: 23093 (19%)     max: 24803 Points
min: 13862     avg: 19941     median: 20873.5 (17%)     max: 22998 Points
3DMark - 3DMark Ice Storm Extreme Physics
min: 18940     avg: 21504     median: 21065.5 (17%)     max: 24944 Points
min: 13248     avg: 20904     median: 21997.5 (18%)     max: 23111 Points
3DMark - 3DMark Ice Storm Unlimited Physics
min: 22601     avg: 25235     median: 26061 (21%)     max: 26217 Points
min: 21515     avg: 23082     median: 23204 (19%)     max: 24168 Points
3DMark - 3DMark Cloud Gate Physics
min: 1722     avg: 2000     median: 2031.5 (5%)     max: 2214 Points
min: 1774     avg: 1897     median: 1903 (5%)     max: 2007 Points
3DMark - 3DMark Fire Strike Standard Physics
min: 2455     avg: 2912     median: 2981 (5%)     max: 3229 Points
min: 2456     avg: 2673     median: 2685 (5%)     max: 2803 Points
3DMark - 3DMark Time Spy CPU
1045 Points (4%)
Geekbench 4.0 - Geekbench 4.0 64 Bit Single-Core
2047 Points (23%)
1896 Points (21%)
Geekbench 4.0 - Geekbench 4.0 64 Bit Multi-Core
4711 Points (6%)
3736 Points (5%)
Geekbench 3 - Geekbench 3 32 Bit Multi-Core
min: 5252     avg: 5386     median: 5423 (10%)     max: 5445 Points
min: 4550     avg: 4670     median: 4676.5 (8%)     max: 4775 Points
4173 Points (7%)
Geekbench 3 - Geekbench 3 32 Bit Single-Core
min: 2000     avg: 2064     median: 2074 (27%)     max: 2109 Points
min: 1941     avg: 1974     median: 1975 (26%)     max: 2006 Points
1858 Points (24%)
Geekbench 3 - Geekbench 3 64 Bit Multi-Core
5702 Points (9%)
min: 4832     avg: 5014     median: 5105 (8%)     max: 5105 Points
Geekbench 3 - Geekbench 3 64 Bit Single-Core
2237 Points (33%)
min: 2065     avg: 2135     median: 2170 (32%)     max: 2170 Points
Geekbench 2 - 32 Bit - Geekbench Stream
3604 Points (19%)
Geekbench 2 - 32 Bit - Geekbench Memory
3144 Points (22%)
Geekbench 2 - 32 Bit - Geekbench Floating Point
5636 Points (11%)
Geekbench 2 - 32 Bit - Geekbench Integer
5024 Points (10%)
Geekbench 2 - 32 Bit - Geekbench Total Score
4720 Points (12%)
Mozilla Kraken 1.1 - Kraken 1.1 Total Score *
min: 2098     avg: 2251     median: 2328 (3%)     max: 2328 ms
min: 2229     avg: 2673     median: 2285.5 (3%)     max: 3488 ms
3826 ms (4%)
Sunspider - Sunspider 1.0 Total Score *
min: 133.3     avg: 138.2     median: 133.3 (1%)     max: 148.1 ms
min: 154     avg: 203     median: 164.3 (2%)     max: 363.6 ms
196.2 ms (2%)
Octane V2 - Octane V2 Total Score
min: 18921     avg: 19501     median: 19791 (14%)     max: 19791 Points
min: 8324     avg: 11931     median: 11800 (9%)     max: 15801 Points
8351 Points (6%)

Average Benchmarks AMD A10-9600P → 100% n=23

Average Benchmarks AMD A10-8700P → 91% n=23

Average Benchmarks AMD Pro A8-8600B → 82% n=23

- Range of benchmark values for this graphics card
red legend - Average benchmark values for this graphics card
* Smaller numbers mean a higher performance
1 This benchmark is not used for the average calculation

v1.33
log 29. 14:36:19

#0 ran 0s before starting gpusingle class +0s ... 0s

#1 checking url part for id 8094 +0s ... 0s

#2 checking url part for id 6845 +0s ... 0s

#3 checking url part for id 7009 +0s ... 0s

#4 redirected to Ajax server, took 1759149379s time from redirect:0 +0s ... 0s

#5 did not recreate cache, as it is less than 5 days old! Created at Mon, 29 Sep 2025 12:06:34 +0200 +0s ... 0s

#6 composed specs +0.007s ... 0.007s

#7 did output specs +0s ... 0.007s

#8 getting avg benchmarks for device 8094 +0.001s ... 0.008s

#9 got single benchmarks 8094 +0.009s ... 0.016s

#10 getting avg benchmarks for device 6845 +0.001s ... 0.017s

#11 got single benchmarks 6845 +0.01s ... 0.027s

#12 getting avg benchmarks for device 7009 +0.001s ... 0.027s

#13 got single benchmarks 7009 +0.003s ... 0.031s

#14 got avg benchmarks for devices +0s ... 0.031s

#15 min, max, avg, median took s +0.039s ... 0.07s

#16 return log +0s ... 0.07s

Please share our article, every link counts!
Mail Logo
> Expert Reviews and News on Laptops, Smartphones and Tech Innovations > Benchmarks / Tech > Processor Comparison - Head 2 Head
Redaktion, 2017-09- 8 (Update: 2023-07- 1)