Trinity in Review: AMD A10-4600M APU
"The whole is greater than the sum of its parts."
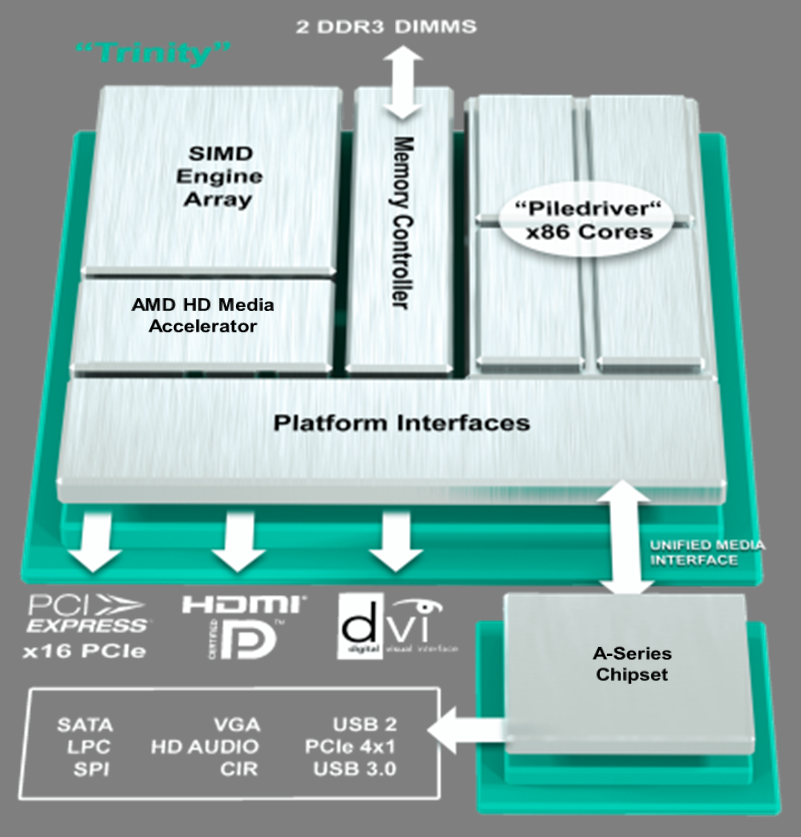
Aristotle's infamous words of wisdom perfectly describe AMD's new 2012 A series platform. Codenamed Trinity, the architectural goals remain true to the Fusion platform - to offer a system-on-chip with an integrated graphics processing unit and a variety of multimedia features at relatively low power requirements and less generated heat.
According to AMD, the new APUs should offer even more performance per watt than its predecessors and should be able to stand toe-to-toe with certain Intel offerings.
First, let's start by taking a look at the technical specifications of the APUs (Accelerated Processing Units) in question:
Specifications
- 32 nm SOI process
- 1.303 billion transistors
- 246 mm² Die size
- 2nd Generation Bulldozer cores ("Piledriver")
- 1 or 2 modules (2 or 4 Integer cores)
- up to 4 MB L2 cache
- DirectX 11 GPU with 192, 256 or 384 Shader ALUs (VLIW4 units)
- UVD3 as well as Accelerated Video Converter
- Memory controller supports up to DDR3(L)-1600 / DDR3U-1333
- SSE support (1, 2, 3, 3S, 4.1, 4.2, 4A), x86-64, AES, AVX, FMA
- TDP value of 17, 25 and 35 watts
Model Overview
| Description | Module/Core | Base clock | max. Turbo | L2 cache | TDP | Graphics | Memory |
|---|---|---|---|---|---|---|---|
| A10-4600M | 2/4 | 2.3 GHz | 3.2 GHz | 4 MB | 35 W | HD 7660G | DDR3(L)-1600 |
| A8-4500M | 2/4 | 1.9 GHz | 2.8 GHz | 4 MB | 35 W | HD 7640G | DDR3(L)-1600 |
| A6-4400M | 1/2 | 2.7 GHz | 3.2 GHz | 1 MB | 35 W | HD 7520G | DDR3(L)-1600 |
| A10-4655M | 2/4 | 2.0 GHz | 2.8 GHz | 4 MB | 25 W | HD 7620G | DDR3(L)-1333 |
| A6-4455M | 1/2 | 2.1 GHz | 2.6 GHz | 2 MB | 17 W | HD 7500G | DDR3(L)-1333 |
The Processor Core
The processor design of the last generation Llano die is nearly identical to the older K10.5 cores from the Phenom II and Turion II era. For Trinity, AMD has dropped the similarities altogether and has instead built the chip from the ground up based around the more recent Bulldozer architecture as utilized by the manufacturer's FX lineup of CPUs.
Consequently, when compared to Llano, the most notable and significant change in Trinity is its step towards processing modules instead of using traditional processing cores. Each module, according to AMD, uses CMT (Cluster-based Multithreading) technology and contains two cores with their own respective integer unit. However, the two cores must share access to a decoder, FPU and L2 cache. In this sense, a module cannot be considered a "true" dual-core processor and in practice actually achieves around 80 percent of the performance of a traditional dual-core CPU depending on the application.
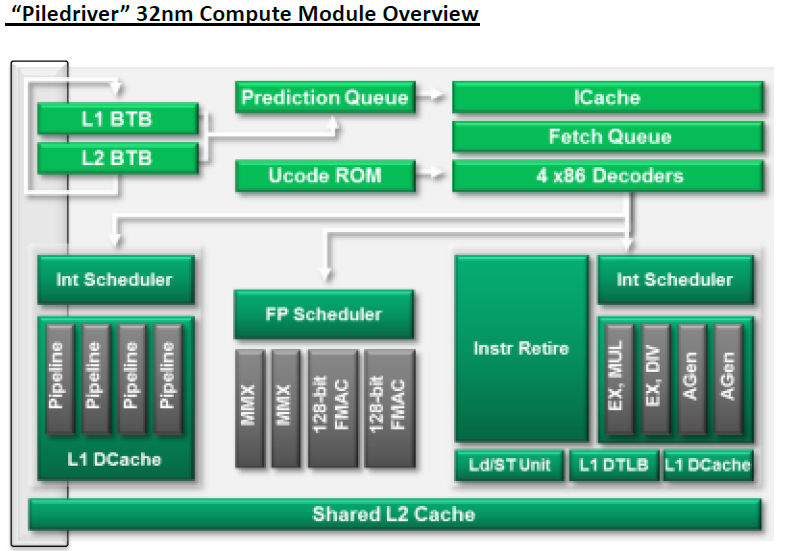
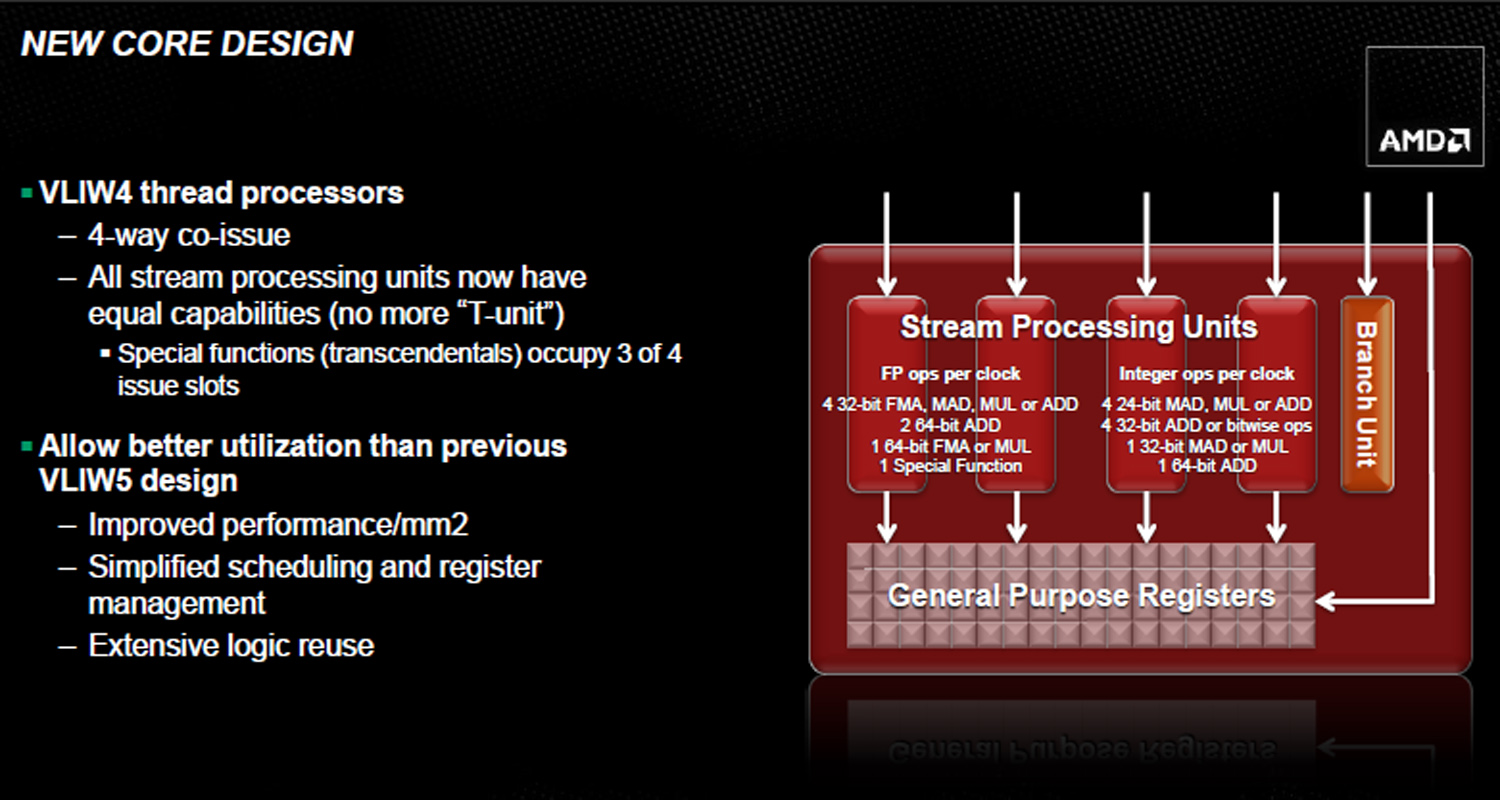
In comparison to Bulldozer, the Trinity cores themselves (codenamed Piledriver) have been slightly modified for increased megahertz performance without unnecessary increases in power requirements. IPC boost is supported as well, but the performance gains here are not as significant when compared to what full-size Bulldozer desktop APUs are capable of. The diagram below introduces the individual changes done to the new cores.
Furthermore, the Trinity core continues Llano's legacy of having no available L3 cache. Memory modules have also remained untouched - expect the same 16KB L1 data cache per module, 64KB L1 instruction cache and a 2MB L2 cache. In return, the chipset does offer integrated support for the Advanced Encryption Standard (AES), Advanced Vector eXtensions (AVX) and even the FMA3 instruction set. In this regard, AMD has a leg up against Intel.
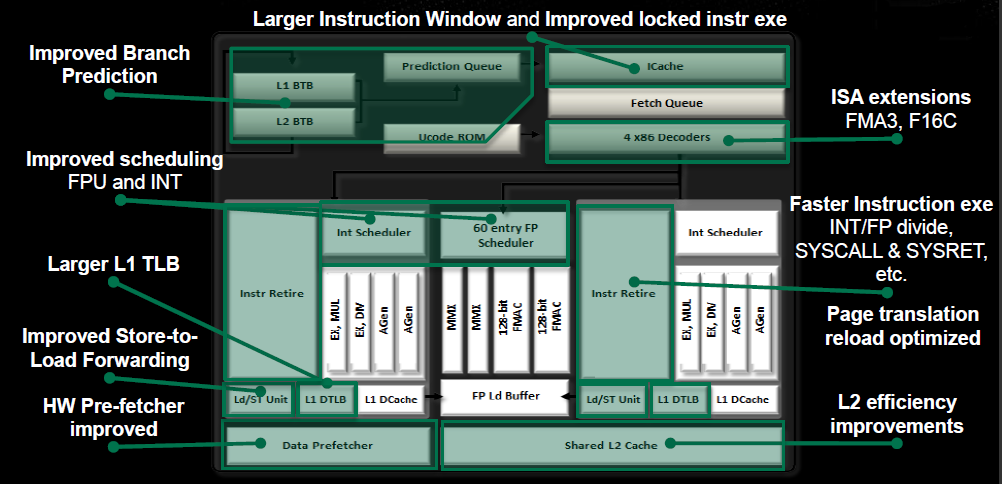
Turbo Core 3.0
Turbo Core 3.0 is AMD's equivalent of Intel's Turbo Boost. This technology allows the APU to automatically overclock certain parts of the chipset to increase overall performance. Like the Intel Sandy Bridge and Ivy Bridge processors, AMD can also overclock the processor cores and/or graphics core as long as there is thermal headroom. Depending on the demand, the CPU can overclock from 2.3GHz up to 3.2GHz and the GPU from 496MHz to 685MHz. AMD boasts of up to 20 percent more performance in certain areas with Turbo Core 3.0 (see AMD diagram below).
The Graphics Core
The top Llano models make use of the Radeon HD 6620G which, even after nearly a year after its release, can still compete with the best IGPs.
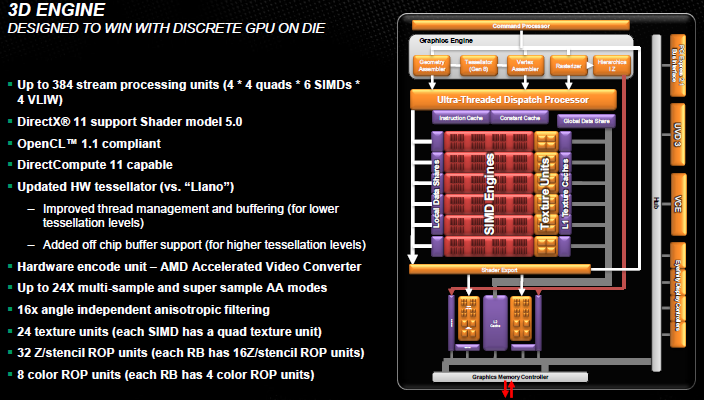
To catch up to Intel and its HD 4000 graphics, AMD has made significant changes and has improved the DirectX 11-ready Trinity IGP. The graphics core utilizes a new architecture that primarily affects the structuring of shader ALUs.
Previous GPUs as found in Llano cores use VLIW5 units that were introduced during the Radeon HD 5000 "Evergreen" series. Now, AMD has taken the liberty to install the VLIW4 structure into the Trinity GPU. This would imply that the Trinity IGP has its roots to the Radeon HD 6900 "Northern Islands" desktop series instead of the more recent 28nm GCN architecture. While this may likely disappoint some readers, it's worth noting that AMD had probably laid out the groundwork for Trinity much before GCN became widely available.
The fastest IGP (Radeon HD 7660G) in our benchmarks uses 96 4D shaders (vs. 80 5D shaders of Llano) 384 ALUs (vs. 80 5D shaders and 400 ALUs of Llano), 24 TMUs and 8 ROPs. AMD makes up for the fewer ALUs with the more proven VLIW4 architecture and has sped up clock speeds up to 686 MHz with Turbo Core (Llano: 444 MHz, no Turbo). In addition, the IGP has an improved Tessellator and the Frontend has been upgraded - both of which should increase performance. The biggest bottleneck here would likely be the small memory interface (maximum DDR3-1600) as there is no L3 cache nor is the IGP allowed to access CPU cache. As a result, this will significantly drop the performance of the IGP if the notebook only has a single RAM module. All-in-all, the move from Llano to Trinity is similar to the move from Radeon HD 5870 to HD 6970 (both of which have 4x the shaders of the respective APU).
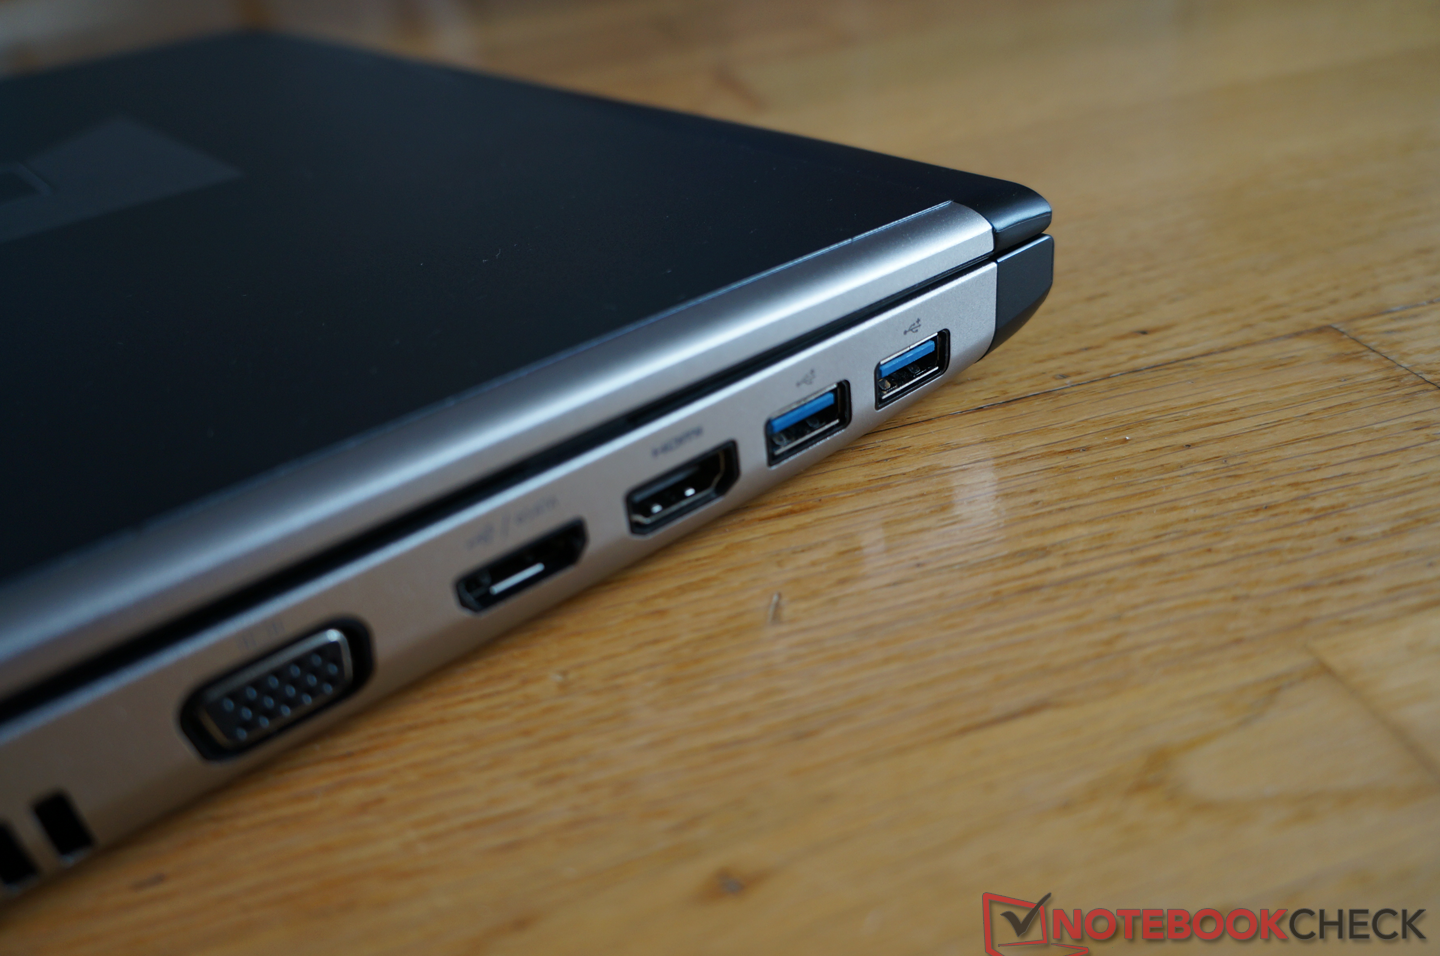
The new GPU offers more performance and a bundle of new features. For example, the familiar Eyefinity has now been introduced to APUs and the user will be able to connect up to 4 displays as long as there are enough display interfaces. The display output can be provided by VGA, HDMI and DisplayPort 1.2. In addition, 7.1 surround sound can be outputted in many supported formats (PCM, AC-3, AAC, DTS, Dolby TrueHD, DTS Master) with up to 4 simultaneous and independent streams.
AMD's Dual Graphics refers to a Crossfire connection between the APU and a dedicated graphics card. Sadly, in past testing, we found too many flaws with this setup. The technology looks good on paper, but the performance is limited by many restrictions in practice. For example, micro-stutters plague performance and there can sometimes be serious driver issues. For better or worse, AMD has installed this feature in Trinity as to allow a variety of Radeon GPUs (from the Radeon HD 7450M to an HD 7670M) to work in tandem with the IGP. The technology works despite the different VLIW4 and VLIW5 architectures as each card processes on its own in accordance to the AFR method. Unfortunately, the new GCN-based 7700M, 7800M and 7900M models cannot be used in Crossfire with the IGP.
Test System
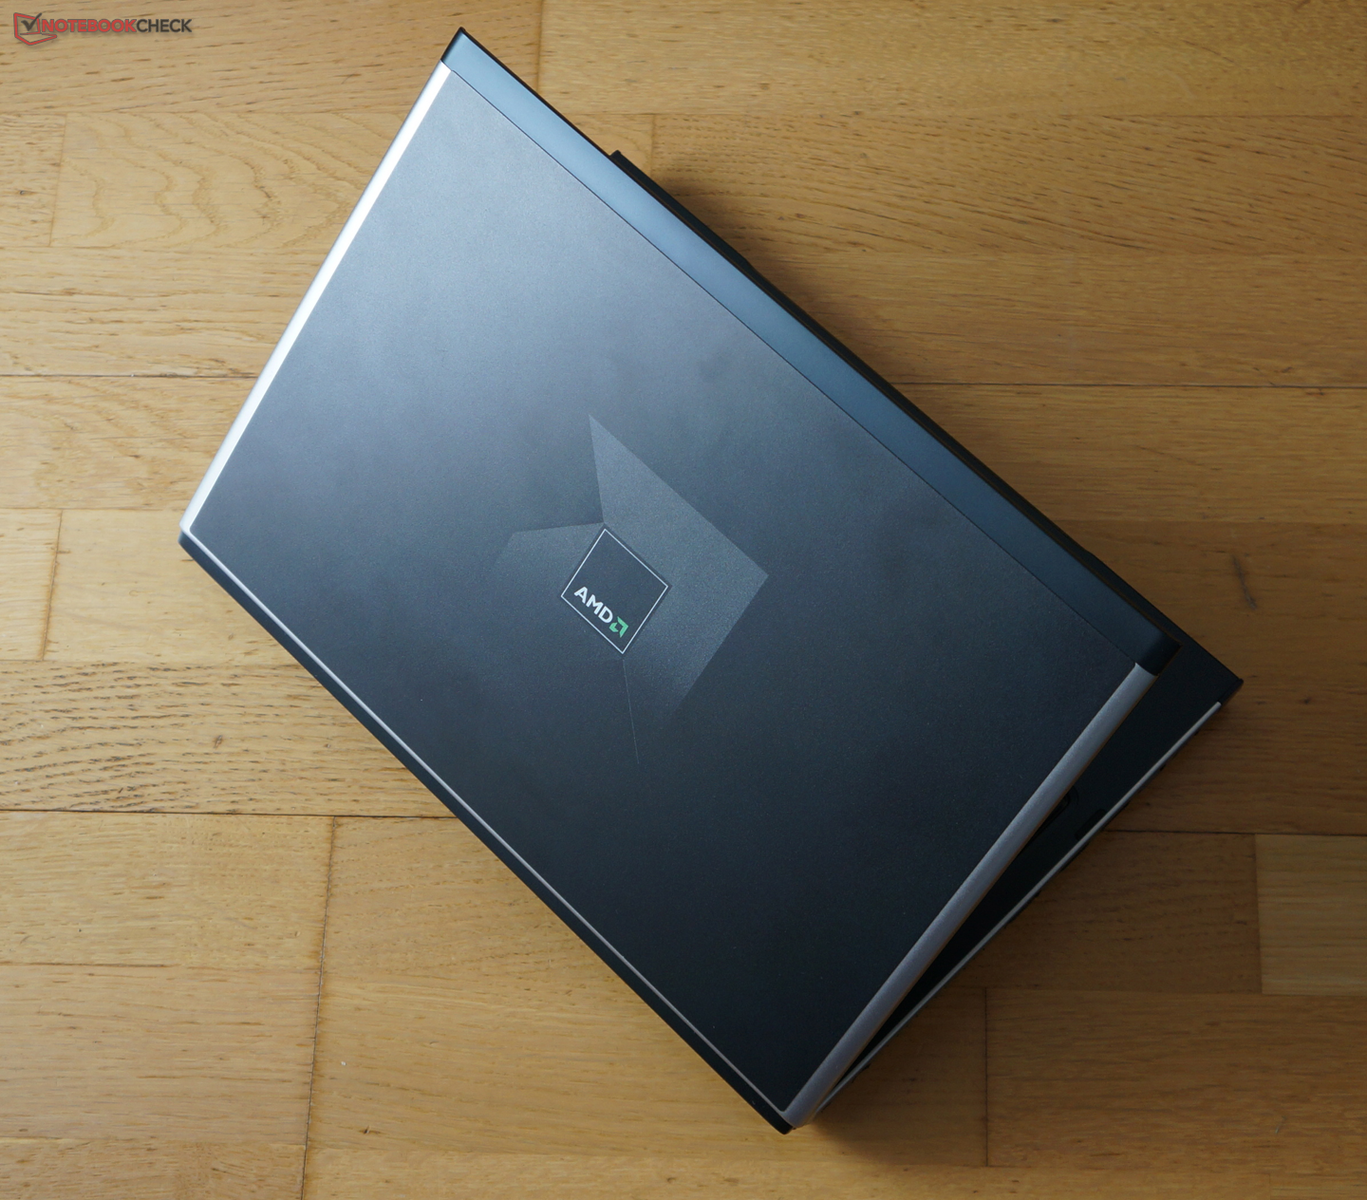
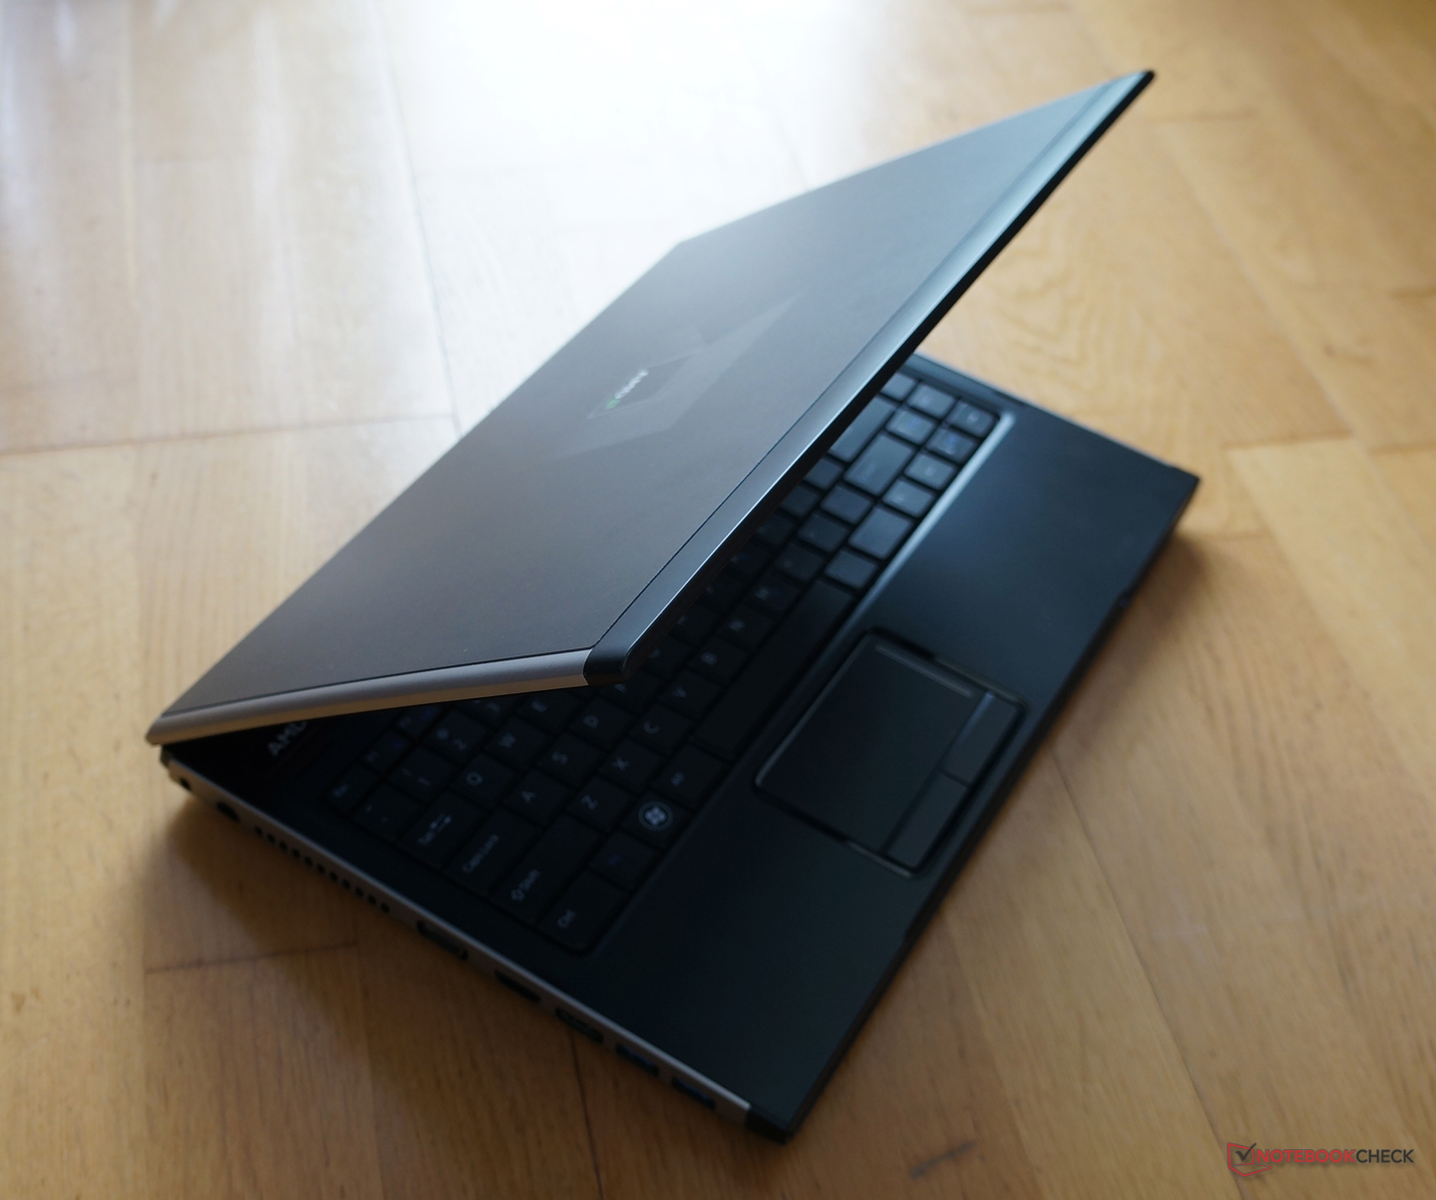
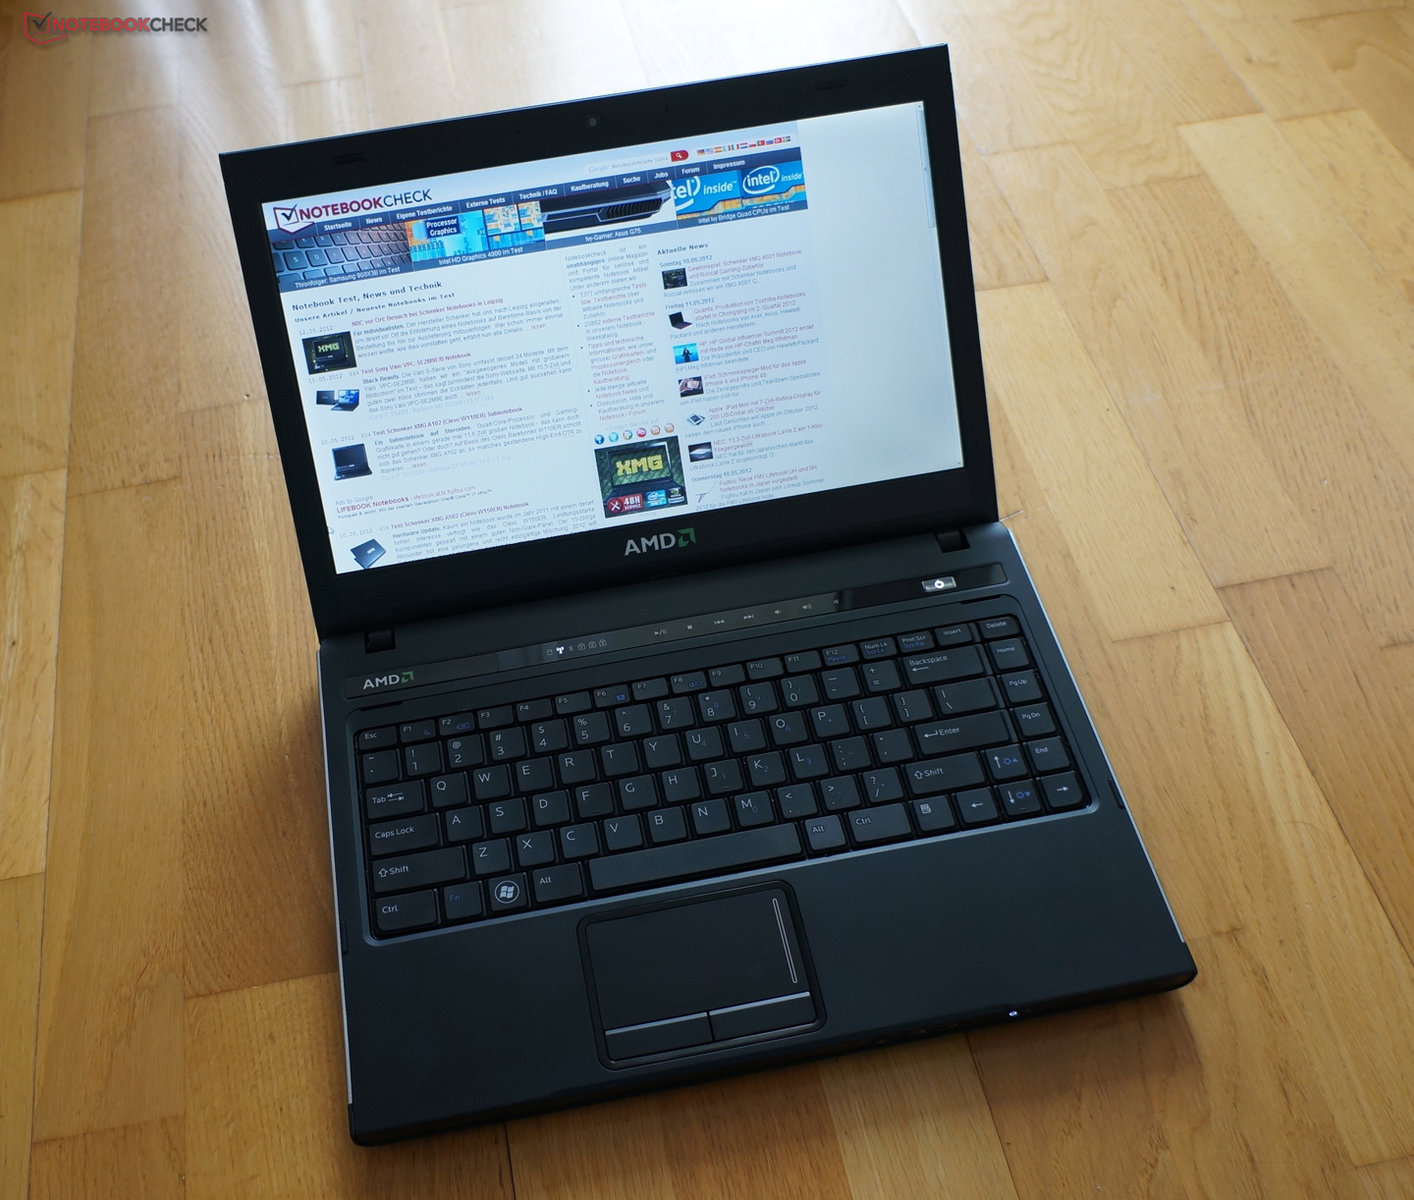
AMD has provided us with a notebook specifically designed for testing the performance of the APU in question. The test model uses a Dell Vostro chassis that will not be available to the general consumer according to AMD. This particular model is equipped with:
- AMD A10-4600M APU Quad-Core: 2.3 - 3.2 GHz
- Integrated AMD Radeon HD 7660G: base speed - 497 MHz / maximum speed - 686 MHz
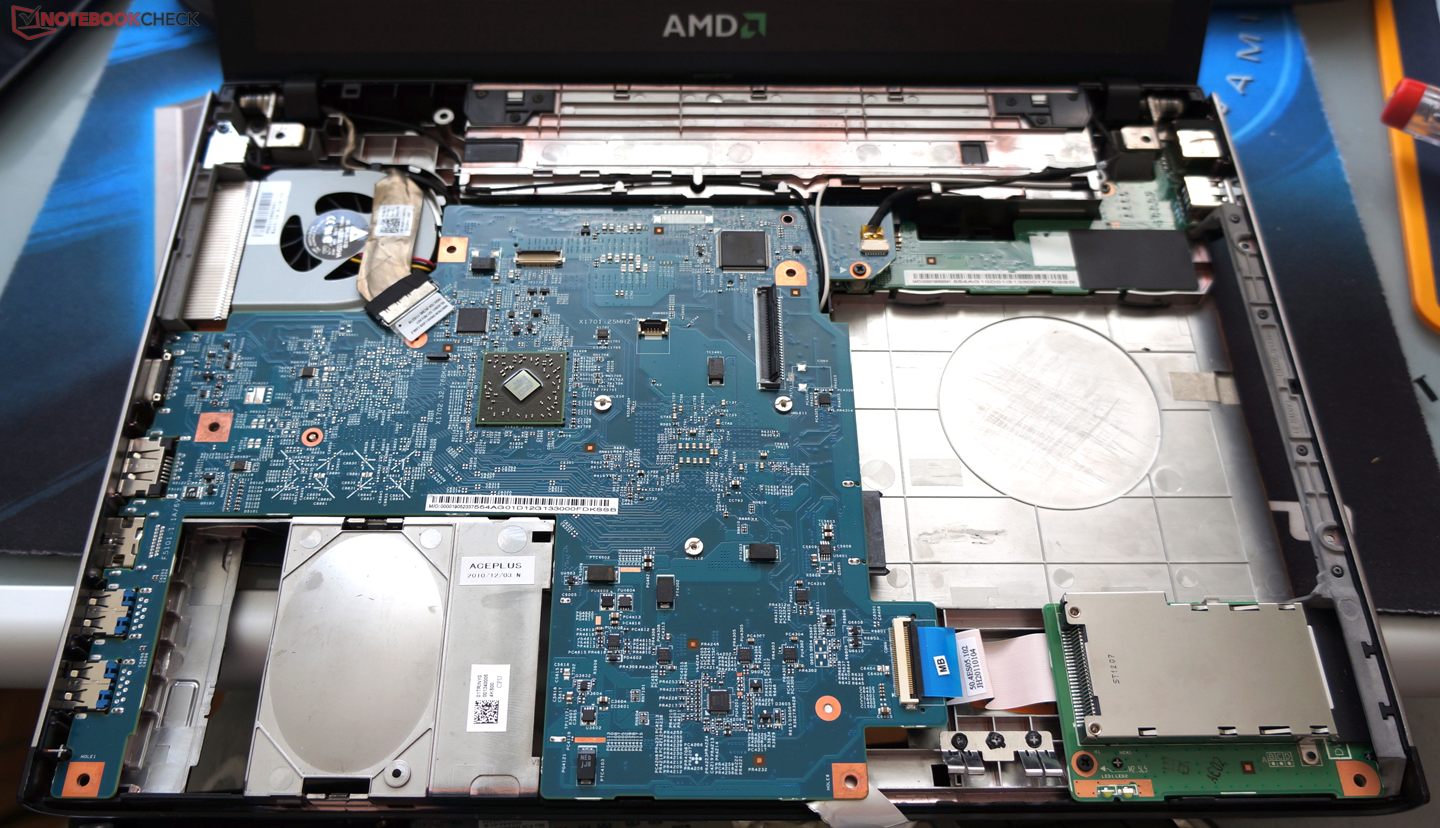
- AMD A70M (Hudson M3) chipset
- 2x Micron 2 GB Dual Channel DDR3-1600
- Samsung SSD 830 - which only delivers SATA 2 speeds
- Windows 7 Ultimate 64 bit
Processor Performance
We tested the processor performance of the new Piledriver cores with various benchmarks and compared it to the average of our notebook tests. For example, the Sandy Bridge dual-core i3-2310M seemed closest in performance on average without taking into account the benefits from Turbo Boost.
The test model performed really well in the TrueCrypt encryption benchmark. In the Serpent test and the Twofish test, the A10 landed slightly behind the high-end Core i7-2640M. Thanks to the hardware encryption unit, the A10 can compete in AES as well. The performance was not as impressive, but came close to that of the ULV Core i7-2637M.
Turbo Core 3.0 boosts the A10 to 3.2 GHz and ensures significant leaps in Single Thread performance when compared to the Llano-based A8-3520M where the latter lagged behind by up to 19% in the single core test. In comparison to Intel's Sandy and Ivy Bridge CPUs, the single core performance of the AMD is still weak. A Core i3-2310M can perform 22 percent, 31 percent and 44 percent faster in Cinebench 10 Single 64 bit, Cinebench 10 Single 32 bit and SuperPi 2M, respectively.
If older tests and single core tests are excluded, then the A10 model performs close to the older and still popular Core Core i5-2410M, which is about 16 percent faster on average. Even in best case scenarios, the AMD model lags behind the Intel CPUs. Consequently, the new Ivy Bridge dual-core CPUs will generally perform much faster than even AMD's top Trinity model.
All CPU Benchmarks results for the A10-4600M with comparison charts can be found this page.
| Cinebench R10 | |
| Rendering Single CPUs 64Bit (sort by value) | |
| A10-4600M | |
| A8-4500M / Asus K75D | |
| A8-3500M / Acer Aspire 5560G-8358G50Mnkk | |
| Core i3-2330M / Samsung 300E5A-S01 | |
| Core i7-2637M ULV / Acer Aspire M3-581TG | |
| Core i7-3612QM / Schenker XMG A102E | |
| Rendering Multiple CPUs 64Bit (sort by value) | |
| A10-4600M | |
| A8-4500M / Asus K75D | |
| A8-3500M / Acer Aspire 5560G-8358G50Mnkk | |
| Core i3-2330M / Samsung 300E5A-S01 | |
| Core i7-2637M ULV / Acer Aspire M3-581TG | |
| Core i7-3612QM / Schenker XMG A102E | |
| Rendering Multiple CPUs 32Bit (sort by value) | |
| A10-4600M | |
| A8-4500M / Asus K75D | |
| A8-3500M / Acer Aspire 5560G-8358G50Mnkk | |
| Core i3-2330M / Samsung 300E5A-S01 | |
| Core i7-2637M ULV / Acer Aspire M3-581TG | |
| Core i7-3612QM / Schenker XMG A102E | |
| Rendering Single 32Bit (sort by value) | |
| A10-4600M | |
| A8-4500M / Asus K75D | |
| A8-3500M / Acer Aspire 5560G-8358G50Mnkk | |
| Core i3-2330M / Samsung 300E5A-S01 | |
| Core i7-2637M ULV / Acer Aspire M3-581TG | |
| Core i7-3612QM / Schenker XMG A102E | |
| Cinebench R11.5 - CPU Multi 64Bit (sort by value) | |
| A10-4600M | |
| A8-4500M / Asus K75D | |
| A8-3500M / Acer Aspire 5560G-8358G50Mnkk | |
| Core i3-2330M / Samsung 300E5A-S01 | |
| Core i7-2637M ULV / Acer Aspire M3-581TG | |
| Core i7-3612QM / Schenker XMG A102E | |
* ... smaller is better
Storage Drive
AMD has equipped a fast Samsung SSD 830 into our test model. The SSD can only reach sequential speeds of 250/200 MB/s (read/write) in the AS SSD benchmark, which is far slower than the typical 500/400 MB/s. It appears that the drive is connected with a SATA-2 3 GB port even though the system tools show that it uses a SATA-3 6.0 GB interface.
Graphics Card
First, we measure the performance of the AMD Radeon HD 7660G with synthetic benchmarks. In the older Futuremark benchmarks (3DMark 03 to 06), the processor performance had a large influence on final results. Due to this, the A10-4600M could only reach the level of a dedicated Radeon HD 6550M or GT 540M. The results were more interesting in 3DMark Vantage and 11. Here, the 7660G was able to reach a more impressive level and closer to the Radeon HD 6750M/7670M. In comparison to Nvidia's dedicated graphics card, the IGP is positioned between the GT 630M and GT 635M.
In the Unigine Heaven test, the IGP of the A10-4600M APU could deliver higher results thanks to the improved hardware Tessellator. As an example, the A10 was able to beat out the higher-end Radeon HD 6850M of the Acer 7750G in the same benchmark.
In short, both the Llano and Ivy Bridge IGPs are handily beaten by AMD's high-end Trinity offerings.
All graphics benchmarks for the Radeon HD 7660G GPU with comparison charts can be found on this page.
| 3DMark 11 - 1280x720 Performance GPU (sort by value) | |
| AMD Radeon HD 7660G | |
| AMD Radeon HD 7670M EasyNote L11HR | |
| Nvidia GeForce GT 635M N55SL | |
| Intel HD Graphics 4000 | |
| 3DMark Vantage - 1280x1024 P GPU no PhysX (sort by value) | |
| AMD Radeon HD 7660G | |
| AMD Radeon HD 7670M EasyNote L11HR | |
| Nvidia GeForce GT 635M N55SL | |
| Intel HD Graphics 4000 | |
| Unigine Heaven 2.1 - 1280x1024 high, Tesselation (normal), DirectX11 AA:off AF:1x (sort by value) | |
| AMD Radeon HD 7660G | |
| AMD Radeon HD 7670M EasyNote L11HR | |
| Intel HD Graphics 4000 | |
| 3DMark 2001SE Standard | 22817 points | |
| 3DMark 03 Standard | 21606 points | |
| 3DMark 05 Standard | 11235 points | |
| 3DMark 06 Standard Score | 7316 points | |
| 3DMark Vantage P Result | 4570 points | |
| 3DMark 11 Performance | 1150 points | |
Help | ||
Gaming Performance
The gaming performance according to theoretical benchmarks is quite impressive for the A10, but the missing dedicated graphics card and the slightly weak processor cores can limit gaming performance. On average, the Radeon HD 7660G positions itself between the old Mobility Radeon HD 5650 and the Radeon HD 6630M. The GeForce GT 540M and 630M are faster in 9 of the 15 games tested with Batman, Battlefield 3 and Dirt 2 showing the most difference.
Certain games should be able to run in medium or even high graphical settings at 30 fps. However, keep in mind that demanding games like Battlefield 3 or Alan Wake will drop frames dramatically regardless of the settings.
Catalyst 12.2 (Launch Driver)
| low | med. | high | ultra | |
|---|---|---|---|---|
| World of Warcraft (2005) | 73 | 31 | ||
| Half Life 2 - Lost Coast Benchmark (2005) | 119.2 | |||
| World in Conflict - Benchmark (2007) | 99 | 49 | 32 | 12 |
| Supreme Commander - FA Bench (2007) | 48.6 | 36.1 | 32 | 16.7 |
| Trackmania Nations Forever (2008) | 167 | 43 | 20 | |
| Far Cry 2 (2008) | 110 | 45.2 | 18.2 | |
| Left 4 Dead (2008) | 70 | |||
| GTA IV - Grand Theft Auto (2008) | 30.2 | 23.6 | ||
| F.E.A.R. 2 (2009) | 47 | 29 | ||
| Sims 3 (2009) | 60 | 30 | ||
| ArmA 2 (2009) | 9 | |||
| Colin McRae: DIRT 2 (2009) | 62.3 | 48.2 | 28.7 | 15.5 |
| Resident Evil 5 (2009) | 66.8 | 45.1 | 27 | |
| Stalker: Call of Pripyat (2010) | 9.4 | |||
| Dawn of War II - Chaos Rising (2010) | 57 | 37.7 | 30.3 | 19 |
| Metro 2033 (2010) | 50 | 33 | 12 | |
| Just Cause 2 (2010) | 9.7 | |||
| StarCraft 2 (2010) | 142 | 44 | 29.5 | 17.8 |
| Mafia 2 (2010) | 37.7 | 31.7 | 27.9 | 21.7 |
| Civilization 5 (2010) | 32.8 | 11.1 | ||
| Call of Duty: Black Ops (2010) | 37 | 26 | ||
| Total War: Shogun 2 (2011) | 98.9 | 26.5 | ||
| Crysis 2 (2011) | 51 | 33 | 26 | 9 |
| The Witcher 2: Assassins of Kings (2011) | 21.5 | 17 | 8 | |
| Dirt 3 (2011) | 87 | 47.5 | 37.12 | 13.2 |
| Deus Ex Human Revolution (2011) | 83 | 34 | 16 | |
| F1 2011 (2011) | 60 | 36 | 28 | 12 |
| Fifa 12 (2011) | 157 | 94 | 83 | 64 |
| Batman: Arkham City (2011) | 52 | 43 | 16 | 5 |
| Battlefield 3 (2011) | 32 | 22 | 17 | 6 |
| CoD: Modern Warfare 3 (2011) | 107 | 59 | 36 | 19 |
| The Elder Scrolls V: Skyrim (2011) | 38 | 29 | 20 | 10 |
| Anno 2070 (2011) | 77 | 34 | 22 | 11 |
| Alan Wake (2012) | 28 | 17 | 8.2 | |
| Mass Effect 3 (2012) | 32.5 | 28.1 | 17 | |
| Risen 2: Dark Waters (2012) | 31.5 | 21.2 | 17 | 8.5 |
| Diablo III (2012) | 77 | 44 | 26.5 | 20 |
| Dirt Showdown (2012) | 41 | 27 | 25 | 9.9 |
| Max Payne 3 (2012) | 24 | 24 | 9 | |
| The Secret World (2012) | 24 | 16 | ||
| Darksiders II (2012) | 41.1 | 24 | ||
| Sleeping Dogs (2012) | 47.4 | 35.9 | 16.4 | 5.6 |
| Counter-Strike: GO (2012) | 58 | 39 | ||
| Guild Wars 2 (2012) | 28.4 | 14.8 | 7.4 | |
| Dota 2 Reborn (2015) | 48.3 | 29.8 | 15.5 | 14.5 |
| Rocket League (2017) | 37.4 | 22.2 | ||
| Dirt 4 (2017) | 29.6 | |||
| Team Fortress 2 (2017) | 47.4 | 49.3 | 40 | 32 |
| X-Plane 11.11 (2018) | 15.8 | 10.2 | 9.28 |
Catalyst 12.8
| low | med. | high | ultra | |
|---|---|---|---|---|
| Torchlight 2 (2012) | 57.1 | 45.4 | 39.2 | |
| F1 2012 (2012) | 39 | 33 | 32 | 14 |
| Borderlands 2 (2012) | 39 | 33 | 23 | 13.4 |
| Fifa 13 (2012) | 140 | 97 | 94 | 62 |
| World of Tanks v8 (2012) | 59.4 | 29.2 | 24.8 | 13.5 |
| Dishonored (2012) | 47 | 40.2 | 36.4 | 20.7 |
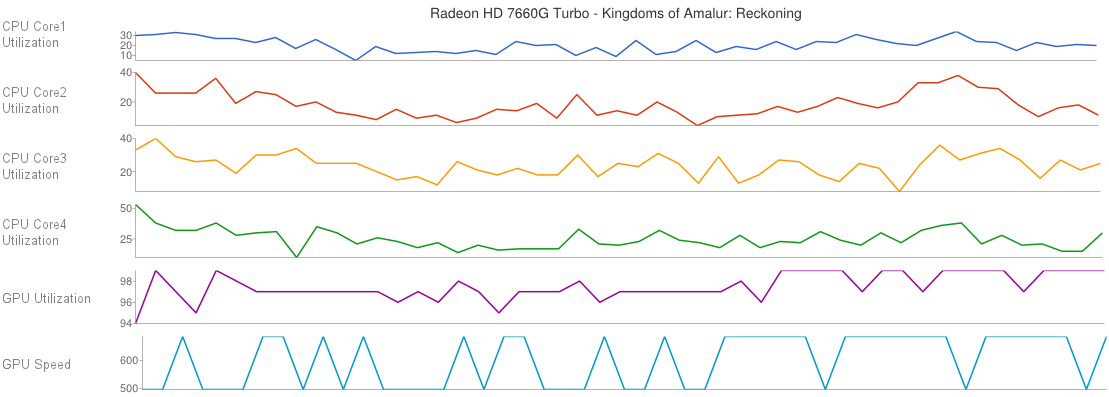
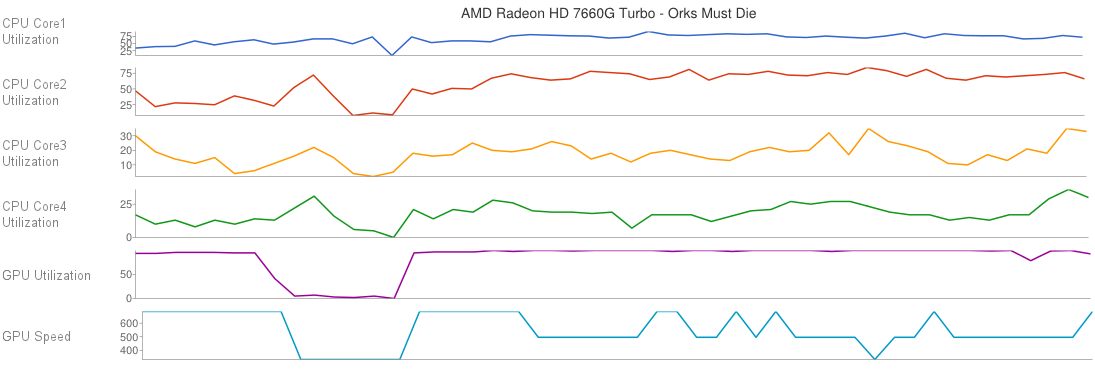
The worse GPU performance in games compared to synthetic benchmarks should be blamed on the dynamic Turbo Core overclocking. As most games also stress the CPU cores quite a bit, the graphics card is not overclocked to 685 MHz all the time. The following two charts are based on data collected with the AMD System Monitor (which currently is not able to show the CPU Turbo speed).
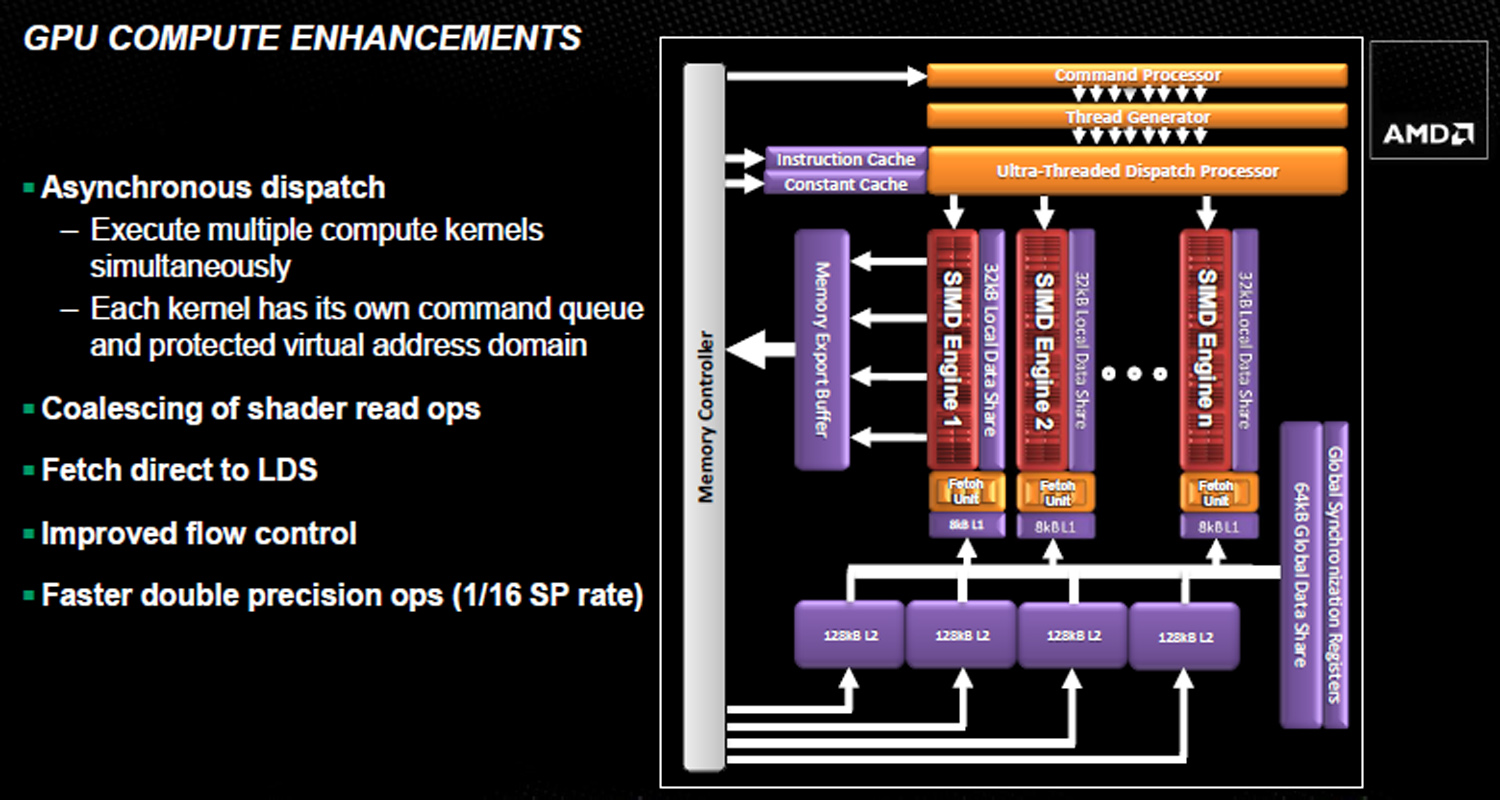
DirectCompute and OpenCL Performance
We checked AMD's claims of faster GPU calculations for general purpose use (known as GPU Compute) with ComputeMark 2.1 and Luxmark 2.0 64-bit for DirectCompute11 and OpenCL, respectively.
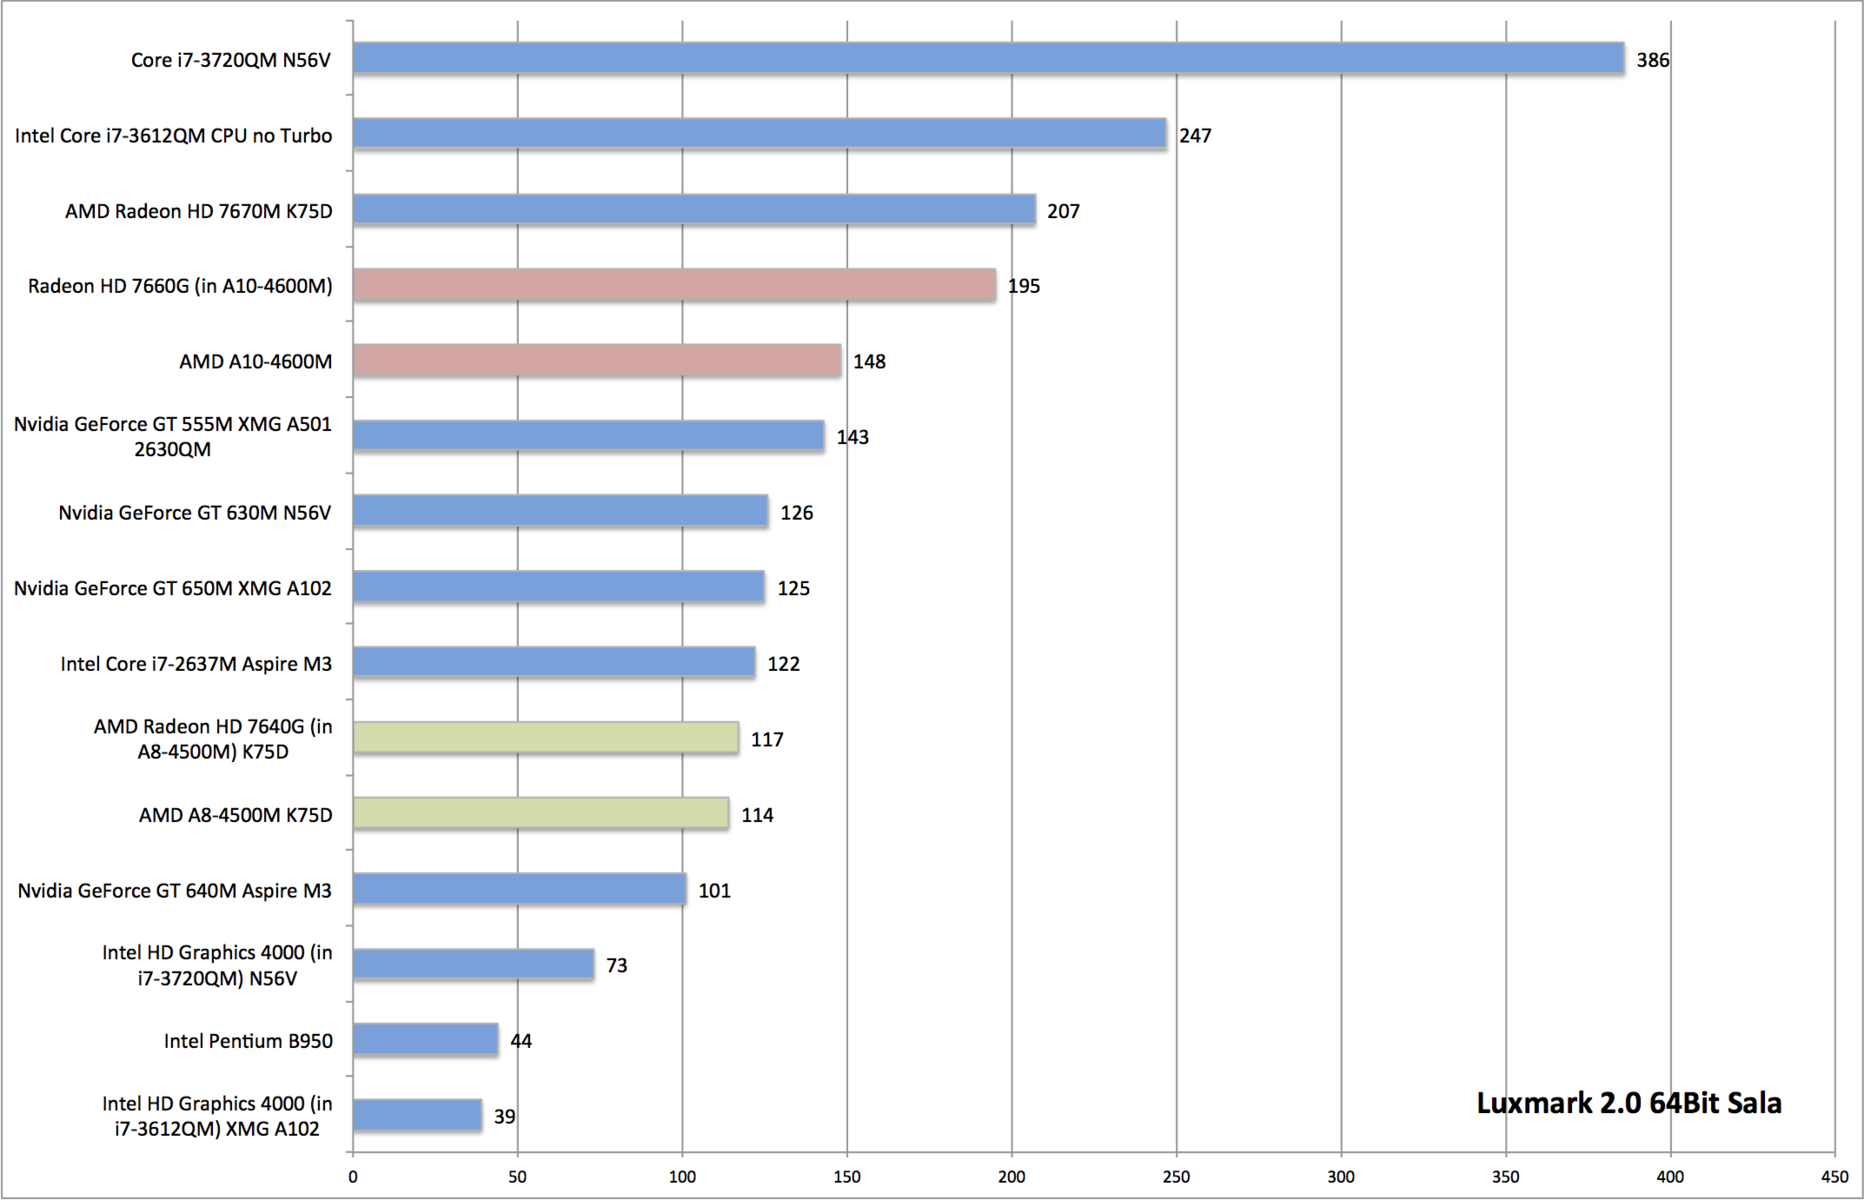
Luxmark 2.0 is an OpenCL benchmark which uses SmallLuxGPU to render a picture with Path Tracer. We rendered a picture (in this case, Sala) of medium complexity. Here, the Radeon HD 7660G in the A10-4600M was able to perform brilliantly and placed itself slightly behind the Radeon HD 7670M.
In comparison, the tested Nvidia GPUs performed poorly in Luxmark as even the GT 650M loses out to the 7660G. The Intel HD Graphics 4000 in Ivy Bridge quad-core processors is even further behind and gets outperformed by weaker GPUs such as the Radeon HD 7640G in the A8-4500M.
ComputeMark is a DirectX 11 Compute Shader benchmark which tests the performance of the graphics card using 5 sub tests. Here the tables are turned as both Nvidia and Intel take the lead over AMD. The Nvidia Kepler GPUs (GT 640M and 650M) take first place, although the Radeon HD 7660G in the A10 still places slightly ahead of the Radeon 7670M while simultaneously outperforming the older Fermi-based GT 555M and GT 630M. The HD Graphics 4000 performs well and lands right behind the GT 630M. Bringing up the rear is the Radeon HD 7640G of the A8-4500M.
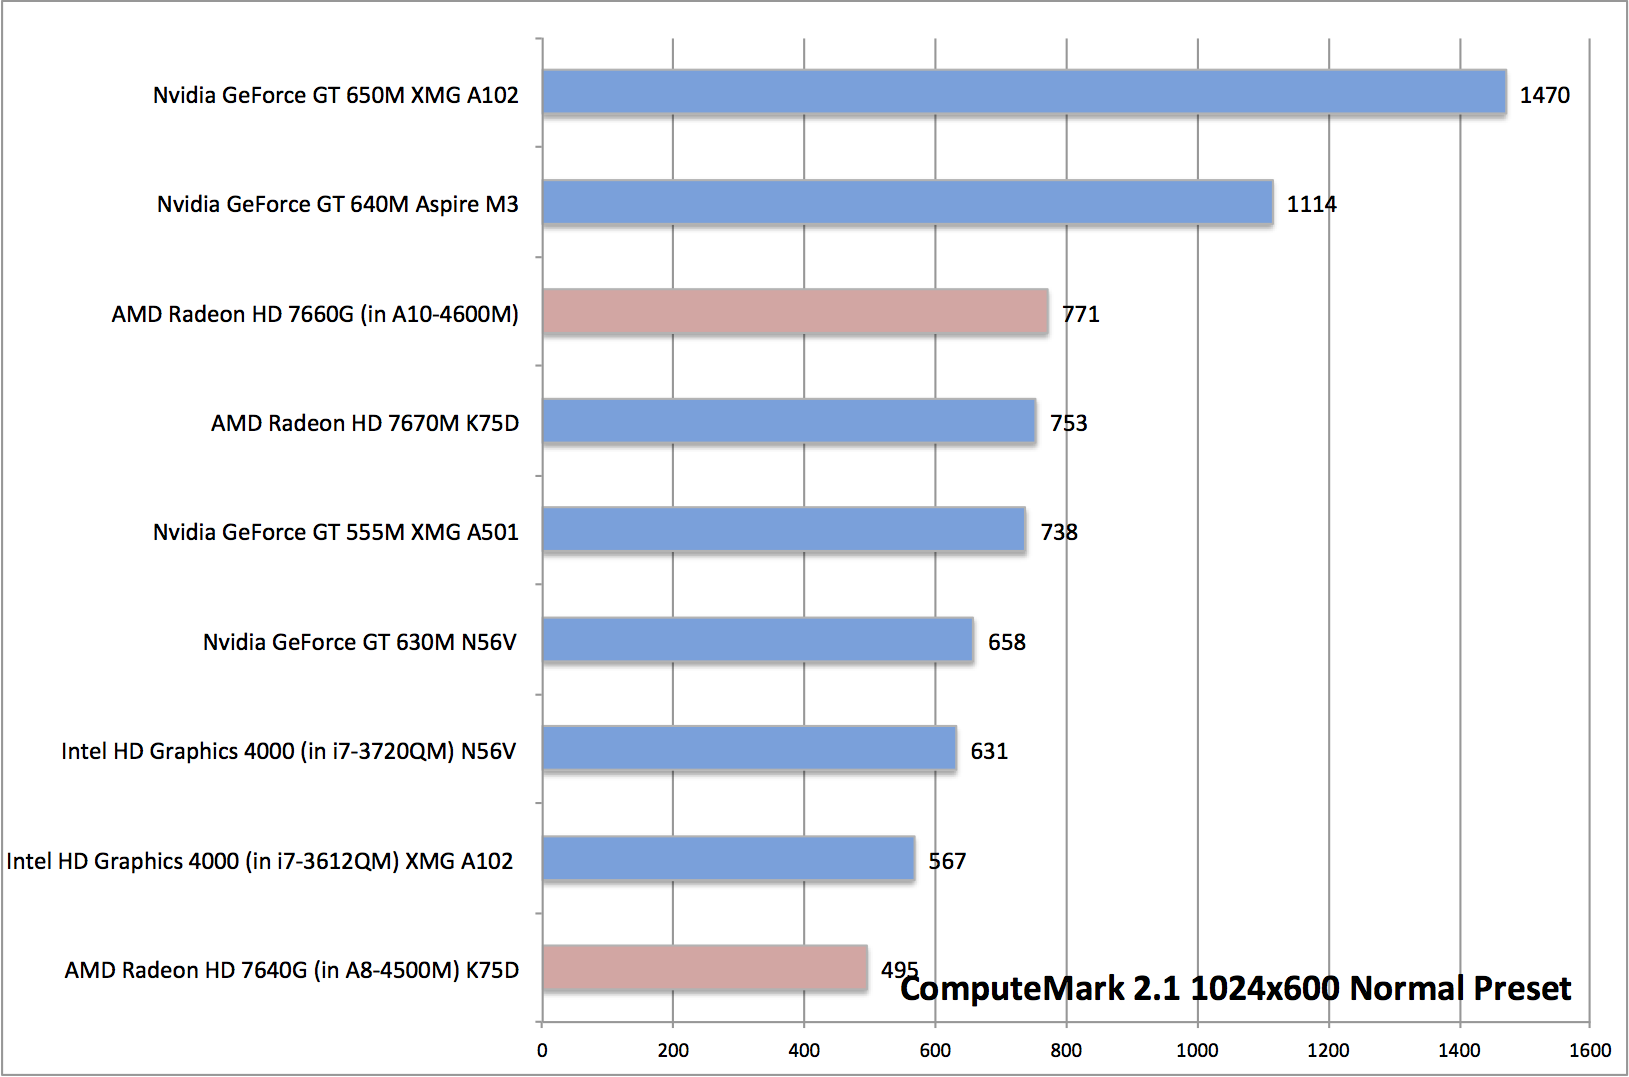
The Radeon HD 7660G in the A10 performs very well in the Compute benchmarks. Its performance lies close to that of the middle-class dedicated Radeon HD 7670M GPU and is even stronger than the 7640G IGP of the A8 CPU.
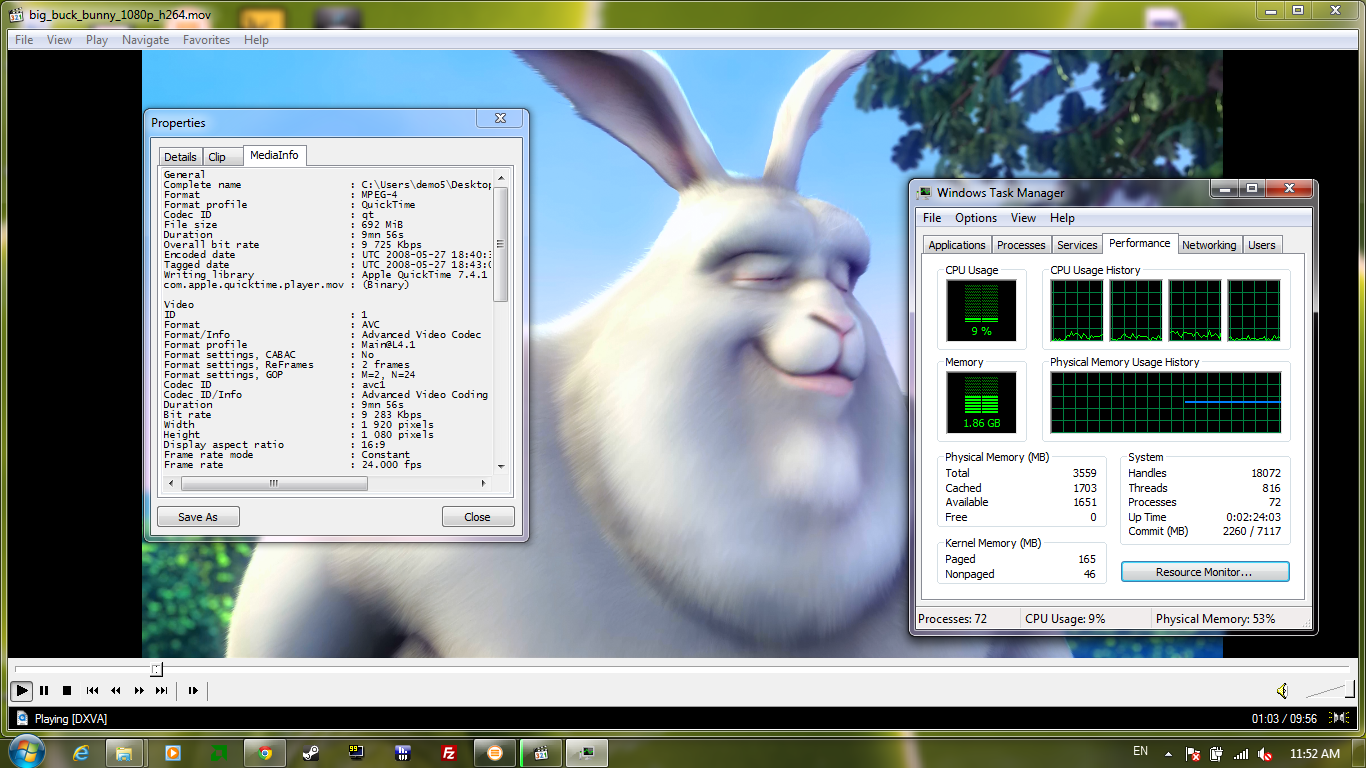
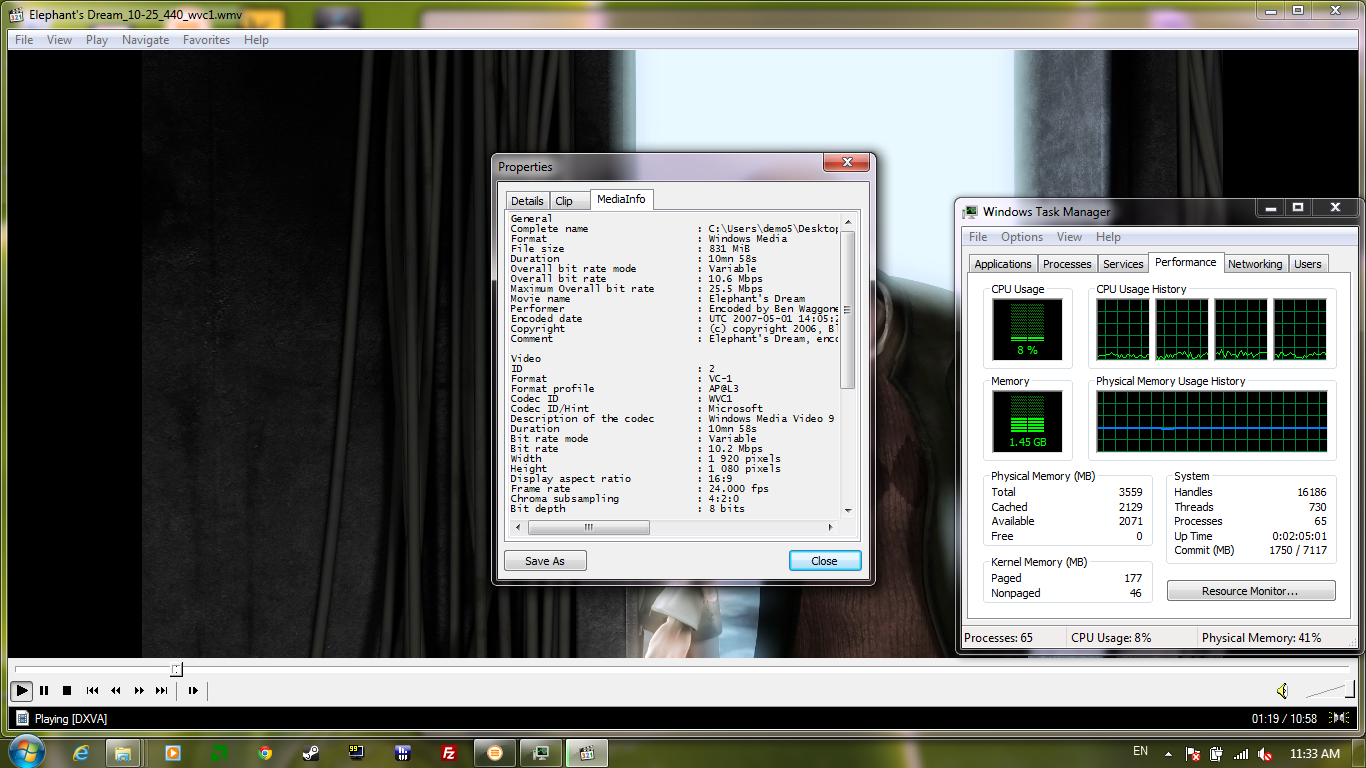
Video Decoding
The Trinity APUs use UVD 3 (Unified Video Decoder) to decode HD videos. UVD 3 is a familiar technology found in the latest Radeon graphic cards and supports decoding of HD videos in MPEG2, H.264 (including Blu-Ray 3D via Multiview Video Decoding), VC1 and MPEG-4 Part 2 (DivX und XVid) formats. Trinity supports the Windows DXVA interface and OpenVideo Decoder (H.264, VC1, MPEG2 according to DXVA Checker). Unfortunately, the tool crashed every time we tried to click a button and as such we could not perform detailed benchmarks.
Elephant's Dream (VC-1, 1920x1080 at 10.2 MB/s) caused a processor load of 20-30% with WMP. The free Media Player Classic performed better with a consistent load between 5-10%.
The H.264 Big Buck Bunny (also 1920x1080, main L3.1 9283 KB/s) caused a load of 0-5% in Windows Media Player whereas Media Player Classic required more out of the APU at ~10%.
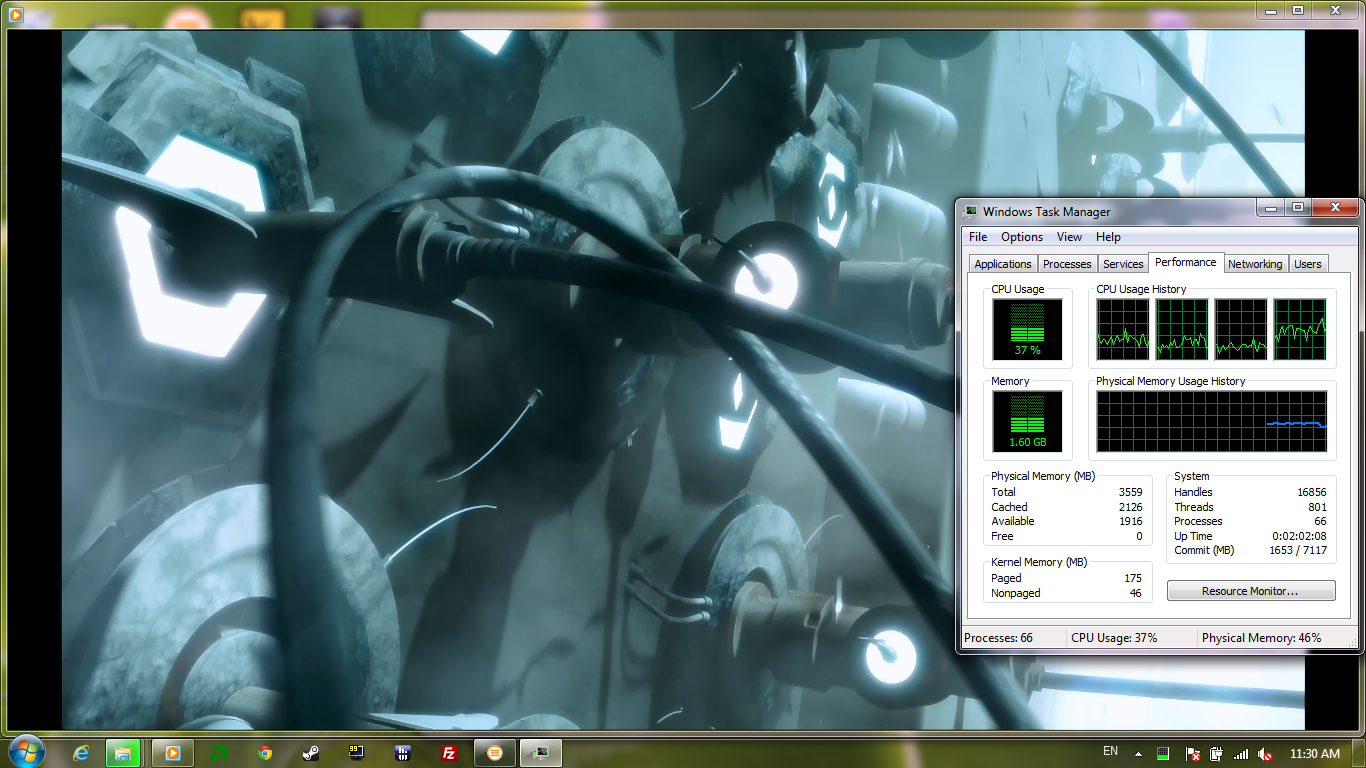
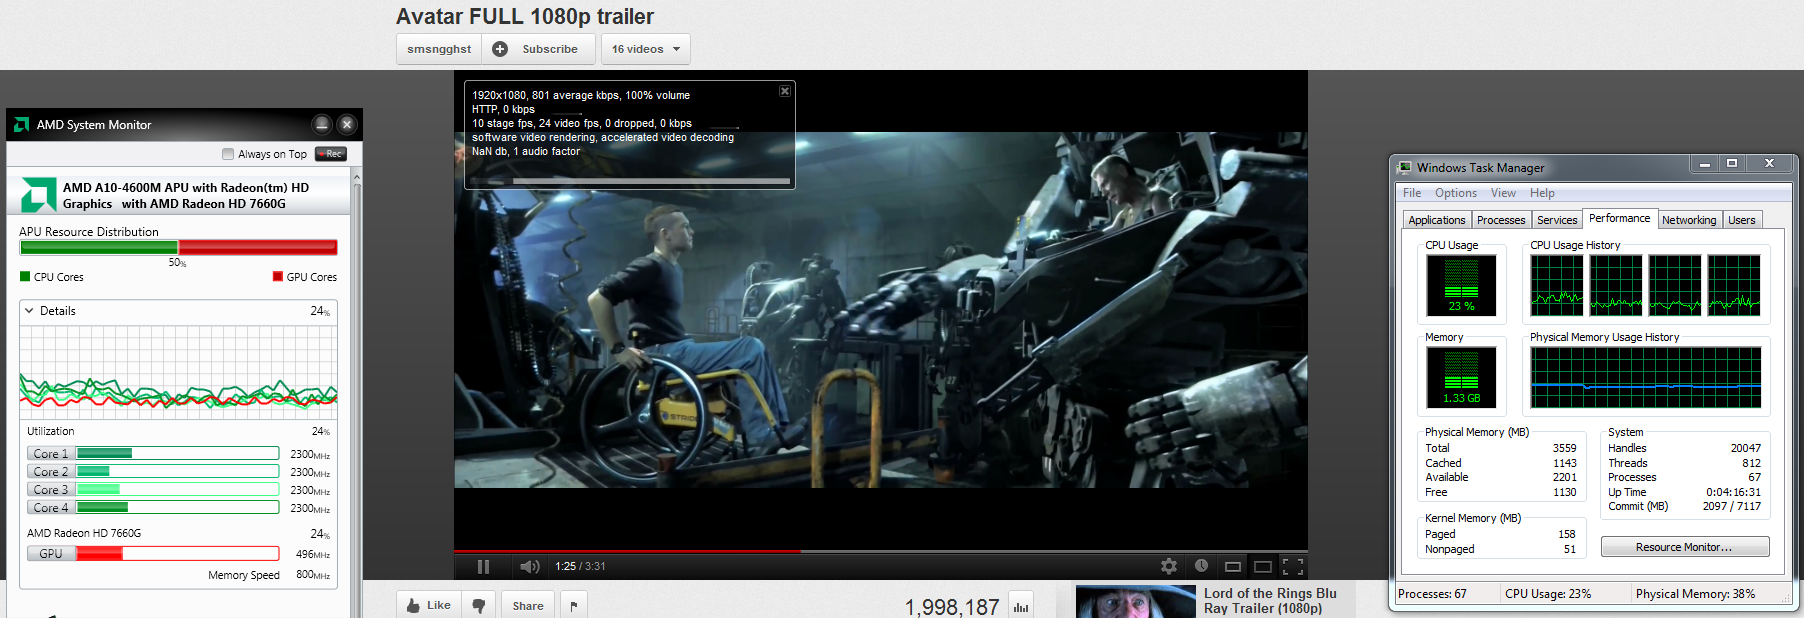
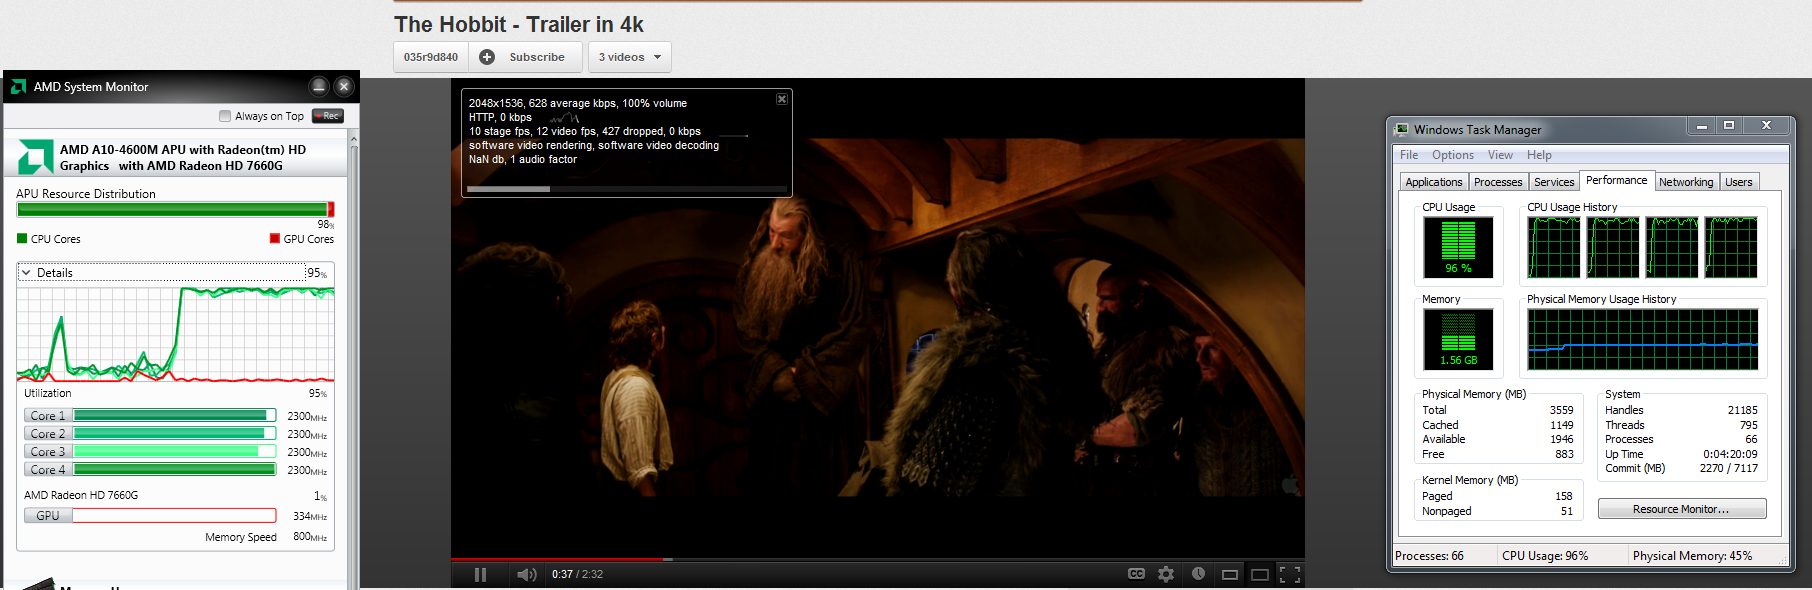
Youtube videos up to 1080p are not a problem for the A10-4600M. The CPU load stayed around 25% while we played a Full HD Avatar trailer, which ran fluidly without frame drops. As long as UVD is used, HD videos should be buttery smooth on the Trinity platform. The 2K trailer (2048x1538 pixels) of "The Hobbit" in Youtube pushed all 4 cores to 100% load and ran with strong picture distortions. In this case, the CPU performance is not sufficient to play the video properly. Even two simultaneously running 1080p videos can cause some stuttering and frame drops. In comparison, the Core i7-2637M ULV CPU (as found on the Aspire M3) was able to run the same 2k content slightly better in a window and absolutely fluidly in full screen. The latest Ivy Bridge Quad-Core 3720QM only had a load of 23% in this test (4 of the 8 virtual cores had 50% load).
Video Transcoding Performance
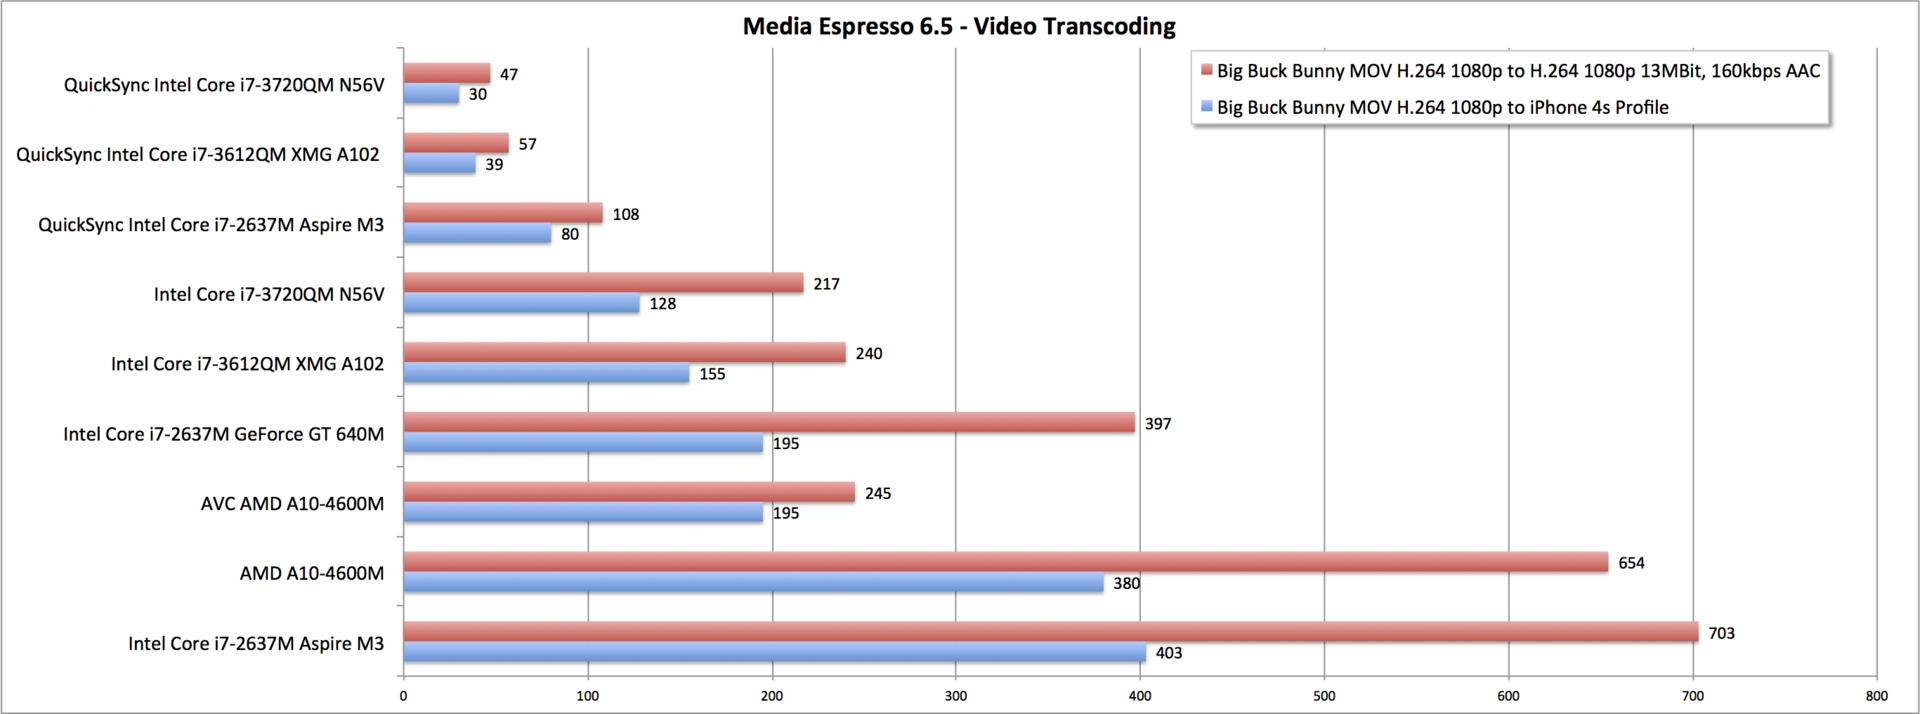
The integrated video encoder called Accelerated Video Converter (AVC) is a new feature of the Trinity series and is part of the AMD HD Media Accelerator. It is similar to Intel's QuickSync and allows quick converting of HD videos for playback on Smartphones or Tablets.
In general, AVC is no match for Intel's QuickSync. The converting of a 1080p H.264 clip takes less than half as long on a Sandy Bridge ULV Core i7-2637M (Acer Aspire M3) than with the A10 APU. Regardless, AVC significantly improves conversion performance over simply not using the encoder at all. AVC was able to accelerate encoding performance of the A10 to a level close to that of the quad-core Core i7-3612QM without the aid of QuickSync.
In our test setup, AVC required only about 41 W during the conversion, which is similar to what the CPUs would be demanding when under normal operating conditions anyway. As a result, using AVC saves power as it requires less time to complete. Here, CPU load hovers around 30 to 35%. A slight but noticeable increase in power draw (45 W) was recorded during the start of our test due to Turbo Core acting on the Piledriver cores.
Intel's QuickSync, however, saves slightly more power. The Core i7-3720QM in the Asus N56V requires about 20 W less while using QuickSync (56 W with vs 74 W without). The task manager shows a processor load of just 12% while using QuickSync. Nonetheless, we believe that the actual load is probably closer to AMD's AVC as Hyperthreading simulates two virtual cores for less reliable processor load readings in this case.
System Performance
We analyzed the system performance of our test model with Futuremark's two latest benchmarks. Both benchmarks rated the SSD in our test model quite highly and we should mention that we only compared our Trinity test model to other SSD-based laptops. The AMD laptop has a small disadvantage as the SSD cannot unleash its full performance and is limited to SATA 2 (or below) transfer rates.
PC Mark Vantage shows the expected performance in the CPU benchmark. The Asus U36SD-RX114V has a similar performance with a Core i5-2410M and GeForce GT 520M. Fast Intel dual-core notebooks, such as the Lenovo Thinkpad T420s (Core i7-2640M, Nvidia NVS 4200M graphics card and Intel SSD 320) are around 20% faster. The slowest Ivy Bridge quad-core i7-3612QM processor in the Schenker A102 (with GeForce GT 650M and Intel SSD 330) can beat out our model by an astounding 81%. The SSD of that particular model is much faster.
PCMark 7 paints a better picture. The XMG A102 with 3612QM can only take a lead of about 13%. The Thinkpad T420S with Core i7-2640M is about as fast (+1%) as our test model. Core i5-2540M notebooks (Latitude E6220M w. Samsung 810) performed weaker compared to the A10.
All-in-all, the Trinity Whitebook performs much better than expected in the system benchmarks. The Intel Core i3 laptops lie far behind in both tests and, in PCMark 7, the AMD test model can even take the lead.
| AMD Pumori Platform A10-4600M Radeon HD 7660G, A10-4600M, Samsung SSD 830 Series MZ-7PC0128D/EU | Asus U36SD-RX114V GeForce GT 520M, 2410M, Intel SSD 320 Series SSDSA2CW160G3 | Lenovo ThinkPad T420s 4174-PEG NVS 4200M, 2640M, Intel SSD 320 Series SSDSA2BW160G3L | Acer Aspire M3-581TG GeForce GT 640M, 2637M, Lite-On LMT-256M3M | Schenker XMG A102 GeForce GT 650M, 3612QM, Intel SSD 330 Series SSDSC2CT180A3K5 | |
|---|---|---|---|---|---|
| PCMark Vantage | -2% | 15% | 36% | 85% | |
| 1024x768 HDD Score (Points) | 25275 | 21410 -15% | 23935 -5% | 38012 50% | 52035 106% |
| 1024x768 Productivity Score (Points) | 12283 | 11299 -8% | 15369 25% | 17017 39% | 24498 99% |
| 1024x768 Communications Score (Points) | 10441 | 7535 -28% | 12899 24% | 12545 20% | 16113 54% |
| 1024x768 Music Score (Points) | 11727 | 12448 6% | 14021 20% | 14850 27% | 20215 72% |
| 1024x768 Gaming Score (Points) | 5881 | 8952 52% | 7615 29% | 11179 90% | 15299 160% |
| 1024x768 TV and Movies Score (Points) | 4172 | 3192 -23% | 3797 -9% | 3815 -9% | 5380 29% |
| 1024x768 Memories Score (Points) | 5742 | 5885 2% | 6307 10% | 7966 39% | 10042 75% |
| 1024x768 Result (Points) | 9798 | 9431 -4% | 11911 22% | 12759 30% | 17698 81% |
| PCMark 7 | -14% | -5% | 1% | 5% | |
| System Storage (Points) | 4648 | 4509 -3% | 4510 -3% | 5271 13% | 5164 11% |
| Computation (Points) | 4198 | 2551 -39% | 2991 -29% | 2621 -38% | 3204 -24% |
| Creativity (Points) | 5101 | 3637 -29% | 3931 -23% | 3990 -22% | 4212 -17% |
| Entertainment (Points) | 2717 | 2248 -17% | 2479 -9% | 2899 7% | 3342 23% |
| Productivity (Points) | 3256 | 2937 -10% | 3557 9% | 3635 12% | 3654 12% |
| Lightweight (Points) | 3450 | 3782 10% | 4121 19% | 4309 25% | 3977 15% |
| Score (Points) | 3286 | 2861 -13% | 3312 1% | 3503 7% | 3710 13% |
| Total Average (Program / Settings) | -8% /
-8% | 5% /
5% | 19% /
19% | 45% /
47% |
| PCMark Vantage Result | 9798 points | |
| PCMark 7 Score | 3286 points | |
Help | ||
Subjective Performance
The subjective performance can be more important than the benchmark performance. In our test, the A10-4600M performed quite well and was able to pull off multi-tasking with simple picture editing (in Photoshop CS6), YouTube video playback and web browsing with two monitors flawlessly. The in-built SSD played an important role during this test as it boosted performance in programs.
Simple HD video editing was done using PowerDirector 10, which supports OpenCL for some effects and can use AVC to render video. This helps the CPU cores and allows simple video editing to work well. However, as soon as one works with three HD streams and added visual effects, it becomes clear that the CPU can be too weak.
We can say with confidence that the A10-4600M fulfills all of the typical consumer needs and offers sufficient performance for everyday tasks. Gamers, however, should look towards faster Intel processors with a dedicated graphics card. In our experience, AMD's Dual Graphics does not perform well.
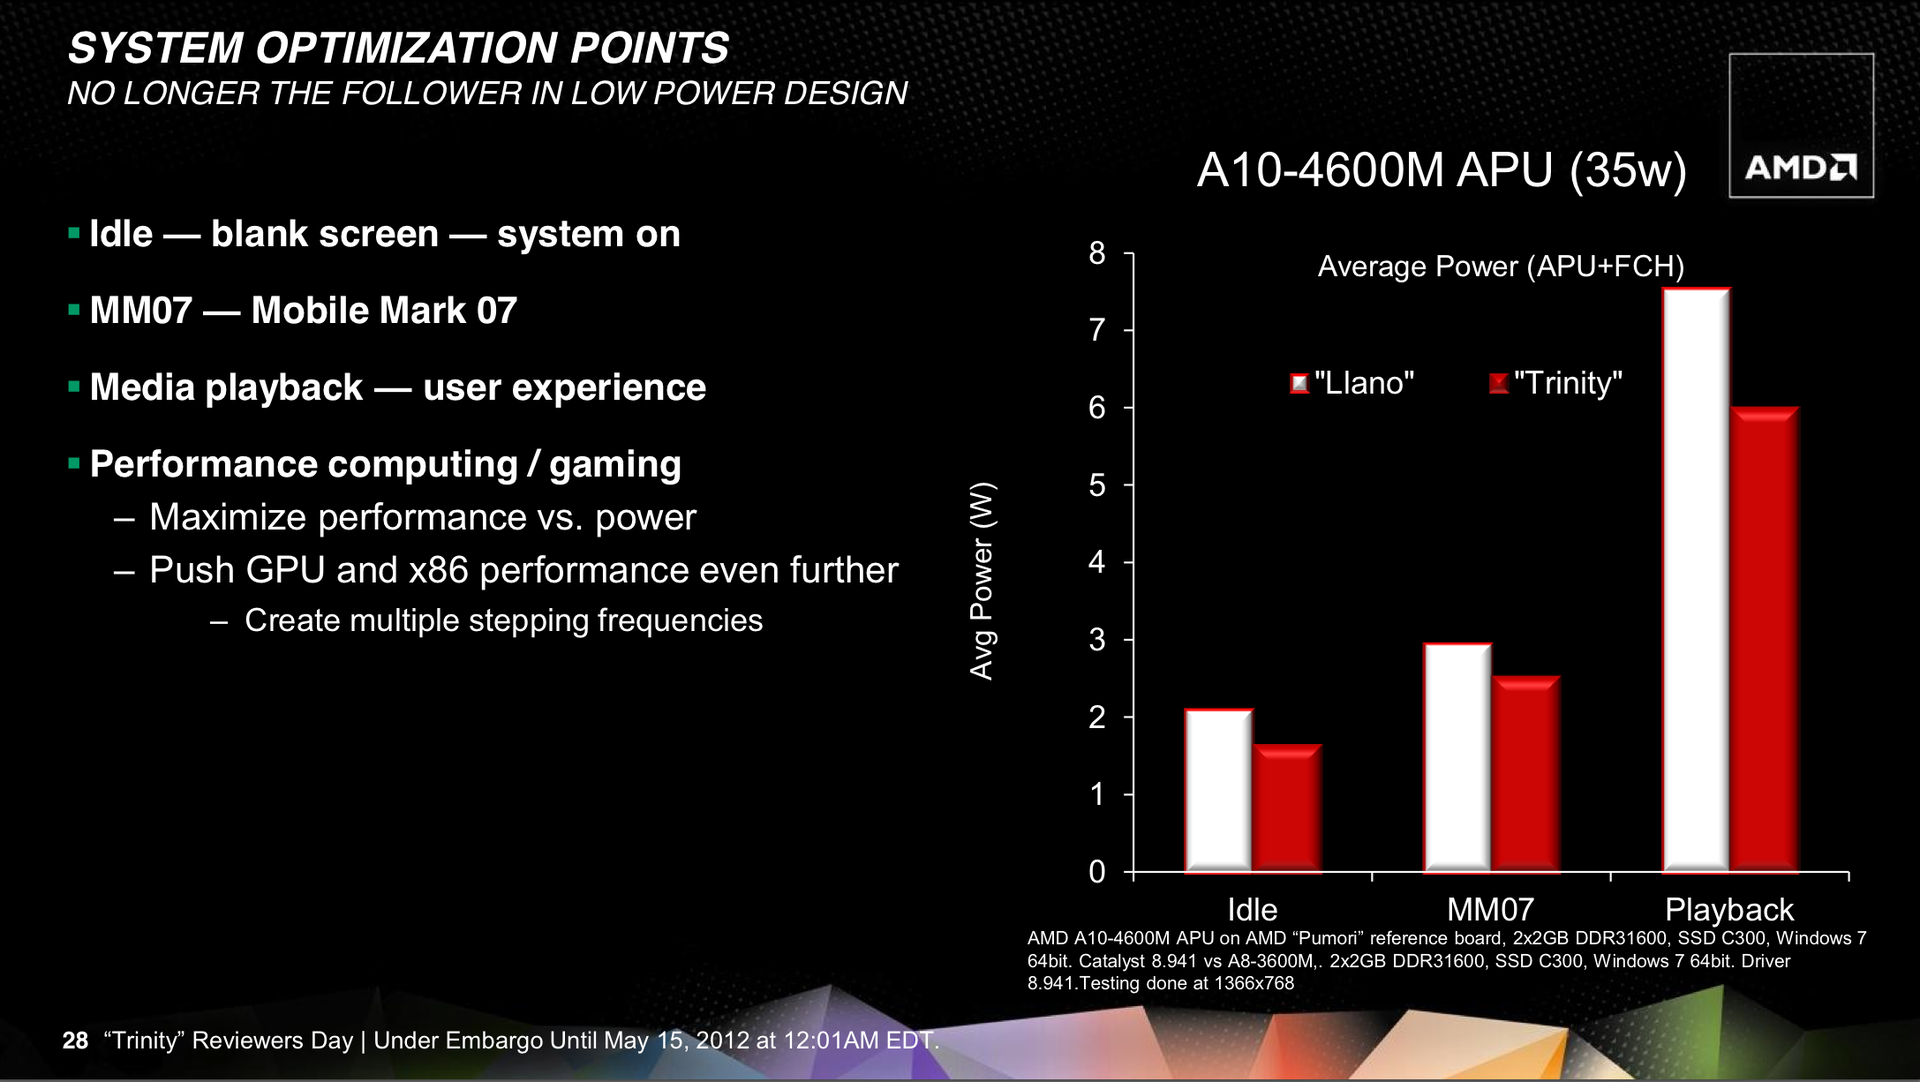
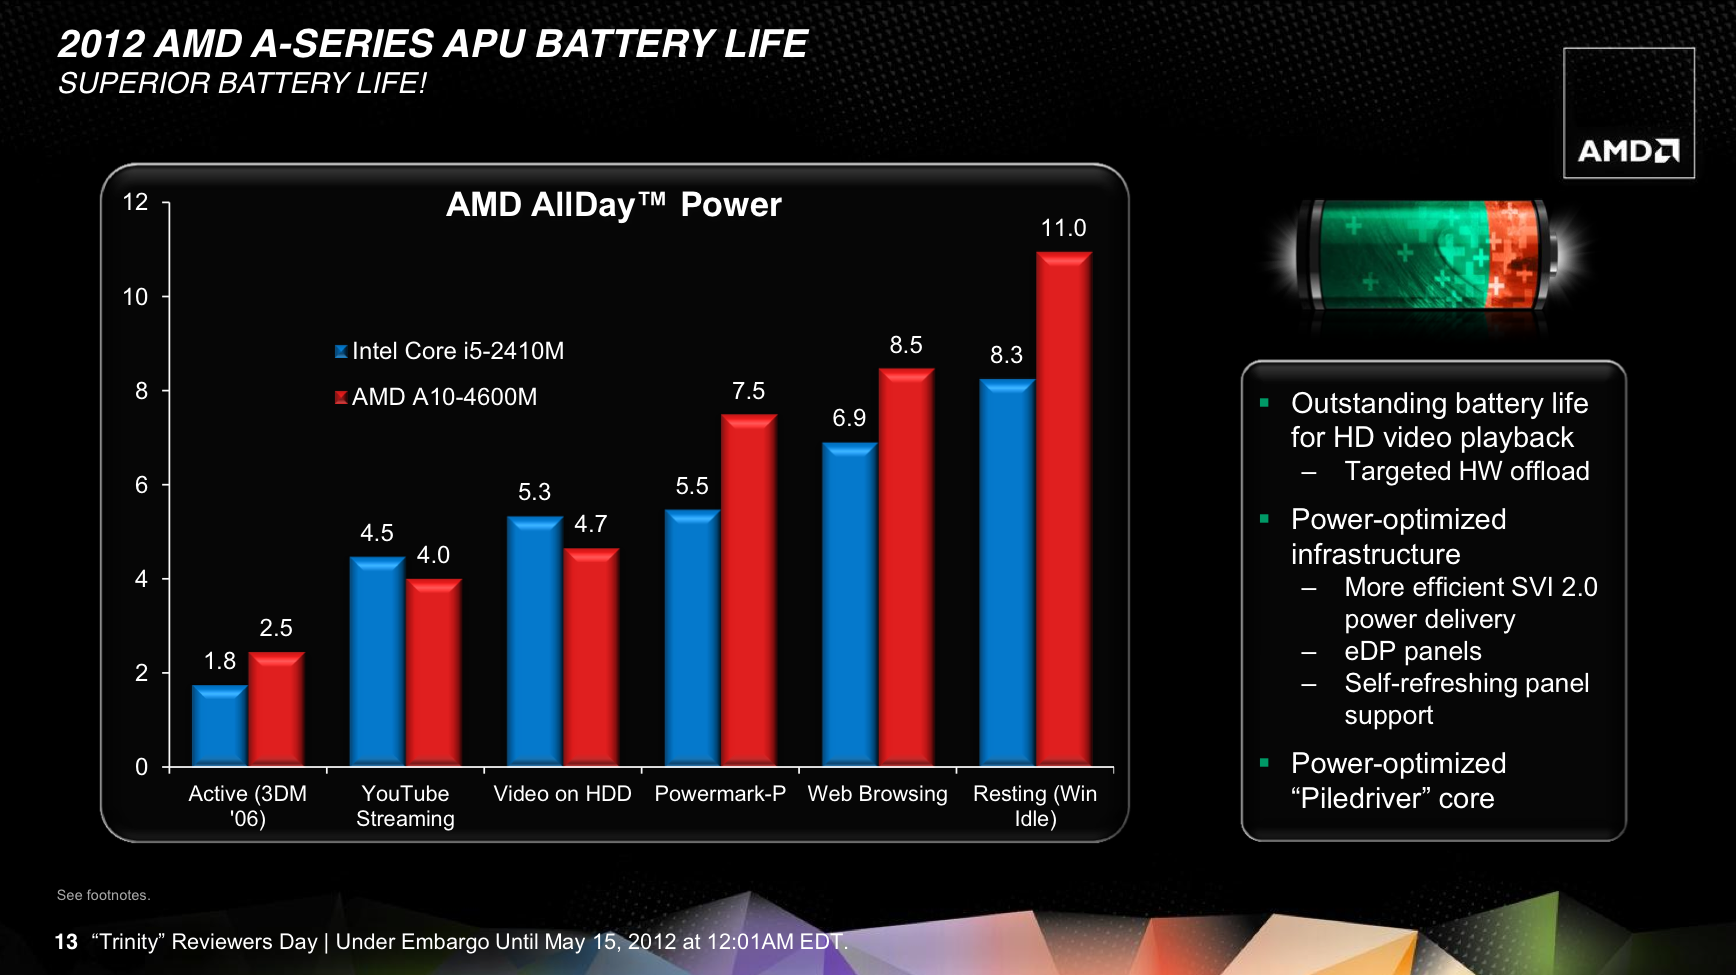
AMD boasts that the new Trinity platform is "no longer the follower in low power design". In comparison to Llano-based A8-3600M, the new A10-4600M requires much less power while idle, or running Mobile Mark 07 and other media tasks.
Battery Life
Power Consumption
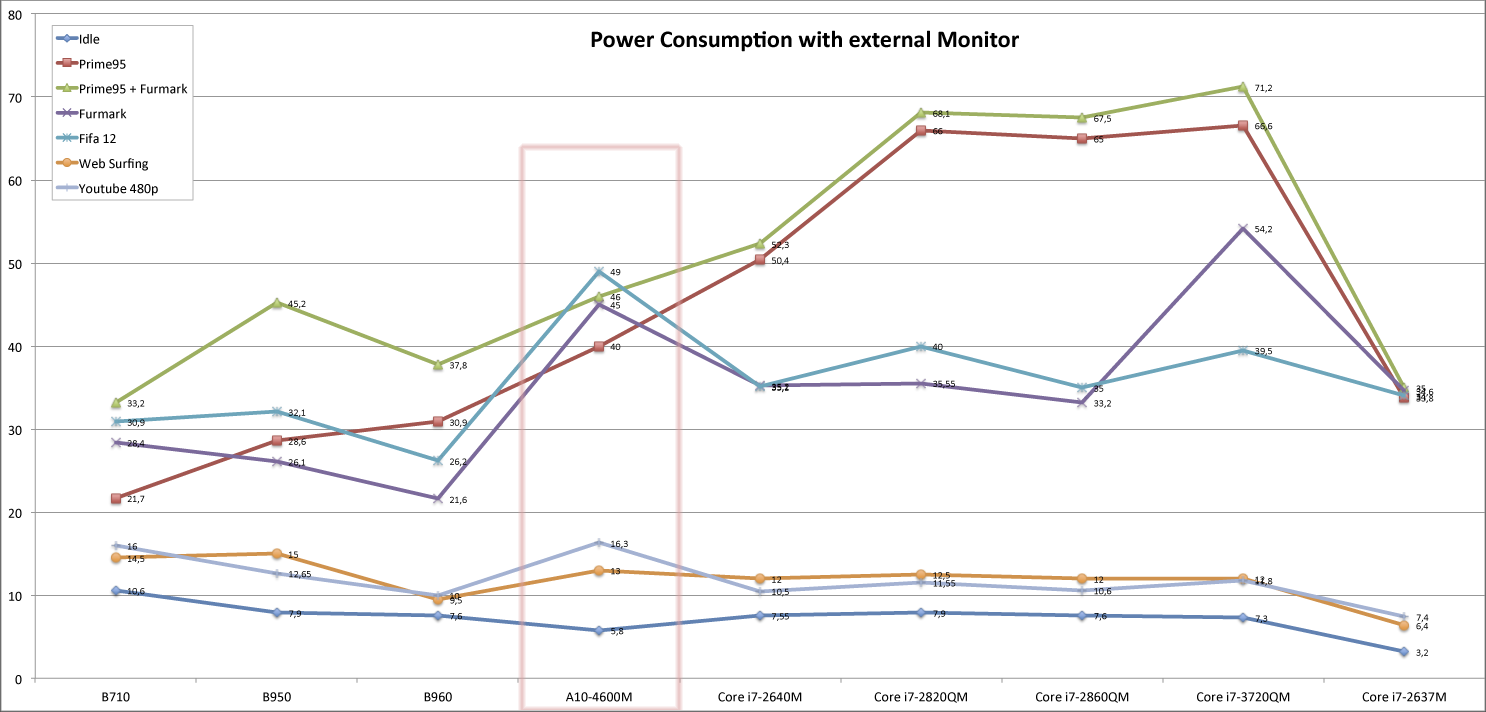
In our power usage test, the A10-4600M of the Pumori platform deserves praise. If not under load, the model can beat out the current Intel competition, (Celeron B710, Pentium B950, Pentium B960, Core i7-2640M, Core i7-2860QM and Core i7-3720QM). Only the Core i7-2637M ULV CPU can save more power, although it also has the same TDP value of 17 W. Direct competitors with a TDP value of 35 watts include: Celeron B710, Pentium B950/B960 and the Core i7-2640M. The tested Intel quad-core models lie higher with a TDP of 45 watts.
Surfing on the web, the A10 performs at the same power level as most Intel processors. For this particular task, only the Pentium B960 and other ULV CPUs can save more power.
While playing a Youtube video, the A10 can not perform as well as AMD promises in terms of power consumption. The APU takes about as much power as a power-hungry single core Celeron B710.
Graphically demanding programs, such as Fifa 12 and Furmark, require more power from the AMD APU than from the Sandy Bridge graphics. On the other hand, the AMD APU offers more performance. The new HD Graphics 4000 saves more power running Fifa 12 but cannot maintain its performance levels during the Furmark stress test.
| Off / Standby | |
| Idle | |
| Load |
|
Key:
min: | |
Battery Life
We ran our standard battery life tests on the Pumori platform that features a 54 Wh battery.
Battery Eater's Reader Test simulates reading text at minimum brightness. The A10-4600M delivers amazing idle values: 11.1 minutes per Wh battery capacity. This beats all tested Intel office notebooks (6 - 11.3 minutes), nearly all Core i5-2410M with HD 3000 notebooks (6.2 - 11.2 minutes) and all Llano A8-based notebooks (6.6 - 8.1) by far.
In the WLAN surf test, the A10 placed about average compared to many Core i5-2410M laptops. Note: our test method was standardized only at the start of this year, which means that there can be strong variations in the measured values.
In the load test with maximum brightness, the AMD laptop consumes slightly less power than the average of the competition. However, it can offer full performance even while running on battery. Many competitors unexpectedly throttle their CPU and even graphics card while on battery to bump up battery life.
The battery life is less reliable than the power usage measurements due to the influence of the display and system configuration. It does, however, paint a similar picture. While idle, the power usage of the AMD A10-4600M is excellent and takes the lead in comparison to similarly-equipped laptops. We will have to wait to see if dual-core Ivy Bridge processors can catch up in the race for power efficiency. In fact, our Ivy Bridge quad-core test model does not save as much power as even some Sandy Bridge models. While under load, the A10 draws just as much power as the competition albeit with superior graphics.
Preview of the first Trinity model: the Asus K75D
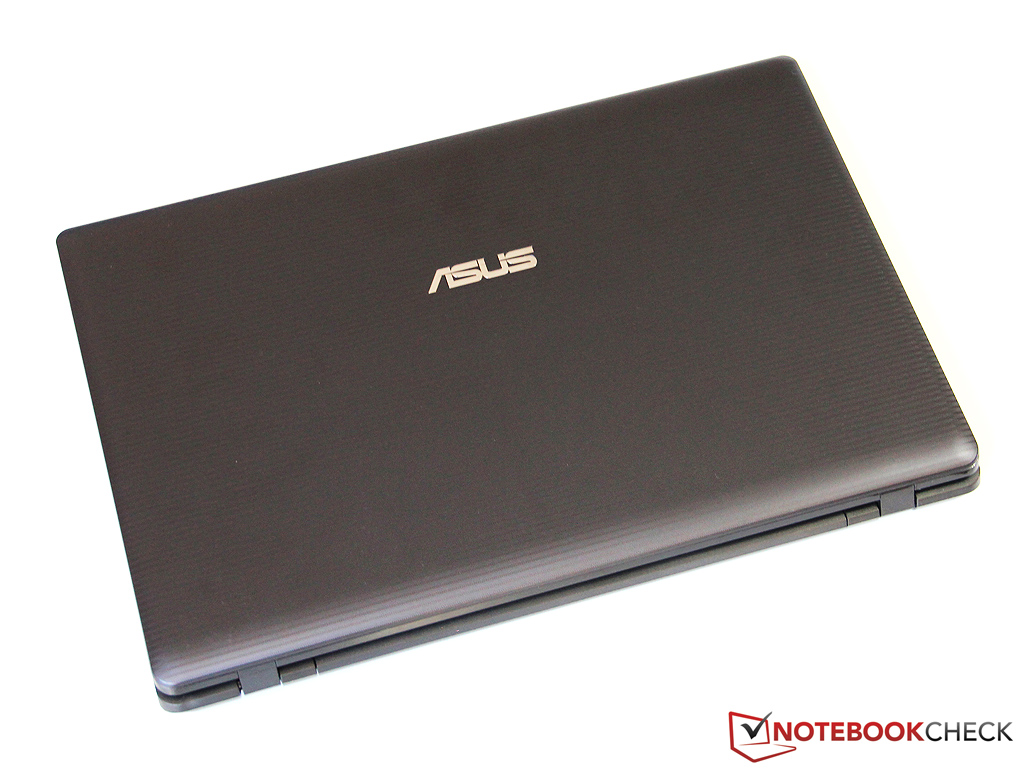
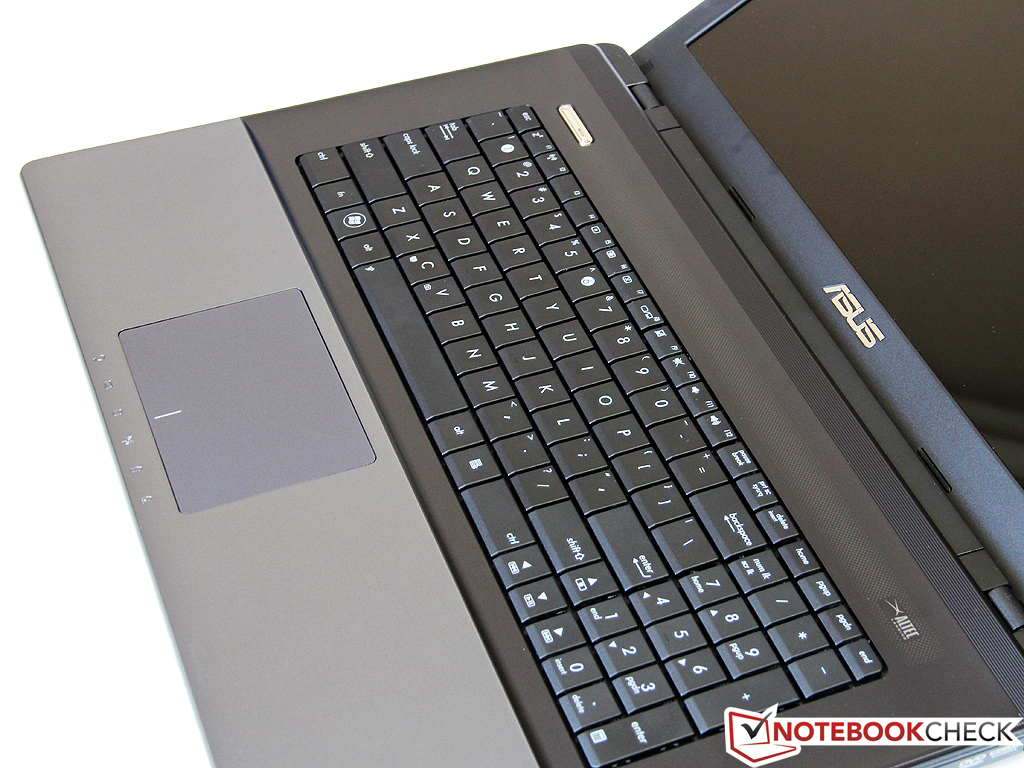
We currently have the opportunity to take a look at one of the first Trinity notebooks on the market with the Asus K75D. The model we have is a precursor with the following configuration:
- AMD A8-4500M
- Radeon HD 7640G + 7670M
- 1x 4096 MB Elpida DDR3-1600, Single-Channel
- Hitachi HTS545050A7E380 HDD, 500 GB, 5400 rpm
- 17.3" glare Panel, 1600 x 900 pixels
The K75D looks finished on the outside with a high-quality appearance. A few details, such as the rickety touchpad border, show that the model is not yet ready for the public.
Unfortunately, the system only has a single DDR3-1600 memory module. The graphics performance of the Radeon HD 7640G IGP is severely stunted due to this bottlebeck. The GPU score in 3DMark 11, for example, amounts to a mere 651 points, which is around the level of a HD 6620G or Intel's HD 4000. When combined with the dedicated 7670M graphics card, however, the result soars to a more respectable 1,647 points. Note, however, that the subjective performance here can be much lower than what benchmark numbers may suggest due to micro stuttering issues.
The price of the K75D should be around that of the K73 and should please multimedia fans who want light gaming. We would like to see Asus and possibly other manufacturers launch more Trinity notebooks without a dedicated graphics card in order to lower costs yet still deliver good graphics performance with the IGP.
Verdict
Trinity is finally here. In comparison to Llano, it is much improved and has a new architecture despite having similar structural dimensions. We're definitely pleased by the improved power usage while idle, an important area that AMD clearly has the advantage on over Intel.
The Radeon HD 7660G chip sets new standards for IGPs and leaves the brand-new Intel HD Graphics 4000 behind in the dust. In our benchmarks, the IGP was able to reach the level of a Mobility Radeon HD 5650. Also worth mentioning: the great GPU Compute performance (with OpenCL & DirectCompute) should open up new doors for novice programmers and general users.
The integrated Video Transcoding unit (AVC) tries to compete with Intel's QuickSync, but the overall performance boost is not enough to dethrone the Intel encoding solution.
The new Piledriver CPU cores offer AES, AVX and FMA3. Unfortunately, the cores themselves could not match Intel's high-end processors. The multi-core performance is at about the same level of Llano processors, whereas the single-core performance is significantly higher. Intel's processors are much faster and on average the A10-4600M is only as fast as an old Core i3-2310M (entry-level dual-core CPU). We were hoping for more.
AMD stresses the aggregate performance of the Trinity system as a whole instead of the individual CPU. The PCMark and PCMark 7 results of our test model show that the A10-4600M can hold its own with high-end notebooks.
Overall, the AMD A10 APU is at the level of entry-level Intel CPUs, but with a much stronger IGP. However, as soon as a dedicated GPU comes into play, the CPU cores could become a key bottleneck.