 Deutsch
 English
 Español
 Français
 Italiano
 Nederlands
 Polski
 Português
 Русский
 Türkçe
 Svenska
 Chinese
 Magyar
Microsoft Surface Laptop 5 15 review - Old design for a premium price
Microsoft updated their Surface laptop at the end of last year, but this new update doesn't actually come with many new features. The manufacturer decided to drop the AMD option for the 5th generation and instead now offers the 13.5 and 15-inch versions exclusively with Intel Alder Lake processors. Apart from their new processors, practically nothing else has changed - since the laptops still use the exact same case. The price, however, remains within the premium range and our test configuration - the 15-inch model with the Core i7-1255U, 16 GB RAM and a 512 GB SSD - is currently being sold by Microsoft for the MSRP of around $4,000 - an overly confident price considering the device's technical specs. However, the laptop can be found a lot cheaper from other retailers, with prices starting from around $1,699. We have tested whether the Surface Laptop 5 15 can still compete against other similar devices in early 2023.
Possible competitors compared
Rating | Date | Model | Weight | Height | Size | Resolution | Best Price |
|---|---|---|---|---|---|---|---|
| 84.3 % | 04/2023 | Microsoft Surface Laptop 5 15, i7-1255U i7-1255U, Iris Xe G7 96EUs | 1.6 kg | 14.7 mm | 15.00" | 2496x1664 | |
| 84.9 % | 04/2021 | Microsoft Surface Laptop 4 15 AMD TFF_00028 R7 4980U, Vega 8 | 1.6 kg | 14.7 mm | 15.00" | 2496x1664 | |
| 85.9 % | 12/2022 | LG Gram 15Z90Q i5-1240P, Iris Xe G7 80EUs | 1.1 kg | 17.4 mm | 15.60" | 1920x1080 | |
| 89.5 % | 05/2022 | Dell XPS 15 9520 RTX 3050 Ti i7-12700H, GeForce RTX 3050 Ti Laptop GPU | 1.9 kg | 18 mm | 15.60" | 3456x2160 | |
| 87.3 % | 12/2021 | Samsung Galaxy Book Pro 15 NP950XDB-KC5US i7-1165G7, Iris Xe G7 96EUs | 1.1 kg | 11.7 mm | 15.60" | 1920x1080 | |
| 87.7 % | 05/2022 | Asus Zenbook Pro 15 OLED UM535Q R9 5900HX, GeForce RTX 3050 Ti Laptop GPU | 1.9 kg | 18 mm | 15.60" | 1920x1080 |
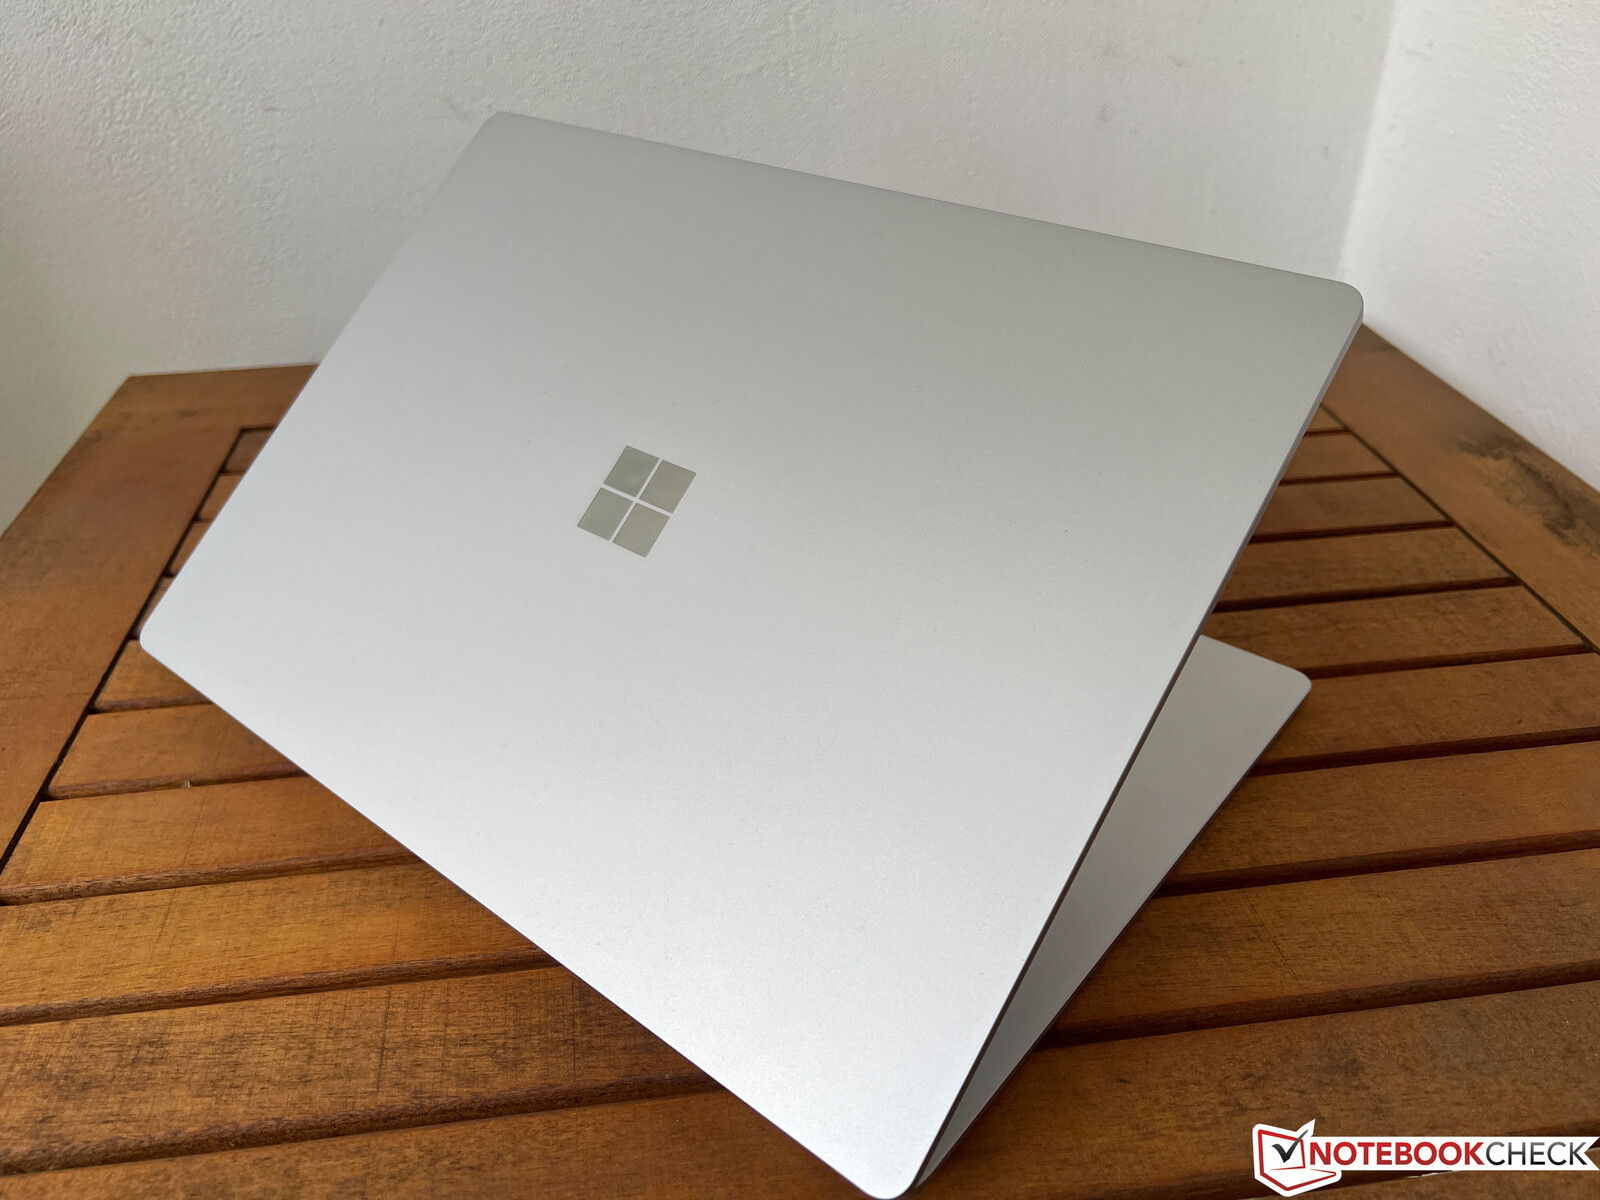
Case & features
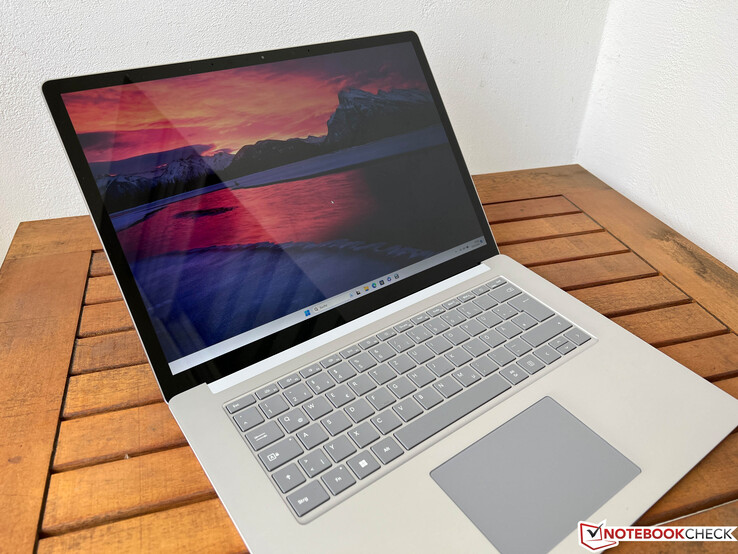
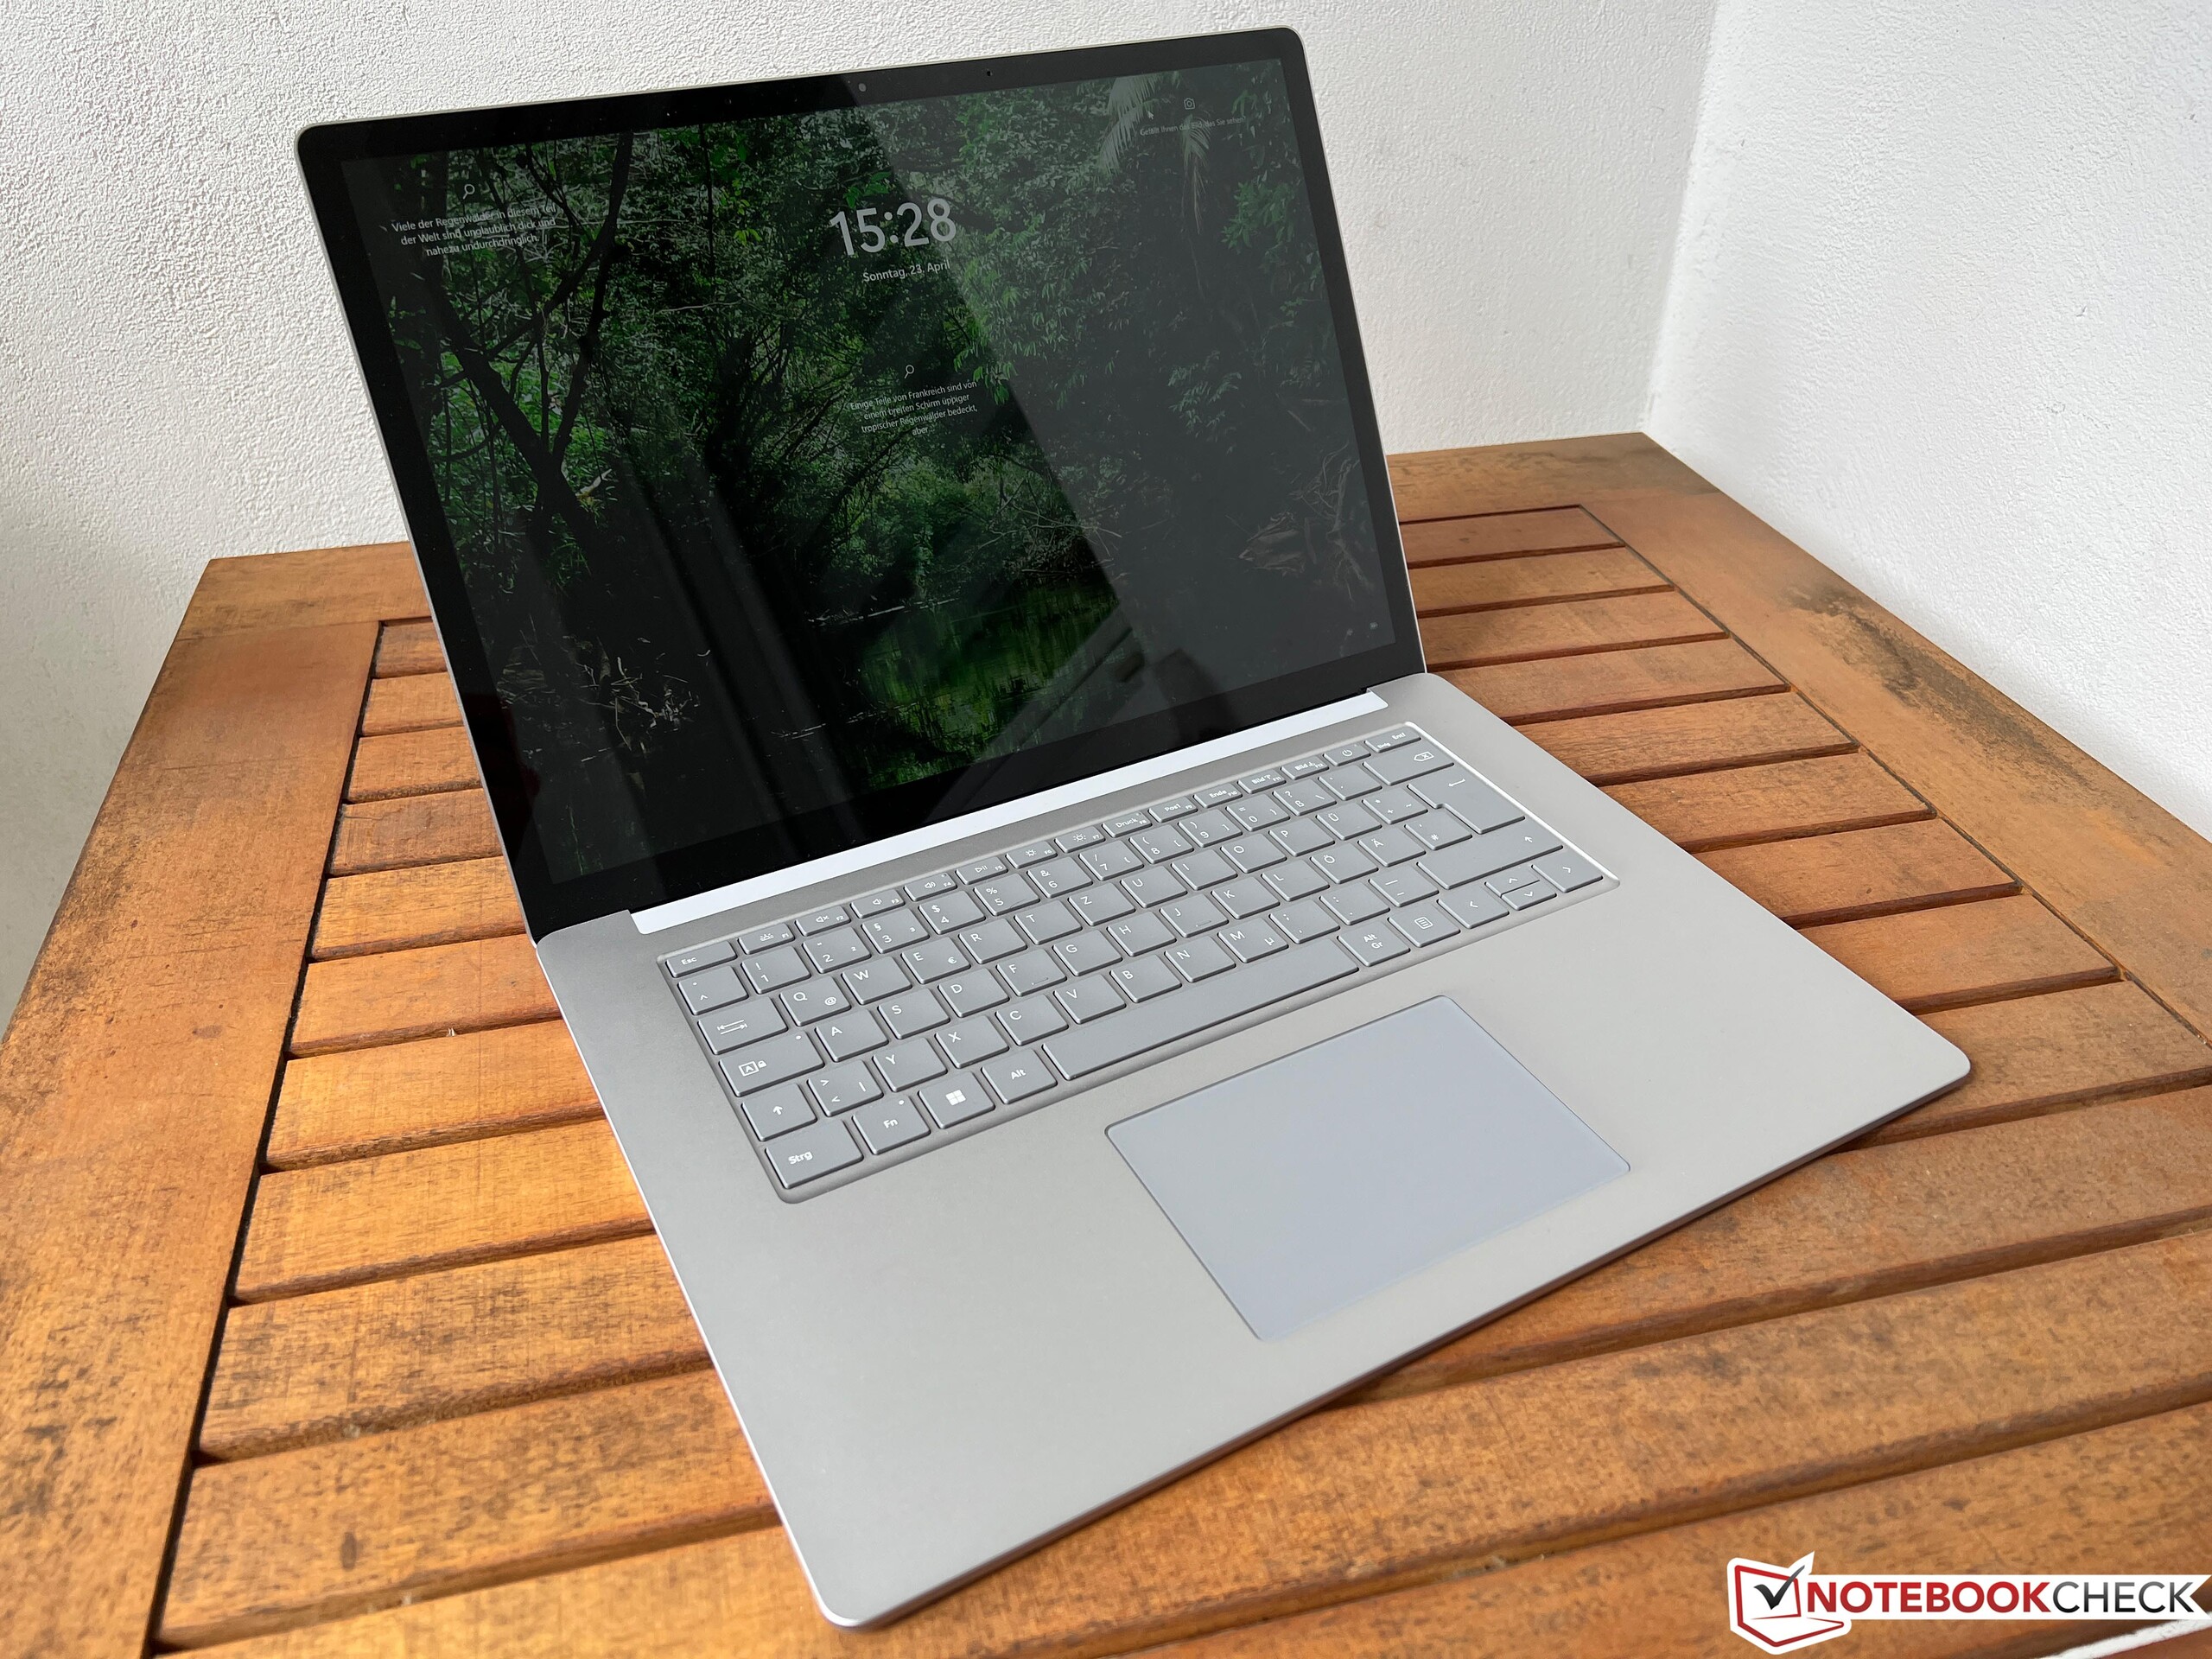
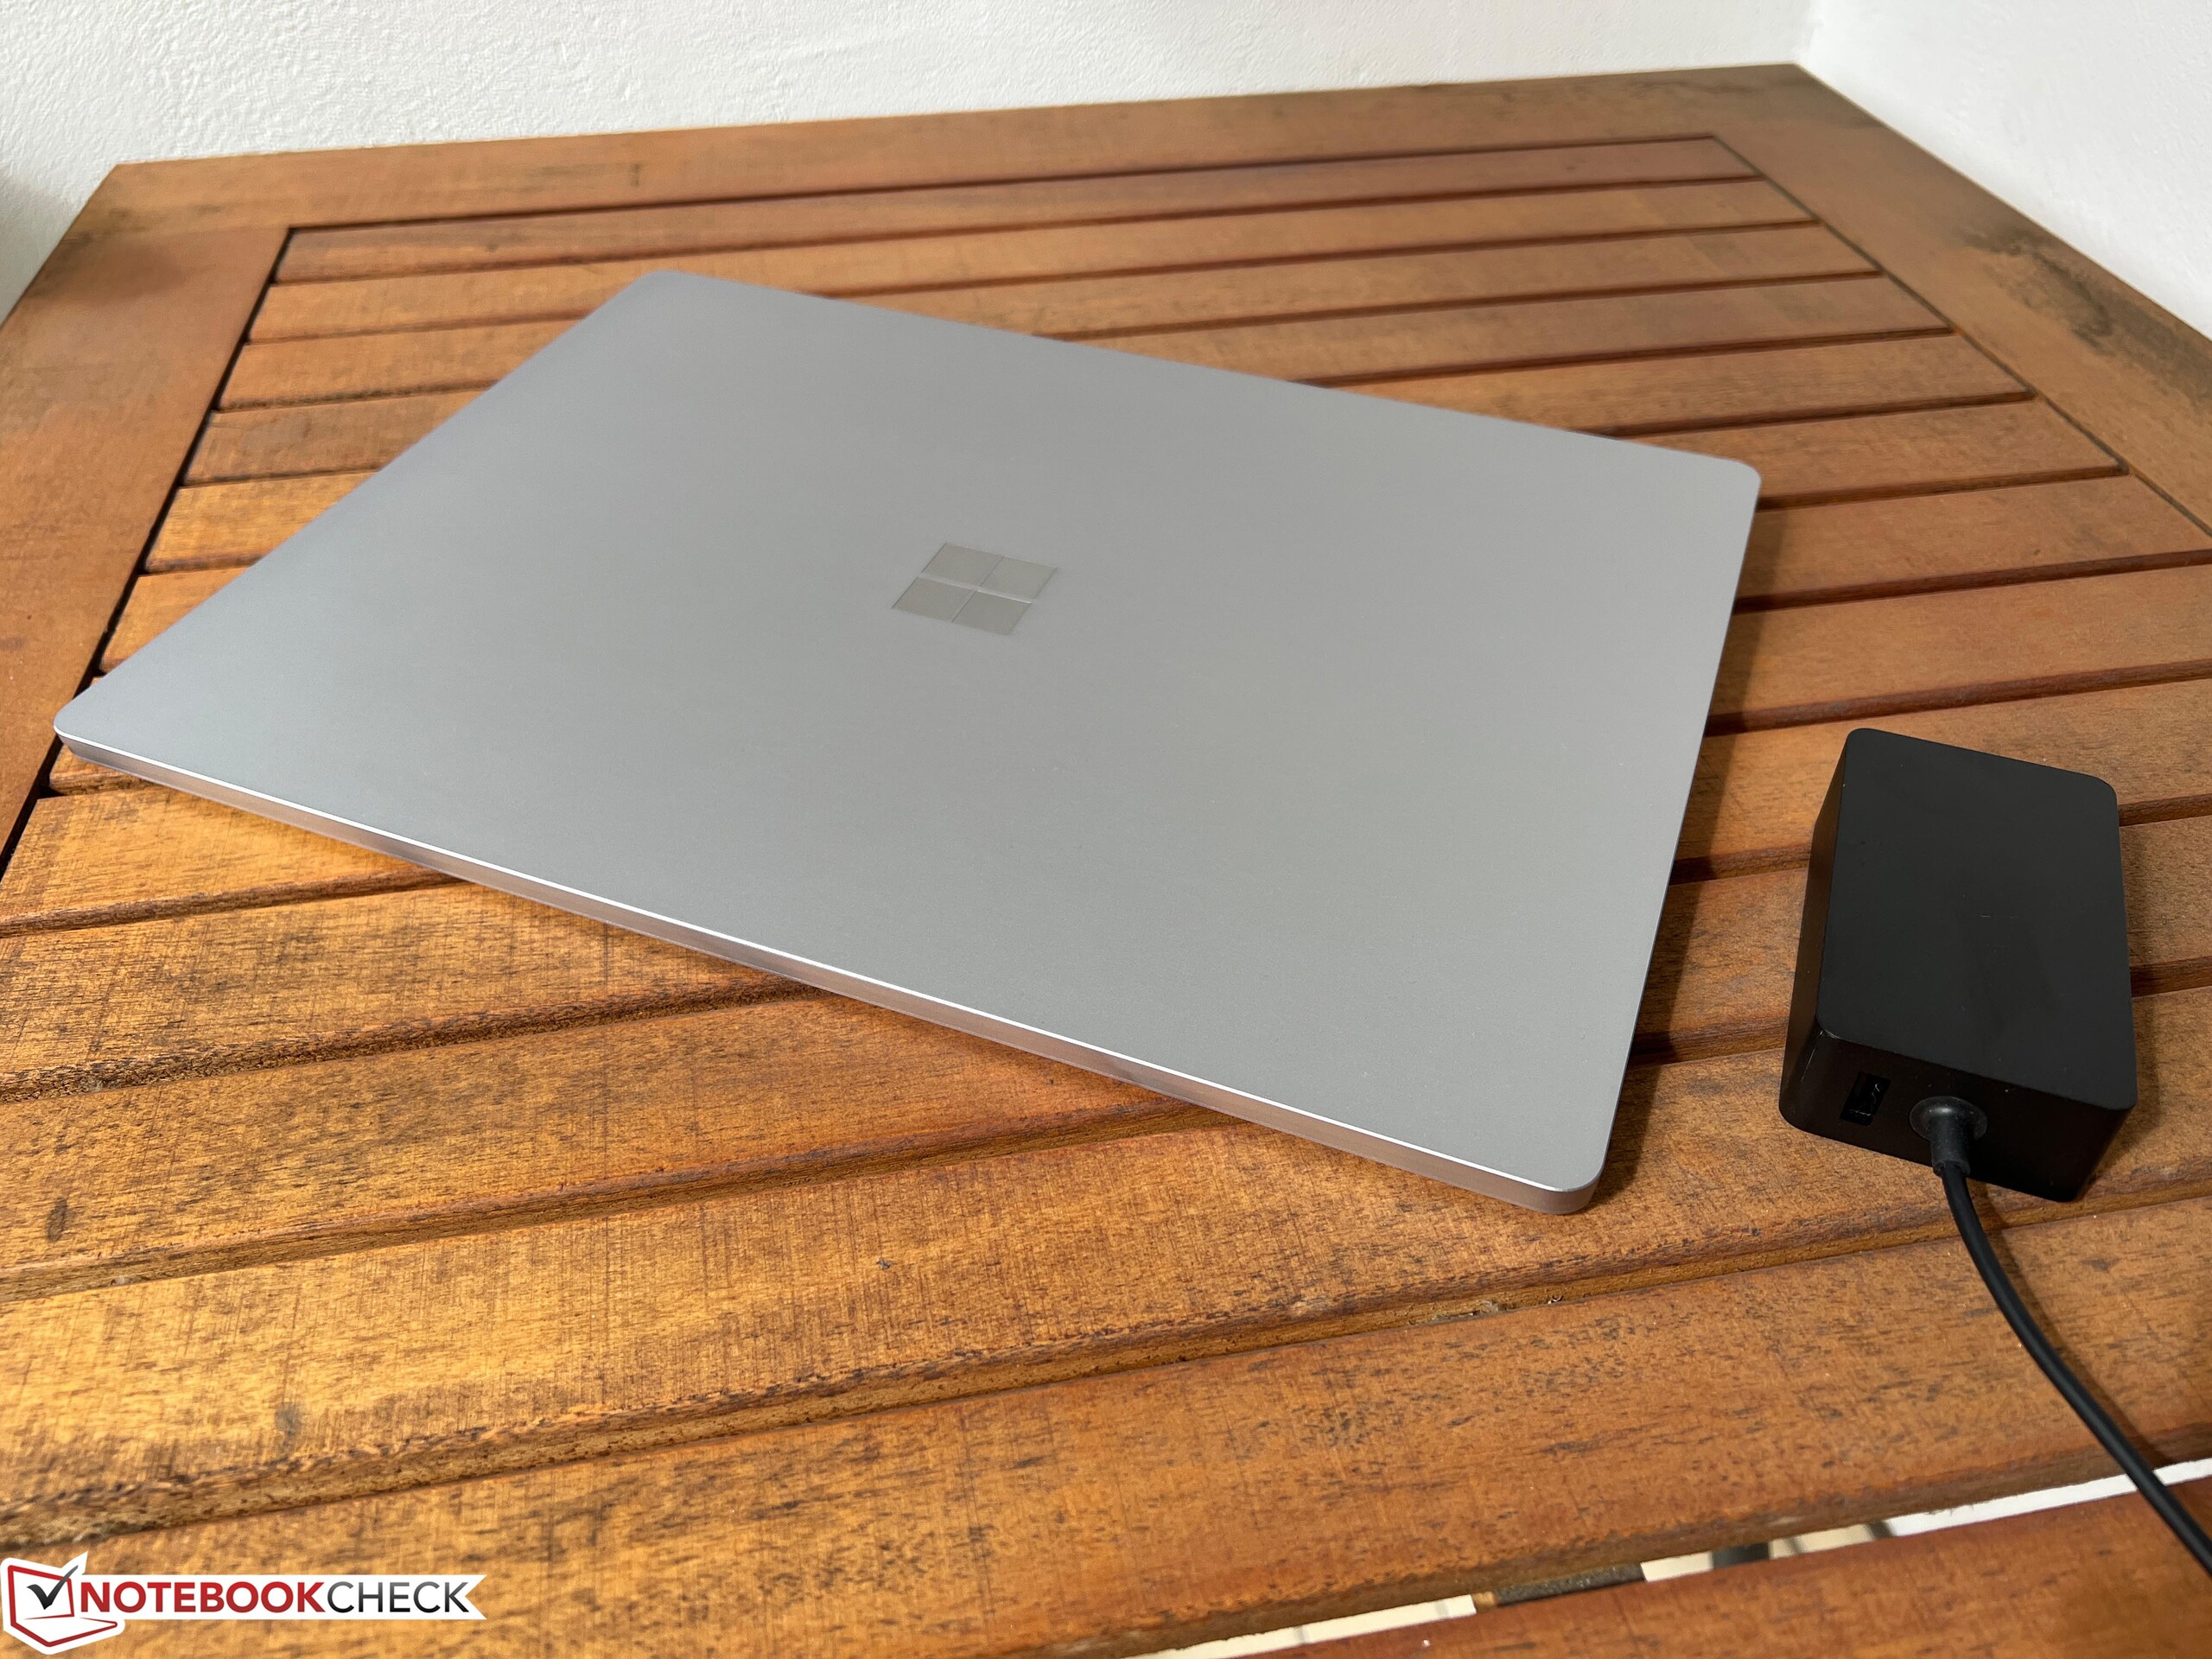
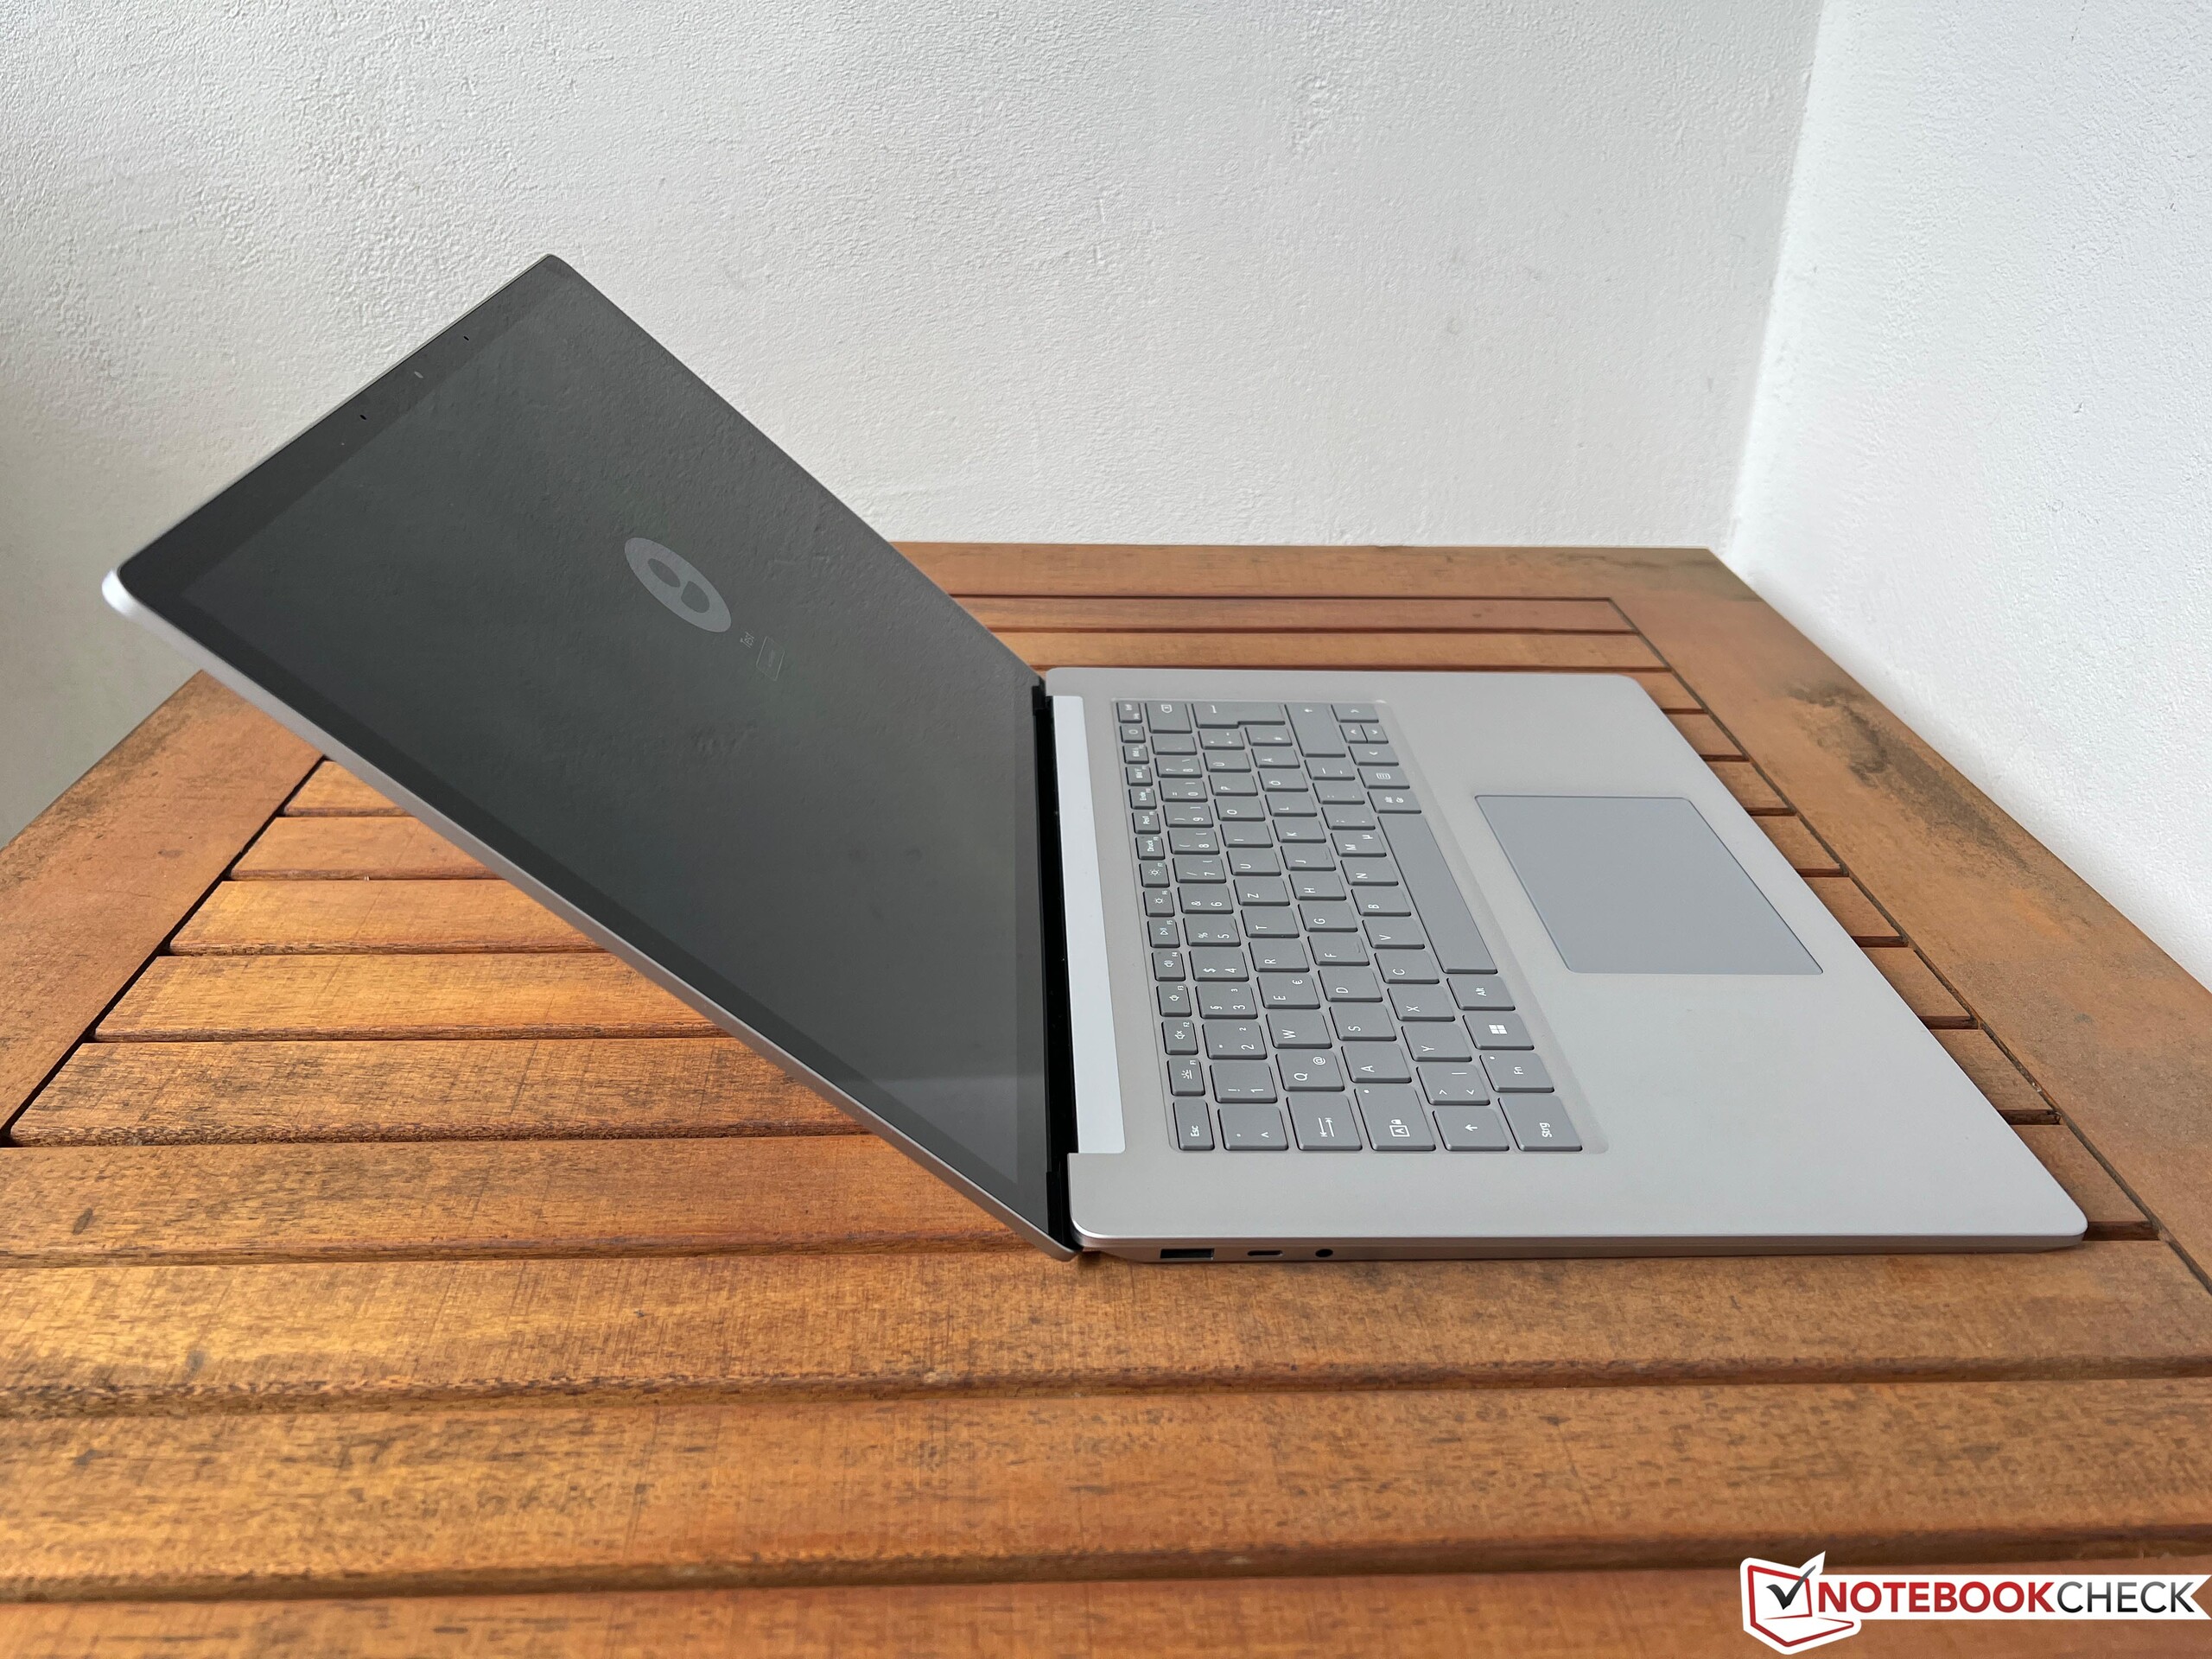
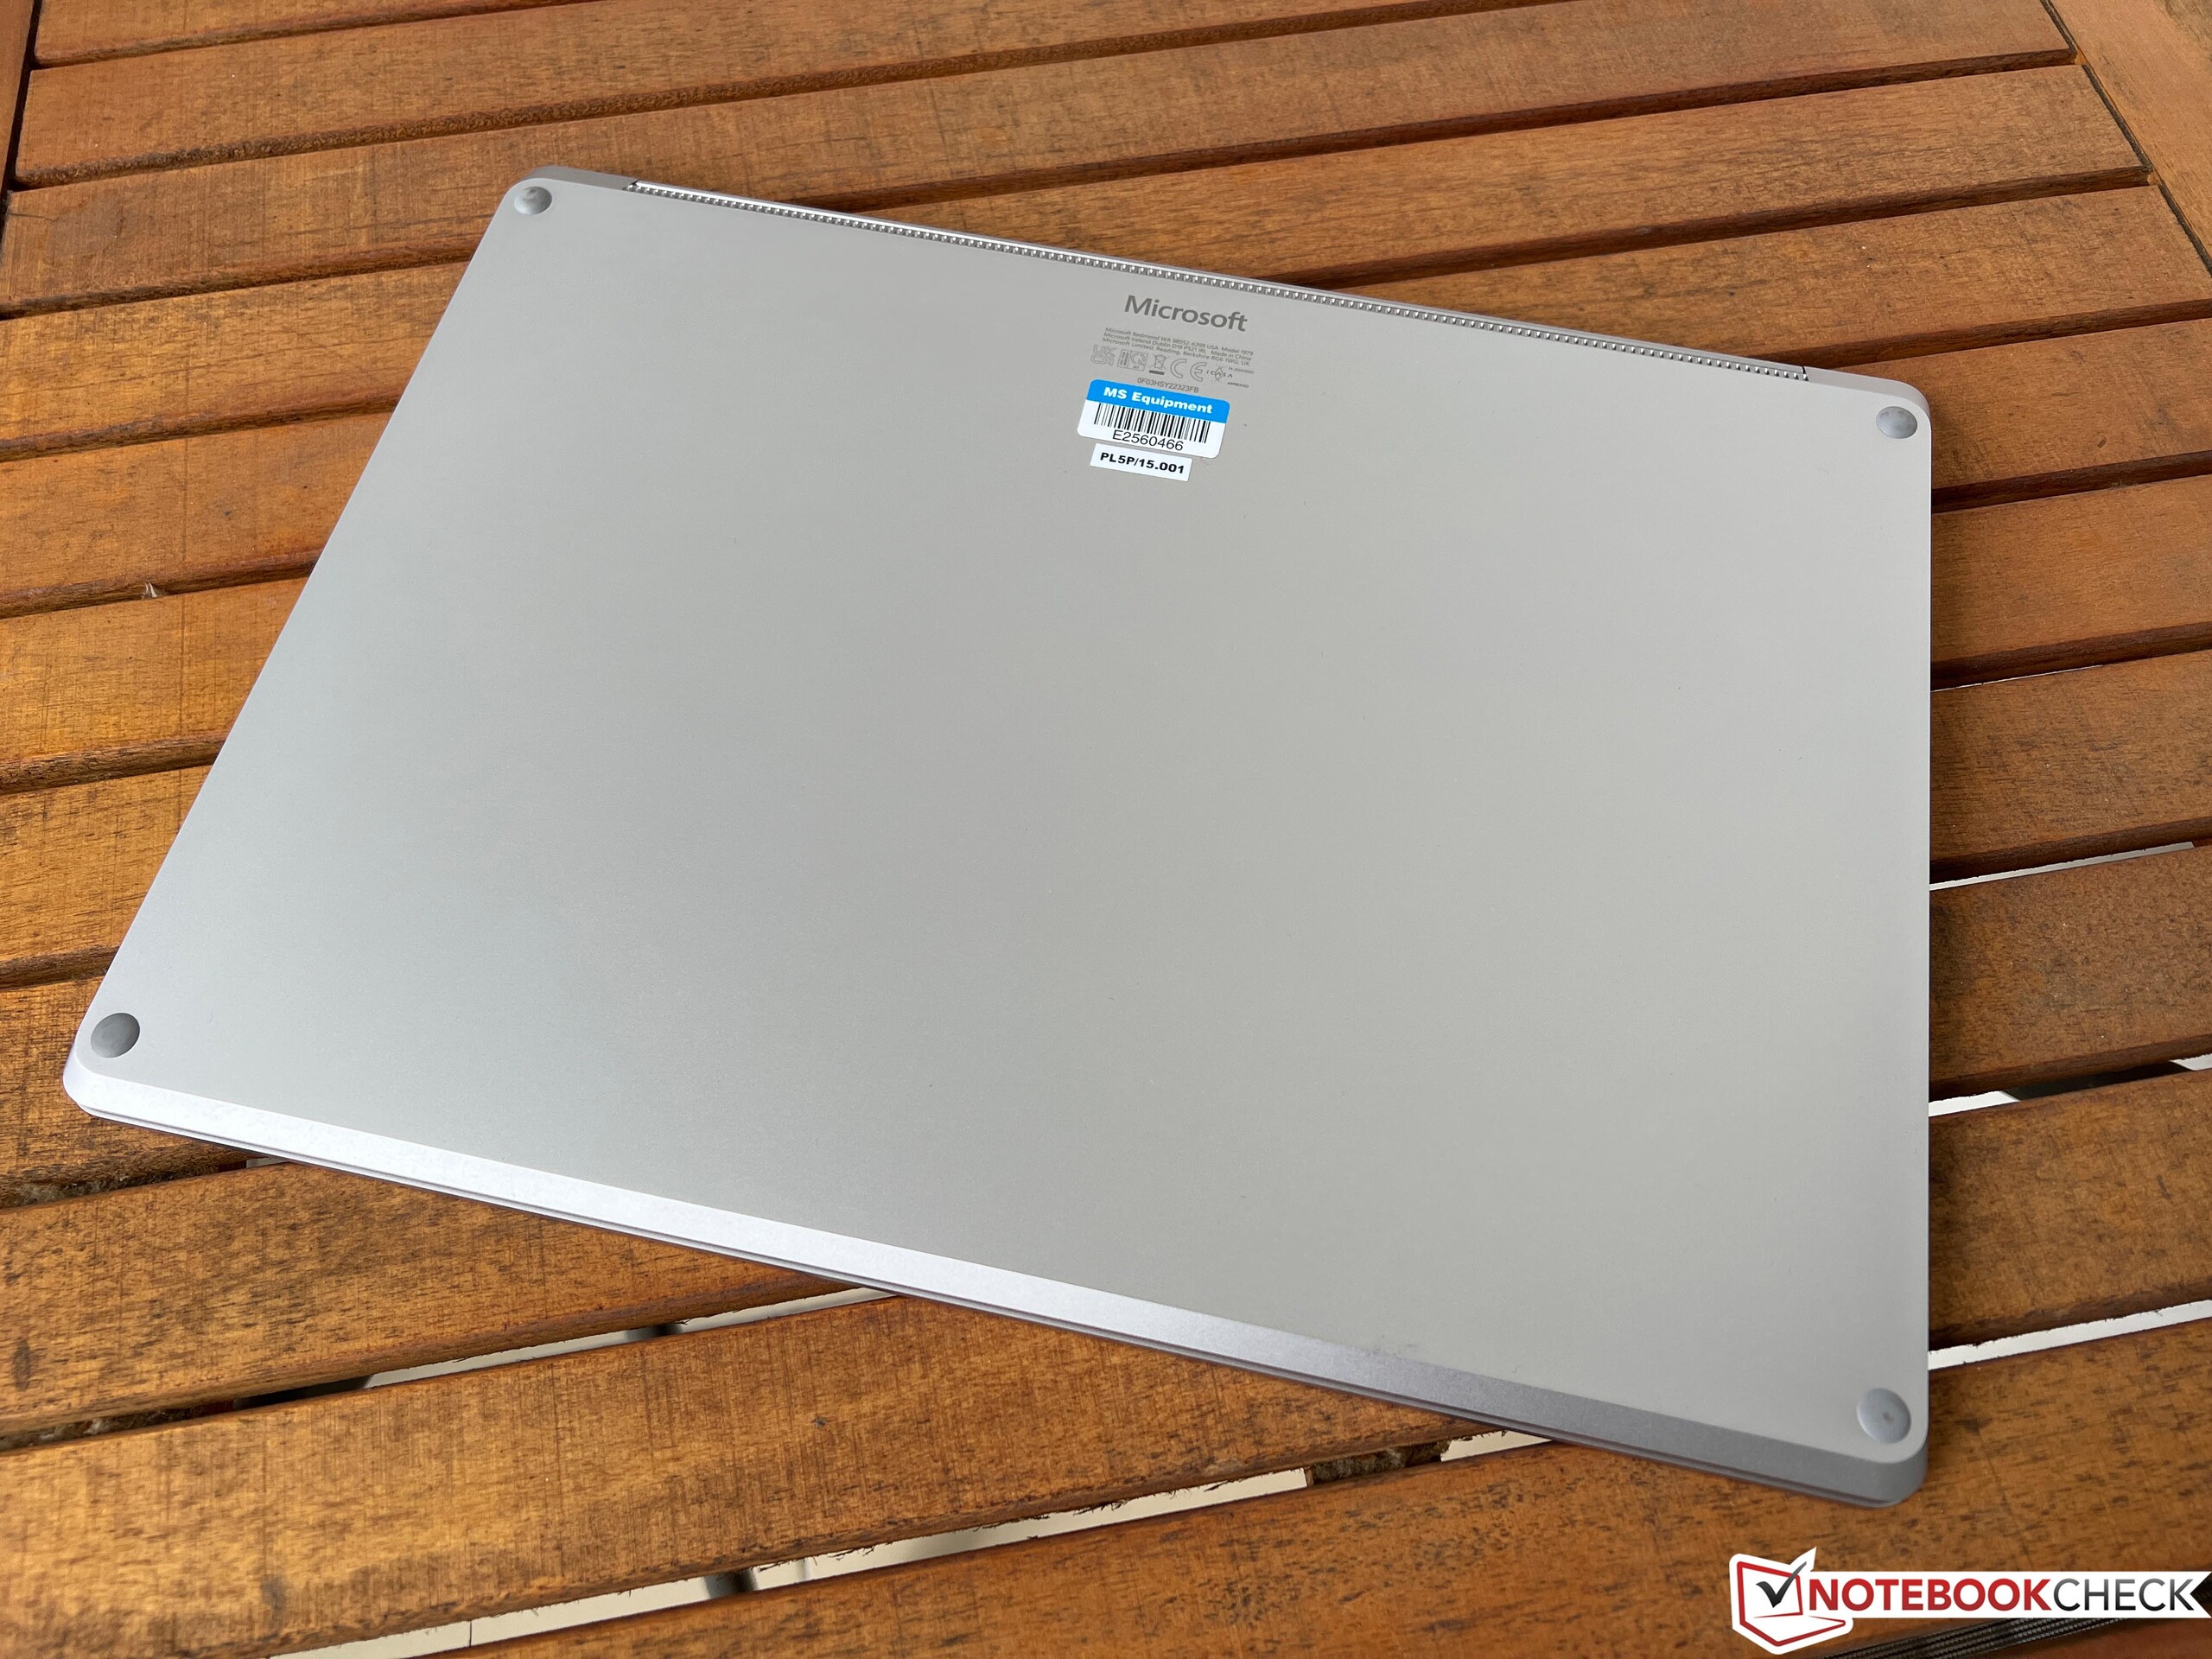
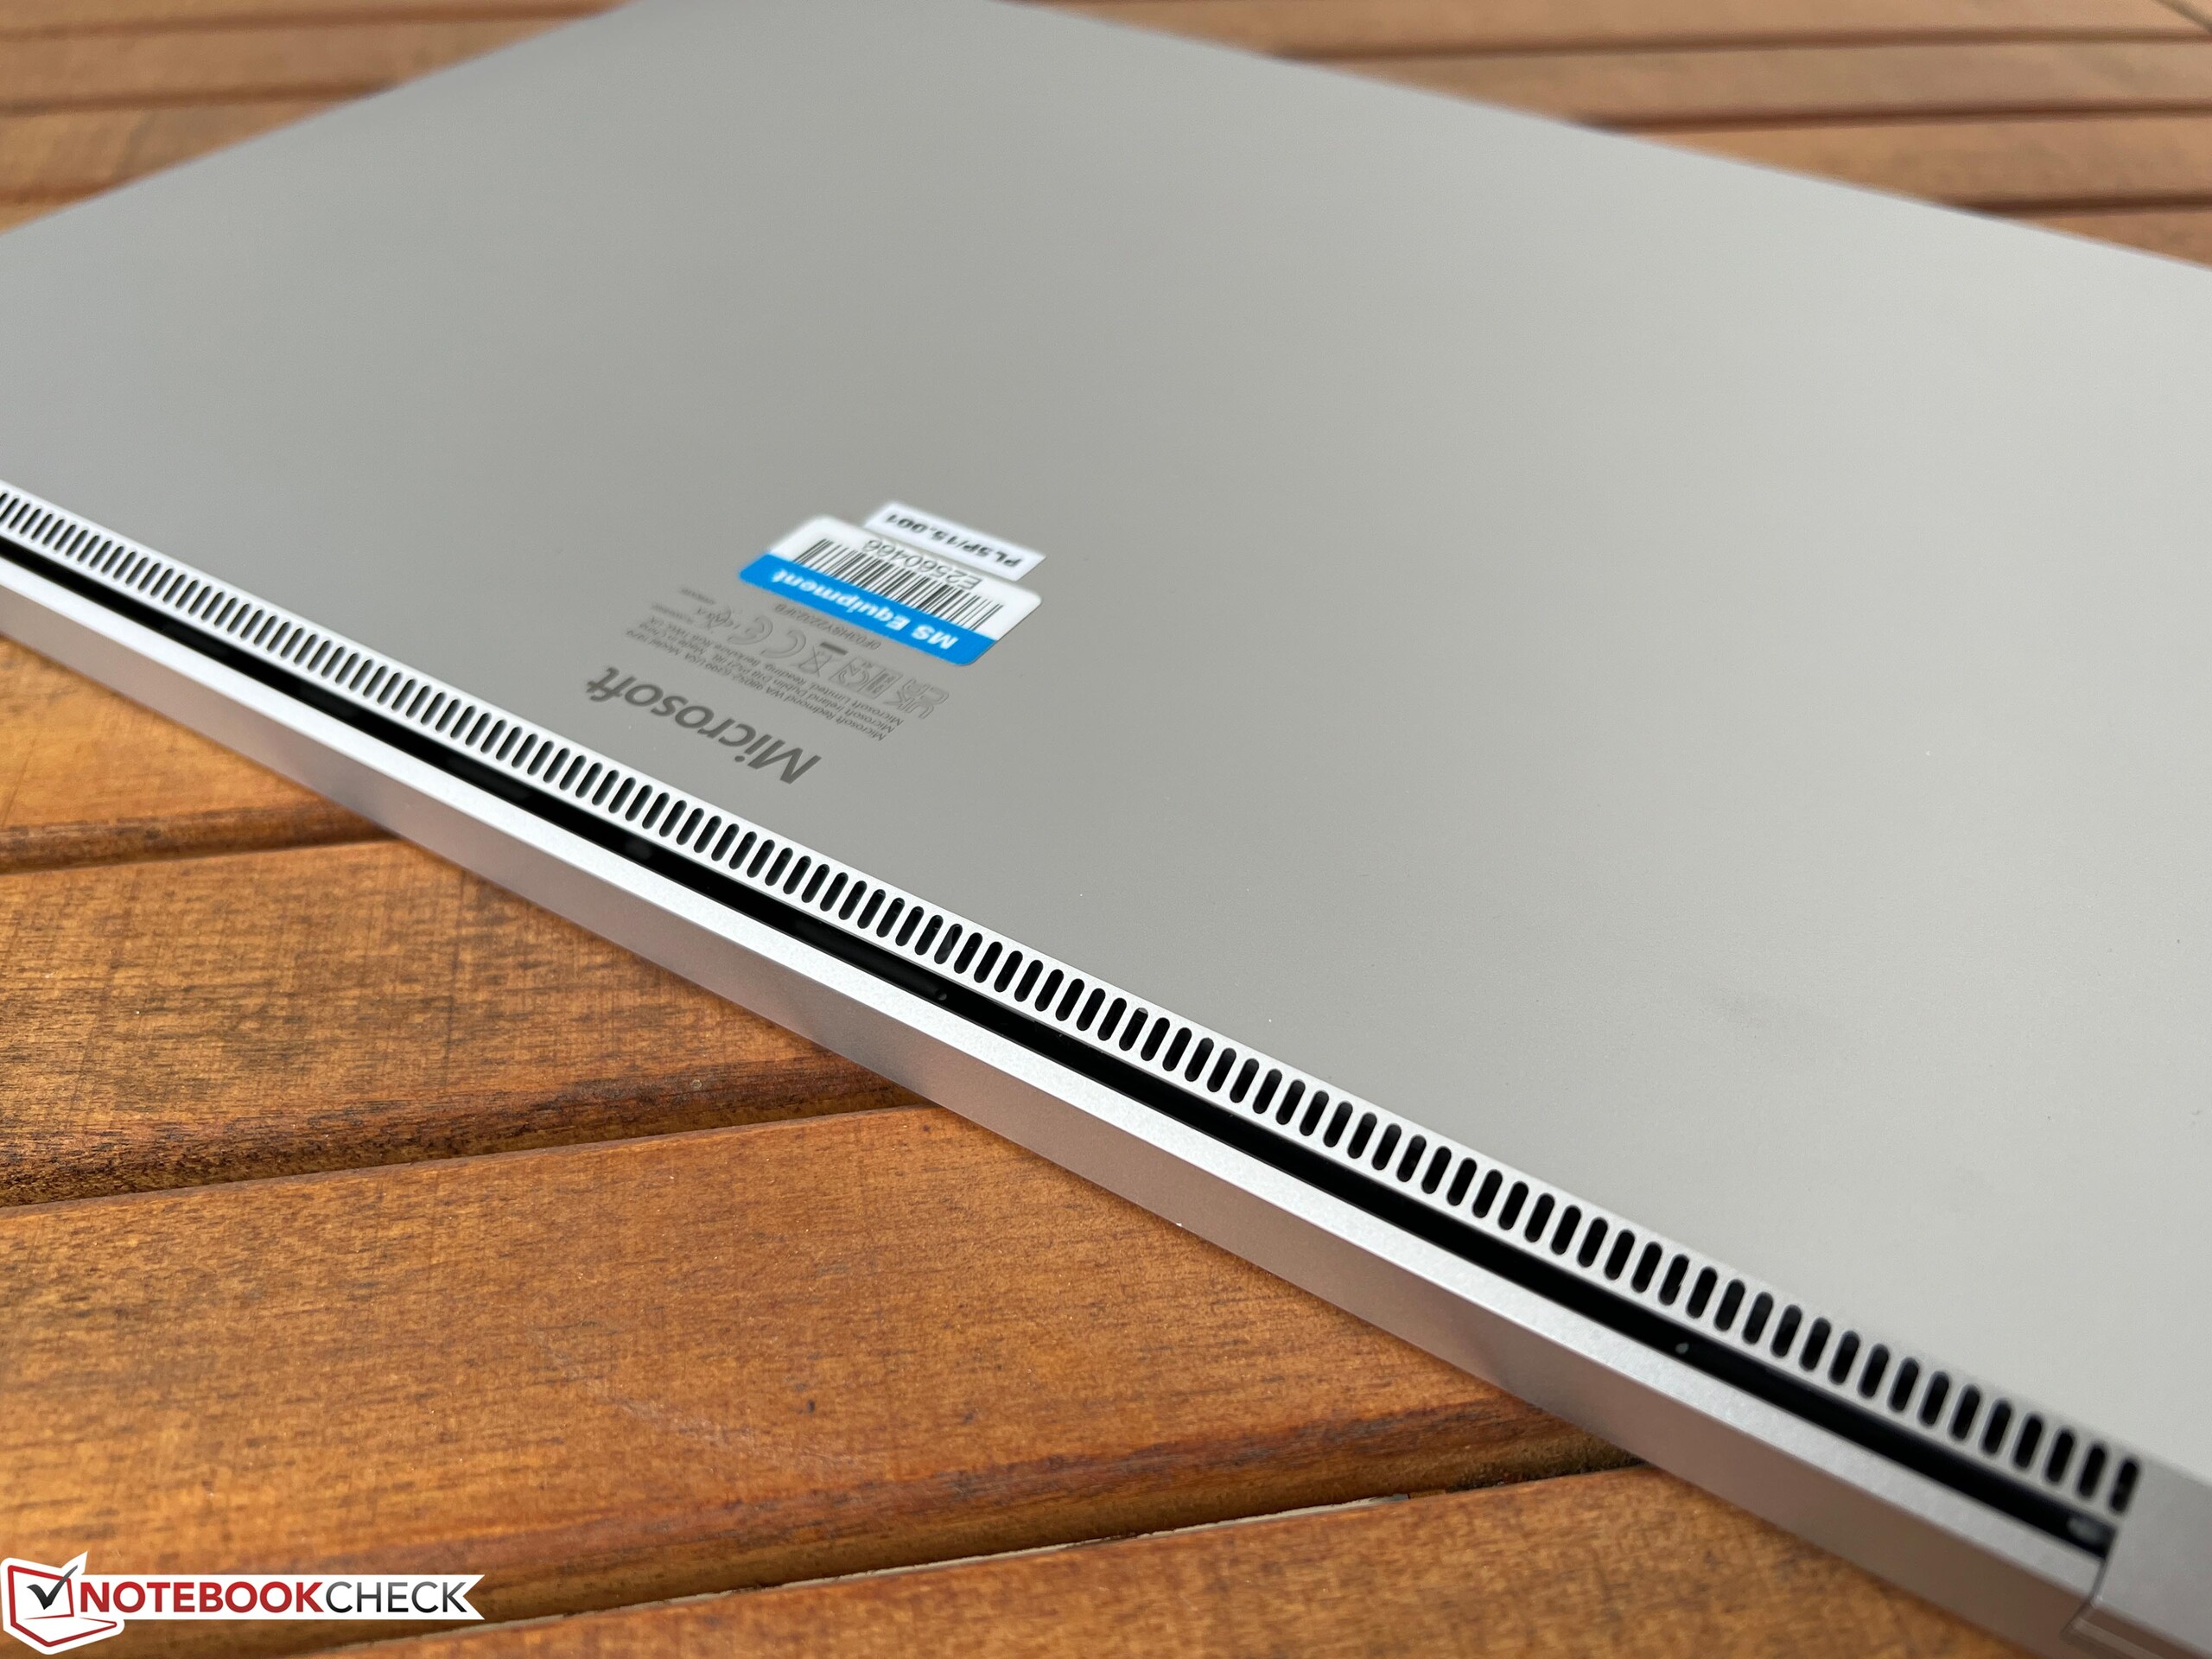
The laptop's case has remained the exact same as its predecessor's. Microsoft continue to offer platinum and black color options and generally, the device's metal case is made from good-quality materials - although, our test device tended to creak a lot when handled. In addition to this, its wide bezels are no longer very up-to-date, which ends up really showing the design's age. The screen's hinges are properly adjusted (max. opening angle ~135 degrees), but cannot prevent a slight teetering. The case still can't be opened, so it is neither possible for users to clean the fans nor to replace or upgrade any of the laptop's components.
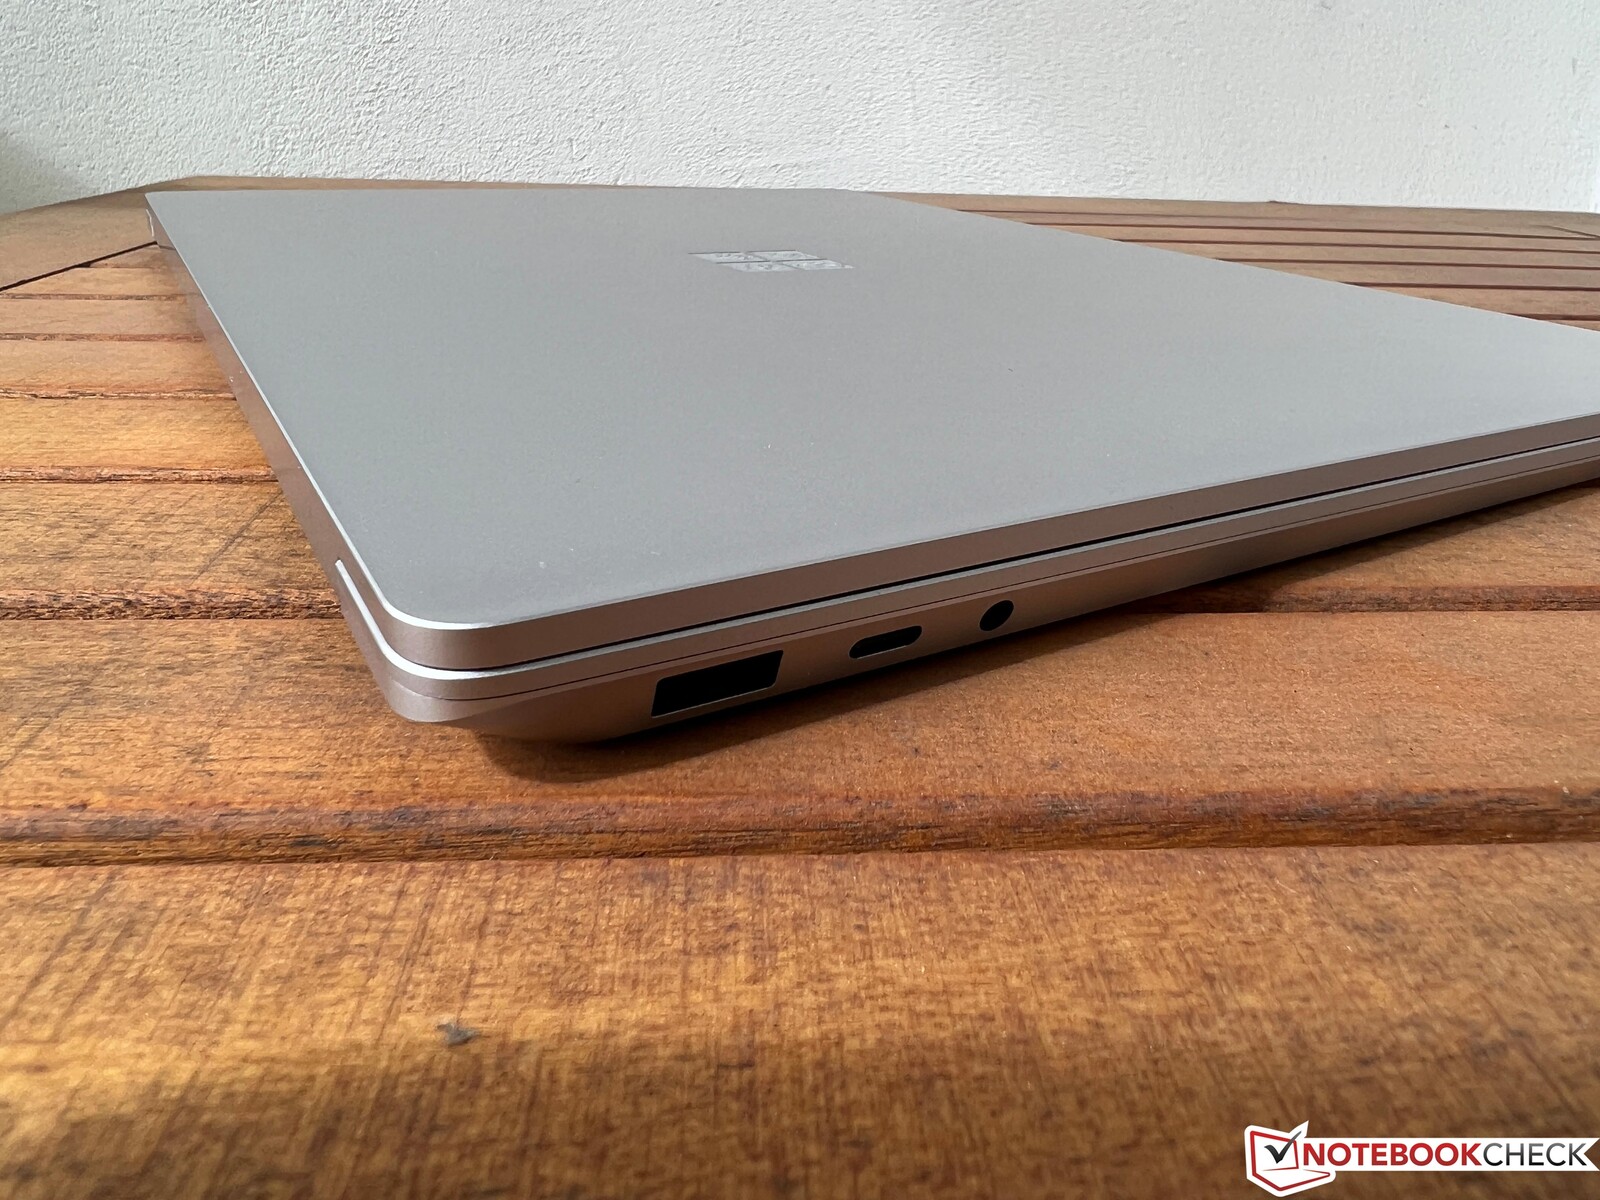
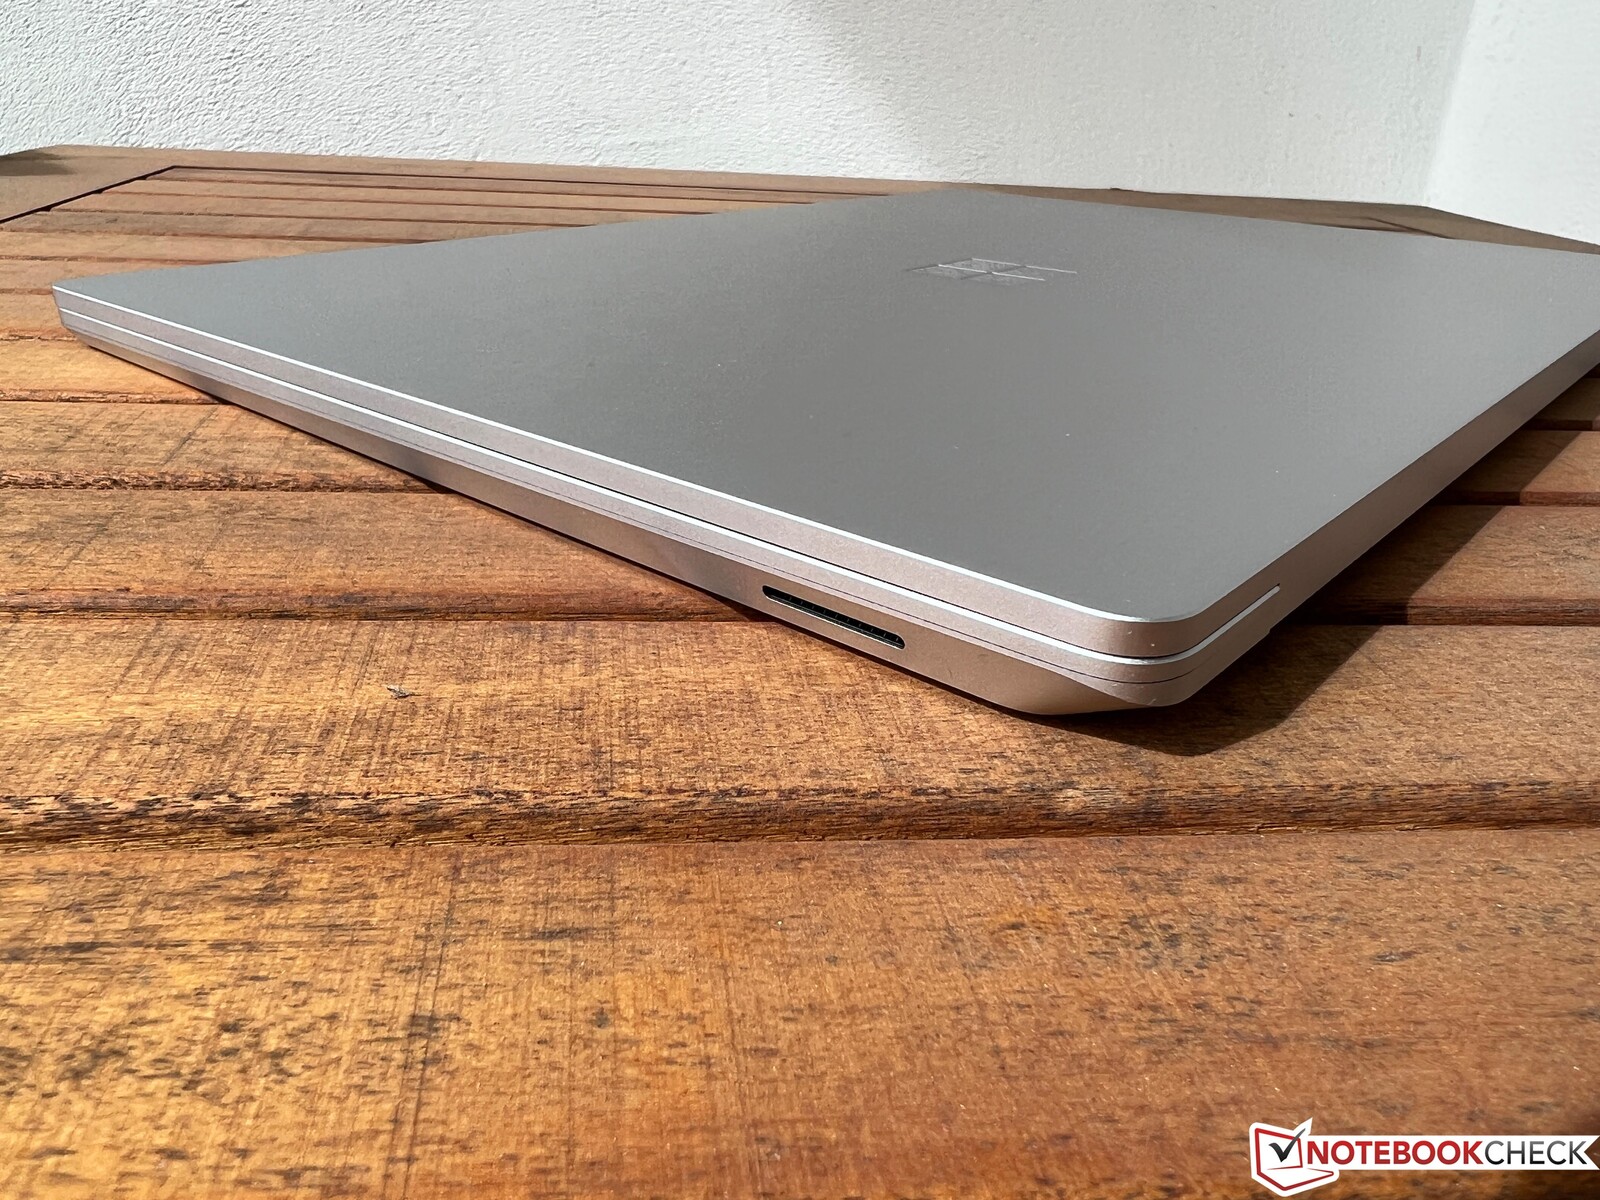
The connections are also mostly the same as before - although now, the USB-C connection finally supports Thunderbolt 4. The device still relies on a Surface Connect port for charging and connecting accessories. At least there is some continuity here, even though we still don't find the connector particularly practical. However, the device's port variety is very limited in view of the case's size.
The laptop still doesn't have an SD card reader and Microsoft have kept the old AX201 WLAN module. The webcam still only has a resolution of 720p - although, in good lighting conditions, the picture quality is actually somewhat decent.

| Networking | |
| Microsoft Surface Laptop 5 15, i7-1255U | |
| iperf3 transmit AXE11000 |
|
| iperf3 receive AXE11000 |
|
| Microsoft Surface Laptop 4 15 AMD TFF_00028 | |
| iperf3 transmit AX12 |
|
| iperf3 receive AX12 |
|
| LG Gram 15Z90Q | |
| iperf3 transmit AXE11000 |
|
| iperf3 receive AXE11000 |
|
| Dell XPS 15 9520 RTX 3050 Ti | |
| iperf3 transmit AXE11000 |
|
| iperf3 receive AXE11000 |
|
| Samsung Galaxy Book Pro 15 NP950XDB-KC5US | |
| iperf3 transmit AX12 |
|
| iperf3 receive AX12 |
|
| Asus Zenbook Pro 15 OLED UM535Q | |
| iperf3 transmit AX12 |
|
| iperf3 receive AX12 |
|


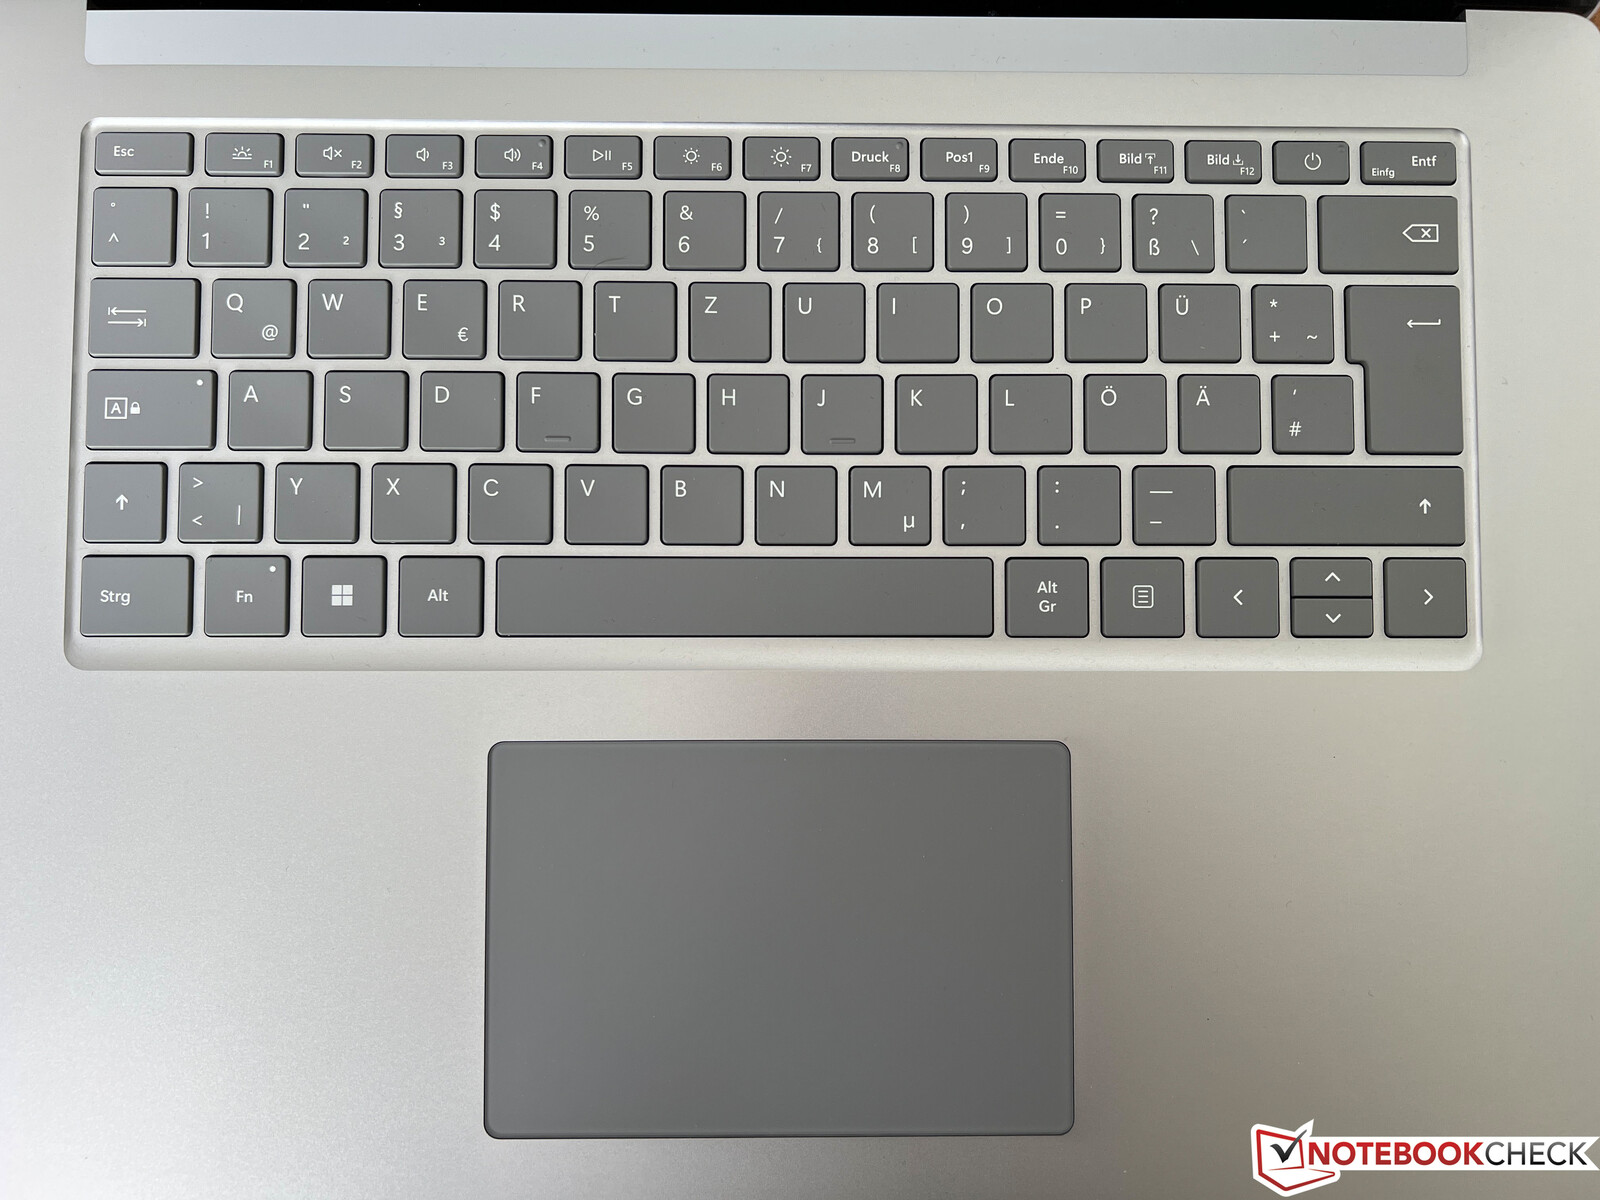
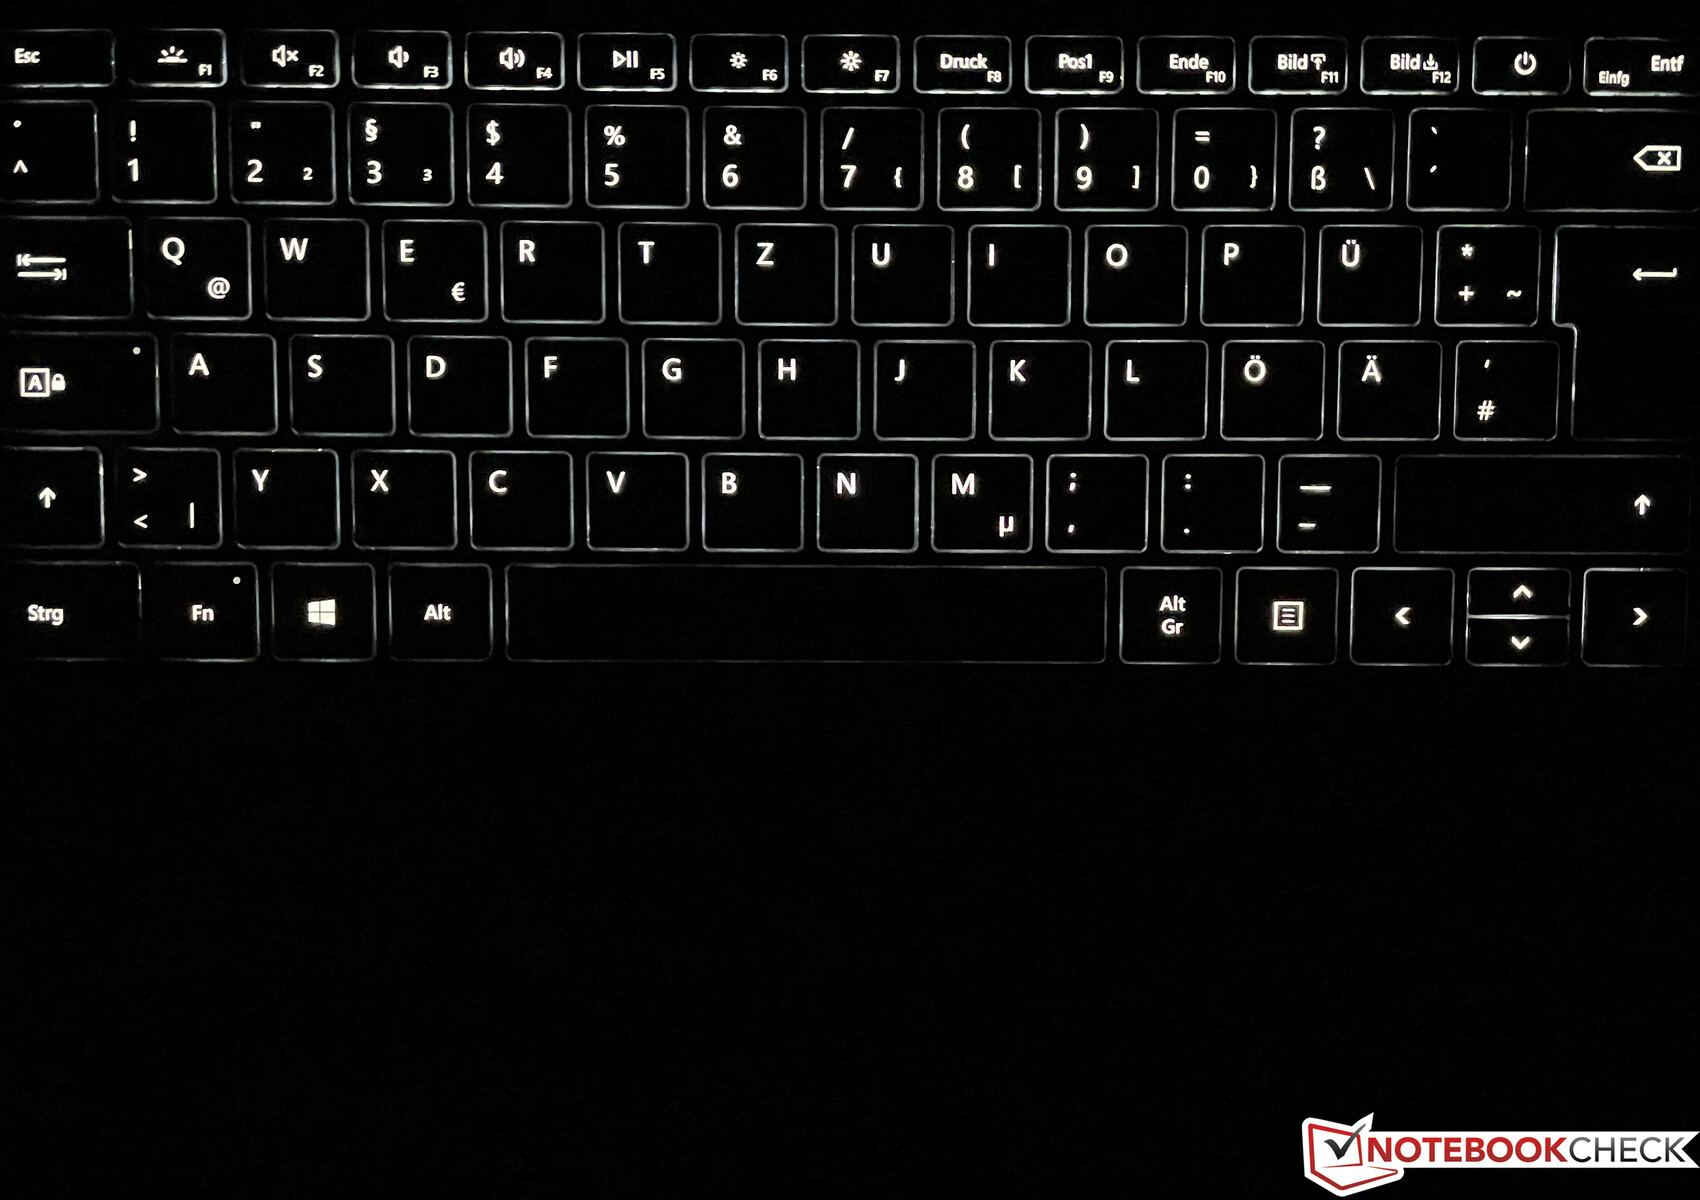
Input devices - Backlit keyboard and small clickpad
The input devices have also been adopted from the previous model. Overall, the keyboard feels okay when you type, but its large keys still tend to rattle a bit. You can definitely write longer texts with the device, but there are clearly better keyboards on the market. The keyboard's white backlight has three adjustment levels.
The clickpad makes quite a good impression and the normal pointer control doesn't cause any problems. The click noise is also not too loud. Its 11.5 x 7.7 cm size is still sufficient, but there would definitely be much more room for a larger pad.
Display - PixelSense touchscreen
The 15-inch display still has a resolution of 2,496 x 1,664 pixels in a 3:2 aspect ratio. Subjectively, the touchscreen's picture quality still looks very good, but the laptop's technical specs of 60 Hz and sRGB coverage are not very up-to-date anymore, especially for this price range. The device has a brightness of 400 cd/m², and we measured a maximum of 438 cd/m² (average ~400 cd/m²). Its black value of 0.29 is okay and this results in a contrast ratio of almost 1400:1.
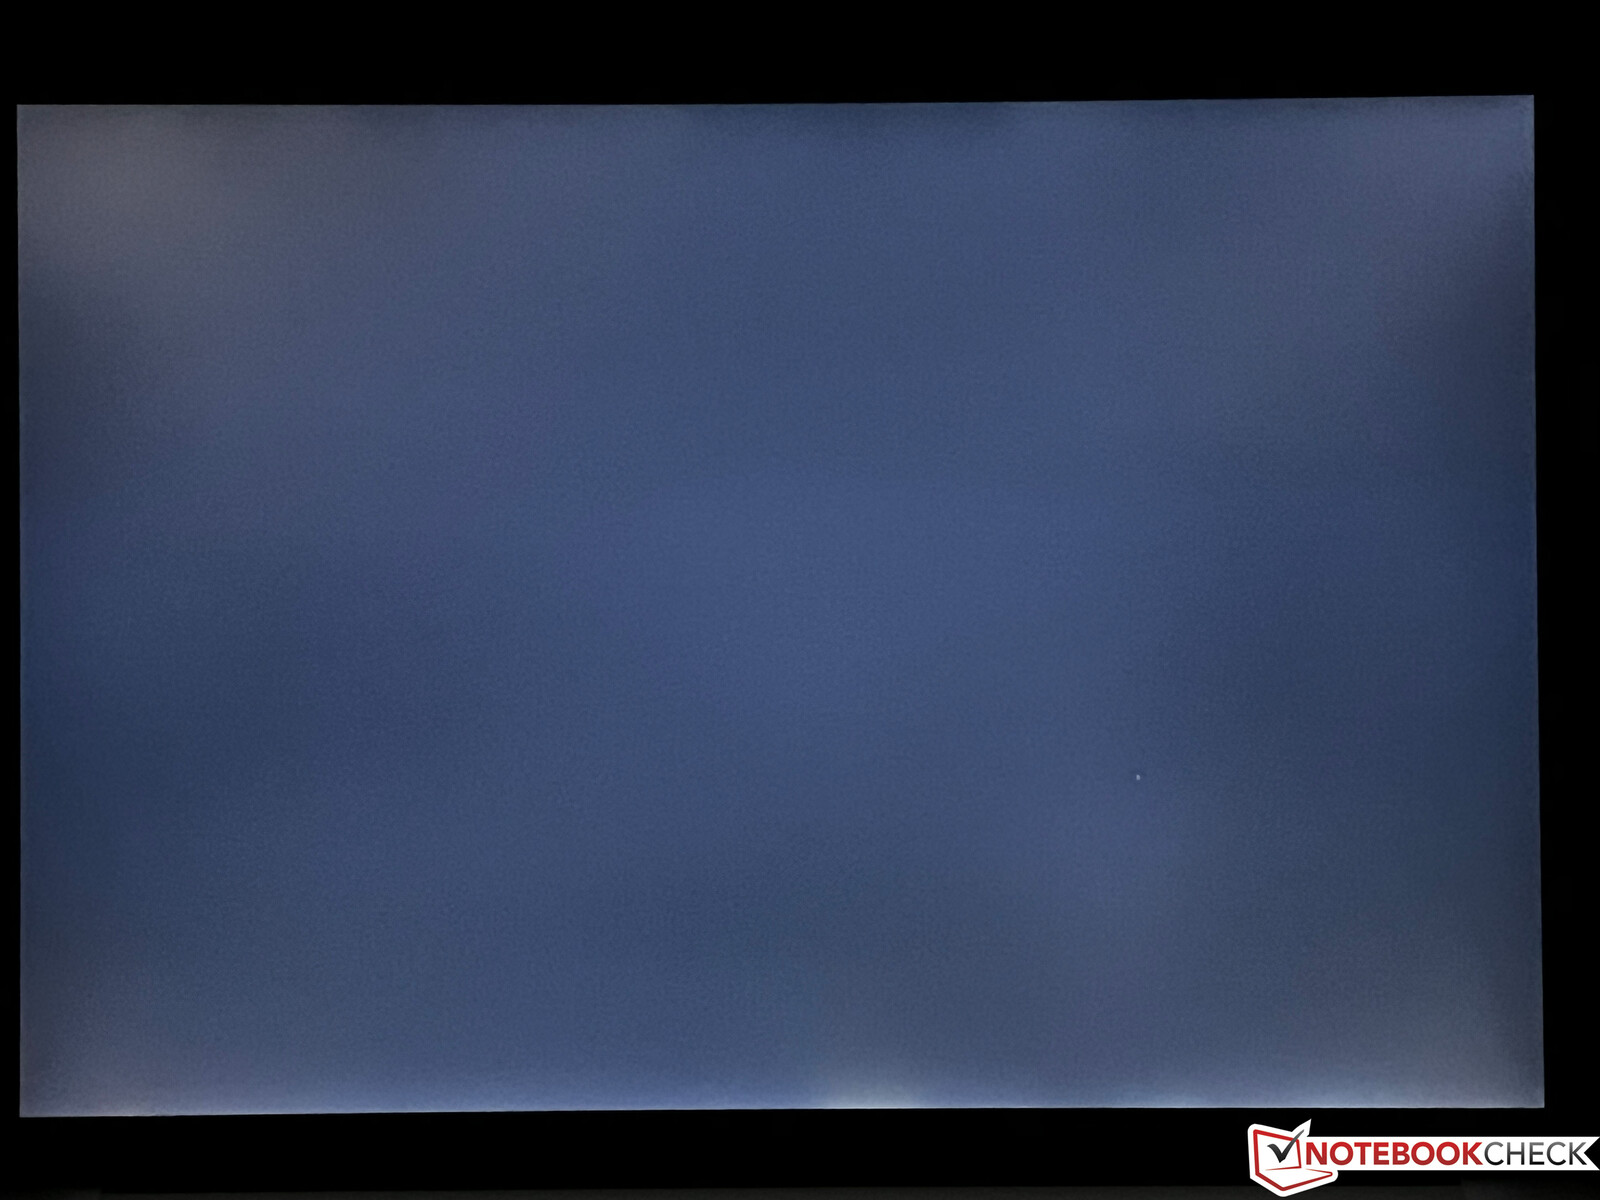
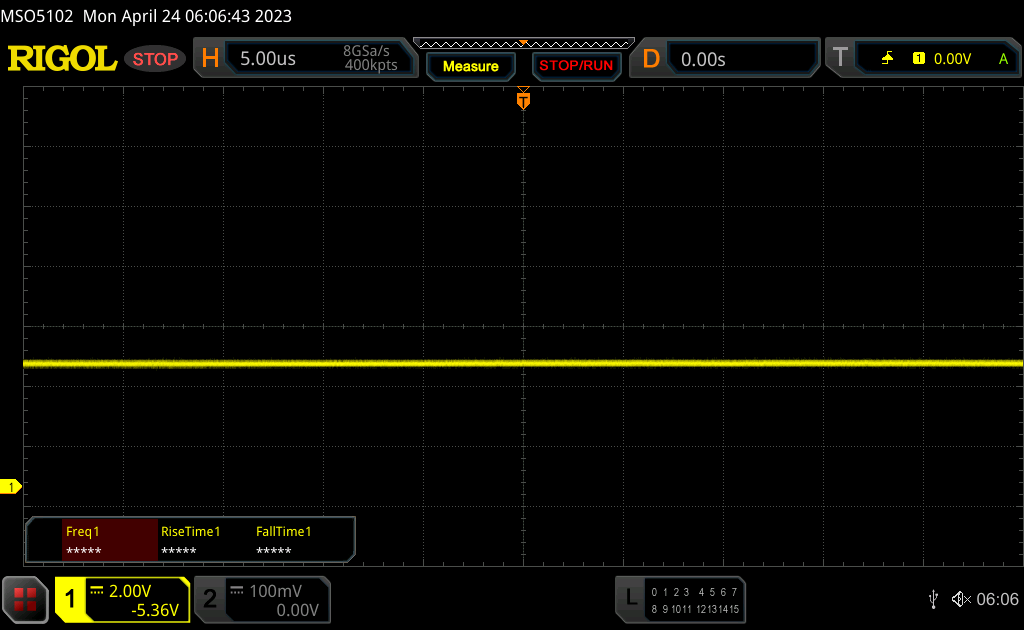
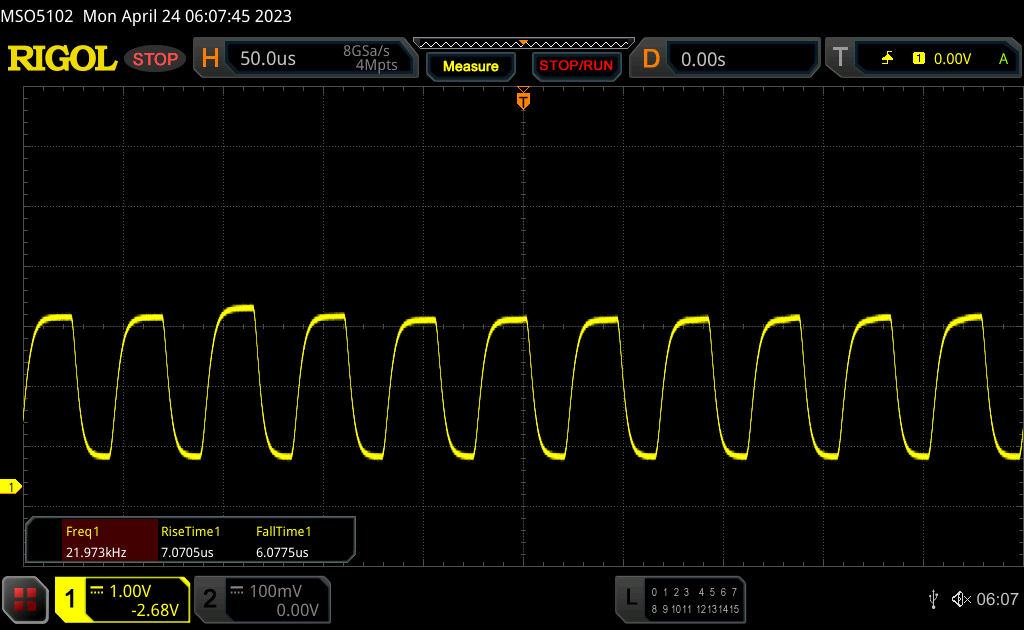
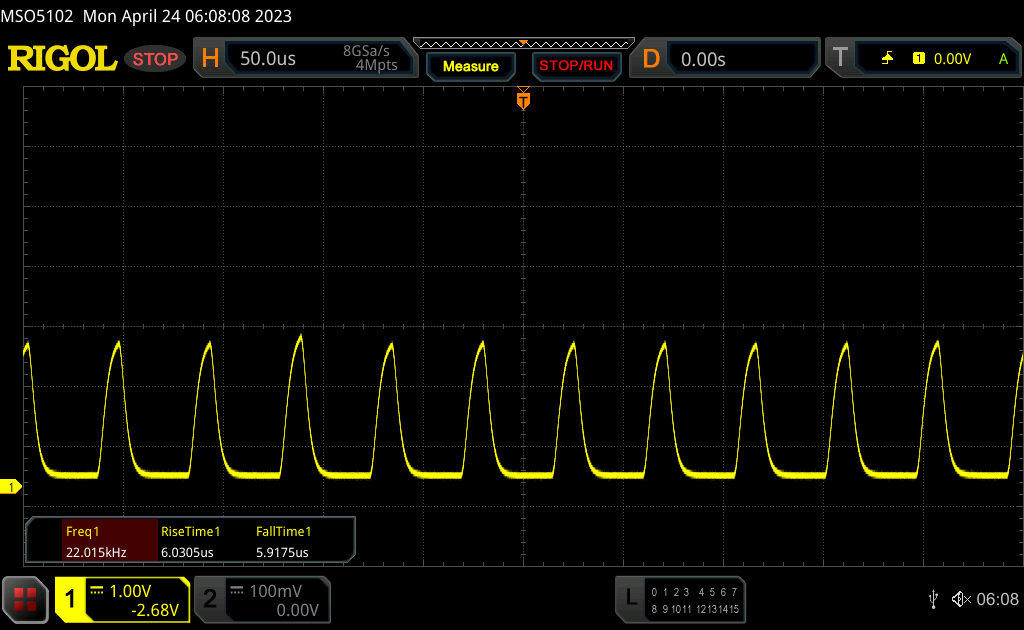
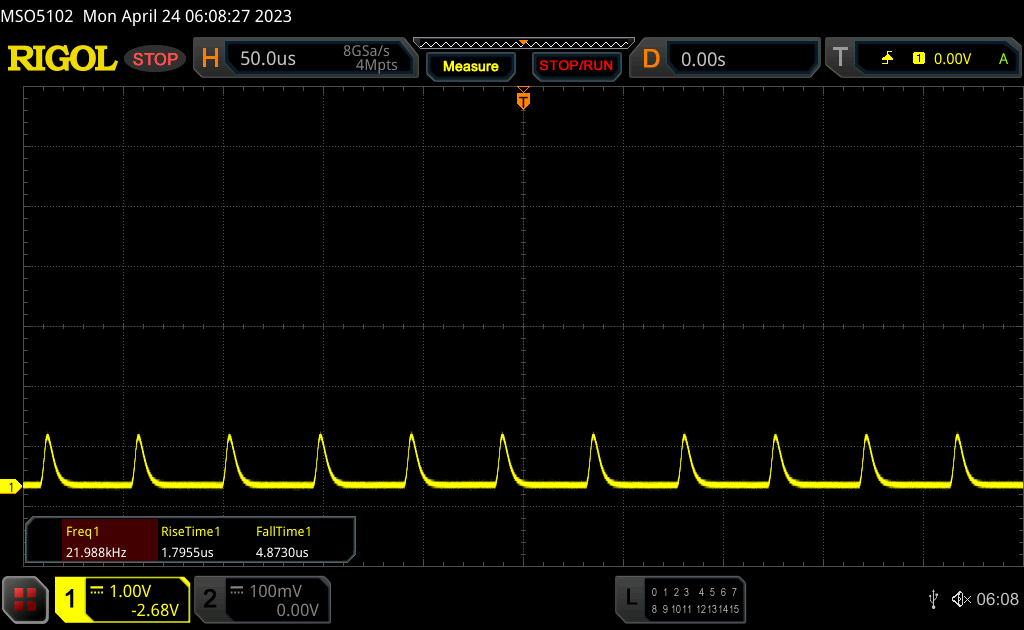
The panel shows slight screen bleeding toward the lower screen edge at high brightness levels with a black background, but this shouldn't be too annoying in everyday use. PWM can also be seen at a brightness of 50% or less, but its frequency of ~22 kHz is extremely high and should not cause any problems for users.
| |||||||||||||||||||||||||
Brightness Distribution: 85 %
Center on Battery: 395 cd/m²
Contrast: 1369:1 (Black: 0.29 cd/m²)
ΔE Color 0.8 | 0.5-29.43 Ø5
ΔE Greyscale 1.1 | 0.57-98 Ø5.3
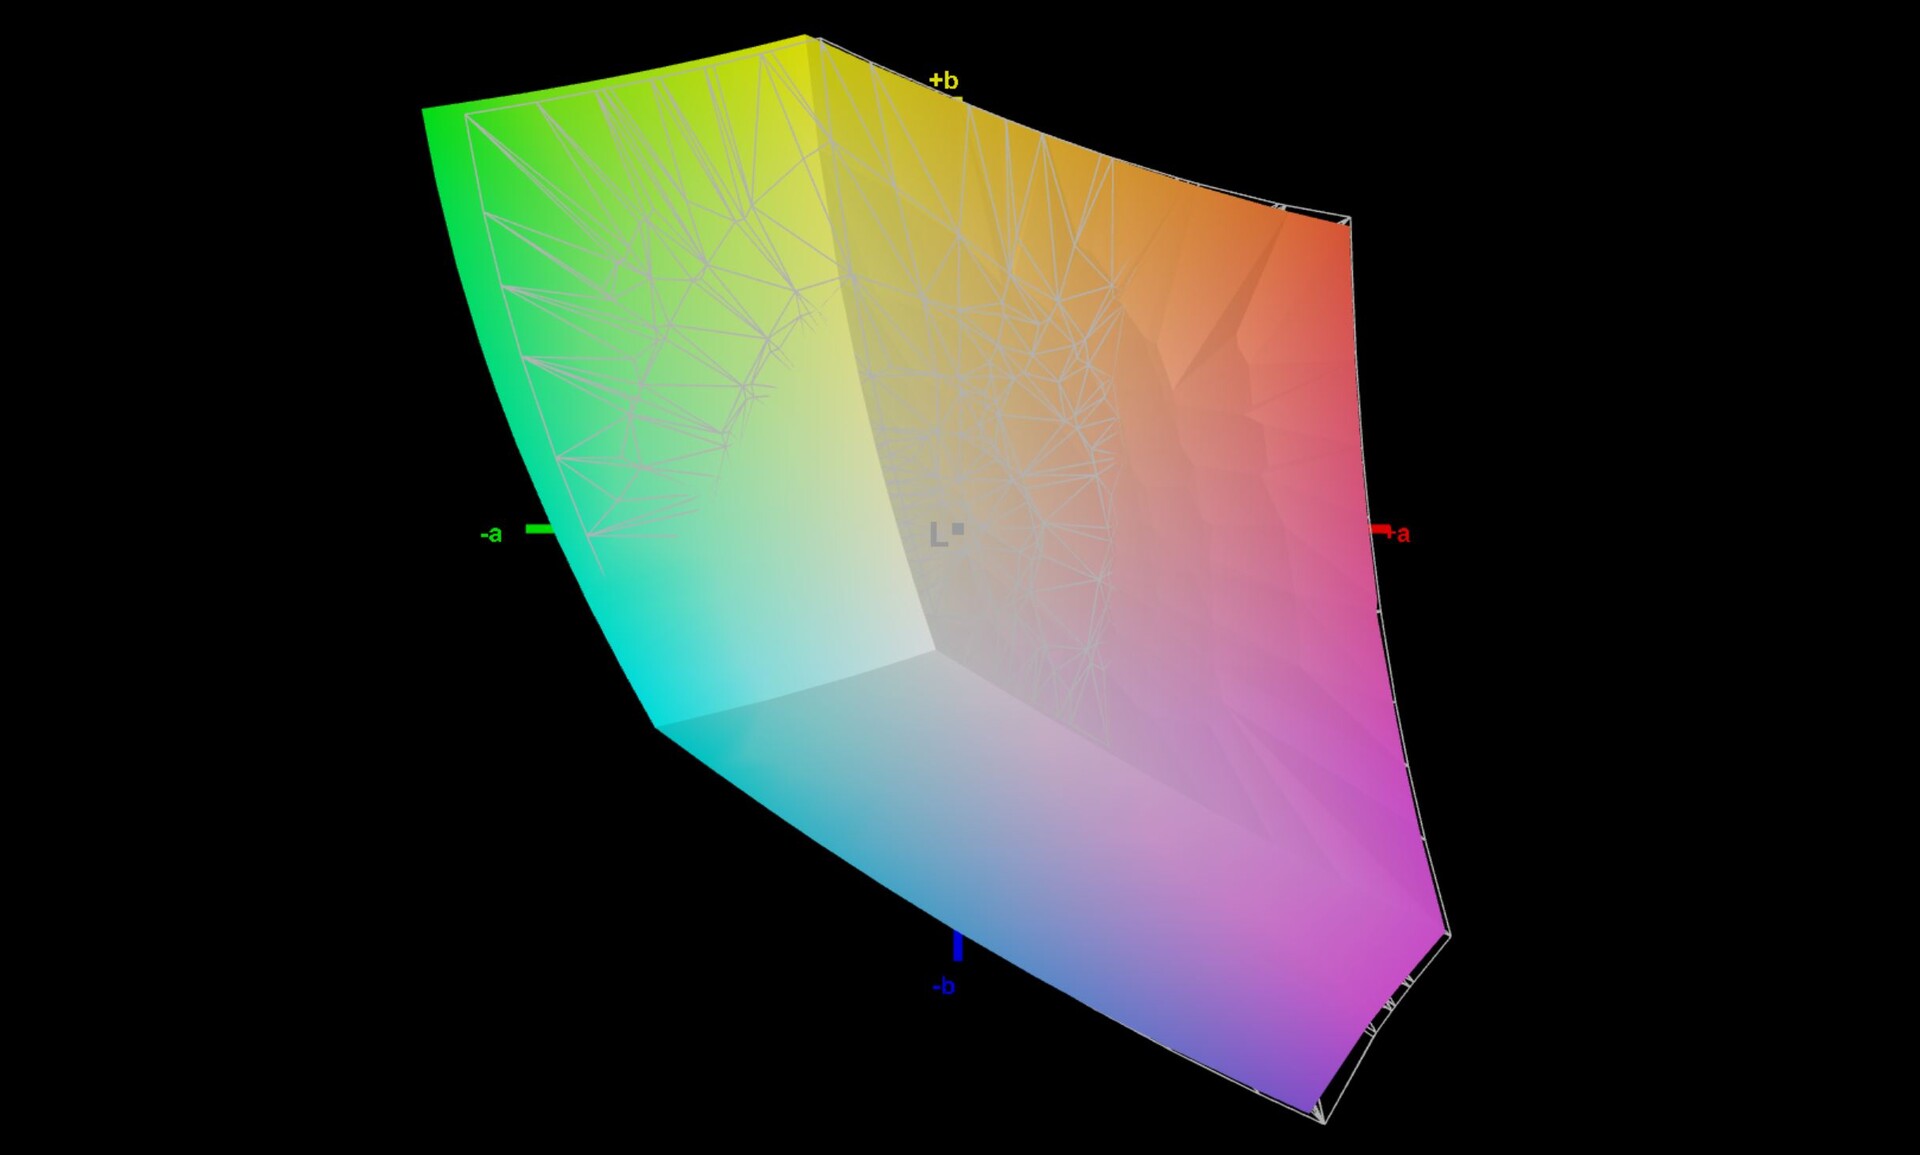
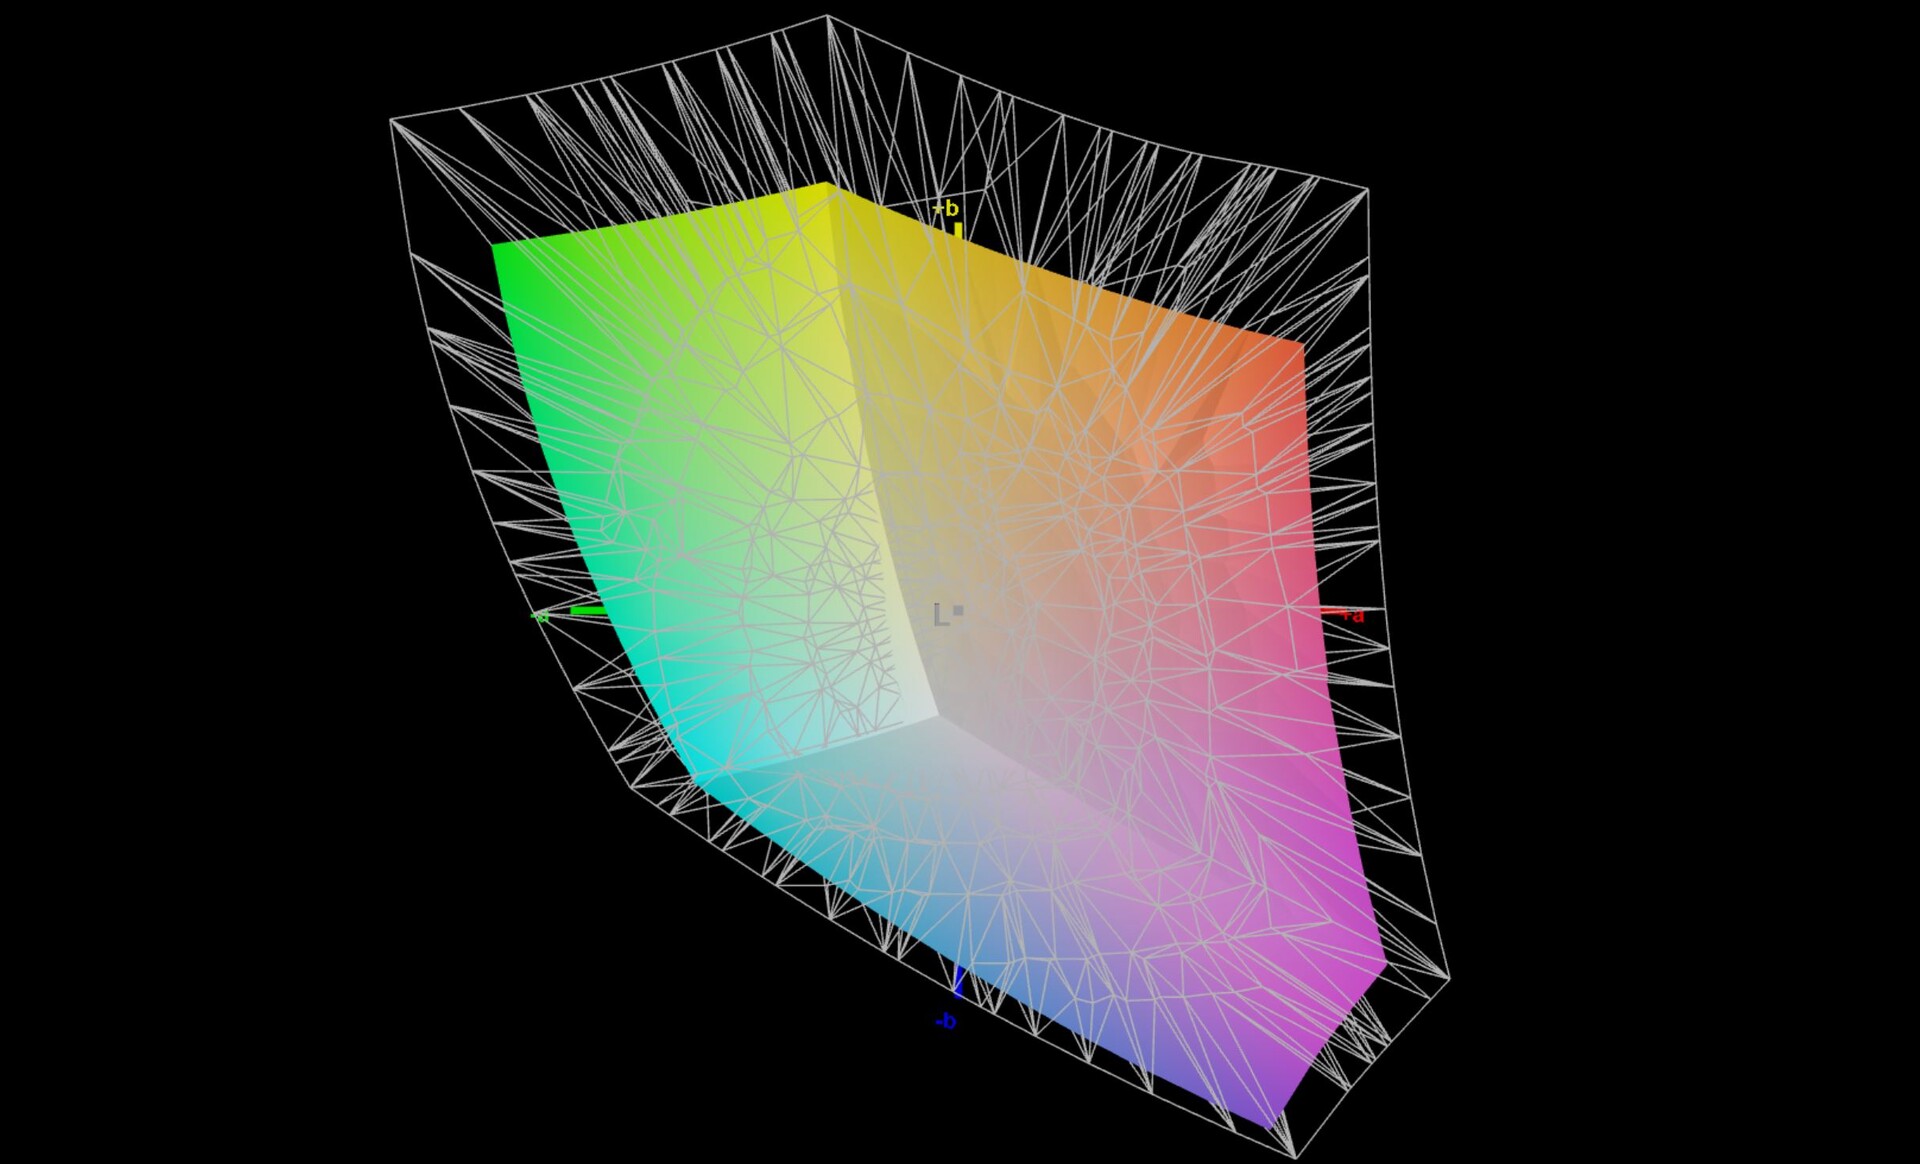
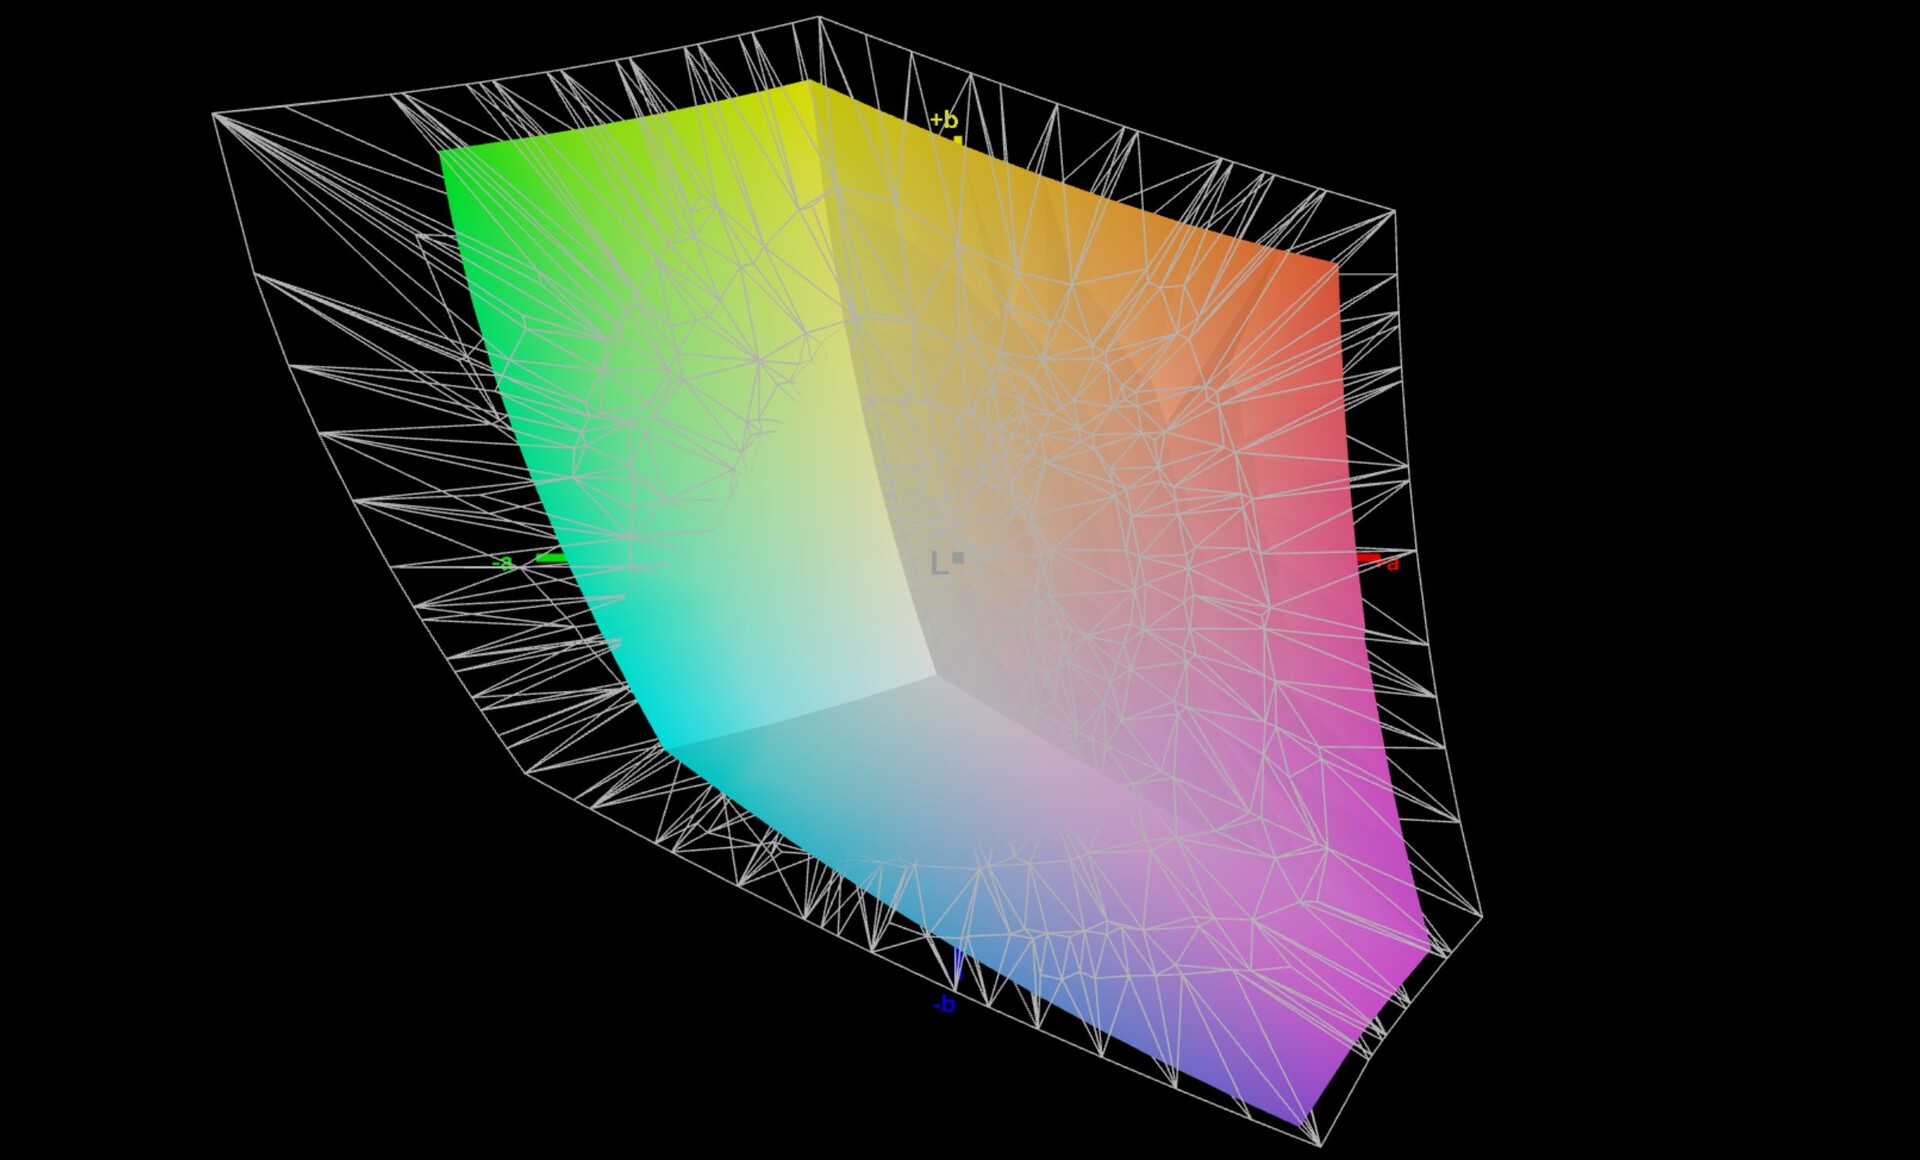
70.3% AdobeRGB 1998 (Argyll 2.2.0 3D)
97.3% sRGB (Argyll 2.2.0 3D)
68.1% Display P3 (Argyll 2.2.0 3D)
Gamma: 2.18
| Microsoft Surface Laptop 5 15, i7-1255U LQ150P1JX51, IPS, 2496x1664, 15.00 | Microsoft Surface Laptop 4 15 AMD TFF_00028 SHP14B4, IPS, 2496x1664, 15.00 | LG Gram 15Z90Q LG LP156WFC-SPZ2 (LGD0706), IPS, 1920x1080, 15.60 | Dell XPS 15 9520 RTX 3050 Ti Samsung 156XG01, OLED, 3456x2160, 15.60 | Samsung Galaxy Book Pro 15 NP950XDB-KC5US Samsung ATNA56YX02-0, AMOLED, 1920x1080, 15.60 | Asus Zenbook Pro 15 OLED UM535Q Samsung ATNA56YX03-0, OLED, 1920x1080, 15.60 | |
|---|---|---|---|---|---|---|
| Display | -3% | -5% | 23% | 24% | 13% | |
| Display P3 Coverage | 68.1 | 65.2 -4% | 63.5 -7% | 97.8 44% | 87.6 29% | 79.3 16% |
| sRGB Coverage | 97.3 | 97.7 0% | 95 -2% | 99.9 3% | 100 3% | 95.6 -2% |
| AdobeRGB 1998 Coverage | 70.3 | 67.3 -4% | 65.1 -7% | 86 22% | 99.3 41% | 87.3 24% |
| Response Times | -7% | 20% | 30% | 29% | 29% | |
| Response Time Grey 50% / Grey 80% * | 52.4 ? | 58.4 ? -11% | 48.4 ? 8% | 1.9 ? 96% | 1.9 ? 96% | 2.1 ? 96% |
| Response Time Black / White * | 28.7 ? | 31.2 ? -9% | 19.6 ? 32% | 1.9 ? 93% | 2.2 ? 92% | 2.3 ? 92% |
| PWM Frequency | 22000 ? | 21550 ? -2% | 59.52 ? -100% | 59 -100% | 60.2 -100% | |
| Screen | -82% | -99% | -180% | -122% | -83% | |
| Brightness middle | 397 | 405 2% | 420 6% | 381.4 -4% | 296.8 -25% | 342.9 -14% |
| Brightness | 399 | 379 -5% | 399 0% | 384 -4% | 298 -25% | 346 -13% |
| Brightness Distribution | 85 | 79 -7% | 88 4% | 95 12% | 98 15% | 98 15% |
| Black Level * | 0.29 | 0.26 10% | 0.32 -10% | |||
| Contrast | 1369 | 1558 14% | 1313 -4% | |||
| Colorchecker dE 2000 * | 0.8 | 2.6 -225% | 2.51 -214% | 4.34 -443% | 3.07 -284% | 2.42 -203% |
| Colorchecker dE 2000 max. * | 1.4 | 6.6 -371% | 6.64 -374% | 9.24 -560% | 5.29 -278% | 4.05 -189% |
| Greyscale dE 2000 * | 1.1 | 1.9 -73% | 3.3 -200% | 2 -82% | 2.6 -136% | 2.1 -91% |
| Gamma | 2.18 101% | 2.11 104% | 2.052 107% | 2.13 103% | 2.26 97% | 2.21 100% |
| CCT | 6705 97% | 6825 95% | 6921 94% | 6210 105% | 6904 94% | 6364 102% |
| Colorchecker dE 2000 calibrated * | 0.9 | 0.89 | ||||
| Color Space (Percent of AdobeRGB 1998) | 62 | |||||
| Color Space (Percent of sRGB) | 97.7 | |||||
| Total Average (Program / Settings) | -31% /
-49% | -28% /
-59% | -42% /
-77% | -23% /
-48% | -14% /
-31% |
* ... smaller is better

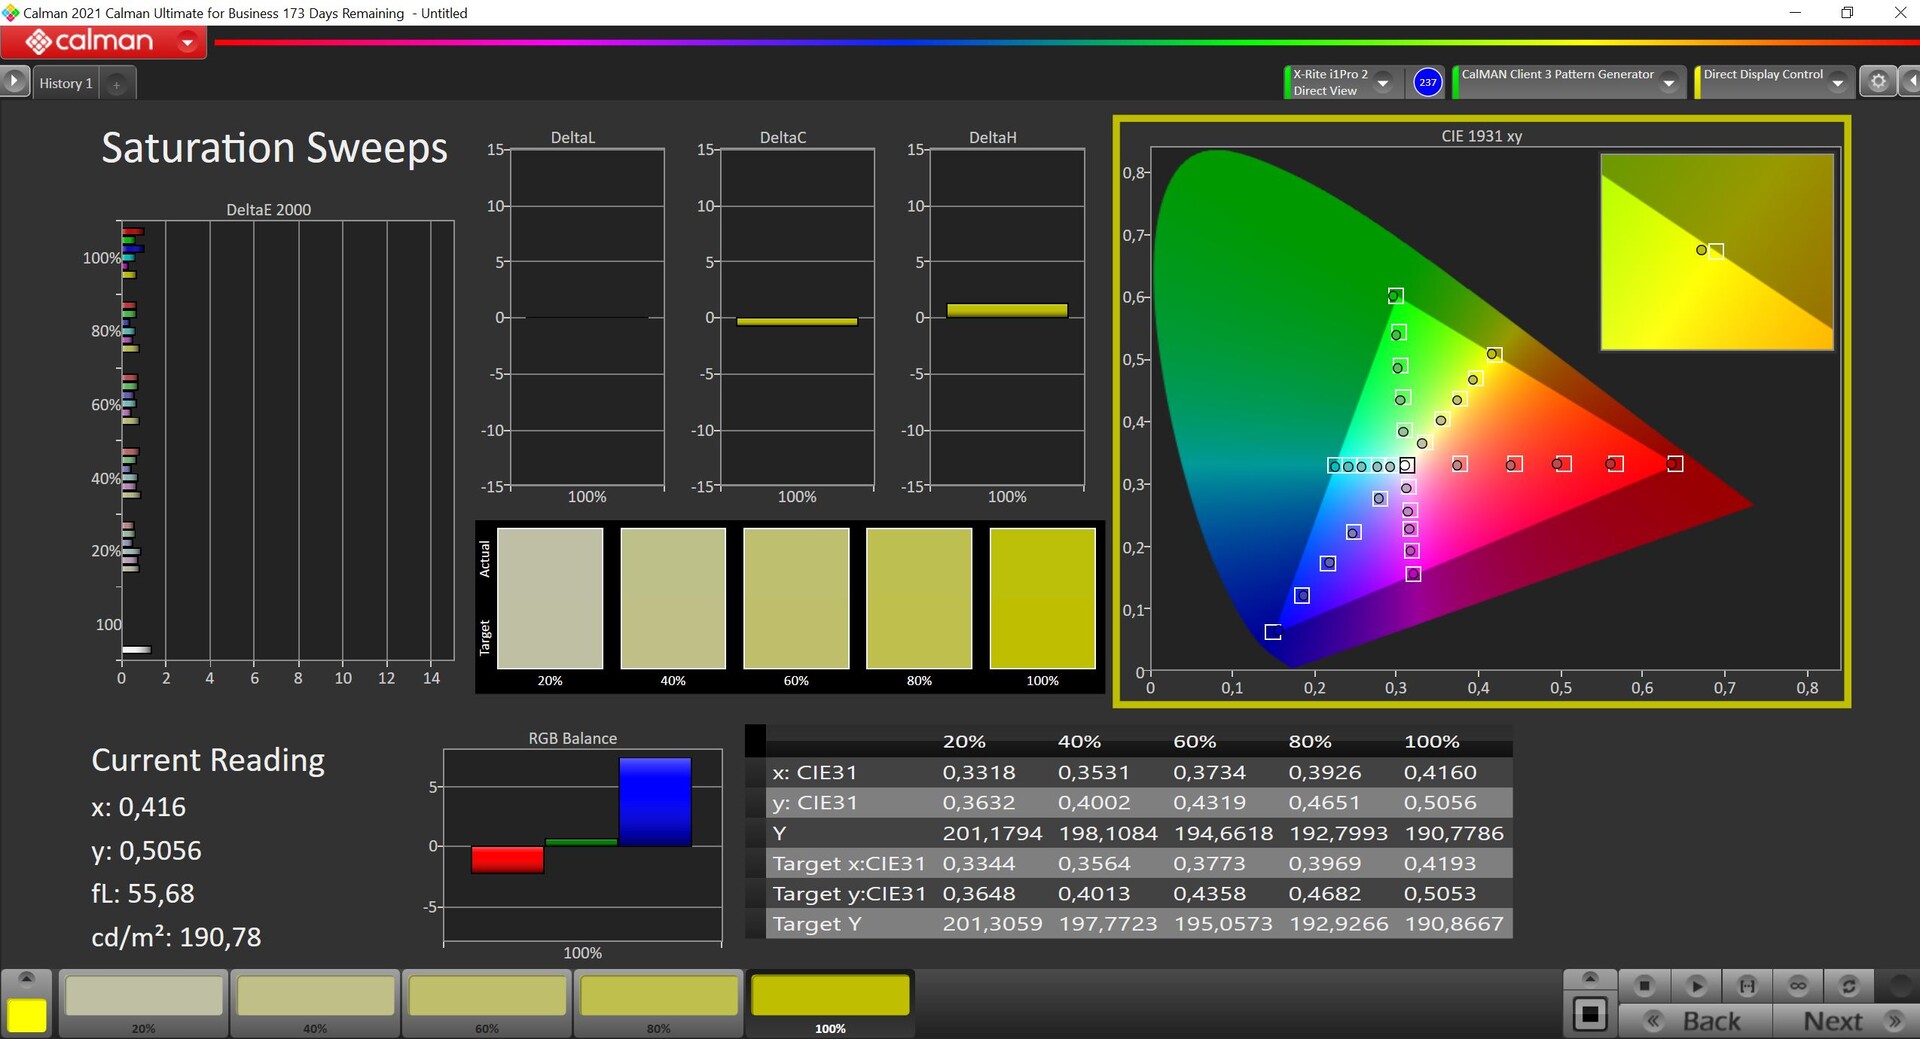
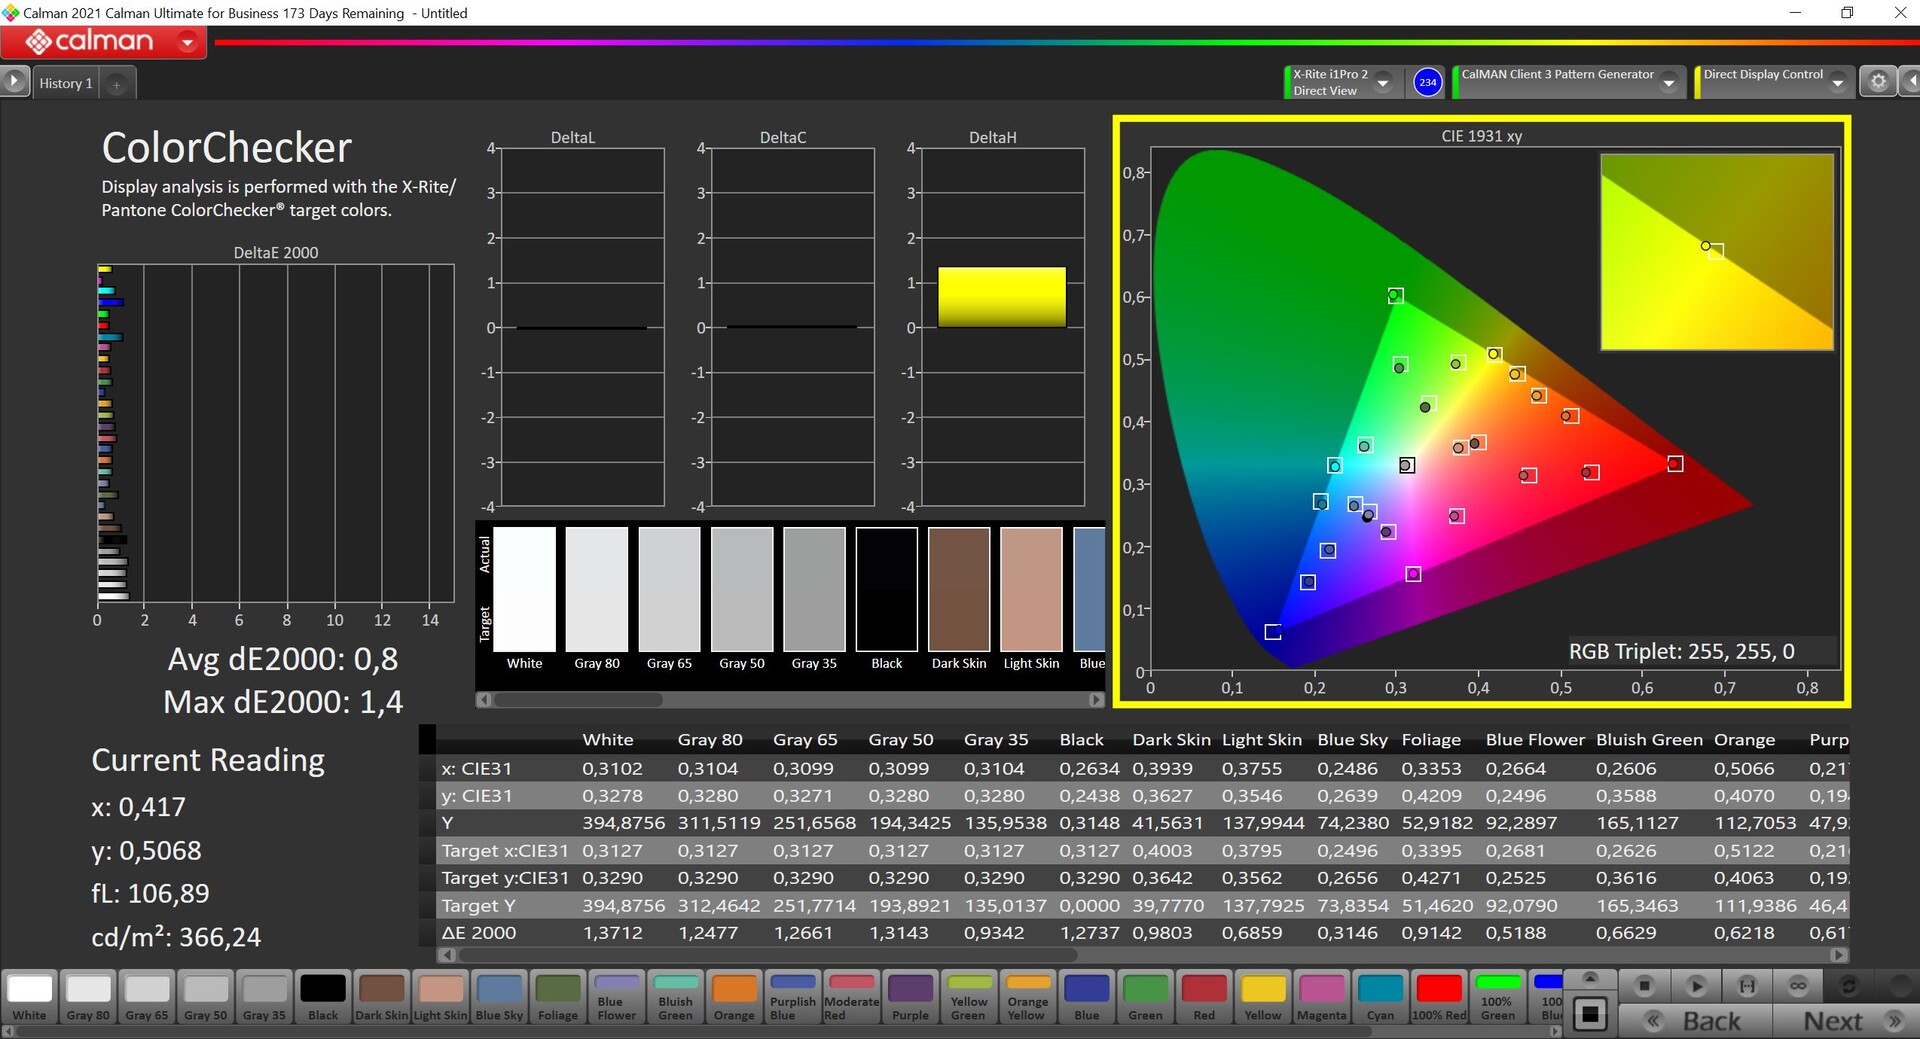
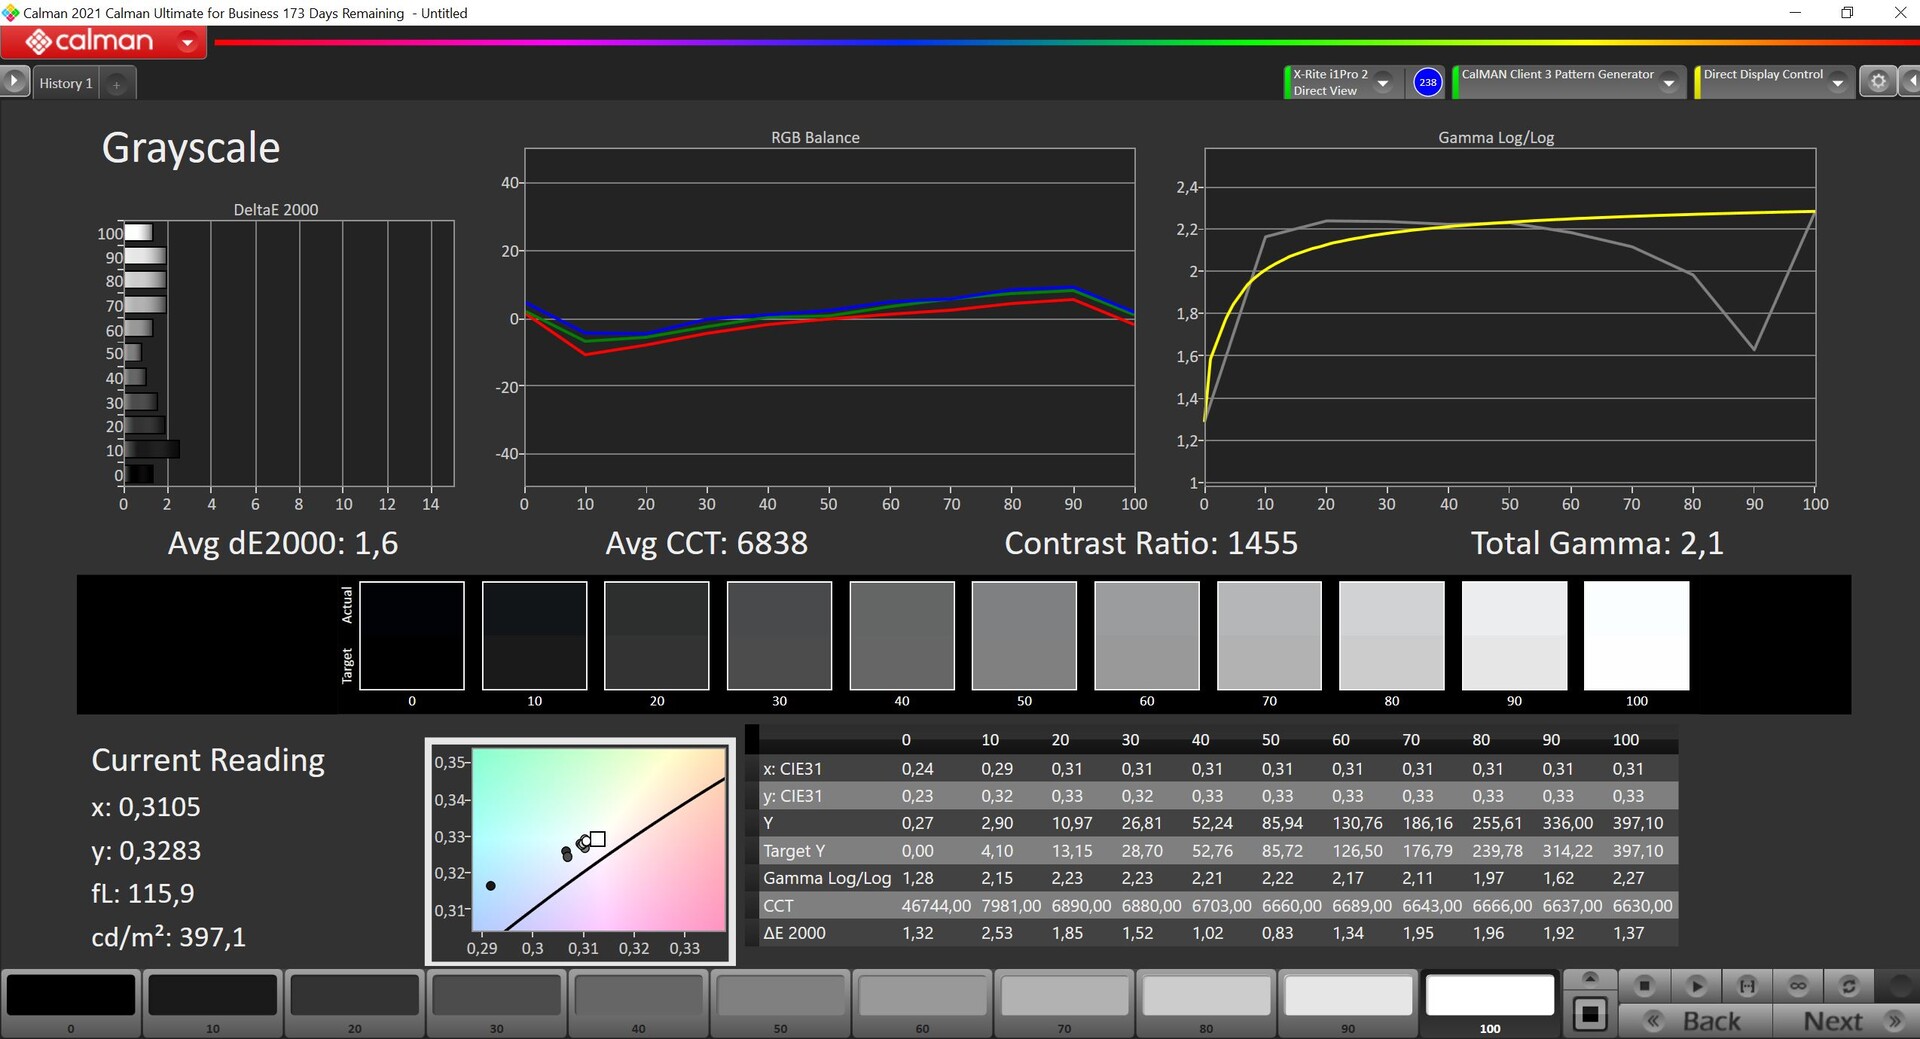
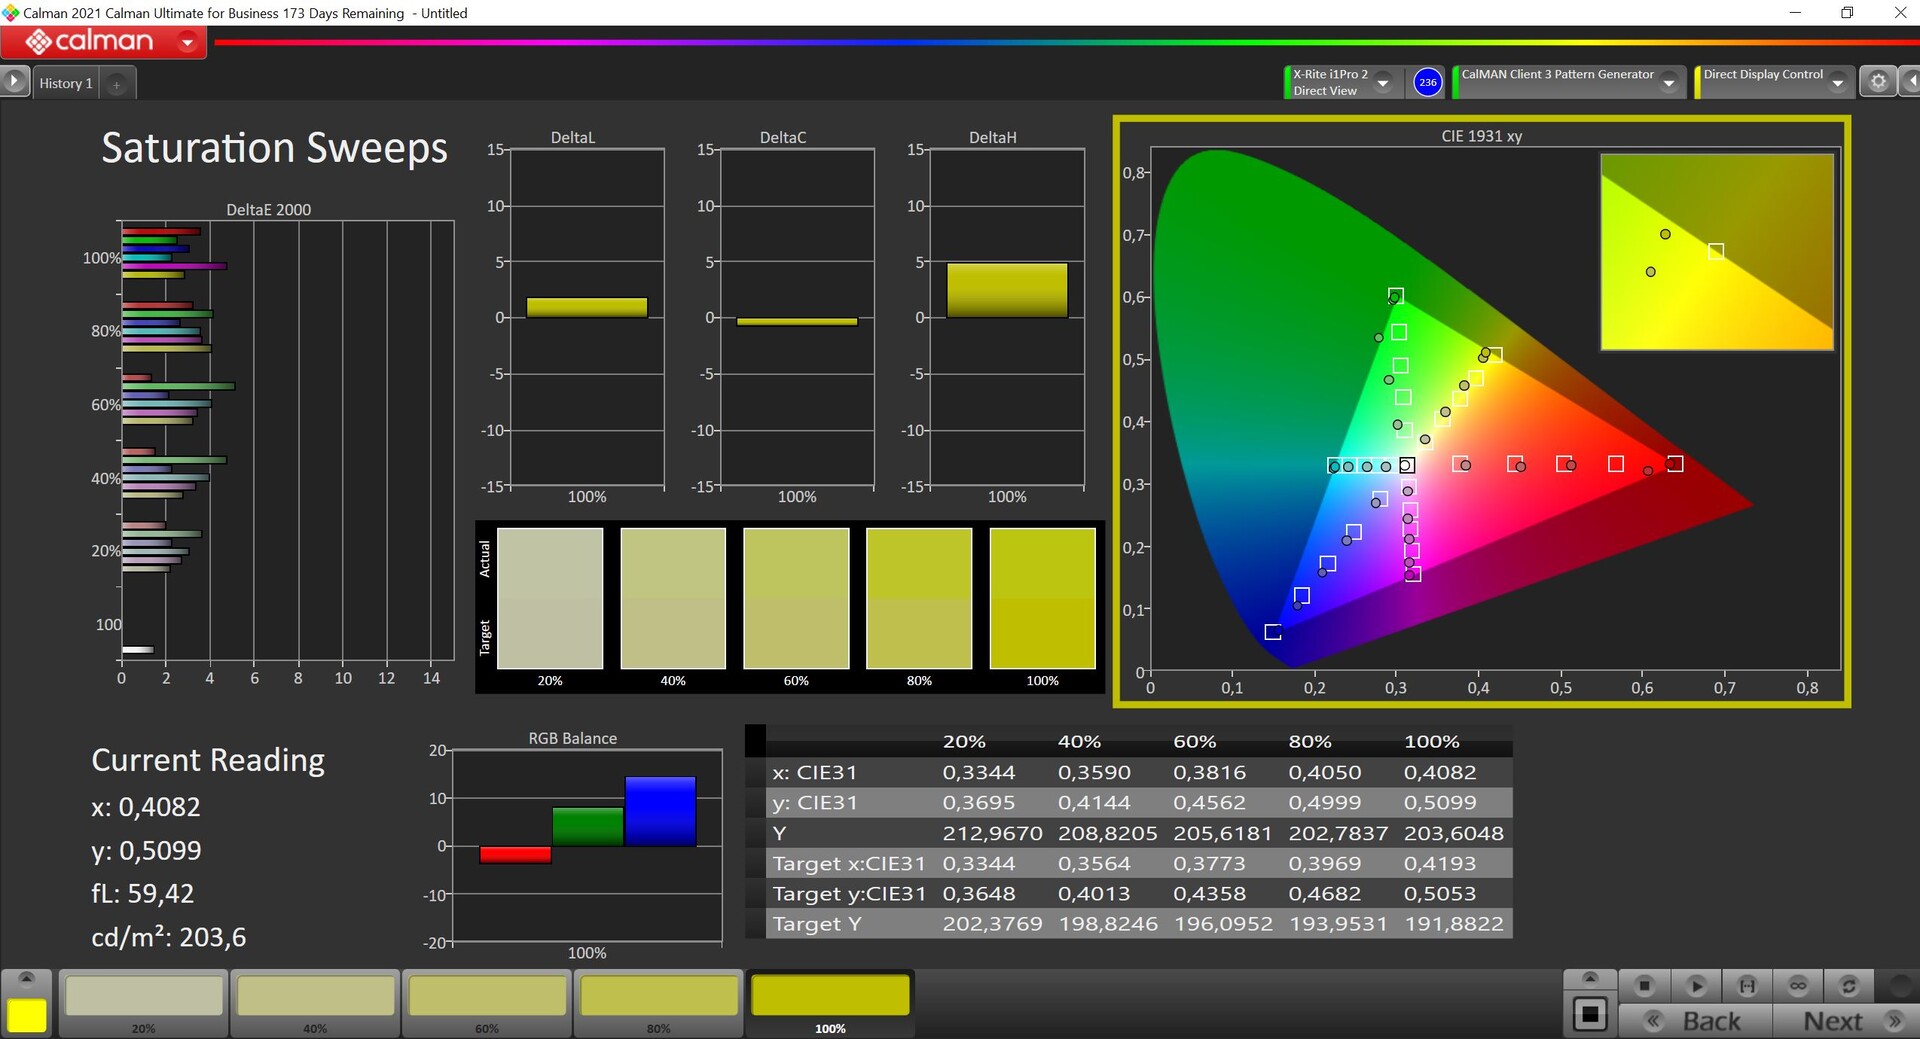
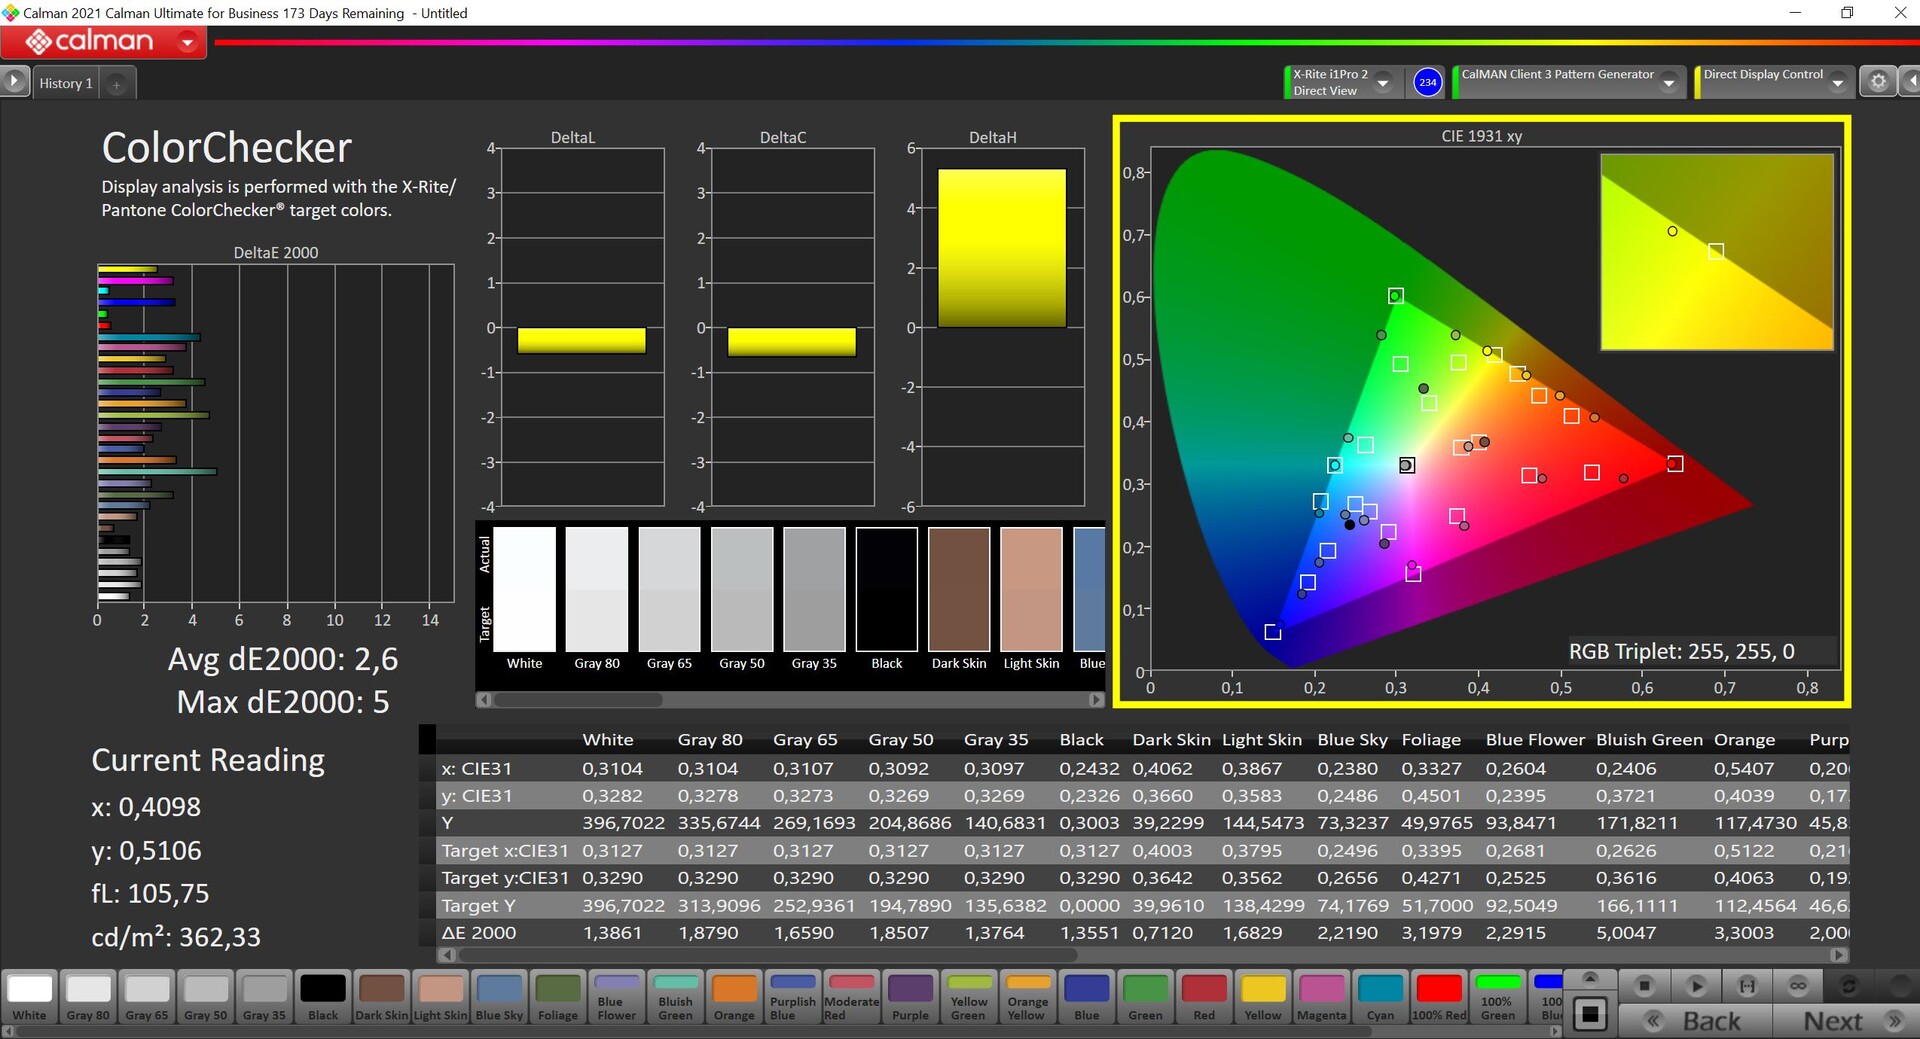
We analyzed the panel using the professional CalMAN software (X-Rite i1 Pro 2) and the device comes with two different profiles. By default, the Enhanced profile is enabled, where the colors look a bit more vivid and saturated - but this also leads to higher color deviations. The sRGB profile subjectively looks a bit paler, but it did great in our analysis and delivered very accurate values without any outliers for both the grayscale and color depictions. Together with the complete sRGB coverage, it is definitely possible to edit pictures without any problems straight out of the box. We could not improve the display further with our own calibration, which is why we aren't offering a downloadable profile here.
Display Response Times
| ↔ Response Time Black to White | ||
|---|---|---|
| 28.7 ms ... rise ↗ and fall ↘ combined | ↗ 13 ms rise | 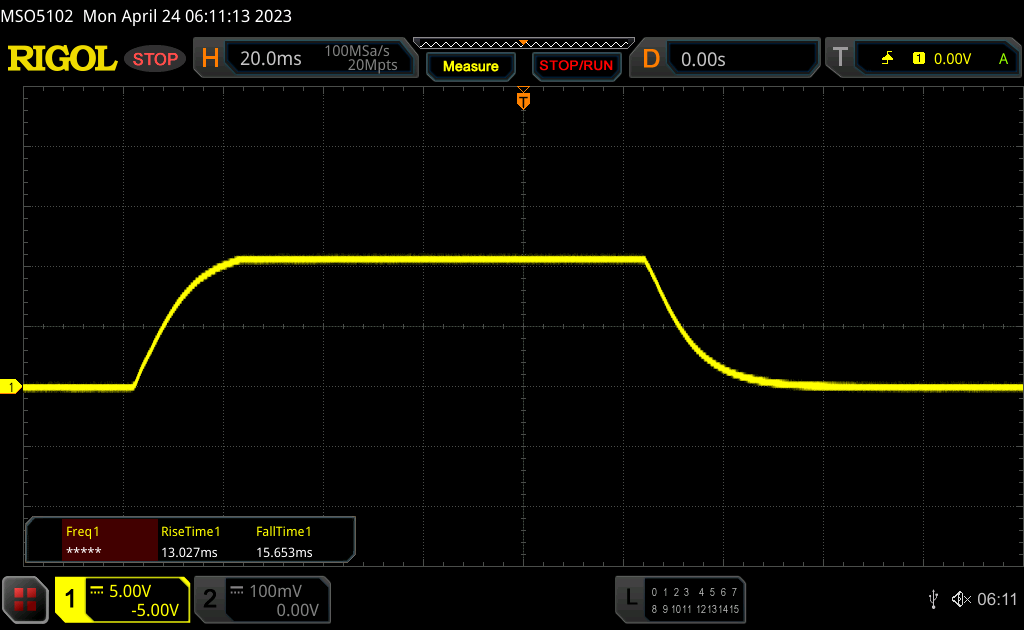 |
| ↘ 15.7 ms fall | ||
| The screen shows relatively slow response rates in our tests and may be too slow for gamers. In comparison, all tested devices range from 0.1 (minimum) to 240 (maximum) ms. » 72 % of all devices are better. This means that the measured response time is worse than the average of all tested devices (21.5 ms). | ||
| ↔ Response Time 50% Grey to 80% Grey | ||
| 52.4 ms ... rise ↗ and fall ↘ combined | ↗ 24.4 ms rise | 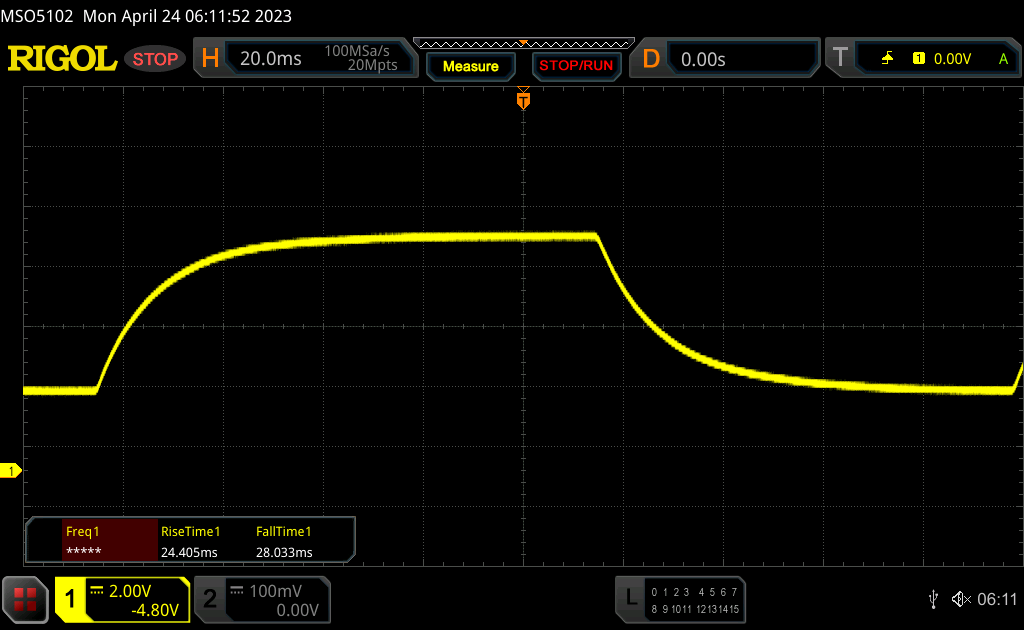 |
| ↘ 28 ms fall | ||
| The screen shows slow response rates in our tests and will be unsatisfactory for gamers. In comparison, all tested devices range from 0.2 (minimum) to 636 (maximum) ms. » 88 % of all devices are better. This means that the measured response time is worse than the average of all tested devices (33.7 ms). | ||
Screen Flickering / PWM (Pulse-Width Modulation)
| Screen flickering / PWM detected | 22000 Hz | ≤ 50 % brightness setting | 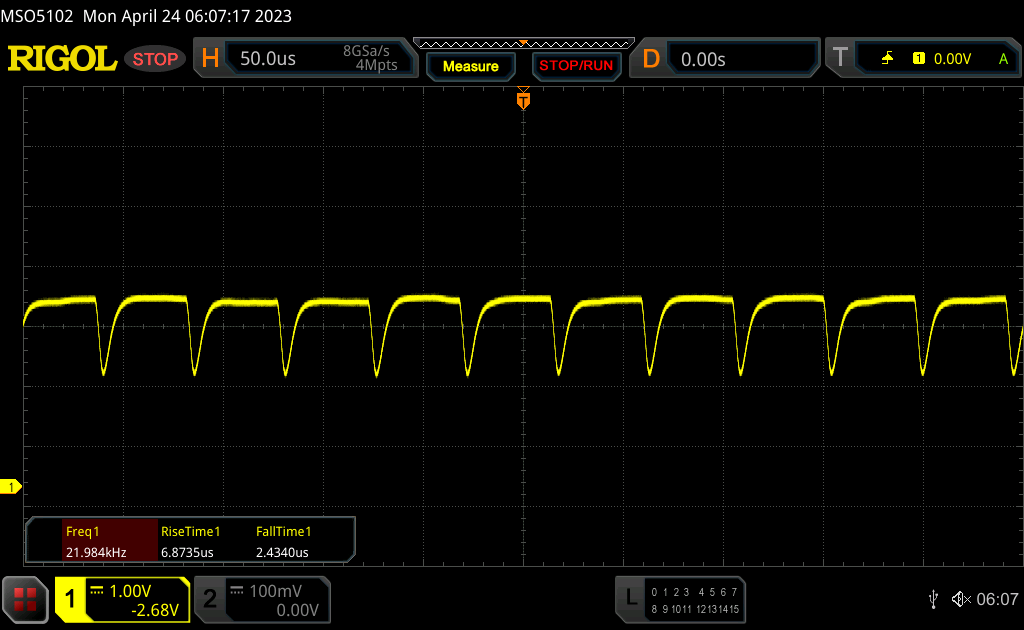 |
The display backlight flickers at 22000 Hz (worst case, e.g., utilizing PWM) Flickering detected at a brightness setting of 50 % and below. There should be no flickering or PWM above this brightness setting. The frequency of 22000 Hz is quite high, so most users sensitive to PWM should not notice any flickering. In comparison: 53 % of all tested devices do not use PWM to dim the display. If PWM was detected, an average of 17903 (minimum: 5 - maximum: 3846000) Hz was measured. | |||
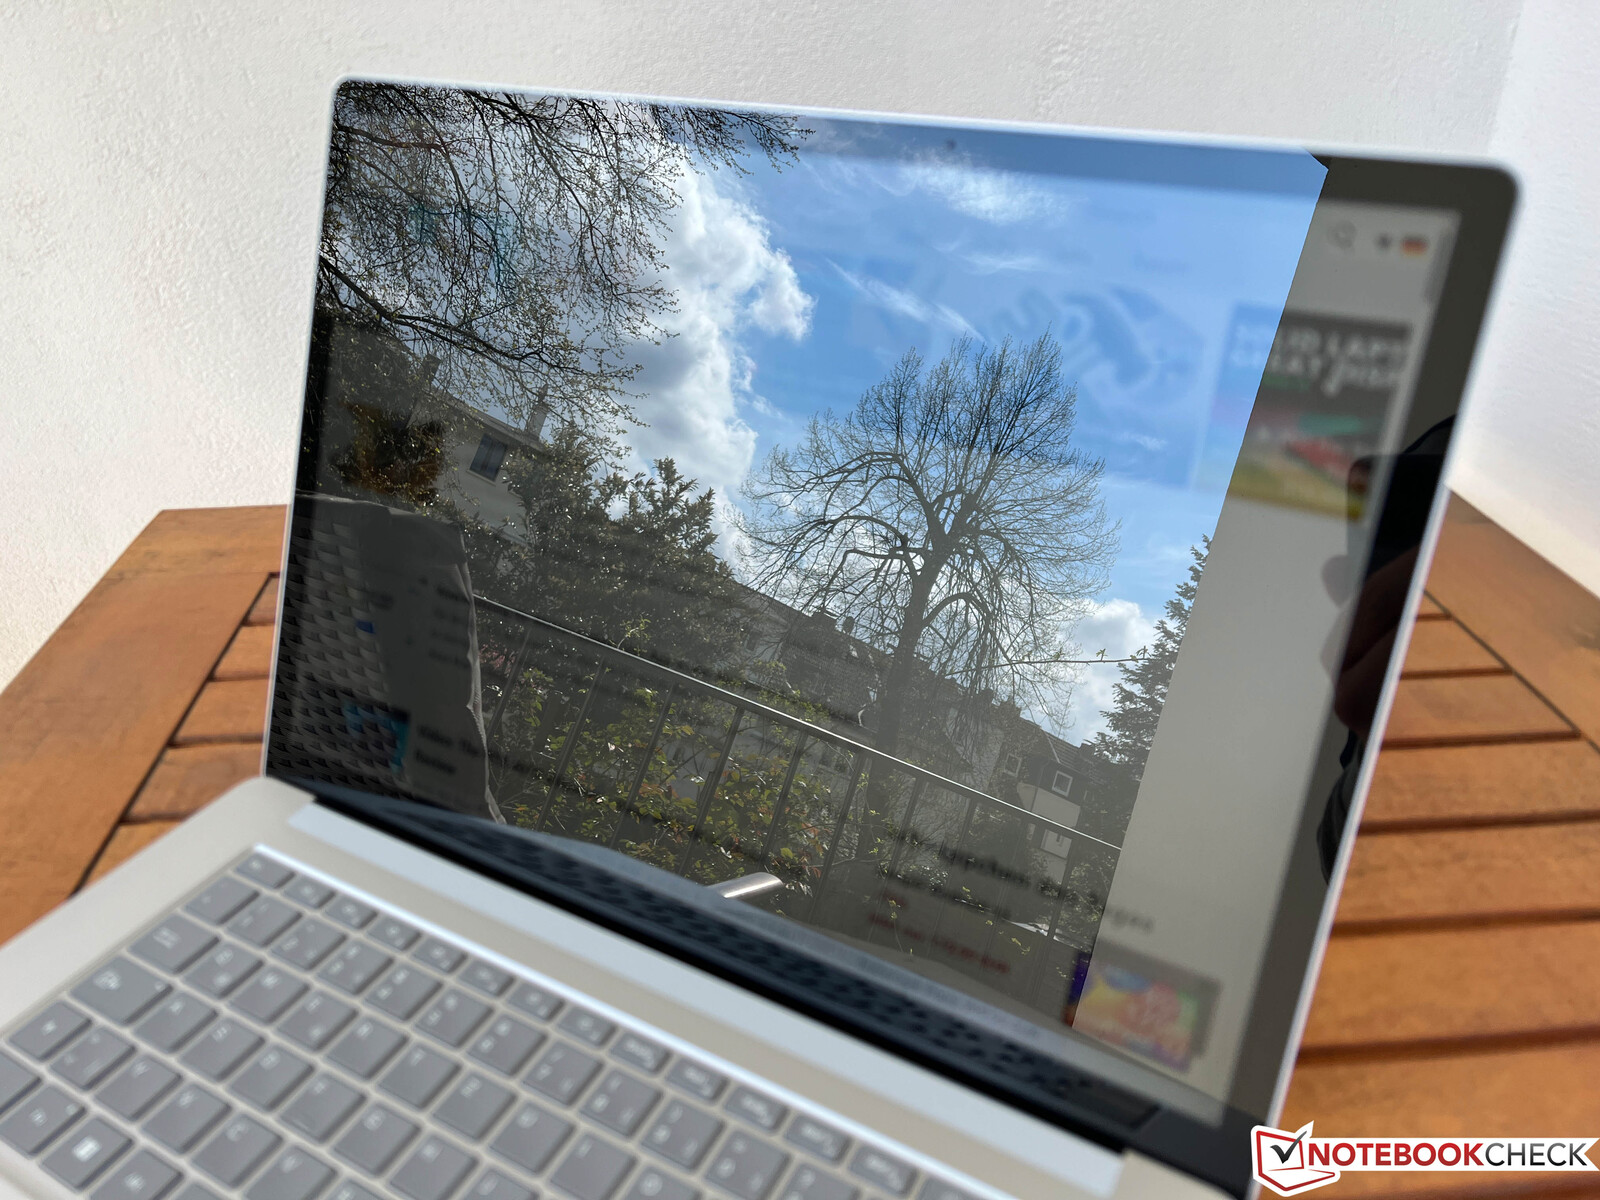
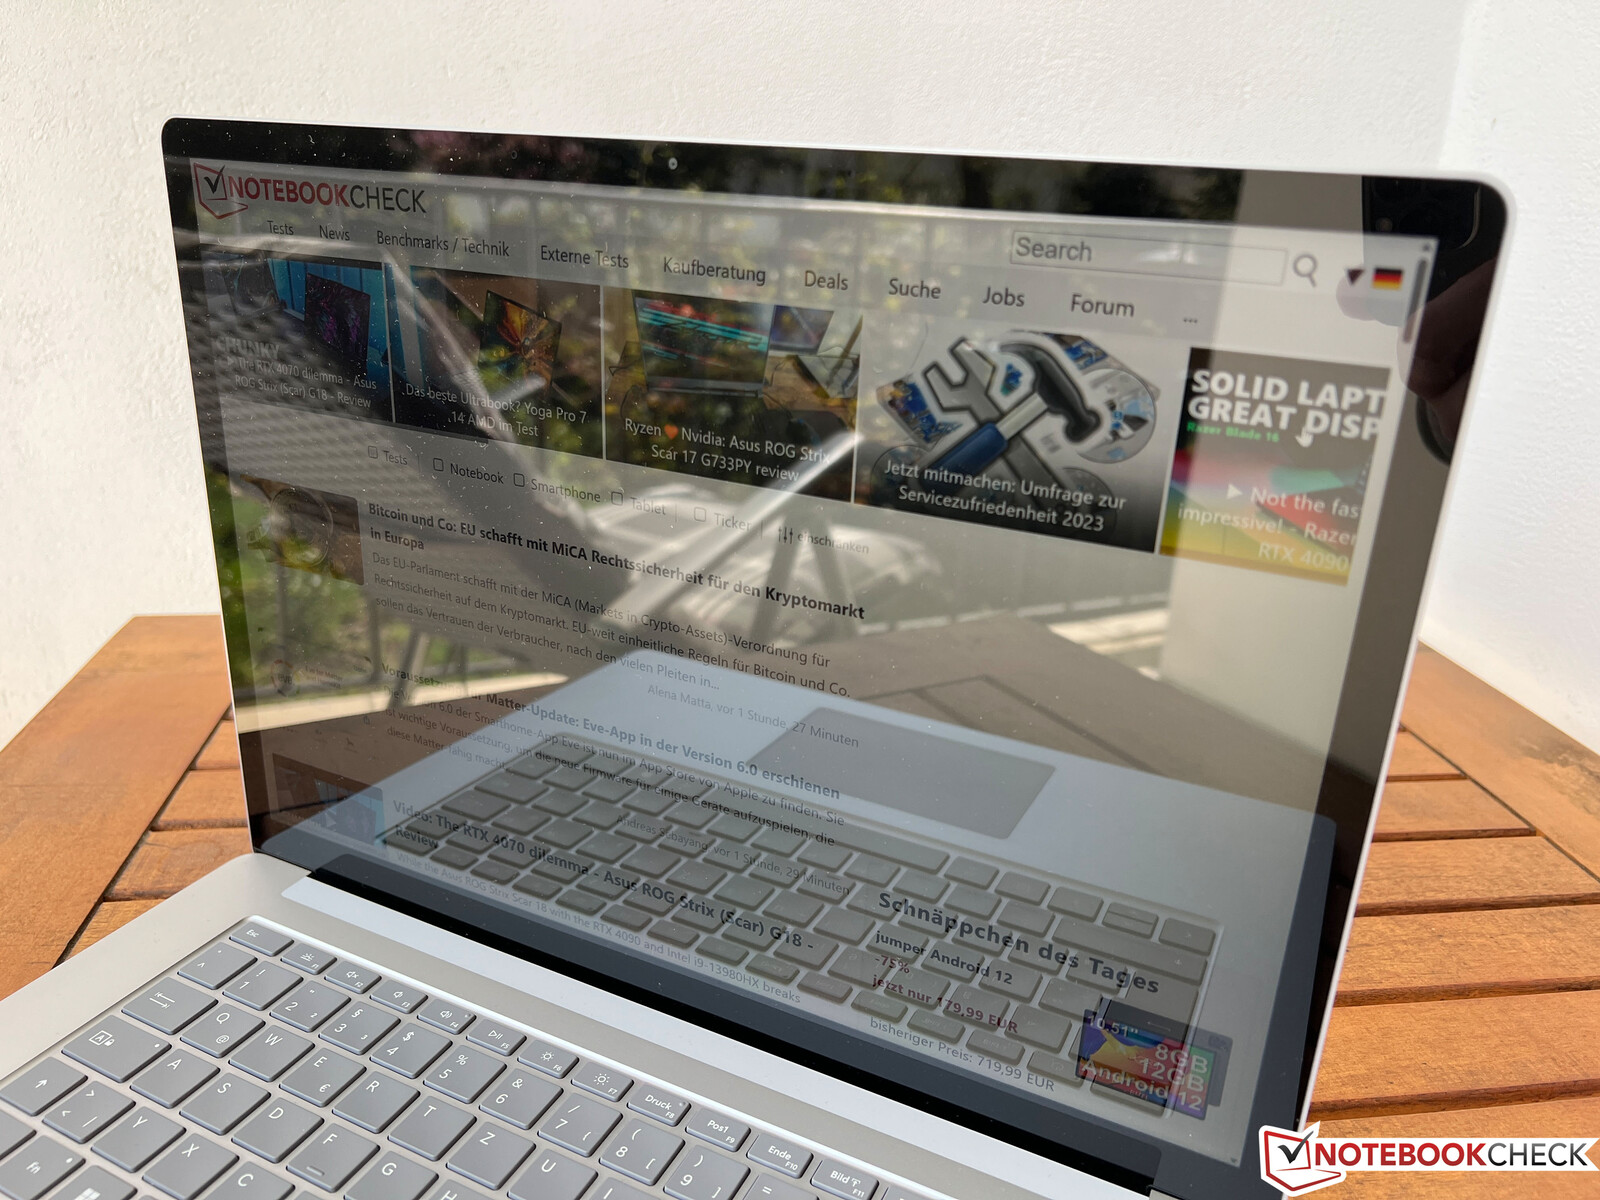
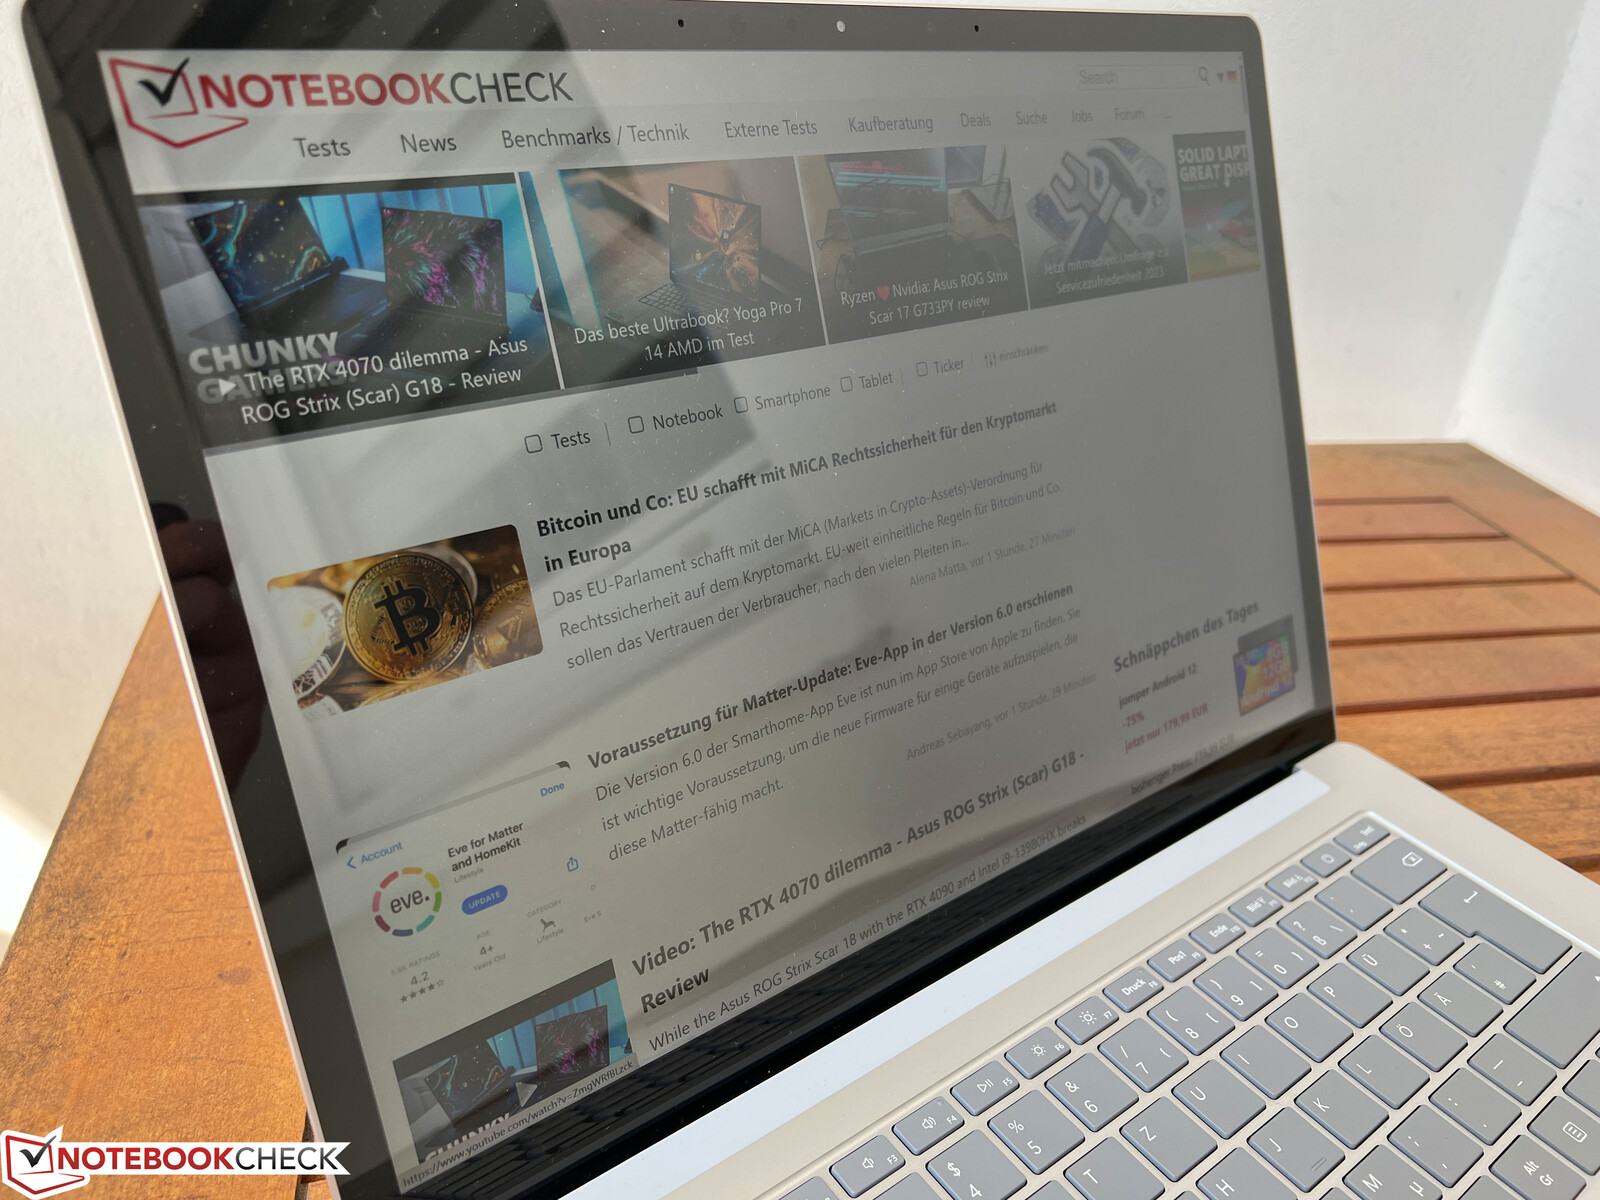
Using the Surface Laptop 5 outdoors becomes difficult because its touchscreen is very reflective - the laptop almost acts as a mirror on bright days. This means you would have more luck working in the shade. Its viewing angle stability is very good, but reflections again become a problem at larger angles.

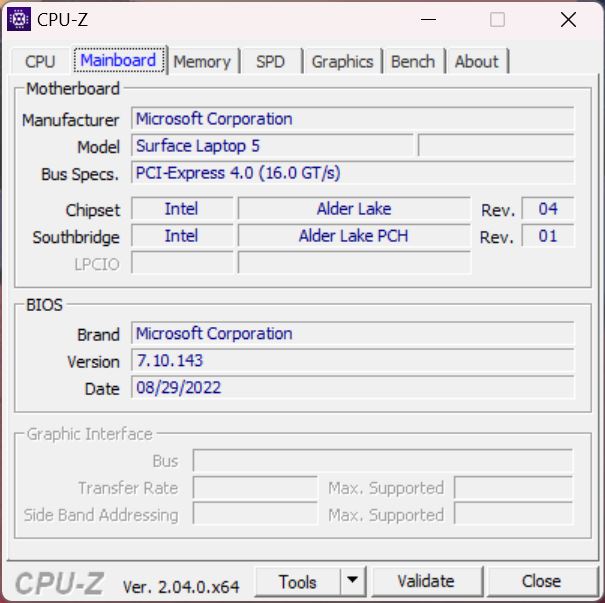
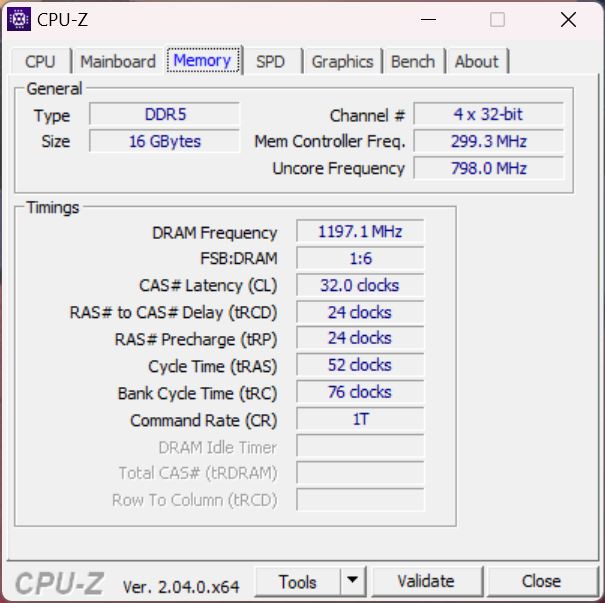
Performance - Microsoft have used Alder Lake-U
Microsoft have ditched the AMD version of the Surface laptop and now only rely on Intel CPUs. This is where the U series Alder Lake models come into play. That they don't yet use Raptor Lake CPUs (13th generation) isn't a problem, as they deliver only marginally better performance. The RAM is soldered on and cannot be upgraded, but Microsoft at least offer the choice of up to 32 GB of RAM.
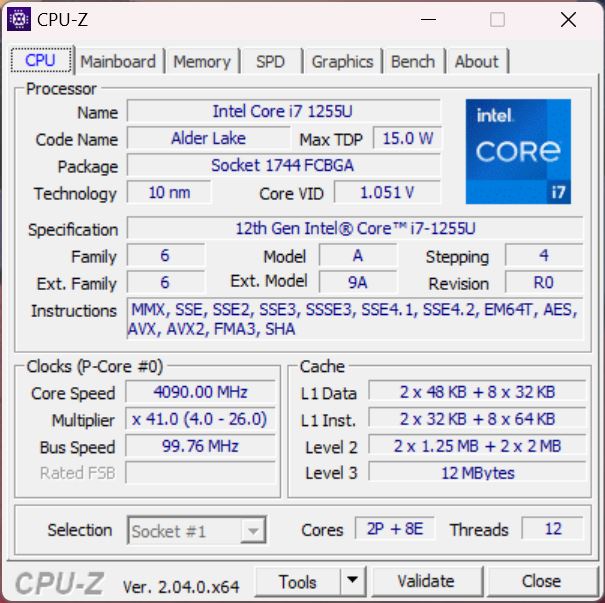
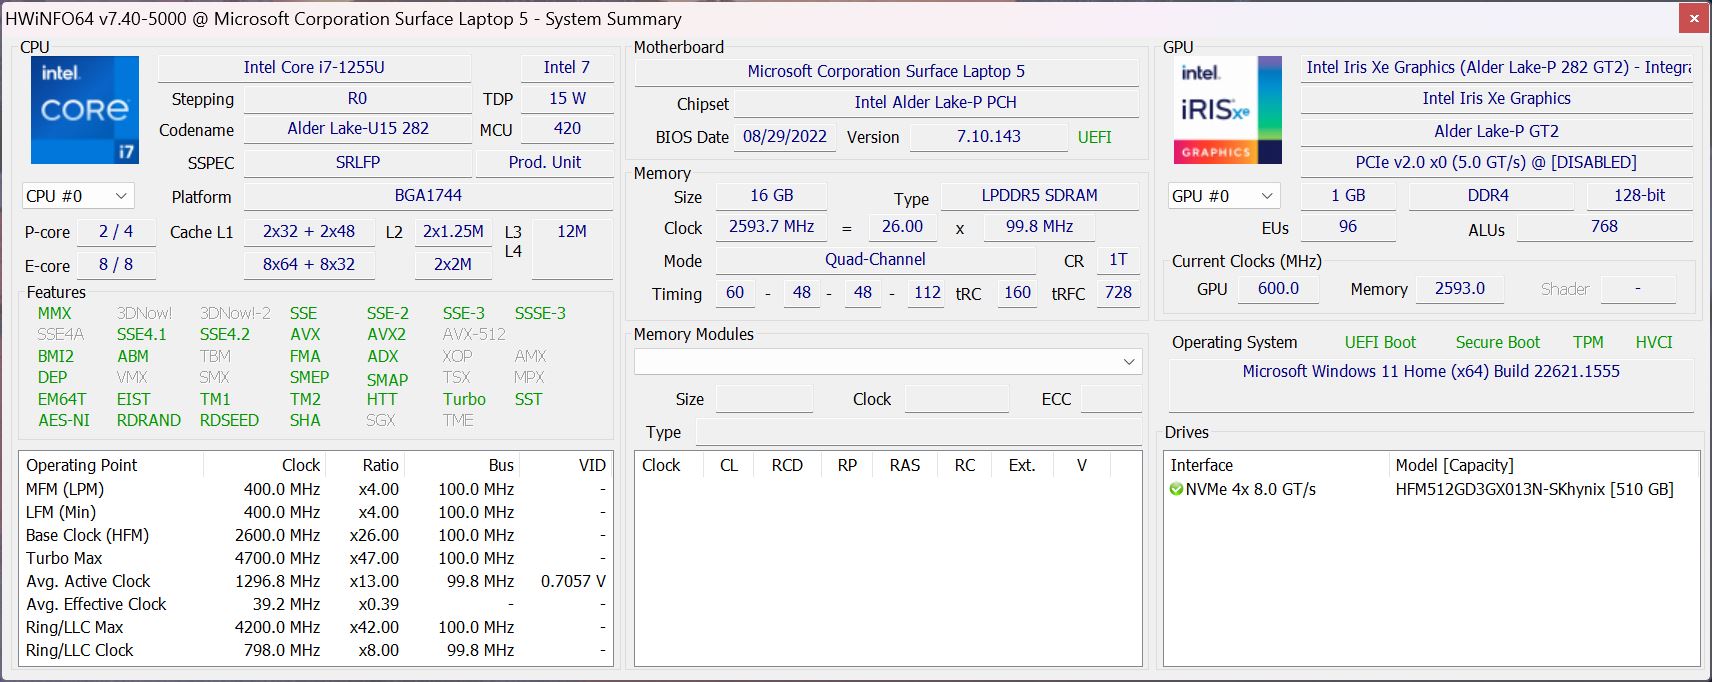
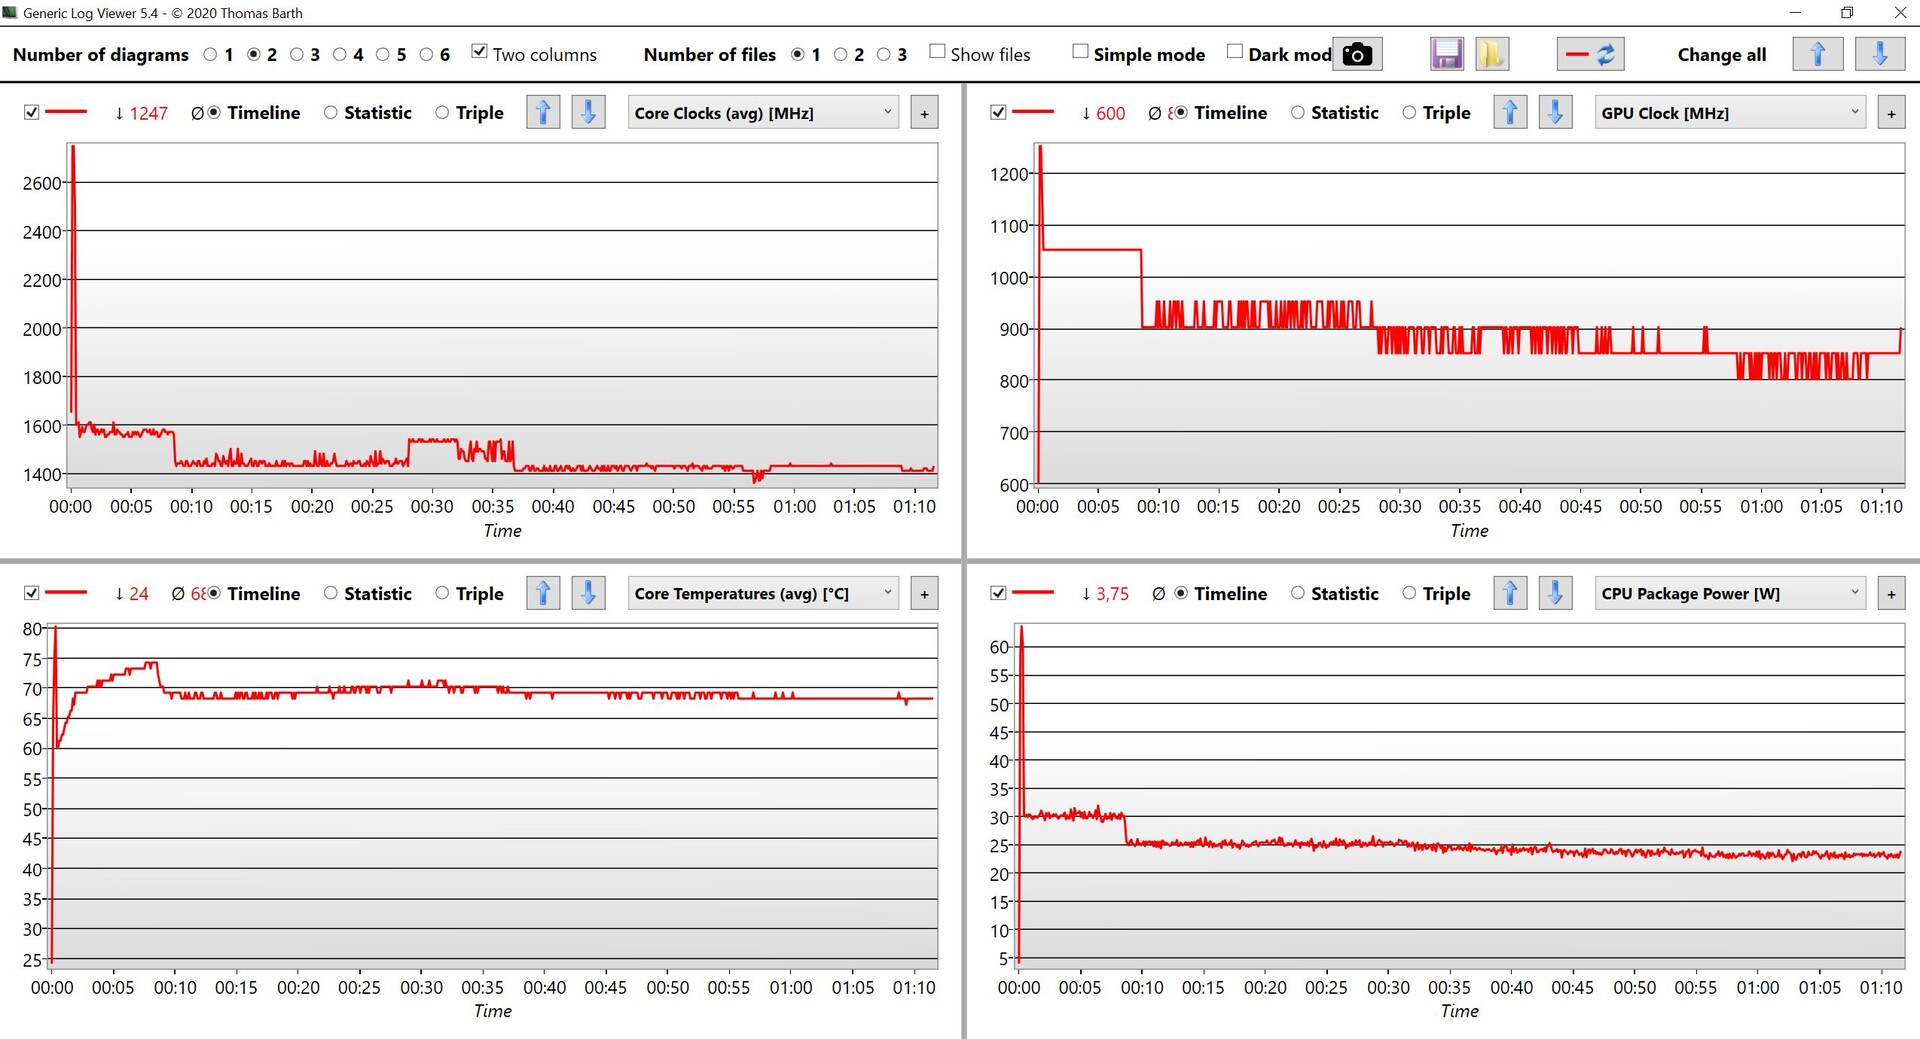
Processor - Core i7-1255U
The Alder Lake series (12th generation) Intel Core i7-1255U features two fast performance cores including Hyper-threading in combination with 8 efficiency cores - which means a total of up to 12 threads can be processed simultaneously. The Surface Laptop 5's processor consumed 60 watts for about 1-2 seconds before it stabilized at 30 watts. Looking at these rates, we don't quite get why Microsoft didn't go for an Alder Lake P chip instead.
Compared to the Surface Laptop 4 13 with a Core i7-1185G7, the newer model was 33 per cent faster on average and its single-core performance in particular was excellent. Compared to its predecessor with an AMD processor, however, its multi-core performance was worse - here, we compared it with a Ryzen 7 4980U. The laptop's CPU performance is definitely sufficient for everyday tasks, but in view of its higher price, we expected more from its performance levels.
When powered by its battery, the device's multi-core performance dropped by around 8 per cent. Here, the processor consumed a maximum of 35/25 watts. However, since the temperatures didn't rise as quickly, the CPU managed to stay at 35 watts for much longer - then dropped to 25 watts. This also shows that its TDP configuration is not particularly good and the 60-watt limit doesn't make a whole lot of sense. More CPU benchmarks are available in our tech section.
Cinebench R15 Multi continuous test
Cinebench R23: Multi Core | Single Core
Cinebench R20: CPU (Multi Core) | CPU (Single Core)
Cinebench R15: CPU Multi 64Bit | CPU Single 64Bit
Blender: v2.79 BMW27 CPU
7-Zip 18.03: 7z b 4 | 7z b 4 -mmt1
Geekbench 5.5: Multi-Core | Single-Core
HWBOT x265 Benchmark v2.2: 4k Preset
LibreOffice : 20 Documents To PDF
R Benchmark 2.5: Overall mean
| CPU Performance Rating | |
| Dell XPS 15 9520 RTX 3050 Ti | |
| Asus Zenbook Pro 15 OLED UM535Q | |
| Microsoft Surface Laptop 5 15, i7-1255U | |
| Average Intel Core i7-1255U | |
| LG Gram 15Z90Q | |
| Average of class Office | |
| Microsoft Surface Laptop 4 15 AMD TFF_00028 | |
| Microsoft Surface Laptop 4 13 i7 | |
| Samsung Galaxy Book Pro 15 NP950XDB-KC5US | |
| Cinebench R23 / Multi Core | |
| Dell XPS 15 9520 RTX 3050 Ti | |
| Asus Zenbook Pro 15 OLED UM535Q | |
| Microsoft Surface Laptop 4 15 AMD TFF_00028 | |
| Microsoft Surface Laptop 5 15, i7-1255U | |
| LG Gram 15Z90Q | |
| Average Intel Core i7-1255U (5269 - 9628, n=9) | |
| Average of class Office (1056 - 15743, n=122, last 2 years) | |
| Microsoft Surface Laptop 4 13 i7 | |
| Samsung Galaxy Book Pro 15 NP950XDB-KC5US | |
| Cinebench R23 / Single Core | |
| Dell XPS 15 9520 RTX 3050 Ti | |
| Microsoft Surface Laptop 5 15, i7-1255U | |
| Average Intel Core i7-1255U (1425 - 1775, n=9) | |
| Microsoft Surface Laptop 4 13 i7 | |
| LG Gram 15Z90Q | |
| Asus Zenbook Pro 15 OLED UM535Q | |
| Average of class Office (529 - 1995, n=121, last 2 years) | |
| Samsung Galaxy Book Pro 15 NP950XDB-KC5US | |
| Microsoft Surface Laptop 4 15 AMD TFF_00028 | |
| Cinebench R20 / CPU (Multi Core) | |
| Dell XPS 15 9520 RTX 3050 Ti | |
| Asus Zenbook Pro 15 OLED UM535Q | |
| Microsoft Surface Laptop 4 15 AMD TFF_00028 | |
| Microsoft Surface Laptop 5 15, i7-1255U | |
| LG Gram 15Z90Q | |
| Average of class Office (356 - 5904, n=120, last 2 years) | |
| Average Intel Core i7-1255U (2095 - 3702, n=9) | |
| Samsung Galaxy Book Pro 15 NP950XDB-KC5US | |
| Microsoft Surface Laptop 4 13 i7 | |
| Cinebench R20 / CPU (Single Core) | |
| Dell XPS 15 9520 RTX 3050 Ti | |
| Microsoft Surface Laptop 5 15, i7-1255U | |
| Average Intel Core i7-1255U (550 - 682, n=9) | |
| Microsoft Surface Laptop 4 13 i7 | |
| Asus Zenbook Pro 15 OLED UM535Q | |
| LG Gram 15Z90Q | |
| Average of class Office (181.3 - 764, n=120, last 2 years) | |
| Samsung Galaxy Book Pro 15 NP950XDB-KC5US | |
| Microsoft Surface Laptop 4 15 AMD TFF_00028 | |
| Cinebench R15 / CPU Multi 64Bit | |
| Dell XPS 15 9520 RTX 3050 Ti | |
| Asus Zenbook Pro 15 OLED UM535Q | |
| Microsoft Surface Laptop 4 15 AMD TFF_00028 | |
| Microsoft Surface Laptop 5 15, i7-1255U | |
| LG Gram 15Z90Q | |
| Average of class Office (160.8 - 2642, n=120, last 2 years) | |
| Average Intel Core i7-1255U (919 - 1577, n=9) | |
| Microsoft Surface Laptop 4 13 i7 | |
| Samsung Galaxy Book Pro 15 NP950XDB-KC5US | |
| Cinebench R15 / CPU Single 64Bit | |
| Dell XPS 15 9520 RTX 3050 Ti | |
| Microsoft Surface Laptop 5 15, i7-1255U | |
| Asus Zenbook Pro 15 OLED UM535Q | |
| Average Intel Core i7-1255U (161 - 251, n=10) | |
| Microsoft Surface Laptop 4 13 i7 | |
| Average of class Office (82.6 - 284, n=118, last 2 years) | |
| LG Gram 15Z90Q | |
| Microsoft Surface Laptop 4 15 AMD TFF_00028 | |
| Samsung Galaxy Book Pro 15 NP950XDB-KC5US | |
| Blender / v2.79 BMW27 CPU | |
| Microsoft Surface Laptop 4 13 i7 | |
| Samsung Galaxy Book Pro 15 NP950XDB-KC5US | |
| Average of class Office (214 - 2844, n=121, last 2 years) | |
| LG Gram 15Z90Q | |
| Average Intel Core i7-1255U (372 - 601, n=9) | |
| Microsoft Surface Laptop 5 15, i7-1255U | |
| Microsoft Surface Laptop 4 15 AMD TFF_00028 | |
| Asus Zenbook Pro 15 OLED UM535Q | |
| Dell XPS 15 9520 RTX 3050 Ti | |
| 7-Zip 18.03 / 7z b 4 | |
| Dell XPS 15 9520 RTX 3050 Ti | |
| Asus Zenbook Pro 15 OLED UM535Q | |
| Microsoft Surface Laptop 4 15 AMD TFF_00028 | |
| Microsoft Surface Laptop 5 15, i7-1255U | |
| Average of class Office (4226 - 62349, n=121, last 2 years) | |
| Average Intel Core i7-1255U (24126 - 37365, n=9) | |
| LG Gram 15Z90Q | |
| Microsoft Surface Laptop 4 13 i7 | |
| Samsung Galaxy Book Pro 15 NP950XDB-KC5US | |
| 7-Zip 18.03 / 7z b 4 -mmt1 | |
| Dell XPS 15 9520 RTX 3050 Ti | |
| Asus Zenbook Pro 15 OLED UM535Q | |
| Average Intel Core i7-1255U (5150 - 5529, n=9) | |
| Microsoft Surface Laptop 5 15, i7-1255U | |
| Microsoft Surface Laptop 4 13 i7 | |
| Samsung Galaxy Book Pro 15 NP950XDB-KC5US | |
| Average of class Office (2233 - 6687, n=121, last 2 years) | |
| LG Gram 15Z90Q | |
| Microsoft Surface Laptop 4 15 AMD TFF_00028 | |
| Geekbench 5.5 / Multi-Core | |
| Dell XPS 15 9520 RTX 3050 Ti | |
| Microsoft Surface Laptop 5 15, i7-1255U | |
| LG Gram 15Z90Q | |
| Asus Zenbook Pro 15 OLED UM535Q | |
| Average Intel Core i7-1255U (4463 - 8821, n=10) | |
| Microsoft Surface Laptop 4 15 AMD TFF_00028 | |
| Average of class Office (1018 - 11980, n=122, last 2 years) | |
| Microsoft Surface Laptop 4 13 i7 | |
| Samsung Galaxy Book Pro 15 NP950XDB-KC5US | |
| Geekbench 5.5 / Single-Core | |
| Dell XPS 15 9520 RTX 3050 Ti | |
| Microsoft Surface Laptop 5 15, i7-1255U | |
| Average Intel Core i7-1255U (1560 - 1712, n=10) | |
| LG Gram 15Z90Q | |
| Samsung Galaxy Book Pro 15 NP950XDB-KC5US | |
| Microsoft Surface Laptop 4 13 i7 | |
| Asus Zenbook Pro 15 OLED UM535Q | |
| Average of class Office (510 - 1974, n=122, last 2 years) | |
| Microsoft Surface Laptop 4 15 AMD TFF_00028 | |
| HWBOT x265 Benchmark v2.2 / 4k Preset | |
| Asus Zenbook Pro 15 OLED UM535Q | |
| Dell XPS 15 9520 RTX 3050 Ti | |
| Microsoft Surface Laptop 5 15, i7-1255U | |
| Microsoft Surface Laptop 4 15 AMD TFF_00028 | |
| Average of class Office (1.55 - 17.4, n=120, last 2 years) | |
| Average Intel Core i7-1255U (6.31 - 10.1, n=9) | |
| LG Gram 15Z90Q | |
| Samsung Galaxy Book Pro 15 NP950XDB-KC5US | |
| Microsoft Surface Laptop 4 13 i7 | |
| LibreOffice / 20 Documents To PDF | |
| Microsoft Surface Laptop 4 15 AMD TFF_00028 | |
| Average of class Office (31.3 - 117.5, n=120, last 2 years) | |
| LG Gram 15Z90Q | |
| Samsung Galaxy Book Pro 15 NP950XDB-KC5US | |
| Microsoft Surface Laptop 4 13 i7 | |
| Asus Zenbook Pro 15 OLED UM535Q | |
| Average Intel Core i7-1255U (44.5 - 52, n=9) | |
| Microsoft Surface Laptop 5 15, i7-1255U | |
| Dell XPS 15 9520 RTX 3050 Ti | |
| R Benchmark 2.5 / Overall mean | |
| Microsoft Surface Laptop 4 15 AMD TFF_00028 | |
| Samsung Galaxy Book Pro 15 NP950XDB-KC5US | |
| Average of class Office (0.4244 - 1.397, n=119, last 2 years) | |
| Microsoft Surface Laptop 4 13 i7 | |
| LG Gram 15Z90Q | |
| Asus Zenbook Pro 15 OLED UM535Q | |
| Average Intel Core i7-1255U (0.4688 - 0.558, n=9) | |
| Microsoft Surface Laptop 5 15, i7-1255U | |
| Dell XPS 15 9520 RTX 3050 Ti | |
* ... smaller is better
AIDA64: FP32 Ray-Trace | FPU Julia | CPU SHA3 | CPU Queen | FPU SinJulia | FPU Mandel | CPU AES | CPU ZLib | FP64 Ray-Trace | CPU PhotoWorxx
| Performance Rating | |
| Asus Zenbook Pro 15 OLED UM535Q | |
| Microsoft Surface Laptop 4 15 AMD TFF_00028 | |
| Dell XPS 15 9520 RTX 3050 Ti | |
| Microsoft Surface Laptop 5 15, i7-1255U | |
| Average of class Office | |
| LG Gram 15Z90Q | |
| Average Intel Core i7-1255U | |
| Samsung Galaxy Book Pro 15 NP950XDB-KC5US | |
| AIDA64 / FP32 Ray-Trace | |
| Asus Zenbook Pro 15 OLED UM535Q | |
| Microsoft Surface Laptop 4 15 AMD TFF_00028 | |
| Average of class Office (763 - 24250, n=120, last 2 years) | |
| Dell XPS 15 9520 RTX 3050 Ti | |
| Microsoft Surface Laptop 5 15, i7-1255U | |
| Average Intel Core i7-1255U (4313 - 8127, n=9) | |
| LG Gram 15Z90Q | |
| Samsung Galaxy Book Pro 15 NP950XDB-KC5US | |
| AIDA64 / FPU Julia | |
| Asus Zenbook Pro 15 OLED UM535Q | |
| Microsoft Surface Laptop 4 15 AMD TFF_00028 | |
| Average of class Office (4027 - 102228, n=120, last 2 years) | |
| Microsoft Surface Laptop 5 15, i7-1255U | |
| LG Gram 15Z90Q | |
| Average Intel Core i7-1255U (19813 - 41353, n=9) | |
| Dell XPS 15 9520 RTX 3050 Ti | |
| Samsung Galaxy Book Pro 15 NP950XDB-KC5US | |
| AIDA64 / CPU SHA3 | |
| Asus Zenbook Pro 15 OLED UM535Q | |
| Dell XPS 15 9520 RTX 3050 Ti | |
| Microsoft Surface Laptop 4 15 AMD TFF_00028 | |
| Microsoft Surface Laptop 5 15, i7-1255U | |
| Average of class Office (279 - 4442, n=119, last 2 years) | |
| Average Intel Core i7-1255U (1325 - 2135, n=9) | |
| LG Gram 15Z90Q | |
| Samsung Galaxy Book Pro 15 NP950XDB-KC5US | |
| AIDA64 / CPU Queen | |
| Asus Zenbook Pro 15 OLED UM535Q | |
| Dell XPS 15 9520 RTX 3050 Ti | |
| Microsoft Surface Laptop 4 15 AMD TFF_00028 | |
| LG Gram 15Z90Q | |
| Average of class Office (8031 - 113016, n=120, last 2 years) | |
| Microsoft Surface Laptop 5 15, i7-1255U | |
| Average Intel Core i7-1255U (61460 - 65892, n=9) | |
| Samsung Galaxy Book Pro 15 NP950XDB-KC5US | |
| AIDA64 / FPU SinJulia | |
| Microsoft Surface Laptop 4 15 AMD TFF_00028 | |
| Asus Zenbook Pro 15 OLED UM535Q | |
| Dell XPS 15 9520 RTX 3050 Ti | |
| Average of class Office (404 - 14288, n=120, last 2 years) | |
| Microsoft Surface Laptop 5 15, i7-1255U | |
| Average Intel Core i7-1255U (3577 - 5095, n=9) | |
| LG Gram 15Z90Q | |
| Samsung Galaxy Book Pro 15 NP950XDB-KC5US | |
| AIDA64 / FPU Mandel | |
| Asus Zenbook Pro 15 OLED UM535Q | |
| Microsoft Surface Laptop 4 15 AMD TFF_00028 | |
| Average of class Office (2054 - 54365, n=120, last 2 years) | |
| Dell XPS 15 9520 RTX 3050 Ti | |
| Microsoft Surface Laptop 5 15, i7-1255U | |
| Average Intel Core i7-1255U (11759 - 20187, n=9) | |
| LG Gram 15Z90Q | |
| Samsung Galaxy Book Pro 15 NP950XDB-KC5US | |
| AIDA64 / CPU AES | |
| Asus Zenbook Pro 15 OLED UM535Q | |
| Dell XPS 15 9520 RTX 3050 Ti | |
| Average of class Office (5226 - 147611, n=120, last 2 years) | |
| Microsoft Surface Laptop 4 15 AMD TFF_00028 | |
| Average Intel Core i7-1255U (27900 - 67458, n=9) | |
| Microsoft Surface Laptop 5 15, i7-1255U | |
| LG Gram 15Z90Q | |
| Samsung Galaxy Book Pro 15 NP950XDB-KC5US | |
| AIDA64 / CPU ZLib | |
| Dell XPS 15 9520 RTX 3050 Ti | |
| Asus Zenbook Pro 15 OLED UM535Q | |
| Microsoft Surface Laptop 4 15 AMD TFF_00028 | |
| Microsoft Surface Laptop 5 15, i7-1255U | |
| Average Intel Core i7-1255U (393 - 640, n=9) | |
| Average of class Office (67.6 - 1018, n=120, last 2 years) | |
| LG Gram 15Z90Q | |
| Samsung Galaxy Book Pro 15 NP950XDB-KC5US | |
| AIDA64 / FP64 Ray-Trace | |
| Asus Zenbook Pro 15 OLED UM535Q | |
| Microsoft Surface Laptop 4 15 AMD TFF_00028 | |
| Average of class Office (432 - 12755, n=120, last 2 years) | |
| Dell XPS 15 9520 RTX 3050 Ti | |
| Microsoft Surface Laptop 5 15, i7-1255U | |
| Average Intel Core i7-1255U (2474 - 4400, n=9) | |
| Samsung Galaxy Book Pro 15 NP950XDB-KC5US | |
| LG Gram 15Z90Q | |
| AIDA64 / CPU PhotoWorxx | |
| LG Gram 15Z90Q | |
| Microsoft Surface Laptop 5 15, i7-1255U | |
| Samsung Galaxy Book Pro 15 NP950XDB-KC5US | |
| Dell XPS 15 9520 RTX 3050 Ti | |
| Average Intel Core i7-1255U (13899 - 44054, n=9) | |
| Average of class Office (4814 - 48177, n=120, last 2 years) | |
| Microsoft Surface Laptop 4 15 AMD TFF_00028 | |
| Asus Zenbook Pro 15 OLED UM535Q | |
System performance
The Surface Laptop 5 is a responsive companion for everyday use and we couldn't identify any problems during our test.
CrossMark: Overall | Productivity | Creativity | Responsiveness
| PCMark 10 / Score | |
| Dell XPS 15 9520 RTX 3050 Ti | |
| Asus Zenbook Pro 15 OLED UM535Q | |
| Microsoft Surface Laptop 5 15, i7-1255U | |
| Average of class Office (2325 - 7157, n=105, last 2 years) | |
| Average Intel Core i7-1255U, Intel Iris Xe Graphics G7 96EUs (4676 - 5523, n=8) | |
| Microsoft Surface Laptop 4 15 AMD TFF_00028 | |
| LG Gram 15Z90Q | |
| Samsung Galaxy Book Pro 15 NP950XDB-KC5US | |
| PCMark 10 / Essentials | |
| Dell XPS 15 9520 RTX 3050 Ti | |
| Average Intel Core i7-1255U, Intel Iris Xe Graphics G7 96EUs (9381 - 11654, n=8) | |
| Asus Zenbook Pro 15 OLED UM535Q | |
| Microsoft Surface Laptop 5 15, i7-1255U | |
| Average of class Office (5095 - 20841, n=105, last 2 years) | |
| Samsung Galaxy Book Pro 15 NP950XDB-KC5US | |
| LG Gram 15Z90Q | |
| Microsoft Surface Laptop 4 15 AMD TFF_00028 | |
| PCMark 10 / Productivity | |
| Asus Zenbook Pro 15 OLED UM535Q | |
| Dell XPS 15 9520 RTX 3050 Ti | |
| Average of class Office (3041 - 10198, n=105, last 2 years) | |
| Microsoft Surface Laptop 5 15, i7-1255U | |
| Microsoft Surface Laptop 4 15 AMD TFF_00028 | |
| Average Intel Core i7-1255U, Intel Iris Xe Graphics G7 96EUs (6530 - 7418, n=8) | |
| Samsung Galaxy Book Pro 15 NP950XDB-KC5US | |
| LG Gram 15Z90Q | |
| PCMark 10 / Digital Content Creation | |
| Dell XPS 15 9520 RTX 3050 Ti | |
| Asus Zenbook Pro 15 OLED UM535Q | |
| Microsoft Surface Laptop 5 15, i7-1255U | |
| Average of class Office (1912 - 9056, n=105, last 2 years) | |
| LG Gram 15Z90Q | |
| Microsoft Surface Laptop 4 15 AMD TFF_00028 | |
| Average Intel Core i7-1255U, Intel Iris Xe Graphics G7 96EUs (4498 - 6203, n=8) | |
| Samsung Galaxy Book Pro 15 NP950XDB-KC5US | |
| CrossMark / Overall | |
| Dell XPS 15 9520 RTX 3050 Ti | |
| Microsoft Surface Laptop 5 15, i7-1255U | |
| Average Intel Core i7-1255U, Intel Iris Xe Graphics G7 96EUs (1329 - 1573, n=8) | |
| Asus Zenbook Pro 15 OLED UM535Q | |
| Average of class Office (348 - 1891, n=106, last 2 years) | |
| CrossMark / Productivity | |
| Dell XPS 15 9520 RTX 3050 Ti | |
| Microsoft Surface Laptop 5 15, i7-1255U | |
| Average Intel Core i7-1255U, Intel Iris Xe Graphics G7 96EUs (1364 - 1554, n=8) | |
| Asus Zenbook Pro 15 OLED UM535Q | |
| Average of class Office (393 - 1870, n=106, last 2 years) | |
| CrossMark / Creativity | |
| Dell XPS 15 9520 RTX 3050 Ti | |
| Microsoft Surface Laptop 5 15, i7-1255U | |
| Average Intel Core i7-1255U, Intel Iris Xe Graphics G7 96EUs (1372 - 1660, n=8) | |
| Asus Zenbook Pro 15 OLED UM535Q | |
| Average of class Office (340 - 1982, n=106, last 2 years) | |
| CrossMark / Responsiveness | |
| Dell XPS 15 9520 RTX 3050 Ti | |
| Average Intel Core i7-1255U, Intel Iris Xe Graphics G7 96EUs (1117 - 1434, n=8) | |
| Microsoft Surface Laptop 5 15, i7-1255U | |
| Asus Zenbook Pro 15 OLED UM535Q | |
| Average of class Office (258 - 2017, n=106, last 2 years) | |
| PCMark 10 Score | 5472 points | |
Help | ||
| AIDA64 / Memory Copy | |
| LG Gram 15Z90Q | |
| Microsoft Surface Laptop 5 15, i7-1255U | |
| Dell XPS 15 9520 RTX 3050 Ti | |
| Samsung Galaxy Book Pro 15 NP950XDB-KC5US | |
| Average Intel Core i7-1255U (22846 - 67017, n=9) | |
| Average of class Office (7158 - 88119, n=121, last 2 years) | |
| Asus Zenbook Pro 15 OLED UM535Q | |
| Microsoft Surface Laptop 4 15 AMD TFF_00028 | |
| AIDA64 / Memory Read | |
| LG Gram 15Z90Q | |
| Microsoft Surface Laptop 5 15, i7-1255U | |
| Dell XPS 15 9520 RTX 3050 Ti | |
| Samsung Galaxy Book Pro 15 NP950XDB-KC5US | |
| Average Intel Core i7-1255U (22877 - 67398, n=9) | |
| Microsoft Surface Laptop 4 15 AMD TFF_00028 | |
| Average of class Office (7325 - 87297, n=121, last 2 years) | |
| Asus Zenbook Pro 15 OLED UM535Q | |
| AIDA64 / Memory Write | |
| LG Gram 15Z90Q | |
| Microsoft Surface Laptop 5 15, i7-1255U | |
| Samsung Galaxy Book Pro 15 NP950XDB-KC5US | |
| Dell XPS 15 9520 RTX 3050 Ti | |
| Average Intel Core i7-1255U (22883 - 65839, n=9) | |
| Average of class Office (7579 - 94965, n=121, last 2 years) | |
| Asus Zenbook Pro 15 OLED UM535Q | |
| Microsoft Surface Laptop 4 15 AMD TFF_00028 | |
| AIDA64 / Memory Latency | |
| Microsoft Surface Laptop 5 15, i7-1255U | |
| Microsoft Surface Laptop 4 15 AMD TFF_00028 | |
| LG Gram 15Z90Q | |
| Samsung Galaxy Book Pro 15 NP950XDB-KC5US | |
| Dell XPS 15 9520 RTX 3050 Ti | |
| Asus Zenbook Pro 15 OLED UM535Q | |
| Average of class Office (44.3 - 188.3, n=122, last 2 years) | |
| Average Intel Core i7-1255U (76 - 163.2, n=9) | |
* ... smaller is better
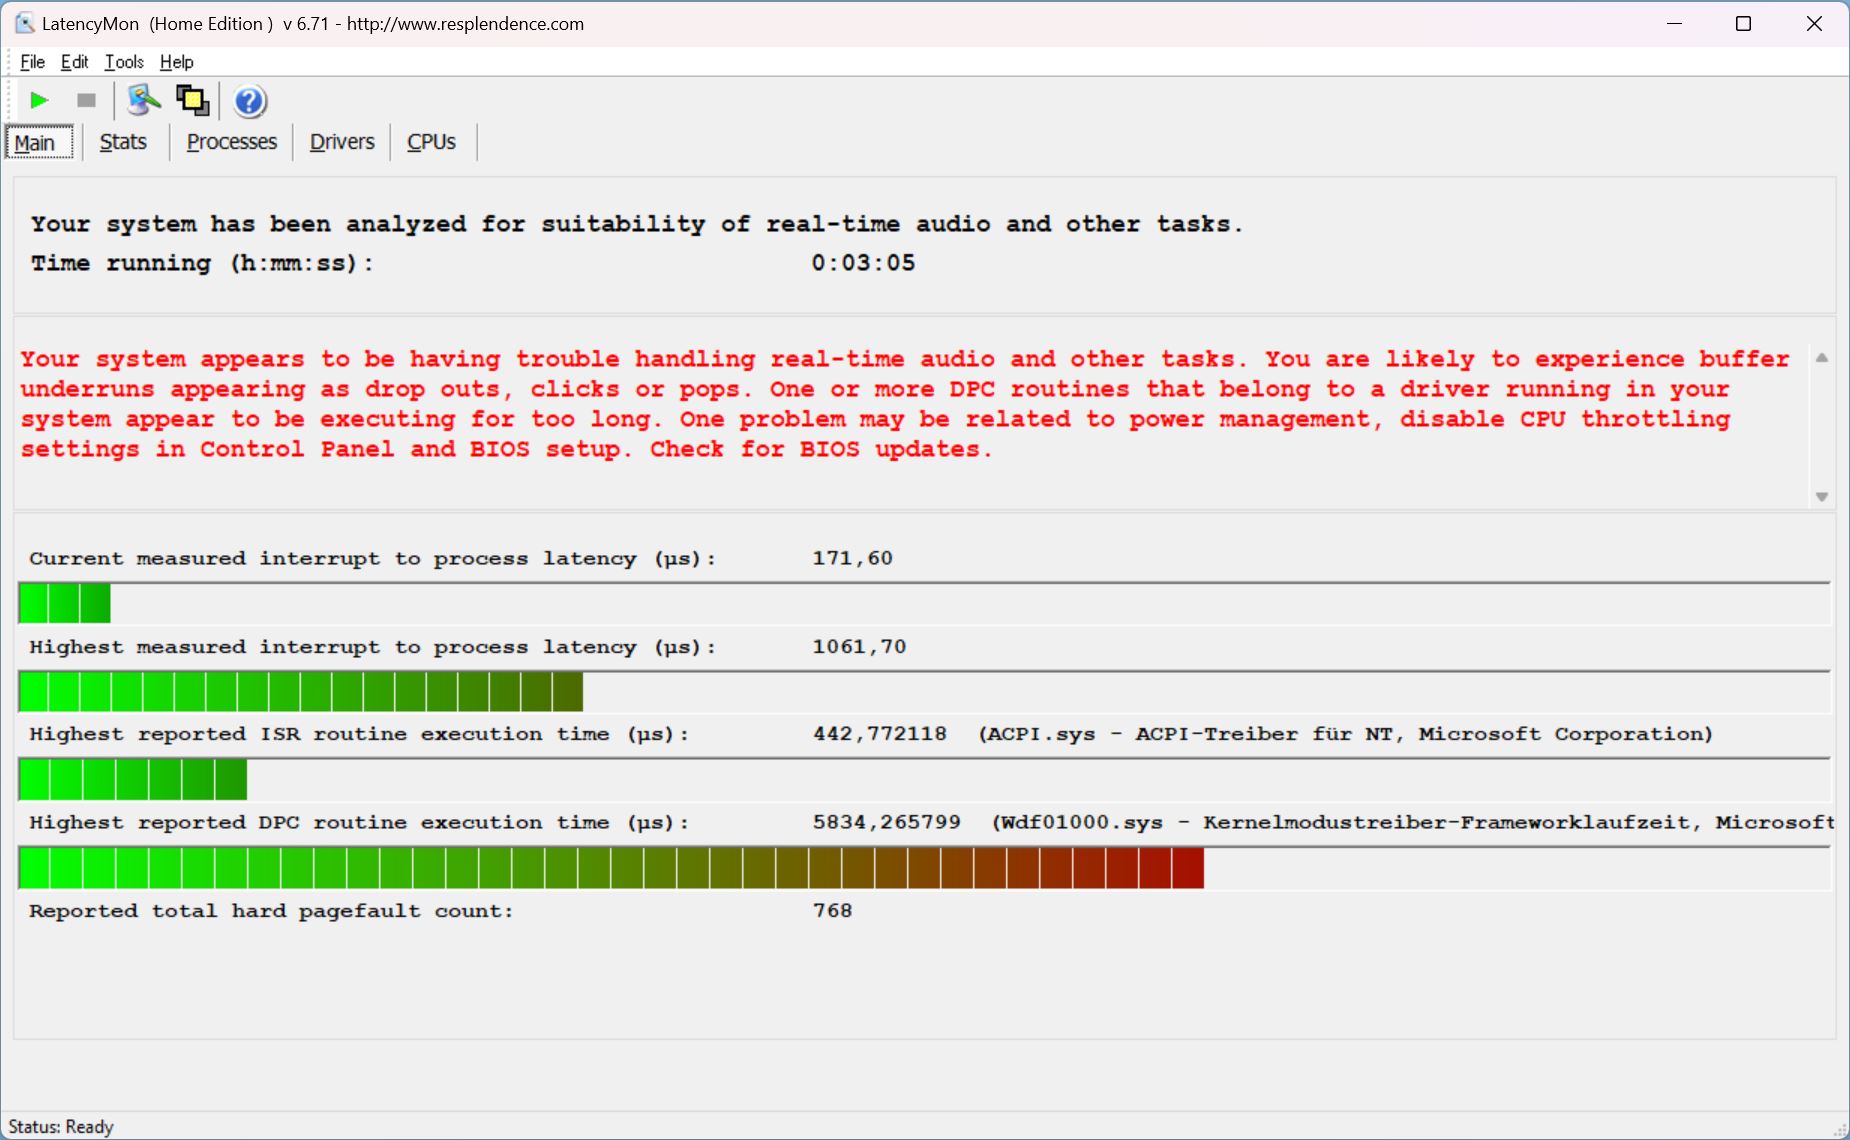
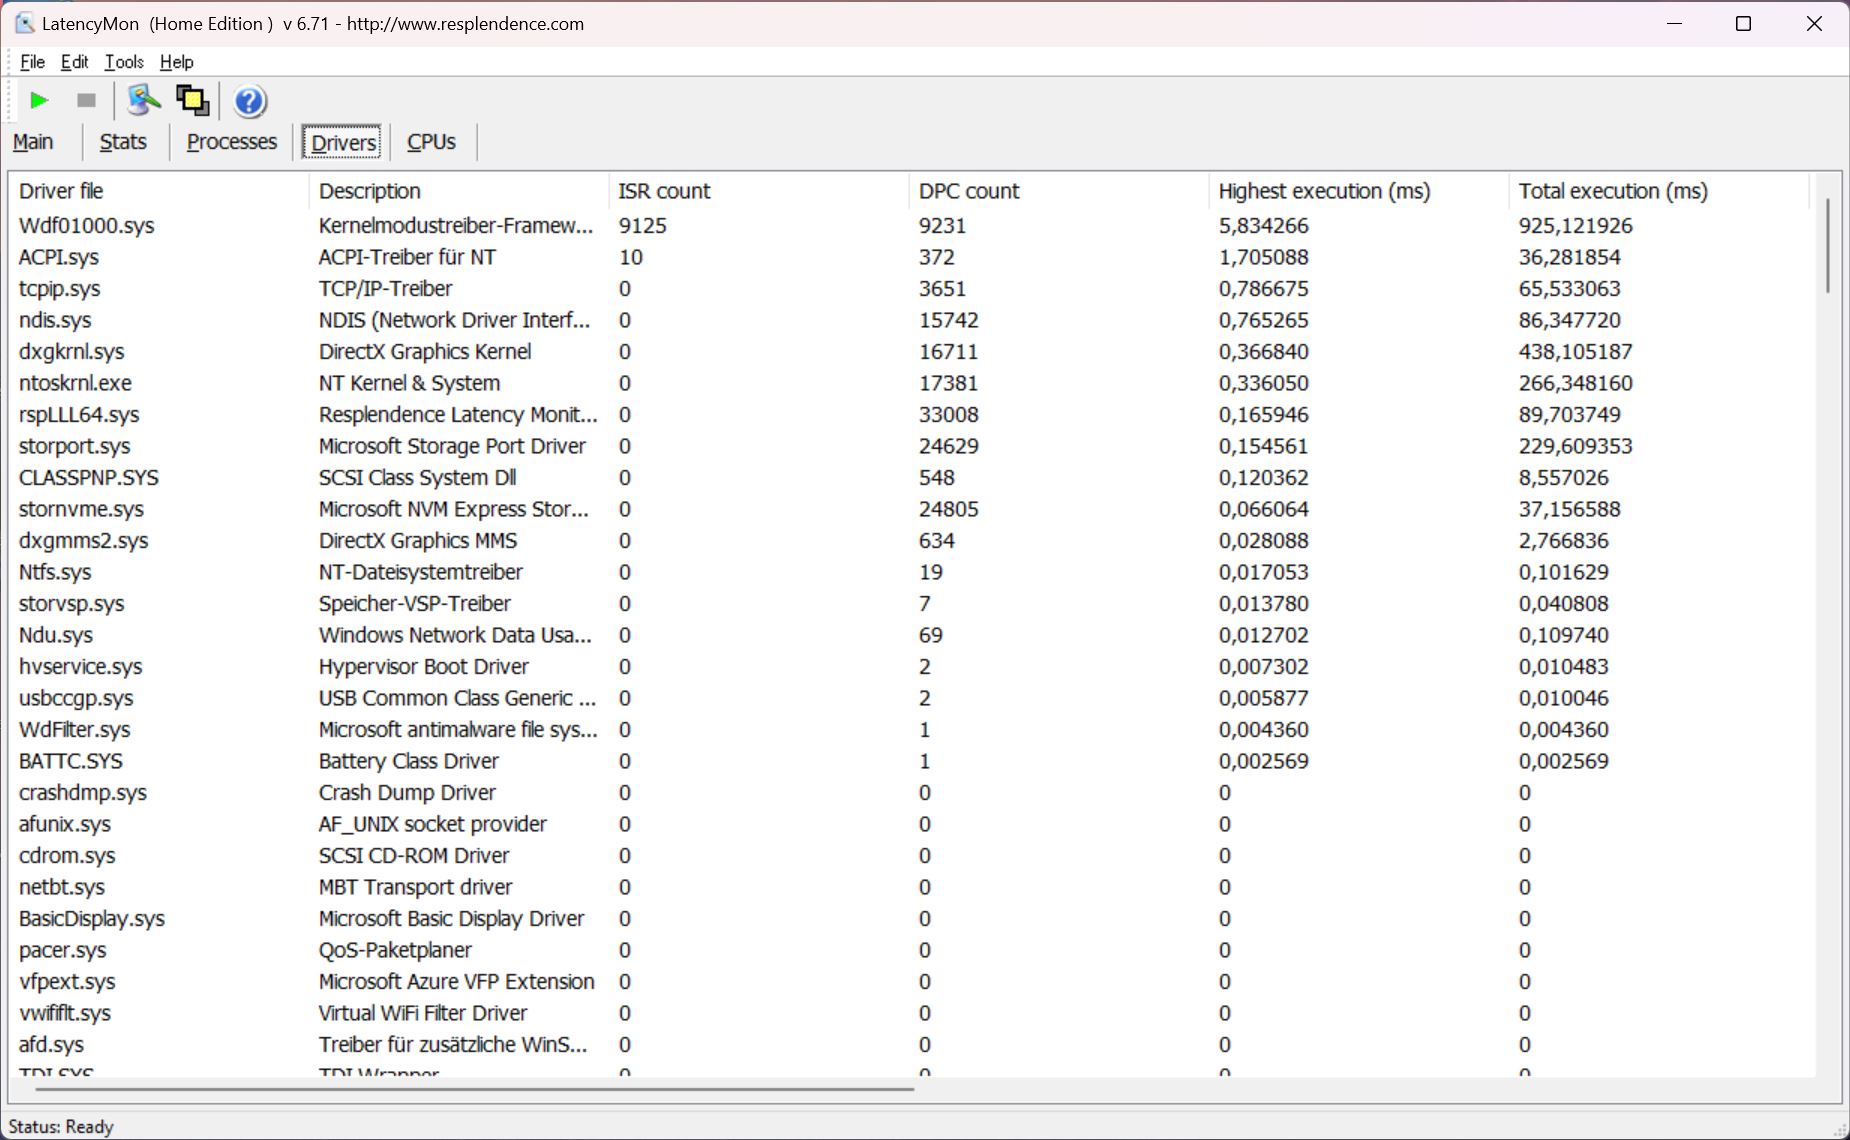
DPC latency
With the present BIOS version, our test device showed some limitations in our standardized latency test.
| DPC Latencies / LatencyMon - interrupt to process latency (max), Web, Youtube, Prime95 | |
| Microsoft Surface Laptop 5 15, i7-1255U | |
| Dell XPS 15 9520 RTX 3050 Ti | |
| LG Gram 15Z90Q | |
| Microsoft Surface Laptop 4 15 AMD TFF_00028 | |
| Samsung Galaxy Book Pro 15 NP950XDB-KC5US | |
| Asus Zenbook Pro 15 OLED UM535Q | |
* ... smaller is better
Storage devices
The laptop has an NVMe SSD from SK hynix (BC711) installed with a storage capacity of 512 GB, of which 415 GB are still available after the first startup. The drive is connected via PCIe 3.0 - the newer 4.0 interface is not yet supported by the Surface Laptop 5. The device's transfer rates were overall perfectly sufficient with a maximum of 3.5 GB/s and its performance remained completely stable even under longer load. More SSD benchmarks can be found here.

* ... smaller is better
Reading continuous performance: DiskSpd Read Loop, Queue Depth 8
Graphics card
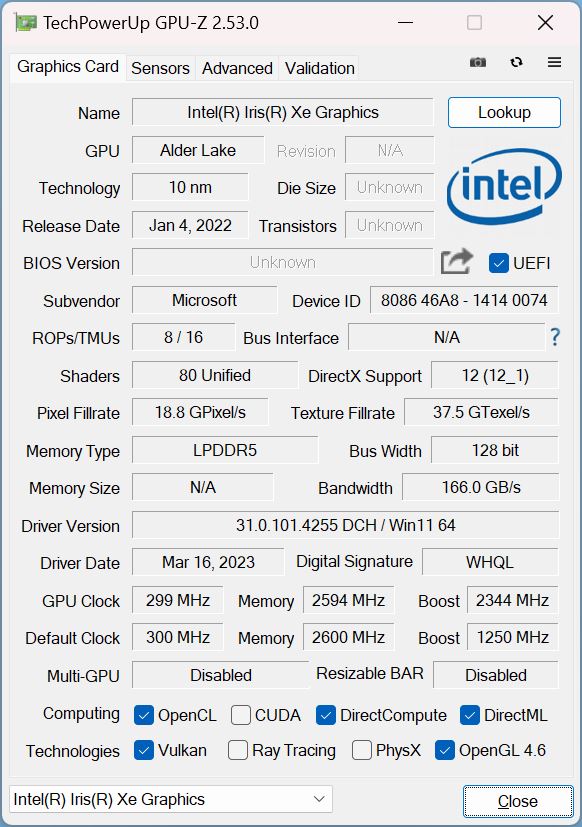
The Alder Lake processor uses an integrated Iris Xe Graphics G7 with 96 EUs, which we have known for a while - and which is still used in the current Raptor Lake CPUs. There is no dedicated graphics card. For simple tasks including high-resolution video playback, the Iris Xe Graphics G7 performed sufficiently and was around 40% ahead of the old Vega 8 in its AMD predecessor - but we are still talking about a low performance level overall. Its 15-inch competitors with dedicated graphics cards like the RTX 3050 Ti offer significantly more performance, even for gaming. With the Surface Laptop 5, you have to settle for playing older or less demanding games with reduced details.
Its GPU performance remained stable under longer load, but there was a slight deficit of about 15% in battery mode (1,359 points @Time Spy Graphics). More GPU benchmarks are available here.
| 3DMark 11 Performance | 6844 points | |
| 3DMark Fire Strike Score | 4739 points | |
| 3DMark Time Spy Score | 1782 points | |
Help | ||
| Blender / v3.3 Classroom CPU | |
| Average of class Office (343 - 3786, n=109, last 2 years) | |
| LG Gram 15Z90Q | |
| Microsoft Surface Laptop 5 15, i7-1255U | |
| Average Intel Iris Xe Graphics G7 96EUs (336 - 1259, n=94) | |
* ... smaller is better
| The Witcher 3 - 1920x1080 Ultra Graphics & Postprocessing (HBAO+) | |
| Asus Zenbook Pro 15 OLED UM535Q | |
| Dell XPS 15 9520 RTX 3050 Ti | |
| Samsung Galaxy Book Pro 15 NP950XDB-KC5US | |
| Average of class Office (2.66 - 34, n=110, last 2 years) | |
| Microsoft Surface Laptop 4 15 AMD TFF_00028 | |
| Microsoft Surface Laptop 5 15, i7-1255U | |
| LG Gram 15Z90Q | |
| GTA V - 1920x1080 Highest Settings possible AA:4xMSAA + FX AF:16x | |
| Asus Zenbook Pro 15 OLED UM535Q | |
| Dell XPS 15 9520 RTX 3050 Ti | |
| Samsung Galaxy Book Pro 15 NP950XDB-KC5US | |
| Average of class Office (3.35 - 47.8, n=90, last 2 years) | |
| Microsoft Surface Laptop 5 15, i7-1255U | |
| Final Fantasy XV Benchmark - 1920x1080 High Quality | |
| Asus Zenbook Pro 15 OLED UM535Q | |
| Dell XPS 15 9520 RTX 3050 Ti | |
| Samsung Galaxy Book Pro 15 NP950XDB-KC5US | |
| Microsoft Surface Laptop 5 15, i7-1255U | |
| Average of class Office (2.03 - 35.7, n=102, last 2 years) | |
| LG Gram 15Z90Q | |
| Strange Brigade - 1920x1080 ultra AA:ultra AF:16 | |
| Asus Zenbook Pro 15 OLED UM535Q | |
| Dell XPS 15 9520 RTX 3050 Ti | |
| Samsung Galaxy Book Pro 15 NP950XDB-KC5US | |
| Microsoft Surface Laptop 5 15, i7-1255U | |
| Average of class Office (6.6 - 56.5, n=96, last 2 years) | |
Witcher 3 FPS diagram
| low | med. | high | ultra | |
| GTA V (2015) | 98.5 | 87.9 | 22.7 | 9.87 |
| The Witcher 3 (2015) | 88 | 56 | 31 | 12.4 |
| Dota 2 Reborn (2015) | 105.4 | 79.8 | 61.2 | 55.2 |
| Final Fantasy XV Benchmark (2018) | 42.9 | 23.8 | 16.4 | |
| X-Plane 11.11 (2018) | 42.5 | 35 | 28.8 | |
| Strange Brigade (2018) | 87.2 | 38 | 30 | 24.3 |
| F1 2021 (2021) | 101.7 | 50.3 | 39.4 | 27.1 |
| F1 22 (2022) | 45 | 41.4 | 29.6 | 22.3 |
Emissions & power
Noise emissions
Just like its predecessor, the Surface Laptop 5 15's fan curve is extremely defensive and even under full load it took about a minute before the fans even kicked in. Its noise levels have dropped a bit overall - we measured 38.1 dB(A) when gaming and during the stress test. The noise never reached annoying levels (or got high-pitched), but these results are still not outstanding considering the laptop's low performance level and its large case. However, the device often remained silent in everyday use and no other electronic noises could be heard.
Noise Level
| Idle |
| 23.3 / 23.3 / 23.3 dB(A) |
| Load |
| 35 / 38.1 dB(A) |
 | ||
30 dB silent 40 dB(A) audible 50 dB(A) loud |
||
min: | ||
| Microsoft Surface Laptop 5 15, i7-1255U Iris Xe G7 96EUs, i7-1255U, SK Hynix BC711 512GB HFM512GD3GX013N | Microsoft Surface Laptop 4 15 AMD TFF_00028 Vega 8, R7 4980U, SK Hynix BC511 HFM512GDJTNI | LG Gram 15Z90Q Iris Xe G7 80EUs, i5-1240P, Samsung PM9A1 MZVL21T0HCLR | Dell XPS 15 9520 RTX 3050 Ti GeForce RTX 3050 Ti Laptop GPU, i7-12700H, WDC PC SN810 512GB | Samsung Galaxy Book Pro 15 NP950XDB-KC5US Iris Xe G7 96EUs, i7-1165G7, Samsung PM991a MZ9LQ1T0HBLB-00BKN | Asus Zenbook Pro 15 OLED UM535Q GeForce RTX 3050 Ti Laptop GPU, R9 5900HX, WDC PC SN730 SDBPNTY-1T00 | |
|---|---|---|---|---|---|---|
| Noise | -6% | -8% | 1% | -3% | -7% | |
| off / environment * | 23.3 | 24.2 -4% | 25 -7% | 22.8 2% | 23 1% | 22.8 2% |
| Idle Minimum * | 23.3 | 24.2 -4% | 26 -12% | 22.9 2% | 23.2 -0% | 22.9 2% |
| Idle Average * | 23.3 | 24.2 -4% | 27 -16% | 22.9 2% | 23.2 -0% | 22.9 2% |
| Idle Maximum * | 23.3 | 24.2 -4% | 28 -20% | 22.9 2% | 23.2 -0% | 22.9 2% |
| Load Average * | 35 | 39.9 -14% | 37 -6% | 30.9 12% | 35.8 -2% | 33.2 5% |
| Witcher 3 ultra * | 38.1 | 39.9 -5% | 37 3% | 37.8 1% | 41.9 -10% | 47.3 -24% |
| Load Maximum * | 38.1 | 39.9 -5% | 37 3% | 44.7 -17% | 41.9 -10% | 52.8 -39% |
* ... smaller is better
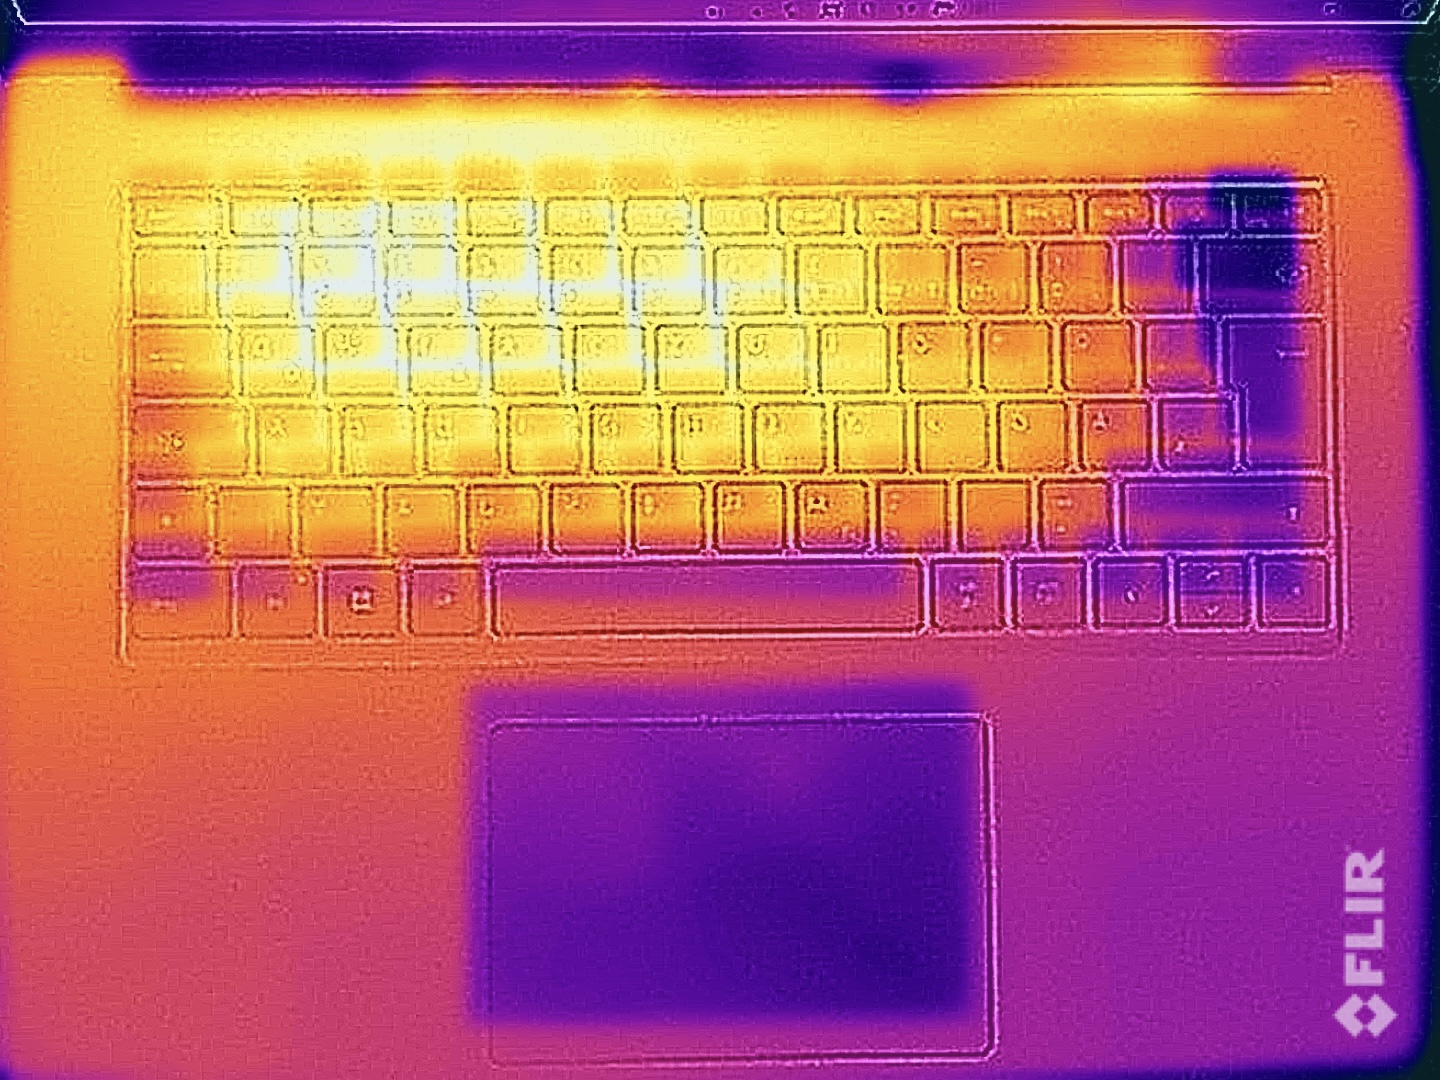
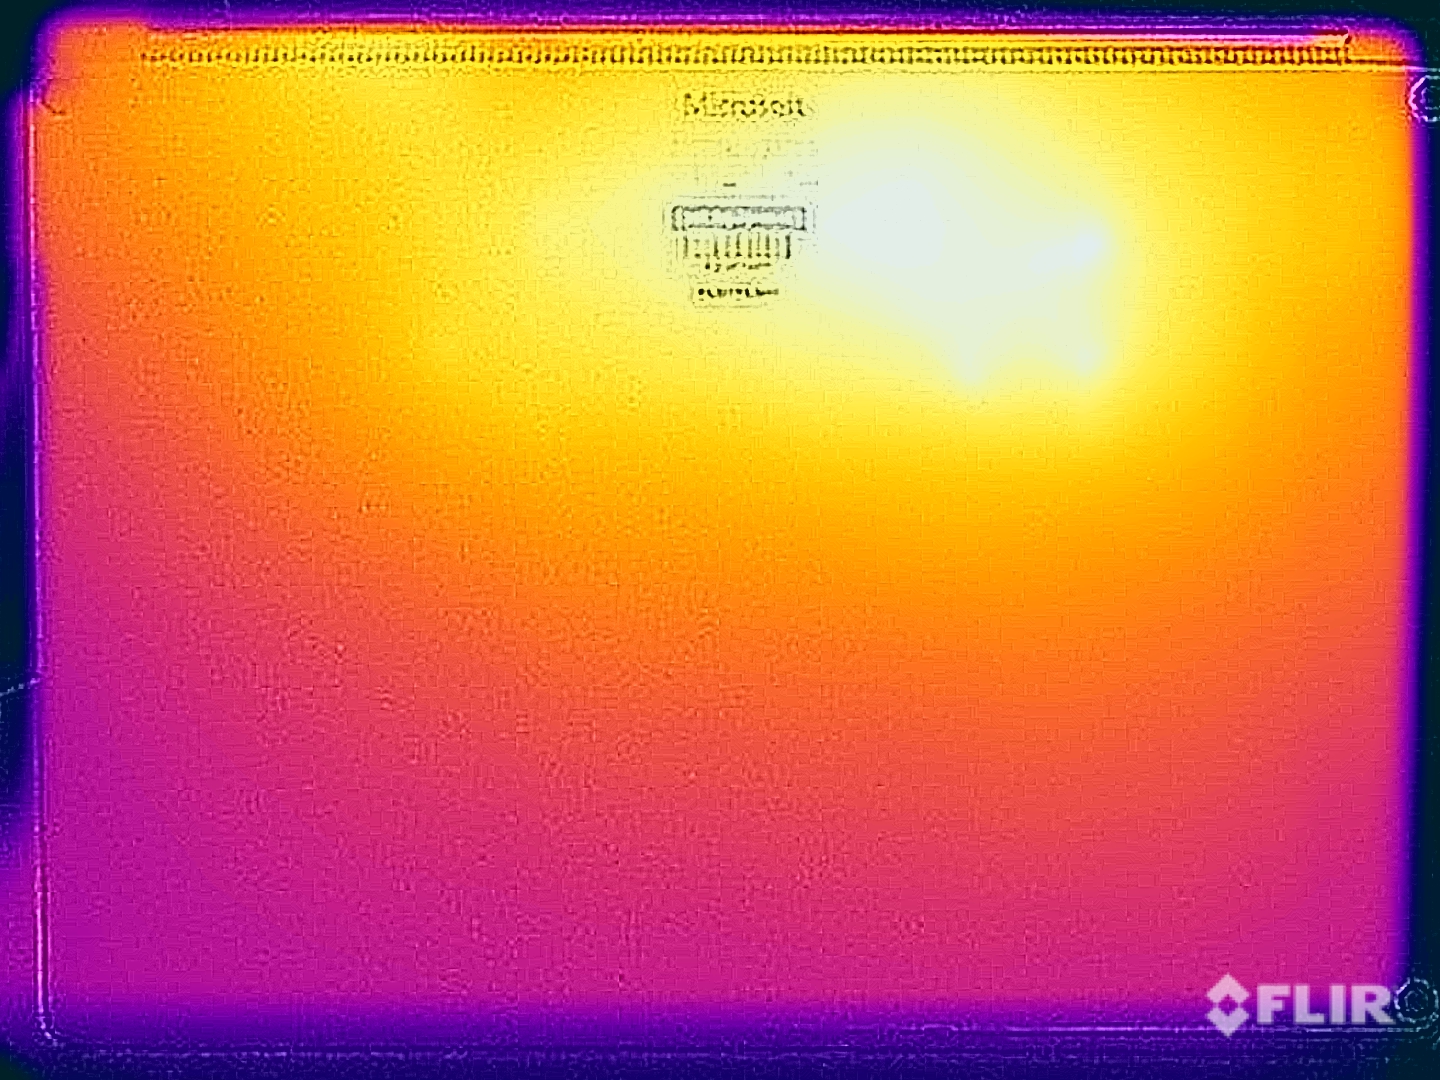
Temperature
The case hardly warmed up during simple tasks, but we measured up to 47 °C on the bottom of the case under load. Due to its metal surfaces, this temperature already proves to be uncomfortable to touch, so we would advise against placing the device on your thighs in this scenario.
These high temperatures were a little surprising because the device's power consumption only settled at 25 watts after a few minutes in our stress test, but dropped further to around 23 watts after 30 minutes - not particularly good considering the case's size. However, we didn't notice any reduction in power directly after the stress test.
(±) The maximum temperature on the upper side is 44.6 °C / 112 F, compared to the average of 34.2 °C / 94 F, ranging from 21.2 to 62.5 °C for the class Office.
(-) The bottom heats up to a maximum of 47.4 °C / 117 F, compared to the average of 36.7 °C / 98 F
(+) In idle usage, the average temperature for the upper side is 22.2 °C / 72 F, compared to the device average of 29.5 °C / 85 F.
(±) Playing The Witcher 3, the average temperature for the upper side is 37.8 °C / 100 F, compared to the device average of 29.5 °C / 85 F.
(±) The palmrests and touchpad can get very hot to the touch with a maximum of 36.5 °C / 97.7 F.
(-) The average temperature of the palmrest area of similar devices was 27.7 °C / 81.9 F (-8.8 °C / -15.8 F).
| Microsoft Surface Laptop 5 15, i7-1255U Intel Core i7-1255U, Intel Iris Xe Graphics G7 96EUs | Microsoft Surface Laptop 4 15 AMD TFF_00028 AMD Ryzen 7 4980U, AMD Radeon RX Vega 8 (Ryzen 4000/5000) | LG Gram 15Z90Q Intel Core i5-1240P, Intel Iris Xe Graphics G7 80EUs | Dell XPS 15 9520 RTX 3050 Ti Intel Core i7-12700H, NVIDIA GeForce RTX 3050 Ti Laptop GPU | Samsung Galaxy Book Pro 15 NP950XDB-KC5US Intel Core i7-1165G7, Intel Iris Xe Graphics G7 96EUs | Asus Zenbook Pro 15 OLED UM535Q AMD Ryzen 9 5900HX, NVIDIA GeForce RTX 3050 Ti Laptop GPU | |
|---|---|---|---|---|---|---|
| Heat | 2% | -3% | -25% | 5% | -28% | |
| Maximum Upper Side * | 44.6 | 41.8 6% | 46 -3% | 51.4 -15% | 37.2 17% | 36 19% |
| Maximum Bottom * | 47.4 | 44.8 5% | 45 5% | 51 -8% | 47 1% | 47.2 -0% |
| Idle Upper Side * | 22.6 | 23 -2% | 25 -11% | 30 -33% | 22 3% | 37 -64% |
| Idle Bottom * | 23.3 | 23.6 -1% | 24 -3% | 33 -42% | 23.6 -1% | 39.2 -68% |
* ... smaller is better
Speakers
There are no visible speaker grilles because the sound is emitted via the keyboard openings. This works very well in practice because although there are definitely even louder modules out there, the overall quality is very good and external speakers aren't really necessary.
Microsoft Surface Laptop 5 15, i7-1255U audio analysis
(±) | speaker loudness is average but good (78.1 dB)
Bass 100 - 315 Hz
(±) | reduced bass - on average 14% lower than median
(±) | linearity of bass is average (9.3% delta to prev. frequency)
Mids 400 - 2000 Hz
(+) | balanced mids - only 2.3% away from median
(+) | mids are linear (4.1% delta to prev. frequency)
Highs 2 - 16 kHz
(+) | balanced highs - only 2.8% away from median
(+) | highs are linear (3.2% delta to prev. frequency)
Overall 100 - 16.000 Hz
(+) | overall sound is linear (12.9% difference to median)
Compared to same class
» 3% of all tested devices in this class were better, 2% similar, 95% worse
» The best had a delta of 7%, average was 22%, worst was 53%
Compared to all devices tested
» 9% of all tested devices were better, 2% similar, 88% worse
» The best had a delta of 4%, average was 25%, worst was 134%
Dell XPS 15 9520 RTX 3050 Ti audio analysis
(+) | speakers can play relatively loud (83.1 dB)
Bass 100 - 315 Hz
(+) | good bass - only 4.4% away from median
(+) | bass is linear (6.8% delta to prev. frequency)
Mids 400 - 2000 Hz
(+) | balanced mids - only 2.6% away from median
(+) | mids are linear (4.1% delta to prev. frequency)
Highs 2 - 16 kHz
(+) | balanced highs - only 1.9% away from median
(+) | highs are linear (5.4% delta to prev. frequency)
Overall 100 - 16.000 Hz
(+) | overall sound is linear (6.4% difference to median)
Compared to same class
» 2% of all tested devices in this class were better, 1% similar, 97% worse
» The best had a delta of 5%, average was 18%, worst was 45%
Compared to all devices tested
» 0% of all tested devices were better, 0% similar, 99% worse
» The best had a delta of 4%, average was 25%, worst was 134%
Power consumption
The consumption measurements showed no surprises and the maximum idle consumption (full brightness) was 8.4 watts. The device ran into the power supply's limits for a few seconds during high CPU load, which is pretty much the norm nowadays due to the current Intel CPUs' high power limits. During our stress test, the consumption quickly leveled off at 45 watts and the 65-watt power supply, which also offers another USB-A output for charging, was overall sufficient.
| Off / Standby | |
| Idle | |
| Load |
|
Power consumption Witcher 3 / stress test
Power consumption with external monitor
Runtimes
The battery capacity remains unchanged at 47.4 watt hours and runtimes ended up worse across the board compared to its predecessor with an AMD processor. We noted a little over 8.5 hours in the WLAN test with 150 cd/m² (corresponds to 64% of the maximum brightness in the test device) and 6.5 hours in full brightness. The AMD predecessor managed around 10.5 and 7 hours, respectively. The Intel model also did worse in the video test with 9:44 hours compared to around 15 hours (Surface Laptop 4 AMD).
| Microsoft Surface Laptop 5 15, i7-1255U i7-1255U, Iris Xe G7 96EUs, 47.4 Wh | Microsoft Surface Laptop 4 15 AMD TFF_00028 R7 4980U, Vega 8, 47.4 Wh | LG Gram 15Z90Q i5-1240P, Iris Xe G7 80EUs, 80 Wh | Dell XPS 15 9520 RTX 3050 Ti i7-12700H, GeForce RTX 3050 Ti Laptop GPU, 86 Wh | Samsung Galaxy Book Pro 15 NP950XDB-KC5US i7-1165G7, Iris Xe G7 96EUs, 68 Wh | Asus Zenbook Pro 15 OLED UM535Q R9 5900HX, GeForce RTX 3050 Ti Laptop GPU, 96 Wh | Average of class Office | |
|---|---|---|---|---|---|---|---|
| Battery Runtime | 27% | 32% | 21% | -6% | 52% | 7% | |
| H.264 | 584 | 890 52% | 705 ? 21% | ||||
| WiFi v1.3 | 517 | 624 21% | 716 38% | 528 2% | 603 17% | 766 48% | 594 ? 15% |
| Load | 138 | 147 7% | 173 25% | 192 39% | 100 -28% | 215 56% | 117.7 ? -15% |
Pros
Cons
Verdict - The Surface Laptop 5 is in dire need of a bigger update
The Surface laptop's fifth generation is clearly beginning to show its age. We are not talking about last year's Alder-Lake processor, since the latest Raptor-Lake models only deliver marginally more performance, but rather about the device's design itself. The screen's edges are simply too wide for a modern device, a 720p webcam is no longer up to date, and a stronger cooling system would also come in handy. Its overall performance is quite modest for a 15-inch case, and it is clearly lacking in maintenance options.
We understand that Microsoft have cancelled the AMD version due to the supply situation and that its lower multi-core performance will not likely be a big issue for an office laptop, but we also noted significantly shorter battery runtimes. Thus, the new Surface Laptop 5 is not really a step in the right direction.
The Microsoft Surface Laptop 5 is in dire need of an extensive update - for years now, you seem to just get the same product again and again. Often, its competitors offer many more features and better performance - for a lower price, too. In 2023, the package on offer is simply not enough to justify its high price.
The device's 3:2 format display is still well suited for productive work and also has a good subjective picture quality, but Microsoft is clearly lagging behind in terms of specifications. There would be much more potential here with a higher frequency and larger color space coverage.
Apart from the review sample's somewhat creaky case, the Surface Laptop 5 is actually a solid device; the big problem is the price. The MSRP for our test device with 16 GB of RAM and a 512 GB SSD (so by no means a high-end variant) is around $4,000, and Microsoft still charge this price to this day. That is clearly too much for the offered product and even the current high-street price of $1,699 is still too high when you look at the recently reviewed Lenovo Yoga Pro 7 14, for example, which scored much better in virtually all disciplines and costs only around $1,449.
Price and availability
You can find the Surface Laptop 5 15 much cheaper than the MRSP on Amazon for $1,699.
Microsoft Surface Laptop 5 15, i7-1255U
-
04/24/2023 v7
Andreas Osthoff
More articles related to this device
Microsoft Surface Laptop 5 15, i7-1255U (Surface Laptop 5 Series)Related Articles


Transparency
The present review sample was made available to the author as a loan by the manufacturer or a shop for the purposes of review. The lender had no influence on this review, nor did the manufacturer receive a copy of this review before publication. There was no obligation to publish this review.
Pricecompare

