MSI WT72 6QM Workstation Review
Last summer, we took a look at MSI's WT72 workstation equipped with a Haswell Core i7-4980HQ CPU and came away pretty impressed. MSI is now offering an upgrade to last year's model with a new Skylake i7 CPU, but different graphics card depending on the version. There are actually four different notebooks with the same Intel Skylake i7-6700HQ CPU, ranging from the WT72 6QI-654US with NVIDIA Quadro M1000M for $1900 to the WT72 6QI-654US with Quadro M4000M, which sells for $3100. This time around, we are going to focus our attention at the top-of-the-line WT72 6QM-423US with Intel Xeon E3-1505 processor and high-end NVIDIA Quadro M5000M. This model comes equipped with 32GB of DDR4 2133MHz, both solid state and platter-based drives and sells for a mind-blowing $5000. The other version with Xeon processor isn't for the faint of heart either: equipped with Quadro M4000M, this particular workstation (model WT72 6QL-400) sells for $3700. Of course, we are talking about purpose-built machines here; for the intended user base, the price is likely less of an issue than overall performance and reliability.
As before, the updated workstation is actually based on a gaming rig and from a physical standpoint almost identical to the Xotic PC MSI GT72S 6QF gaming notebook reviewed here. While there are quite a few larger gaming notebooks, high-end 17-inch workstations are a rare breed indeed. Competitors include the HP ZBook 17 G2 J8Z55ET or the Bullman E-Klasse Xeon 17 (note: review is only available in German). At the time of writing, Dell still offers the Dell Precision M6800 with 4th-generation Haswell Core i7 CPU, although there is also a new model called Precision 17 7000 (up to 6th-generation Intel Xeon CPU), which we've not had a chance to review yet. Since the chassis is almost identical, we will skip certain sections during our review or only cover them briefly. Please take a look at our previous reviews of the MSI's WT72 and the Xotic PC MSI GT72S 6QF Dragon for additional information.
Case
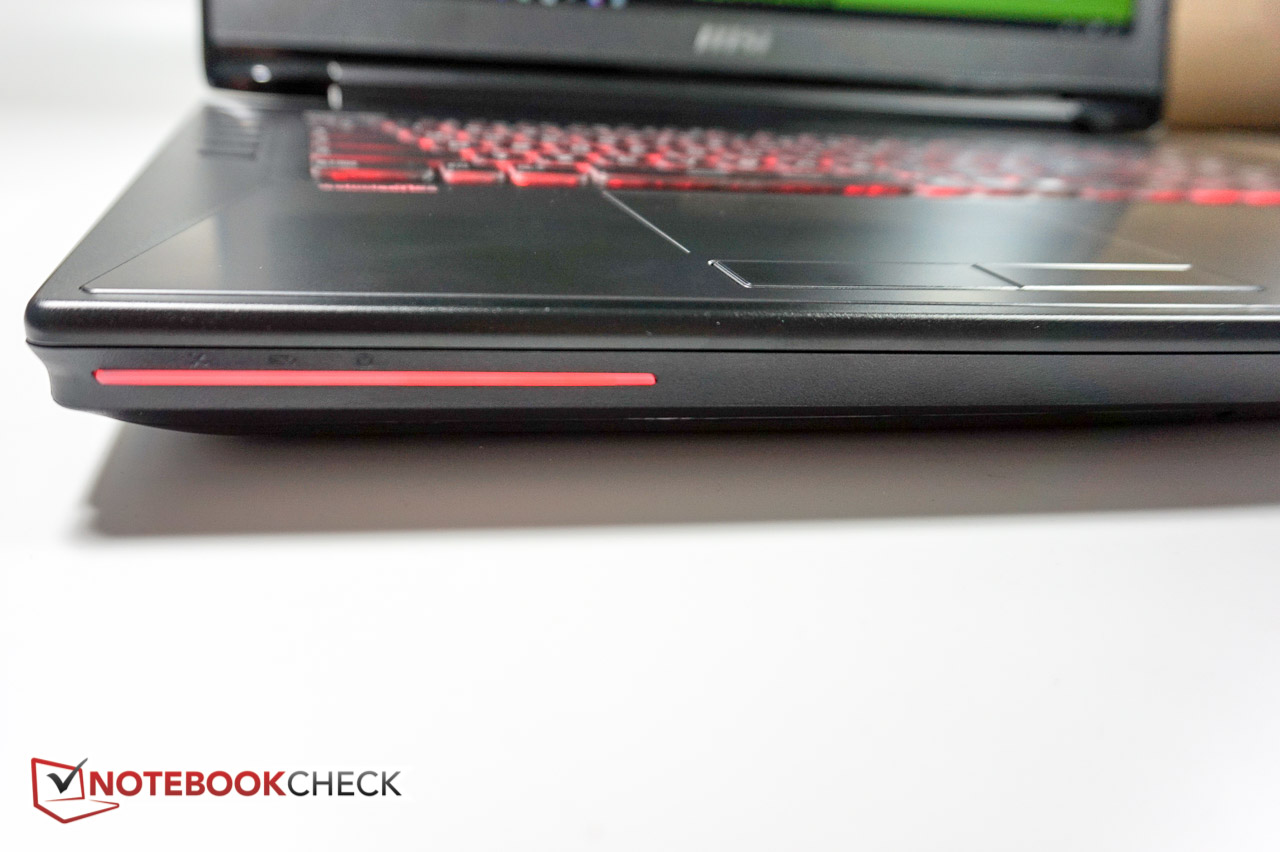
As noted, the case of the WT72 workstation-model mirrors the gaming-specific GT72-series. That said, the workstation is far from sleek with a thickness of almost 5 cm / 2 inches and a weight of 3.9 kg / 8.4 lbs. Of course, portability wasn't a design priority and most users will likely condemn the behemoth to desktop duty anyways. The massive, 230-watt power adapter alone weighs about 1 kg - close to the weight of some Ultrabooks. For a more detailed description of the case design, please take a look at our review of the GT72S 6QF
Connectivity
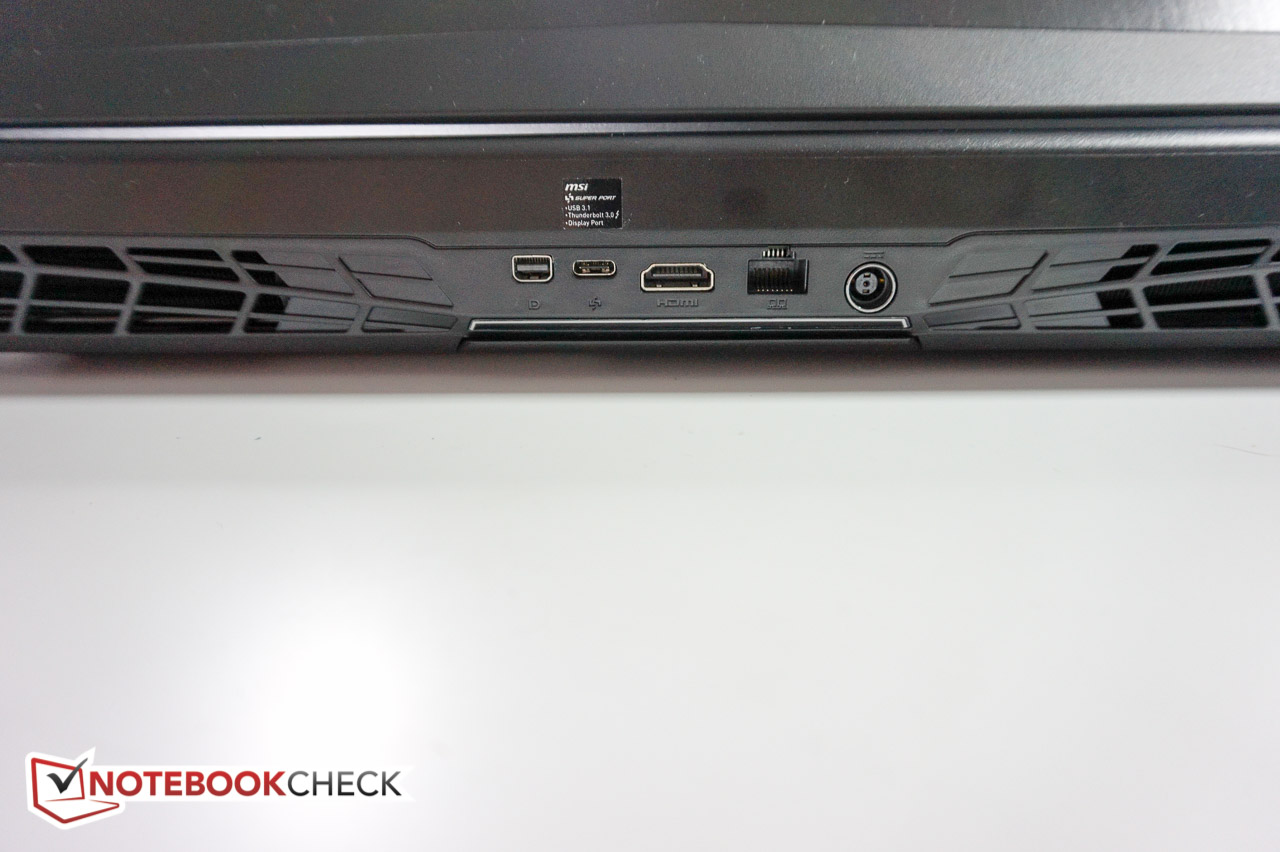
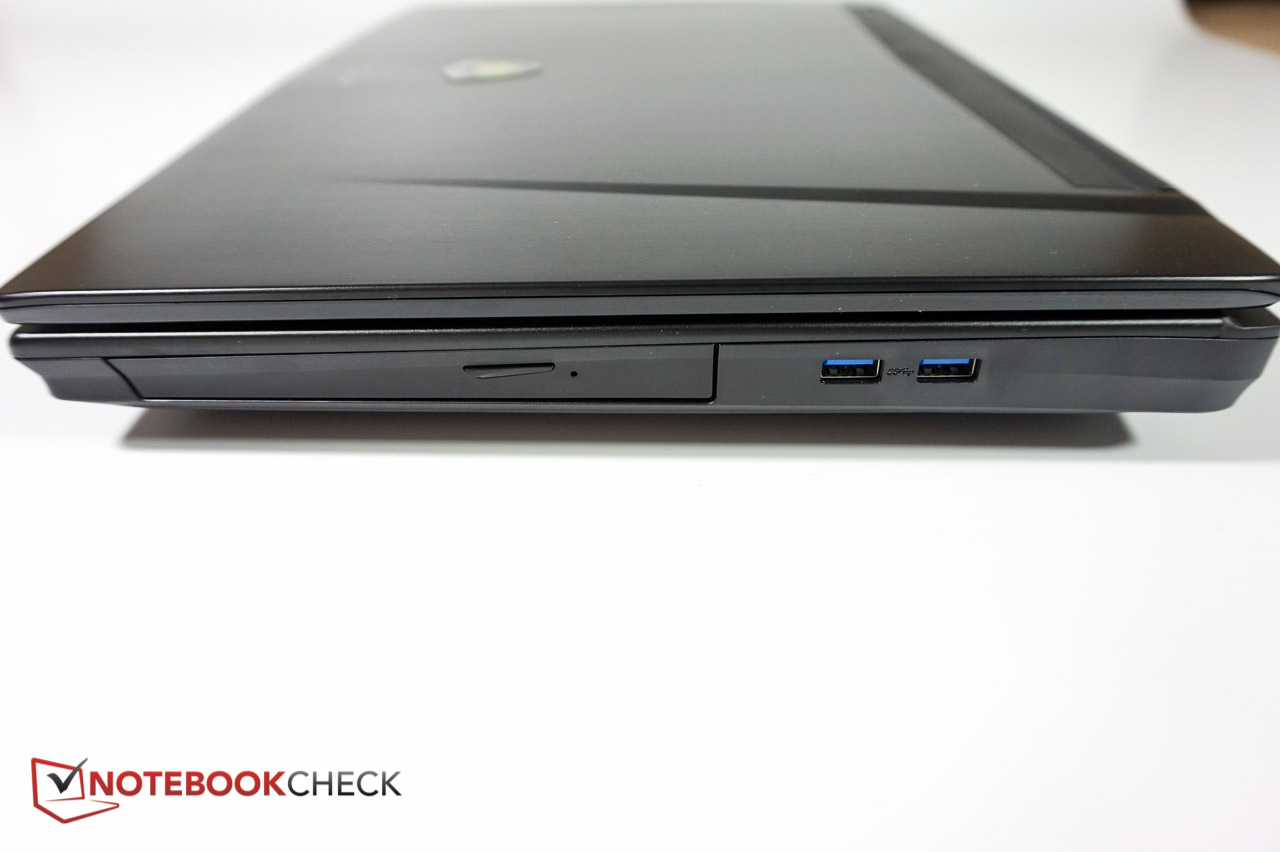
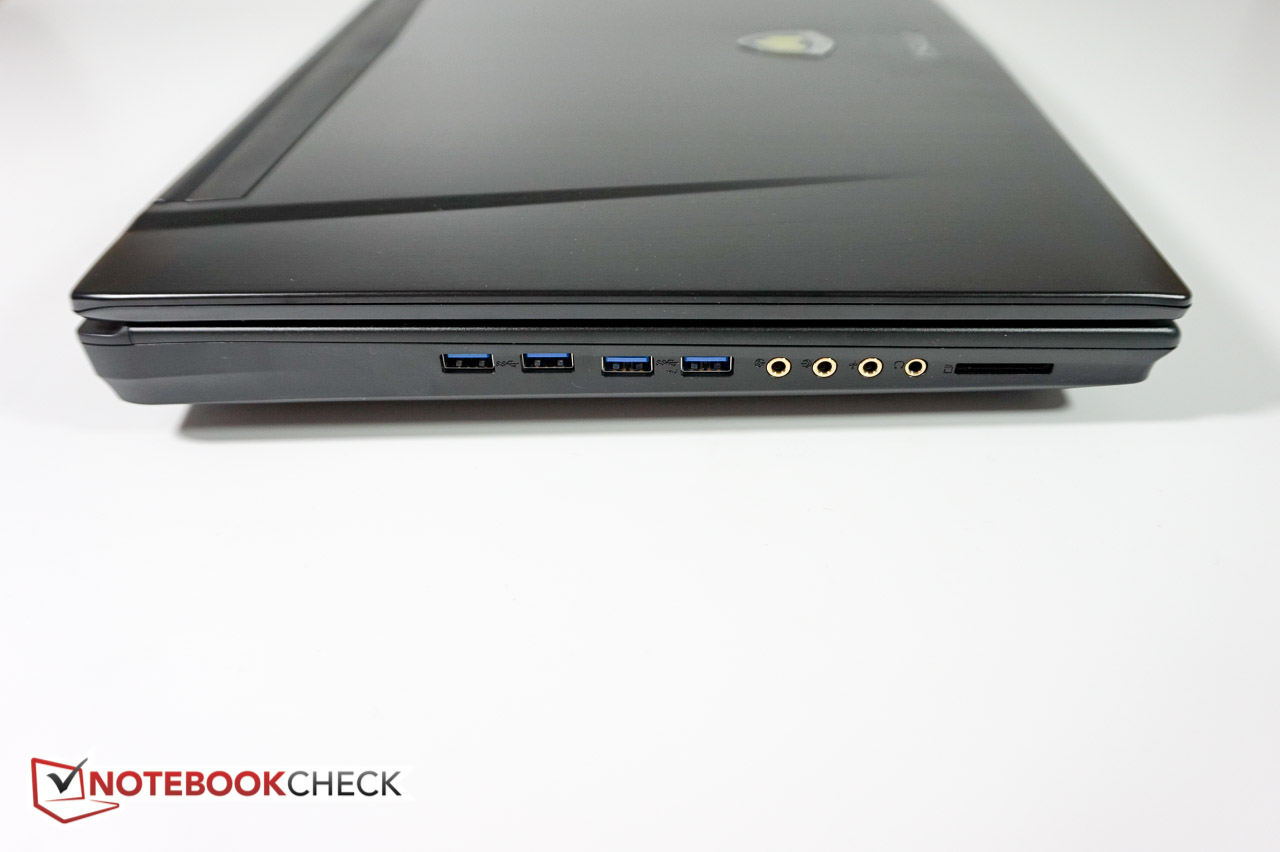
Compared to the predecessor, the updated workstation now includes one USB 3.1 Type-C Gen. 2 (Thunderbolt 3) in addition to the Mini DisplayPort 1.2 and HDMI 1.4.
Communication
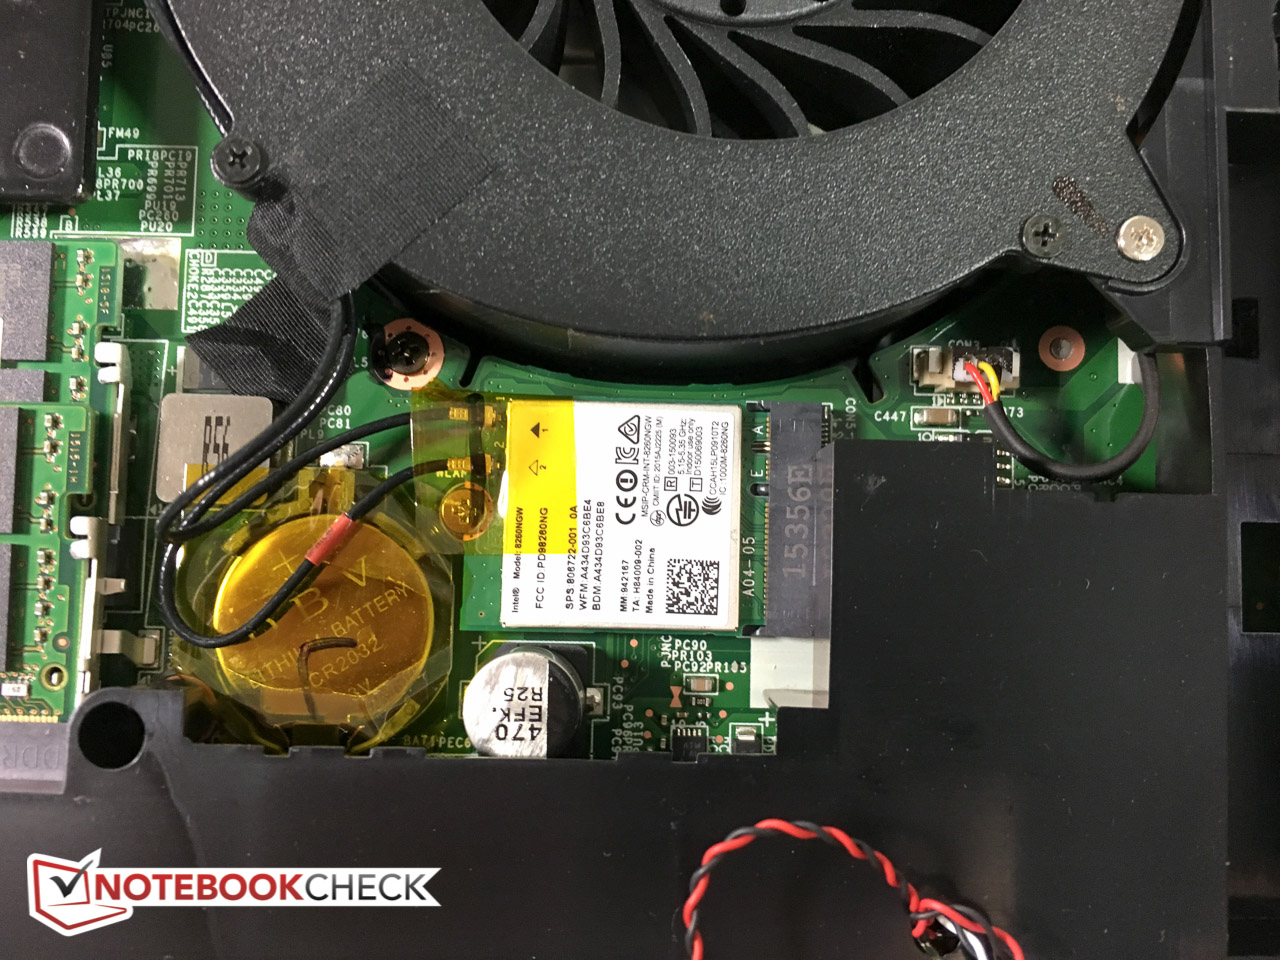
Physical connection is now courtesy of a Killer e2400 10/1000MBit instead of the previous e2200 network card. According to Killer, the new network card features "Advanced Stream Detect 2.0" and "up to 6 levels of application and website traffic prioritization". While important for gamers, it's unlikely that the intended audience would notice any difference in perceived speed. Instead of the Intel Dual Band Wireless-AC 7260, the review notebook now features the updated Intel 8260 Wireless-AC Combo (2x2). The big - or maybe not so big - news here is Bluetooth 4.2 support, which promises faster connectivity and better security.
Warranty
A major disappointment in our eyes is the warranty, as MSI now only offers a 2 year limited warranty (with 1 year global support). For a high-end machine costing $5000, we would have expected at least 3 years of protection, which is the de facto standard for workstations. MSI doesn't seem to offer an upgrade or extension themselves but instead refers to the original store of purchase or the distributor of the product.
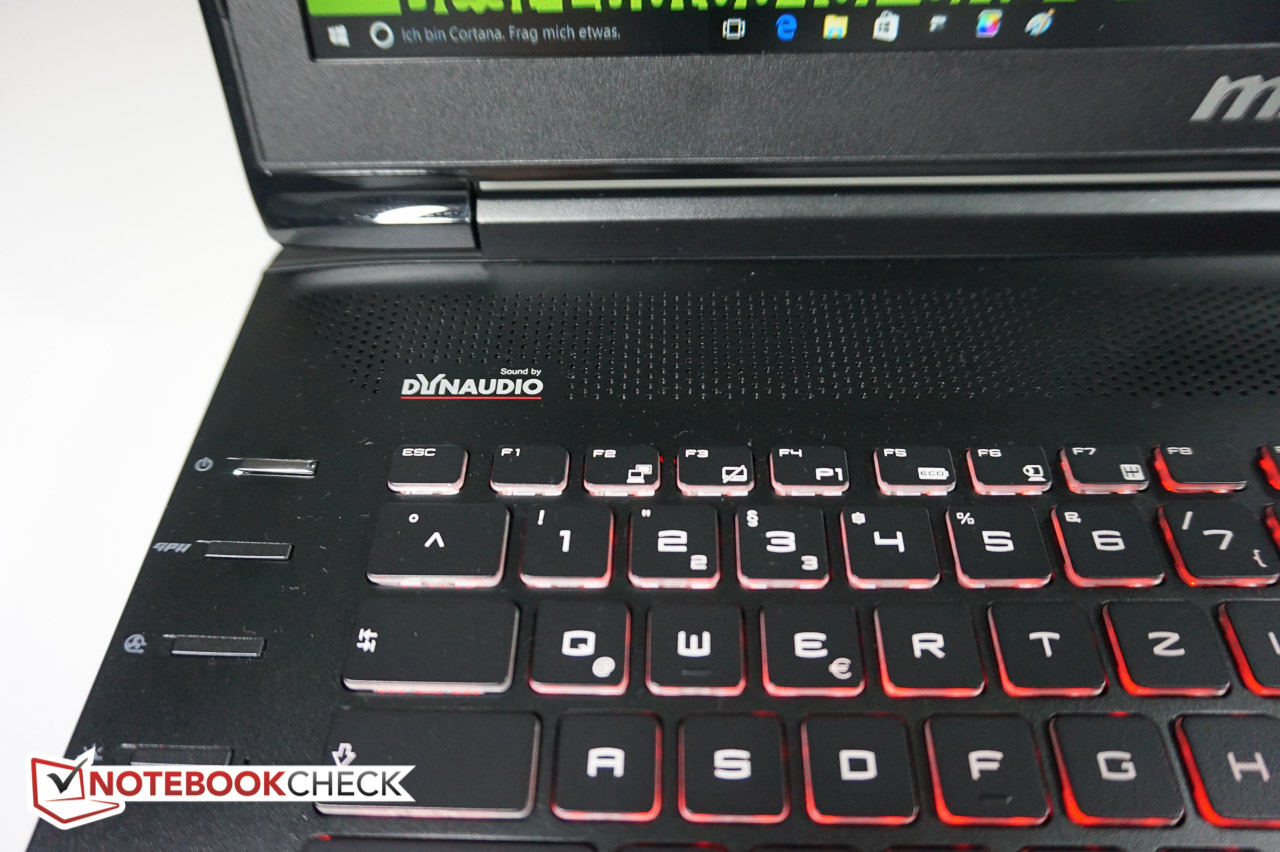
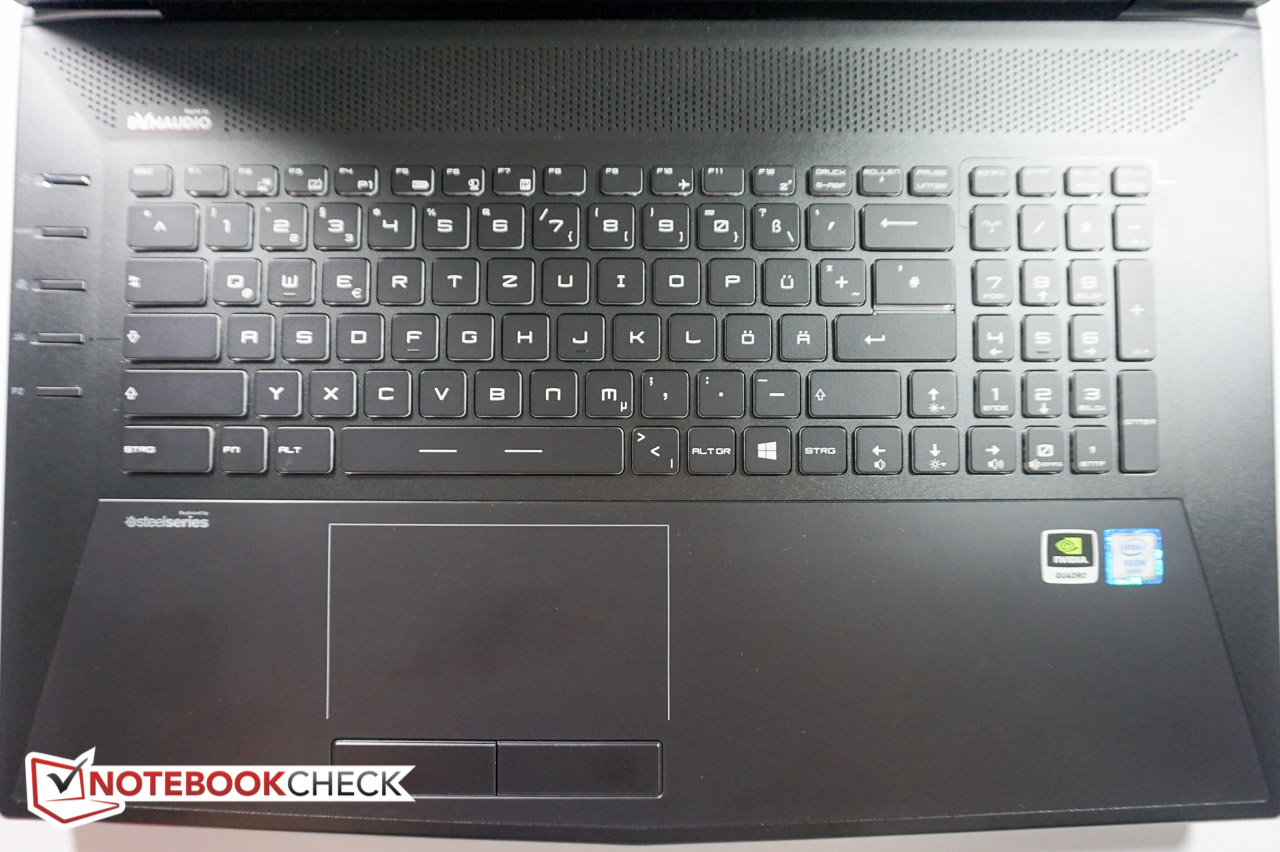
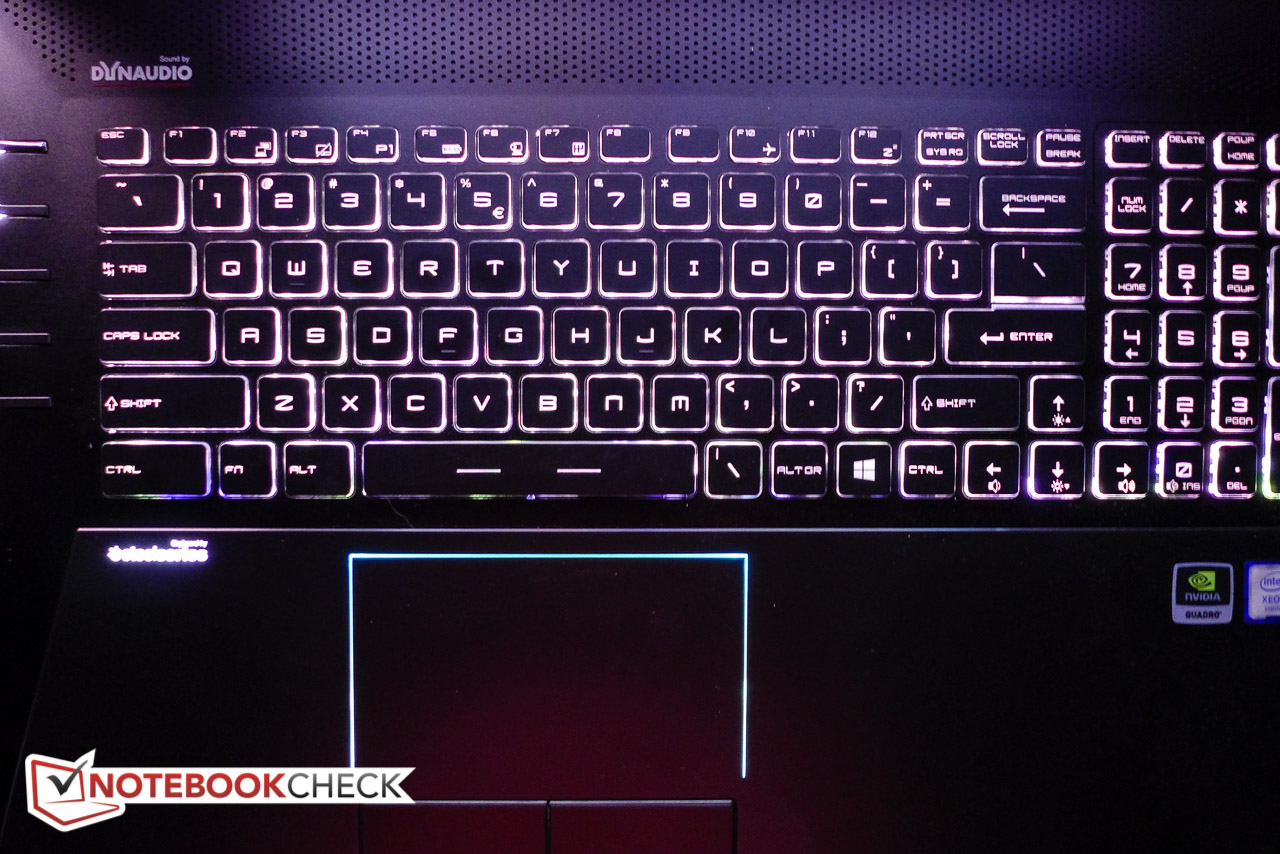
Input Devices
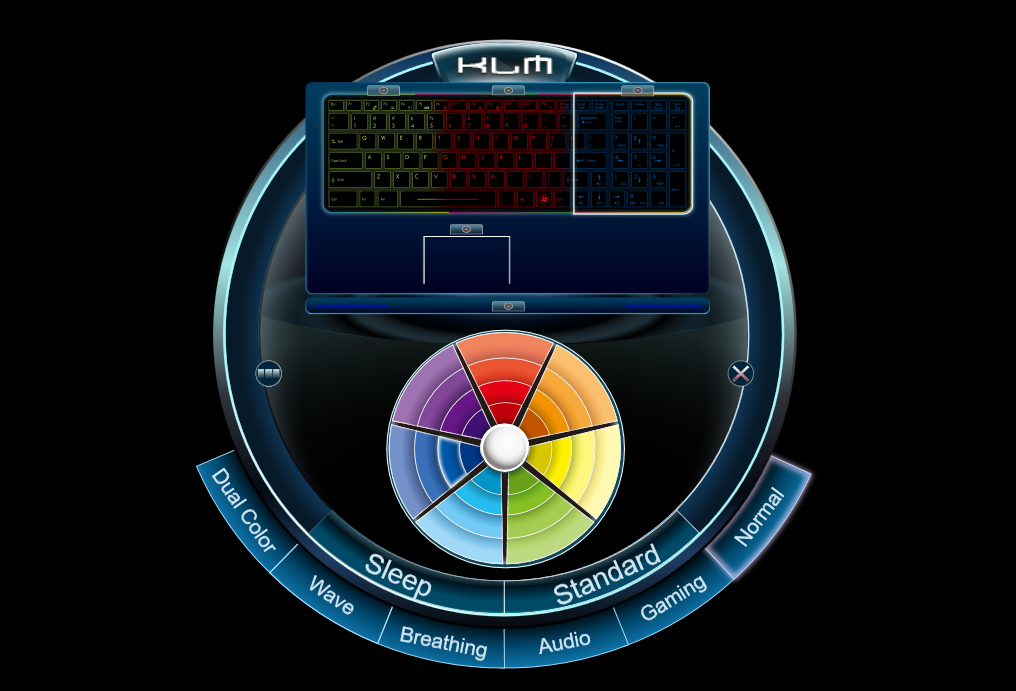
For details on the keyboard (which is part of MSI's "steelseries") and the touchpad, please check our reviews of the MSI GT72 and Xotic PC MSI GT72S 6QF. Our only comment here is regarding the keyboard backlight, which is a direct carry-over from the gaming series, complete with a rather colorful triple-zone layout. It's of course possible to choose a single - and for normal work more appropriate - color like white or light blue instead.
Display
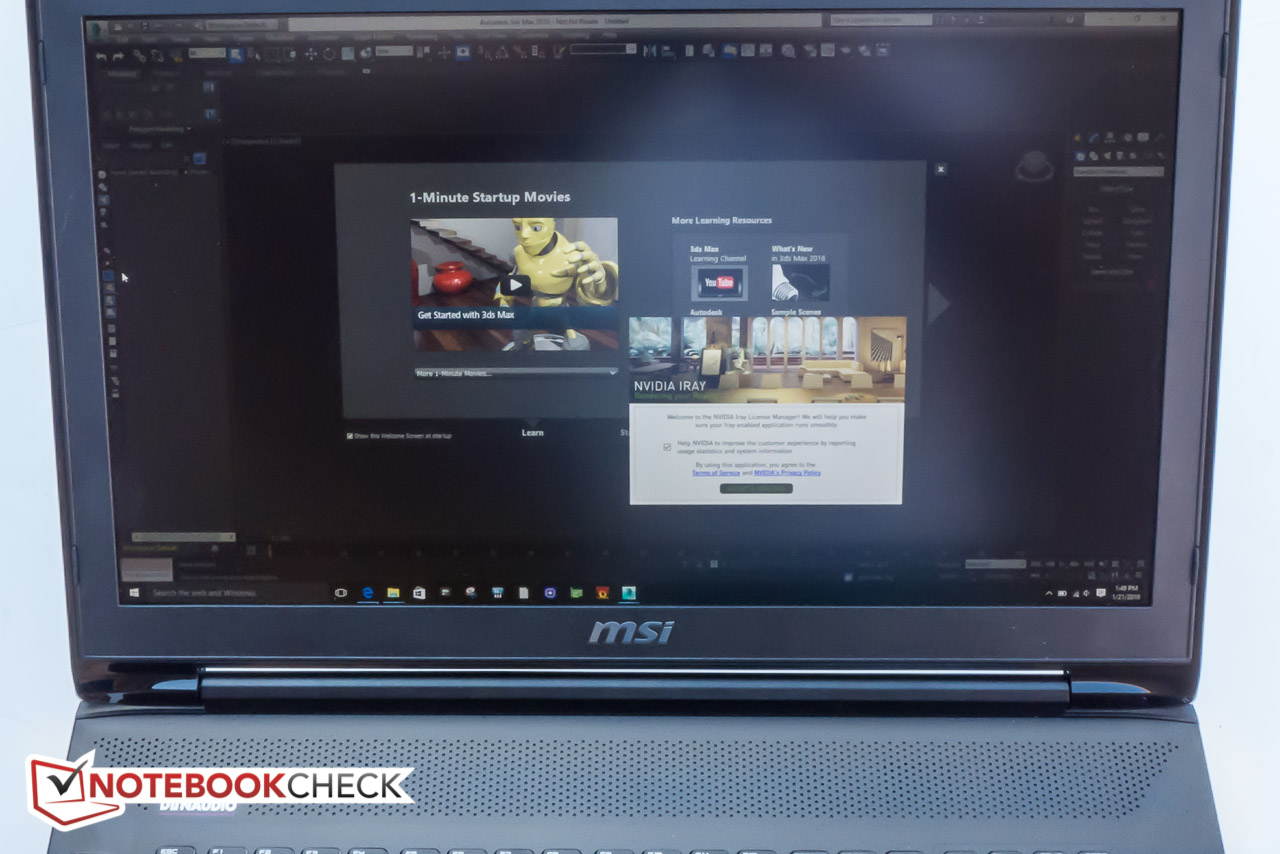
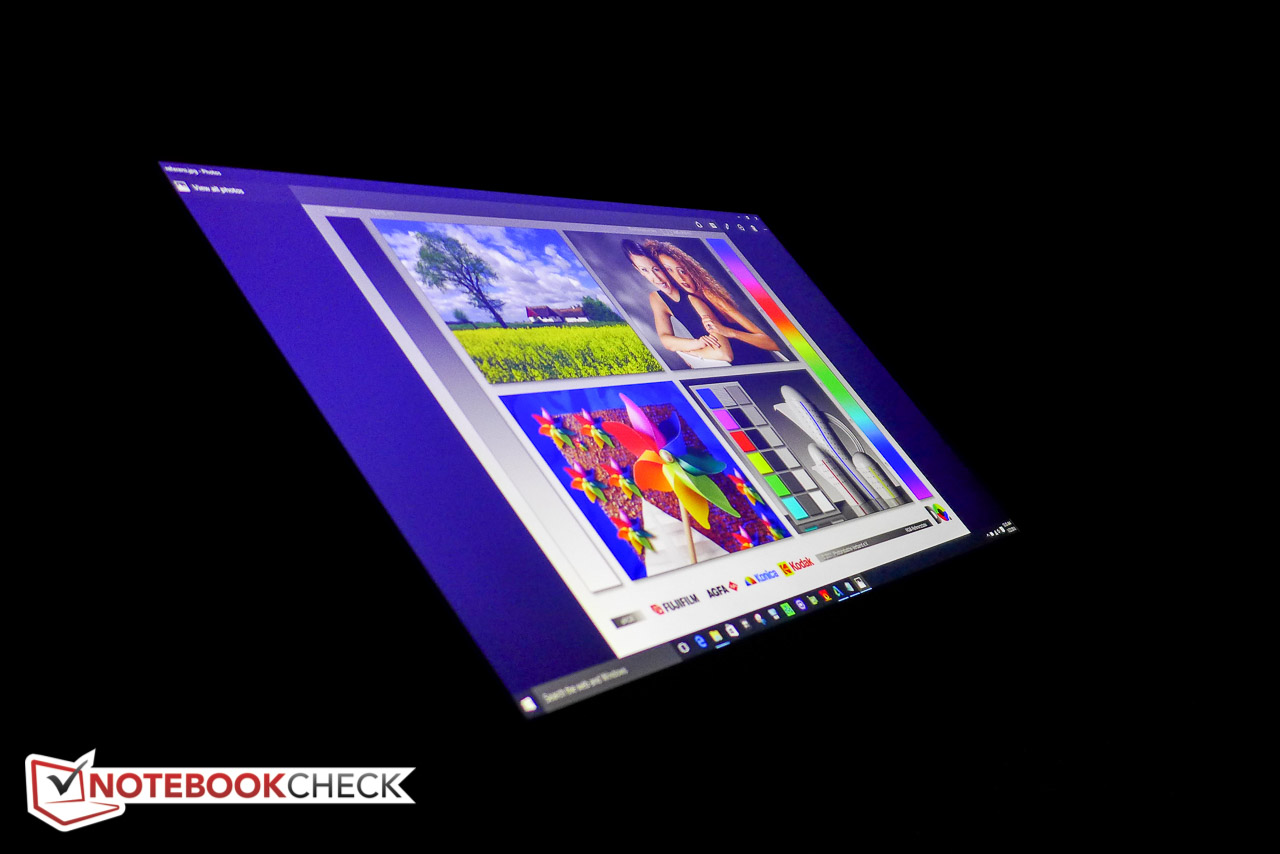
Once again, the IPS panel is courtesy of LG Philips (LP173WF4-SPF1). The average brightness of 300 nits is decent enough - especially since the display is non-glare and the workstation likely won't be used outdoors. The same exact panel in the Xotic PC MSI GT72S 6QF is about 25 nits brighter; competitors like the HP ZBook 17 G2 J8Z55ET with DreamColor display (310 nits) or the Bullman E-Klasse Xeon 17 (335 nits) either slightly exceed or - in case of the Dell Precision M6800 (250 nits) - trail our review unit. Unfortunately, higher-resolution 17-inch displays are not really available to this date, so the user needs to make do with a FHD-resolution of 1920 x 1080 pixels and a corresponding pixel density of 127 PPI. Text and graphics are still reasonably sharp, however - and the user has of course the option to hook up an external 4K display, if desired.
| |||||||||||||||||||||||||
Brightness Distribution: 94 %
Center on Battery: 301 cd/m²
Contrast: 659:1 (Black: 0.46 cd/m²)
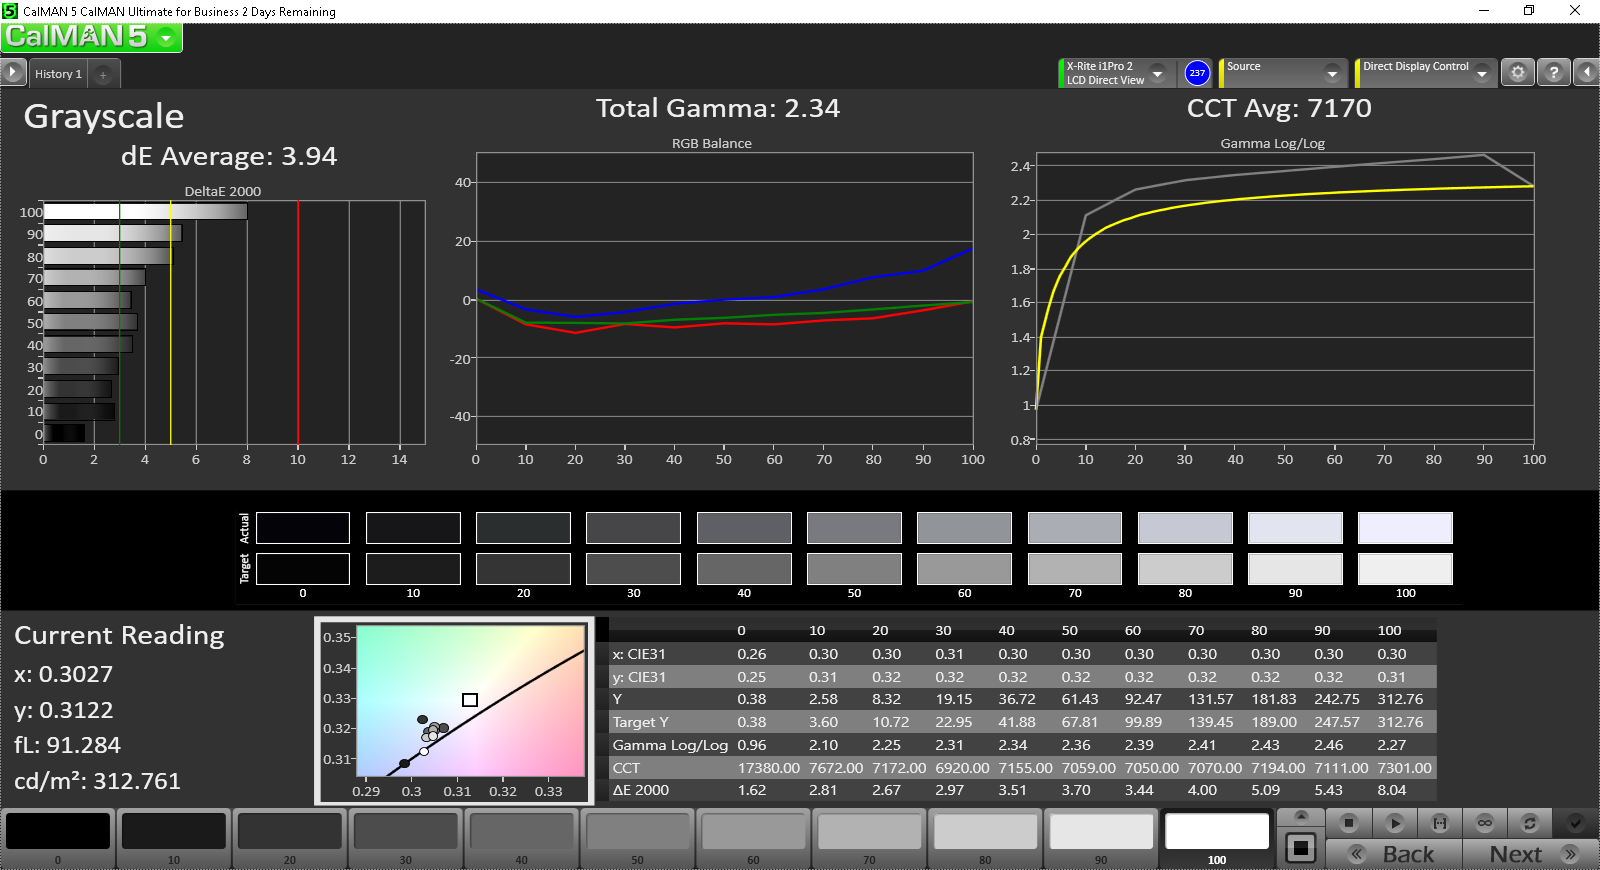
ΔE ColorChecker Calman: 5.77 | ∀{0.5-29.43 Ø4.72}
ΔE Greyscale Calman: 4.87 | ∀{0.09-98 Ø4.97}
85.27% sRGB (Argyll 1.6.3 3D)
56.04% AdobeRGB 1998 (Argyll 1.6.3 3D)
62.5% AdobeRGB 1998 (Argyll 3D)
85.4% sRGB (Argyll 3D)
67.3% Display P3 (Argyll 3D)
Gamma: 1.99
CCT: 7363 K
| MSI WT72-6QM 17.3", 1920x1080 | Bullman E-Klasse 5 17.3", 1920x1080 | Dell Precision M6800 17.3", 1920x1080 | HP ZBook 17 E9X11AA-ABA 17.3", 1920x1080 | Schenker XMG U705 17.3", 1920x1080 | Razer Blade Pro 17 inch 2015 17.3", 1920x1080 | Lenovo ThinkPad P70 17.3", 3840x2160 | |
|---|---|---|---|---|---|---|---|
| Display | -1% | 10% | 34% | -2% | 6% | 30% | |
| Display P3 Coverage (%) | 67.3 | 66.5 -1% | 71.8 7% | 85.7 27% | 66.3 -1% | 69.7 4% | 90.8 35% |
| sRGB Coverage (%) | 85.4 | 84.5 -1% | 95.8 12% | 100 17% | 83.4 -2% | 90.4 6% | 100 17% |
| AdobeRGB 1998 Coverage (%) | 62.5 | 61.8 -1% | 70.2 12% | 99.2 59% | 61 -2% | 66.8 7% | 85.4 37% |
| Response Times | -6% | ||||||
| Response Time Grey 50% / Grey 80% * (ms) | 42 ? | 44 ? -5% | |||||
| Response Time Black / White * (ms) | 26 ? | 27.6 ? -6% | |||||
| PWM Frequency (Hz) | 86 ? | 228 ? | |||||
| Screen | 14% | -39% | 29% | 14% | -45% | 15% | |
| Brightness middle (cd/m²) | 303 | 355 17% | 250 -17% | 320 6% | 333 10% | 315.5 4% | 365 20% |
| Brightness (cd/m²) | 298 | 335 12% | 247 -17% | 311 4% | 317 6% | 295 -1% | 341 14% |
| Brightness Distribution (%) | 94 | 89 -5% | 83 -12% | 88 -6% | 86 -9% | 87 -7% | 85 -10% |
| Black Level * (cd/m²) | 0.46 | 0.44 4% | 0.477 -4% | 0.359 22% | 0.3 35% | 0.822 -79% | 0.4 13% |
| Contrast (:1) | 659 | 807 22% | 524 -20% | 891 35% | 1110 68% | 384 -42% | 913 39% |
| Colorchecker dE 2000 * | 5.77 | 3.73 35% | 11.4 -98% | 2.04 65% | 5.24 9% | 12.21 -112% | 3.8 34% |
| Greyscale dE 2000 * | 4.87 | 2.84 42% | 12.97 -166% | 2.45 50% | 4.33 11% | 13.4 -175% | 6.09 -25% |
| Gamma | 1.99 111% | 2.12 104% | 2.65 83% | 2.28 96% | 2.14 103% | 2.39 92% | 2.3 96% |
| CCT | 7363 88% | 6457 101% | 18595 35% | 6518 100% | 6437 101% | 19530 33% | 6332 103% |
| Color Space (Percent of AdobeRGB 1998) (%) | 56.04 | 55.45 -1% | 68 21% | 93 66% | 55 -2% | 59 5% | 76.01 36% |
| Color Space (Percent of sRGB) (%) | 85.27 | 84.39 -1% | 100 17% | 83.3 -2% | 90.3 6% | 99.97 17% | |
| Total Average (Program / Settings) | 7% /
10% | -15% /
-26% | 32% /
30% | 6% /
10% | -20% /
-32% | 13% /
15% |
* ... smaller is better
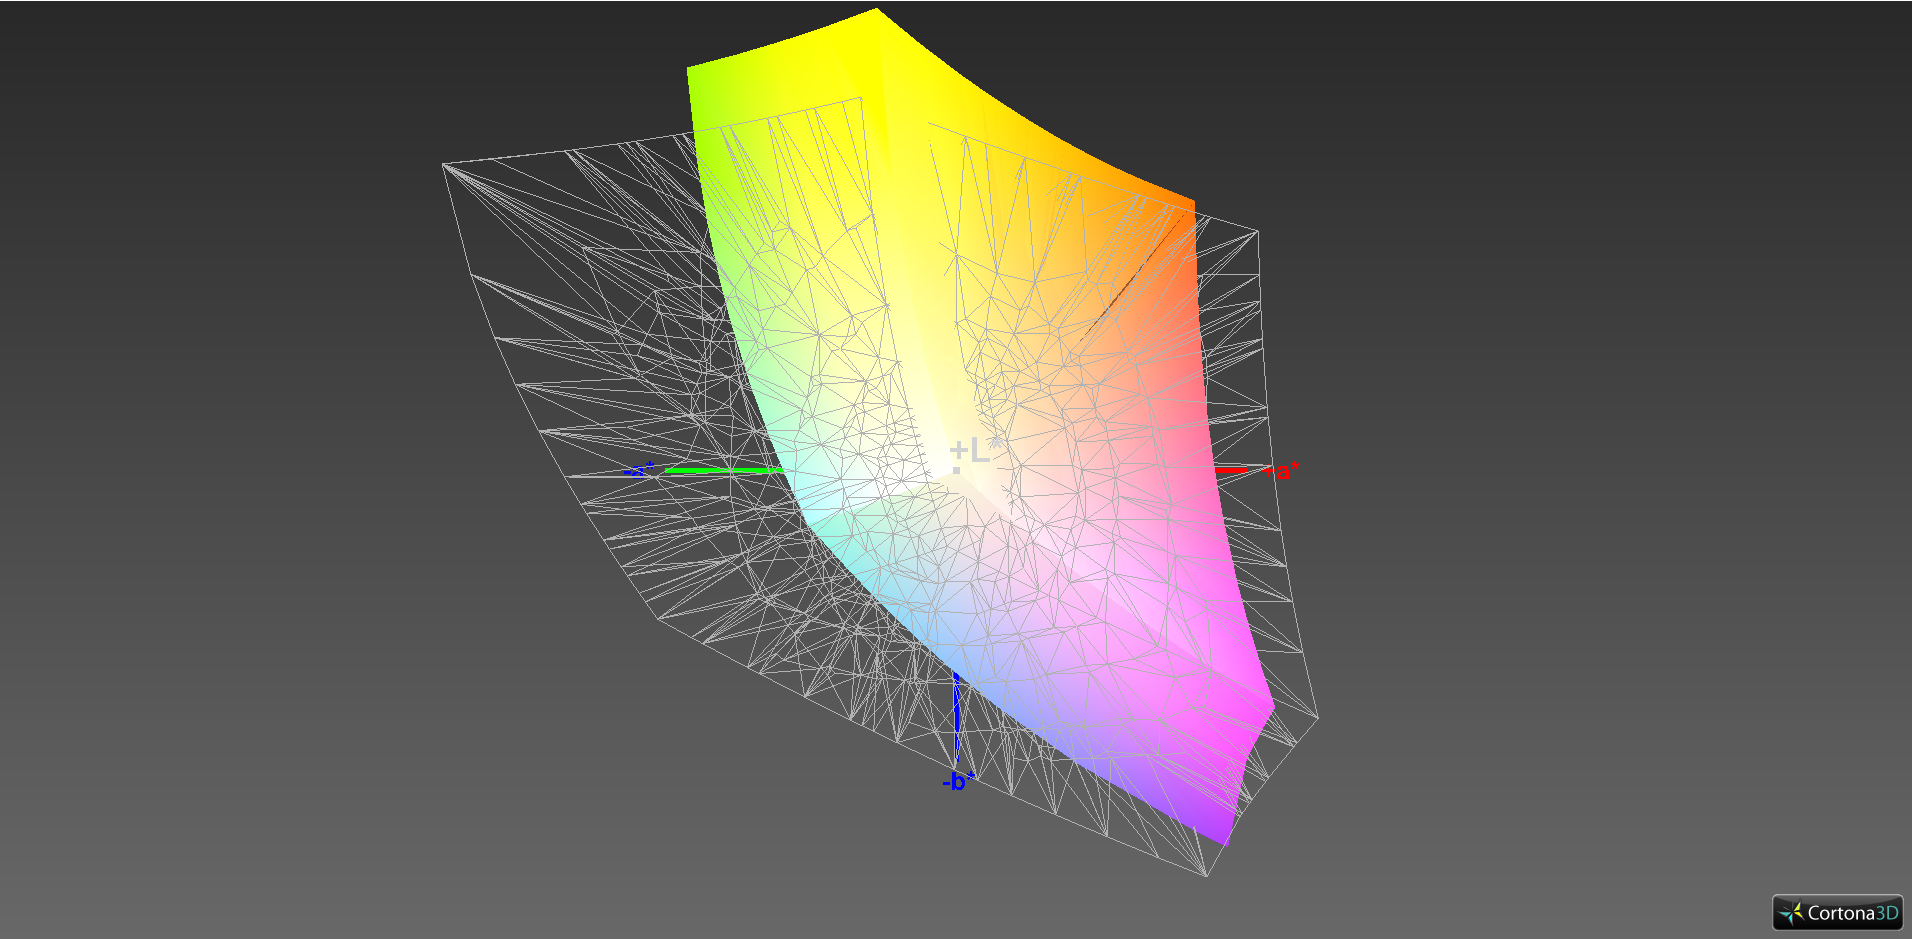
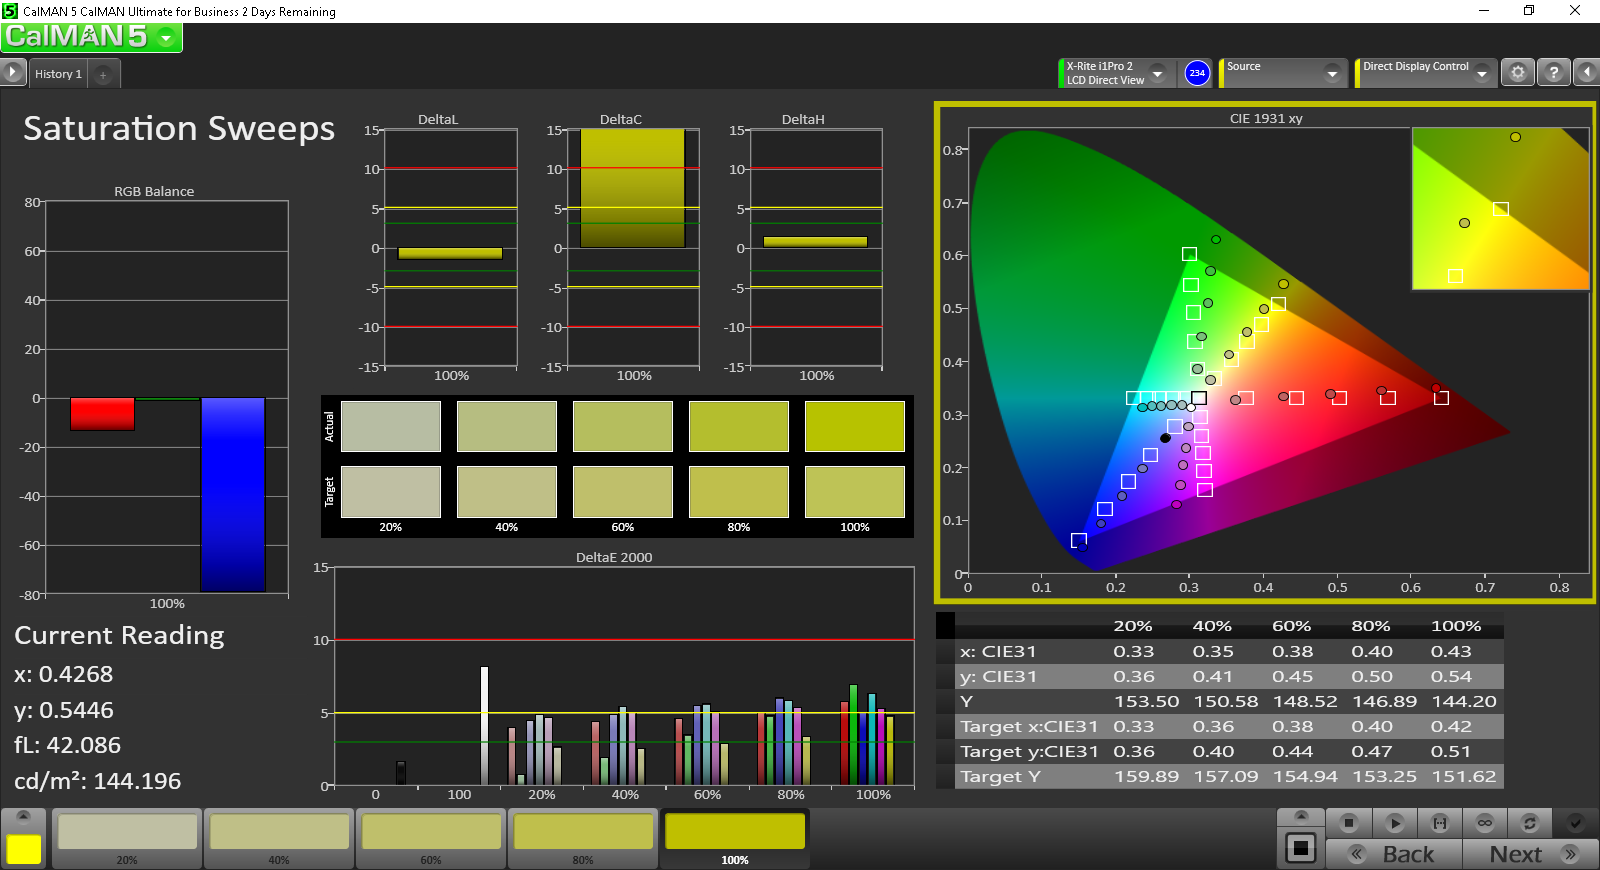
With a color space coverage of about 56 % for AdobeRGB and 85 % for sRGB, the workstation performs similar to the other notebooks with the same panel. HP's DreamColor-display is significantly better and offers AdobeRGB coverage of about 93 %. Given the price point, we would expect better coverage of the professional color spaces, although for CAD work the about average performance certainly isn't a deal-breaker.

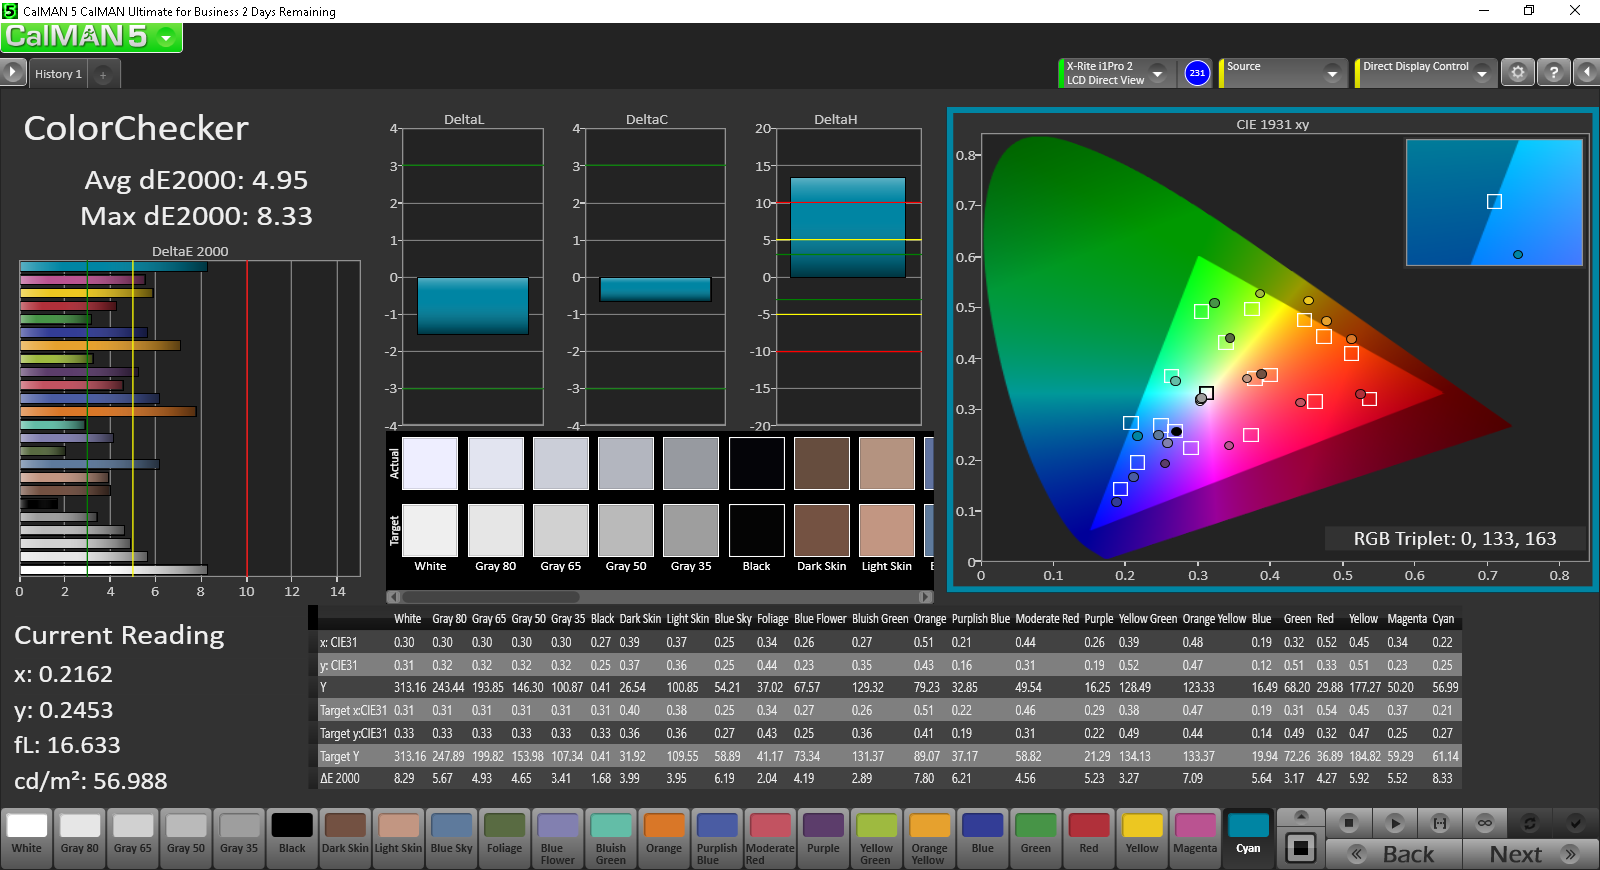
We had issues generating an ICC profile on our US machine even with the latest version of the iProfiler software. At this point, we don't know the cause - maybe we had a conflict with the pre-installed MSI TrueColor software. Fortunately, our colleagues in Germany were able to supply one and we have included the ICC profile in the graphic above (showing the brightness measured across nine quadrants). The Colorchecker, Grayscale and Saturation files included below are from the US model and differ slightly from the German notebook (the pre-calibration Colorchecker DeltaE-value, for example, was 4.95 for the workstation in the US and 5.78 for the German test sample). Since both workstations are equipped with the same panel, we are probably just looking at the normal variation we encounter quite frequently even when dealing with supposedly identical panels.
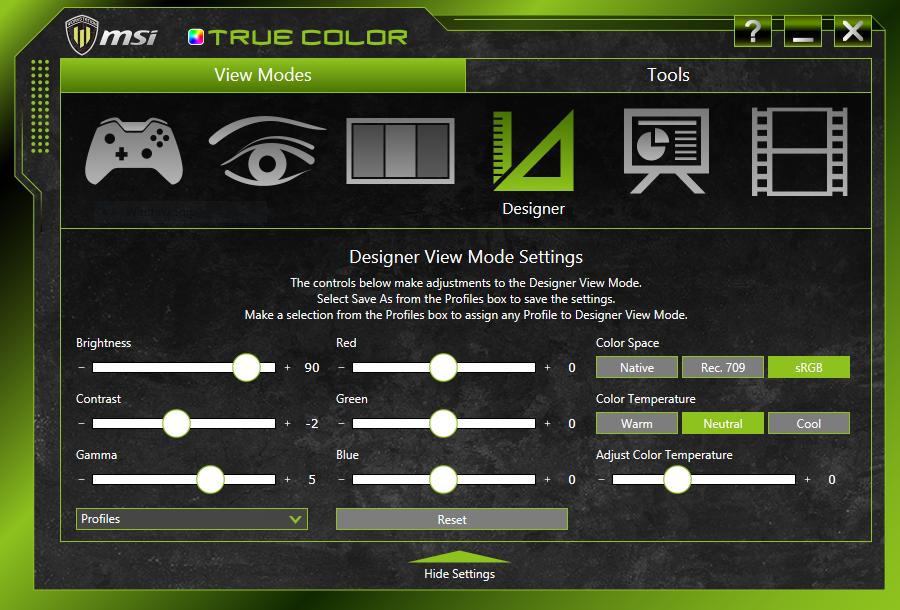
Our check with the X-Rite spectrophotometer shows decent enough colors even with the panel not calibrated. Typical for MSI is the "True Color" tool, which allows the user to adjust the color temperature, brightness, gamma, and specific RGB values, among others. There's even an "anti-blue" mode for different settings (reading, office, browsing, multimedia).
Thanks to the decent brightness and non-glare display, the WT72 can be used outdoors or in brighter environments. The panel is not quite bright enough to overcome direct sunlight, but working in the shade is possible. That said, we find it pretty unlikely that anybody would use a workstation of this caliber away from outlets - especially considering that the battery life will be a limiting factor fairly quickly when the work load is high. Thanks to the IPS technology, the viewing angle stability is high and the screen remains visible even at very shallow angles.
Display Response Times
| ↔ Response Time Black to White | ||
|---|---|---|
| 26 ms ... rise ↗ and fall ↘ combined | ↗ 7 ms rise | 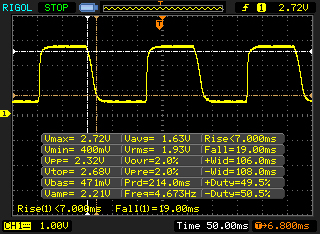 |
| ↘ 19 ms fall | ||
| The screen shows relatively slow response rates in our tests and may be too slow for gamers. In comparison, all tested devices range from 0.1 (minimum) to 240 (maximum) ms. » 63 % of all devices are better. This means that the measured response time is worse than the average of all tested devices (19.8 ms). | ||
| ↔ Response Time 50% Grey to 80% Grey | ||
| 42 ms ... rise ↗ and fall ↘ combined | ↗ 13 ms rise | 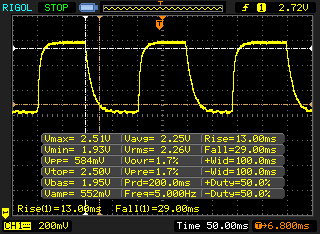 |
| ↘ 29 ms fall | ||
| The screen shows slow response rates in our tests and will be unsatisfactory for gamers. In comparison, all tested devices range from 0.165 (minimum) to 636 (maximum) ms. » 67 % of all devices are better. This means that the measured response time is worse than the average of all tested devices (31 ms). | ||
Screen Flickering / PWM (Pulse-Width Modulation)
| Screen flickering / PWM detected | 86 Hz | ≤ 10 % brightness setting | 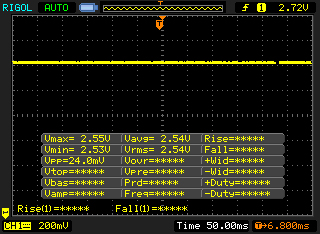 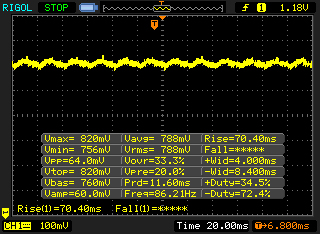 |
| ≤ 15 cd/m² brightness | |||
The display backlight flickers at 86 Hz (worst case, e.g., utilizing PWM) Flickering detected at a brightness setting of 10 % (15 cd/m²) and below. There should be no flickering or PWM above this brightness setting. The frequency of 86 Hz is very low, so the flickering may cause eyestrain and headaches after extended use. As the flickering occurs only on very low brightness settings, it should not be an issue in typical office settings. Nonetheless, use in low light conditions may be straining to the eyes. In comparison: 52 % of all tested devices do not use PWM to dim the display. If PWM was detected, an average of 7747 (minimum: 5 - maximum: 343500) Hz was measured. | |||
Performance
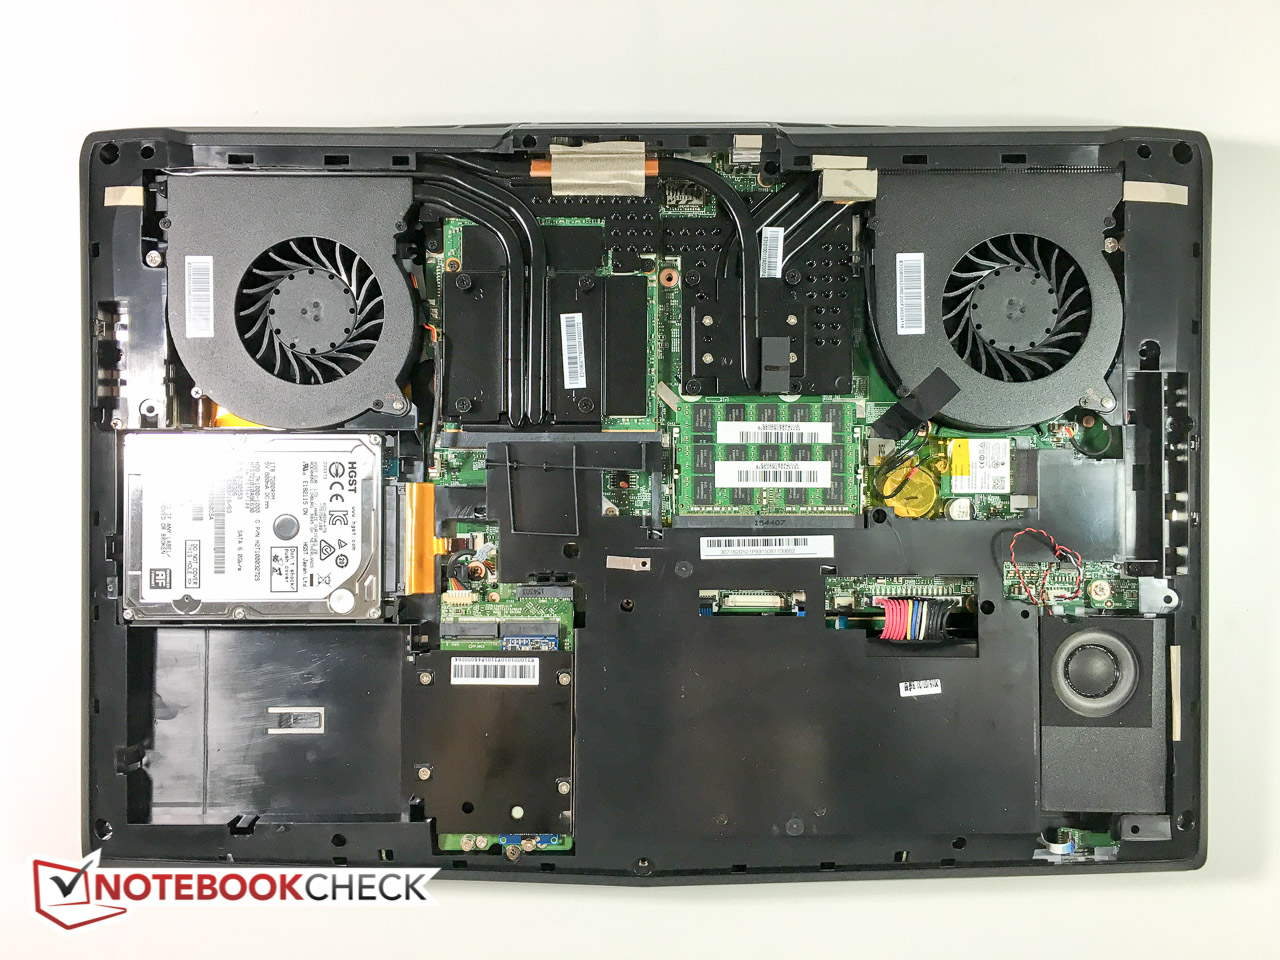
Our review workstation comes equipped with a 6th-generation Intel Xeon E3-1505 processor, 32 GB of ECC DDR4 2133 MHz RAM (64 GB maximum), 2x 128 GB SSD in a RAID 0 array, and an NVIDIA Quadro M5000M GPU. As we mentioned in our introduction, our version is the top-of-the-line model. All in all, MSI lists two workstations with Xeon E3-1505 CPU, four with 6th-generation Intel Core i7-6700HQ CPU, and three models with 4th-generation Intel Core i7-4720HQ CPU. None of the models are a bargain, with the lowest-cost model (WT72 6QI-654US with i7-6700HQ, 128GB M.2 SATA + 1TB HDD, 16 GB of RAM, and NVIDIA Quadro M1000M) starting at $1900. Our review notebook costs a whopping $5000.
Processor
The Intel Xeon E3-1505, which the WT72 is equipped with, is a Skylake-generation and very high-end quad-core processor specifically designed for workstation notebooks. Aside from additional management features, this processor also supports ECC memory, which is something the Core i7 CPUs lack. Hyper-Threading is of course enabled and the four cores operate at frequencies from 2.8 - 3.7 GHz (4 cores: max. 3.3 GHz, 2 cores: max. 3.5 GHz). Although workstations make use of discrete graphics, the E3-1505 also features an integrated HD Graphics P530 GPU. With a TDP of 45 watts, the CPU is best suited for larger chassis with adequate cooling fan systems.
Compared to the workstation predecessor, which came equipped with the (also very high-end) Intel Core i7 4710MQ, the new model with E3-1501 offers a performance plus of up to 6 % according to Cinebench. The Bullman E-Klasse Xeon 17 (Clevo P771ZM) comes with an Intel Core i7-4790K - a desktop processor with a TDP of 88 watts - and outperforms the WT72 6QM-423US by roughly 11 % (single) and 17 % (multi) according to Cinebench R15. Still: under normal conditions, it's next to impossible to tap the full potential of the CPU.
| Cinebench R11.5 | |
| CPU Single 64Bit (sort by value) | |
| MSI WT72-6QM | |
| HP ZBook 17 G2 J8Z55ET | |
| Bullman E-Klasse 5 | |
| Dell Precision M6800 | |
| CPU Multi 64Bit (sort by value) | |
| MSI WT72-6QM | |
| HP ZBook 17 G2 J8Z55ET | |
| Bullman E-Klasse 5 | |
| Dell Precision M6800 | |
| Cinebench R15 | |
| CPU Single 64Bit (sort by value) | |
| MSI WT72-6QM | |
| HP ZBook 17 G2 J8Z55ET | |
| Bullman E-Klasse 5 | |
| Dell Precision M6800 | |
| CPU Multi 64Bit (sort by value) | |
| MSI WT72-6QM | |
| HP ZBook 17 G2 J8Z55ET | |
| Bullman E-Klasse 5 | |
| Dell Precision M6800 | |
| Super Pi Mod 1.5 XS 32M - 32M (sort by value) | |
| MSI WT72-6QM | |
| Dell Precision M6800 | |
* ... smaller is better
System Performance
As expected at this price point, the overall system performance is very high with a PCMark 7 score of 6657 points. The GT72S is faster still with 7163 points (+ 7.5 %) - presumably because of the better storage sub-scores. The PCMark 8 scores are not too shabby, either, with the WT72 6QM-423US besting the predecessor pretty handily (Work score of 5655 vs. 4997 points, to give an example). The Bullman E-class system (i7-4790K, Quadro K3100M, 32 GB of RAM, 256 GB Samsung SSD) doesn't score quite as well with 5372 points, although the difference isn't worth getting excited about (- 5 %).
| PCMark 7 Score | 6657 points | |
| PCMark 8 Home Score Accelerated v2 | 4731 points | |
| PCMark 8 Work Score Accelerated v2 | 5655 points | |
Help | ||
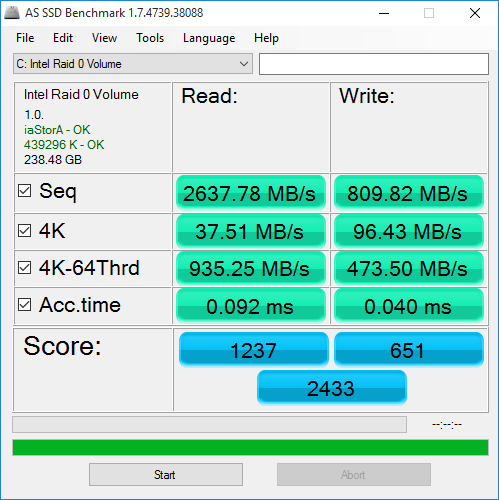
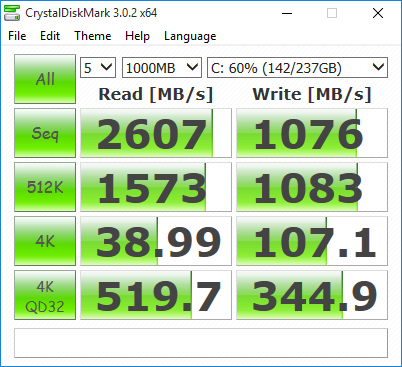
Storage Devices
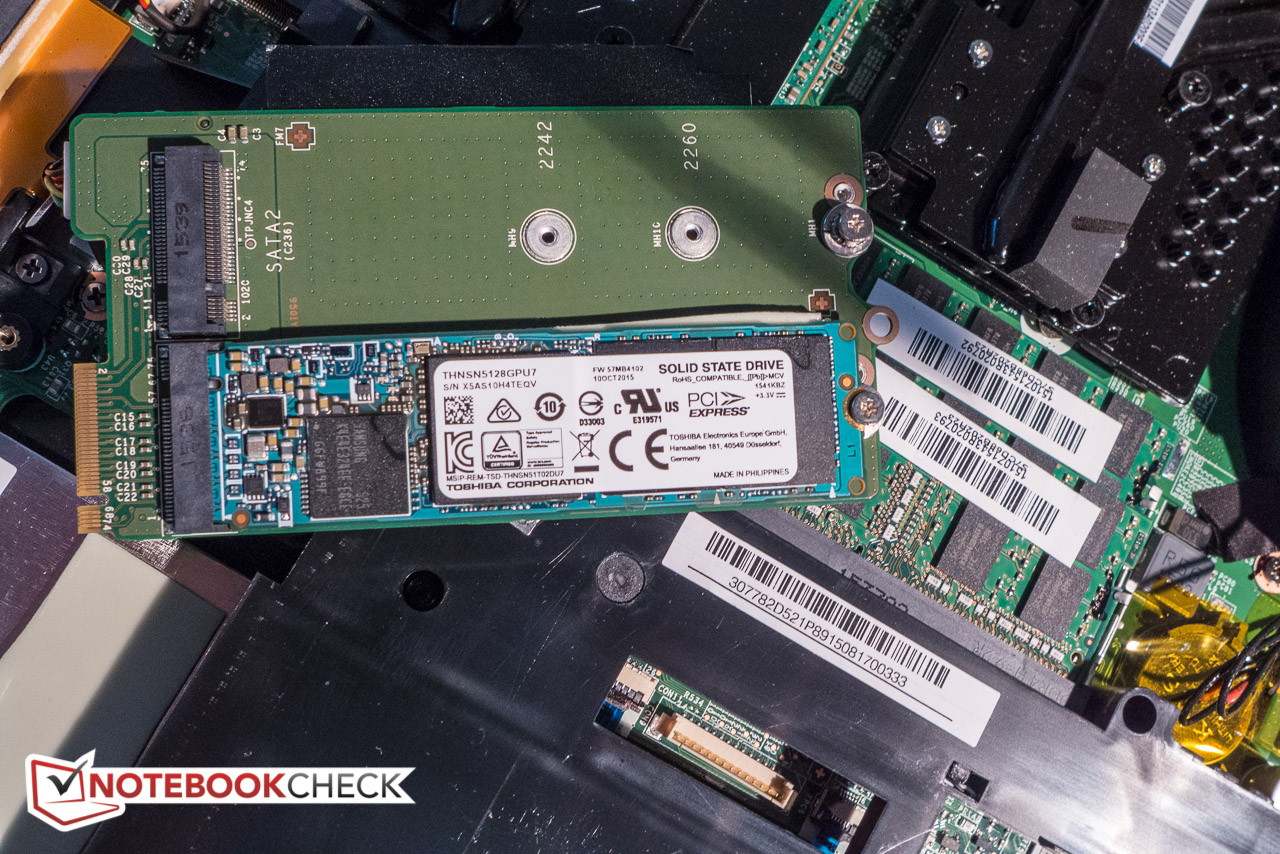
Our review workstation is equipped with 2x 128 GB (two slots of four occupied) Toshiba-branded NVMe cards - model number THNSN5128GPU7 - in a RAID 0 configuration. While the read and write speeds are blisteringly fast - AS SSD reported speeds of 2638 MB/s and 810 MB/s, respectively - one could argue that the risk is also increased: a single card failure does not just necessitate a replacement of the drive, but also a full system restore. Regular backups are therefore absolutely crucial. The predecessor, which was equipped with 4x Toshiba HG6 THNSNJ256G8NU M.2 drives (also RAID 0) had slower reads (1523 MB/s), but faster writes (1143 MB/s) ; the gaming rig GT72S 6QF, which also houses 4x 256 GB, closely matches the read performance as well, but the writes are faster by about 55 %. We don't think that the speed difference will be noticeable at all as all of the machines mentioned are significantly faster than any consumer-grade notebook equipped with a "normal" SSDs. The lower-end HP ZBook 17 G2 we've reviewed comes with a single platter-based drive and doesn't compare at all.
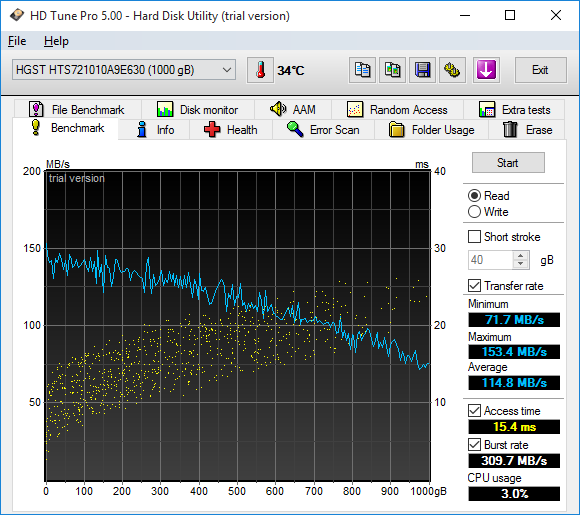
Our system also shipped with a conventional hard drive courtesy of HGST. The SATA drive has a capacity of 1 TB and a rotational speed of 7200 RPM is quite fast as well, with HD Tune attesting an average speed of 115 MB/s and an access time of just above 15 ms.

GPU Performance
The NVIDIA Quadro M5000M is a very capable and high-end, DirectX 12 and OpenGL 4.5 compatible GPU. The drivers are certified and optimized to be stable in professional CAD and 3D applications. The graphics chip comes with 1536 shader cores and can access 8 GB of GDDR5 RAM via a 256-bit pipeline. The processor-integrated HD Graphics P530 GPU is neither permanently disabled nor utilized automatically via Optimus, but rather requires the user to press the dedicated GPU button on the left-hand side of the keyboard. After a subsequent reboot, which takes about 35 seconds, the discrete GPU is disabled and the P530 takes over. While a bit cumbersome, the system works very reliably.
According to the 3DMark benchmark tests, the Quadro M5000M outperforms the older Kepler-based Quadro K4100 in the predecessor - sometimes by a substantial margin. Case in point: 7980 points vs. 3580 points for the DirectX 11-specific Fire Strike Standard test. The difference are much smaller when we take a look at other, Maxwell-based mainstream high-end GPUs like the GTX 980, which was almost 40 % faster in the same test.
| 3DMark 11 - 1280x720 Performance (sort by value) | |
| MSI WT72-6QM | |
| HP ZBook 17 G2 J8Z55ET | |
| Bullman E-Klasse 5 | |
| Dell Precision M6800 | |
| MSI GT72S 6QF | |
| 3DMark | |
| 1920x1080 Fire Strike Score (sort by value) | |
| MSI WT72-6QM | |
| MSI WT72-2OL32SR311BW | |
| HP ZBook 17 G2 J8Z55ET | |
| Bullman E-Klasse 5 | |
| Dell Precision M6800 | |
| MSI GT72S 6QF | |
| 1280x720 Cloud Gate Standard Score (sort by value) | |
| MSI WT72-6QM | |
| MSI WT72-2OL32SR311BW | |
| HP ZBook 17 G2 J8Z55ET | |
| Bullman E-Klasse 5 | |
| Dell Precision M6800 | |
| MSI GT72S 6QF | |
| 1280x720 Ice Storm Standard Score (sort by value) | |
| MSI WT72-6QM | |
| MSI WT72-2OL32SR311BW | |
| HP ZBook 17 G2 J8Z55ET | |
| Bullman E-Klasse 5 | |
| Dell Precision M6800 | |
| MSI GT72S 6QF | |
| 3DMark 06 Standard Score | 29317 points | |
| 3DMark 11 Performance | 11110 points | |
| 3DMark Ice Storm Standard Score | 137273 points | |
| 3DMark Cloud Gate Standard Score | 22786 points | |
| 3DMark Fire Strike Score | 7979 points | |
| 3DMark Fire Strike Extreme Score | 4205 points | |
Help | ||
SPECviewperf
We use the benchmarks SPECviewperf 11 and 12 to test the GPU performance with different professional 3D applications. SPECviewperf 11 uses OpenGL exclusively, while SPECviewperf 12 test the performance of both OpenGL and Direct X application programming interfaces. Both benchmarks make use of the graphics content and behavior from actual applications. The results are overall impressive, but the Quadro M5000M only clearly pulls ahead of the Quadro K4100 in the SPECviewperf 12 tests. The SPECviewperf 11 results are much less convincing, with the M5000M slightly ahead overall, but trailing slightly in some sub-tests. It is also surprising that AMD's FirePro M6100 - which was released mid 2013 - can still outperform the Quadro in Lightwave and Maya. As the different tests show, it crucial to know exactly what program(s) the workstation will run, as the differences can be pretty significant.
| SPECviewperf 12 | |
| 1900x1060 Solidworks (sw-03) (sort by value) | |
| MSI WT72-6QM | |
| MSI WT72-2OL32SR311BW | |
| HP ZBook 17 G2 J8Z55ET | |
| Bullman E-Klasse 5 | |
| 1900x1060 Siemens NX (snx-02) (sort by value) | |
| MSI WT72-6QM | |
| MSI WT72-2OL32SR311BW | |
| HP ZBook 17 G2 J8Z55ET | |
| Bullman E-Klasse 5 | |
| 1900x1060 Showcase (showcase-01) (sort by value) | |
| MSI WT72-6QM | |
| MSI WT72-2OL32SR311BW | |
| HP ZBook 17 G2 J8Z55ET | |
| Bullman E-Klasse 5 | |
| 1900x1060 Medical (medical-01) (sort by value) | |
| MSI WT72-6QM | |
| MSI WT72-2OL32SR311BW | |
| HP ZBook 17 G2 J8Z55ET | |
| Bullman E-Klasse 5 | |
| 1900x1060 Maya (maya-04) (sort by value) | |
| MSI WT72-6QM | |
| MSI WT72-2OL32SR311BW | |
| HP ZBook 17 G2 J8Z55ET | |
| Bullman E-Klasse 5 | |
| 1900x1060 Energy (energy-01) (sort by value) | |
| MSI WT72-6QM | |
| MSI WT72-2OL32SR311BW | |
| HP ZBook 17 G2 J8Z55ET | |
| Bullman E-Klasse 5 | |
| 1900x1060 Creo (creo-01) (sort by value) | |
| MSI WT72-6QM | |
| MSI WT72-2OL32SR311BW | |
| HP ZBook 17 G2 J8Z55ET | |
| Bullman E-Klasse 5 | |
| 1900x1060 Catia (catia-04) (sort by value) | |
| MSI WT72-6QM | |
| MSI WT72-2OL32SR311BW | |
| HP ZBook 17 G2 J8Z55ET | |
| Bullman E-Klasse 5 | |
Gaming Performance
As far as gaming is concerned, the WT72 can certainly hold its own as well with a performance roughly 40 % lower across the board compared to dedicated gaming notebook like the GT72S 6QF. Metro: Last Light, for example, was still easily playable at about 61 fps on ultra; the high-end gaming system Xotic PC MSI GT72S 6QF Dragon managed 85 fps. The picture is similar for Middle-earth: Shadow of Mordor, with the review notebook clocking 64 fps (ultra) vs. 95 fps for the GT72S with the GeForce GTX 980.
| low | med. | high | ultra | |
|---|---|---|---|---|
| Dirt 3 (2011) | 211 | 202.7 | 171.4 | 158.2 |
| Hitman: Absolution (2012) | 83.5 | 75.9 | 67.2 | 50.3 |
| Tomb Raider (2013) | 406.8 | 319.6 | 227.9 | 107 |
| Metro: Last Light (2013) | 127.5 | 125.3 | 104.3 | 60.8 |
| GRID 2 (2013) | 176.3 | 145.6 | 134.5 | 102.7 |
| Company of Heroes 2 (2013) | 53.4 | 52 | 51.4 | 34.4 |
| Thief (2014) | 97.6 | 92.3 | 89.4 | 80.5 |
| Middle-earth: Shadow of Mordor (2014) | 167.8 | 143.2 | 87.4 | 63.6 |
Emissions
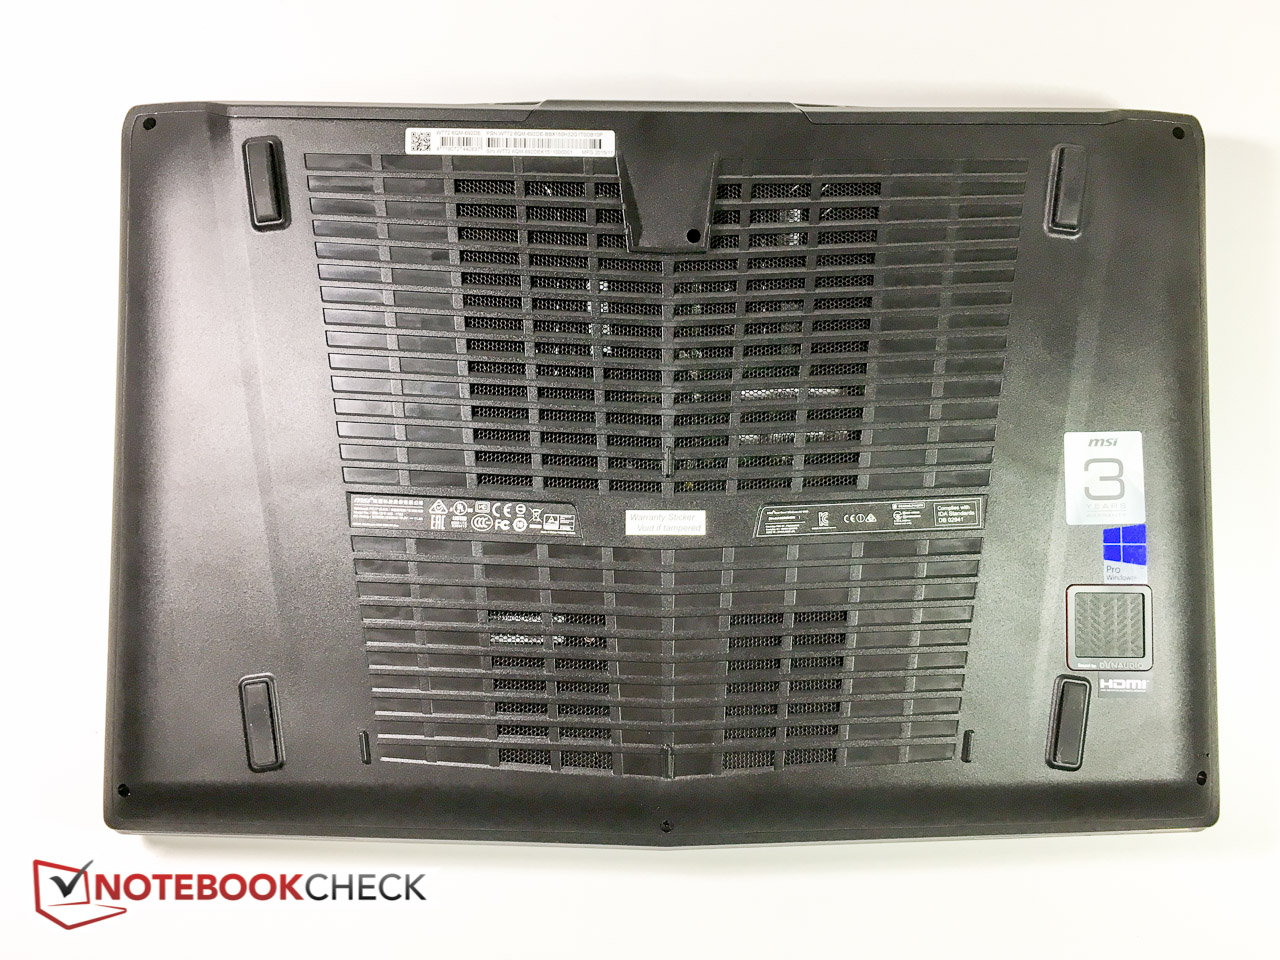
System Noise
Just like its gaming-oriented sibling, the WT72 is equipped with a dual fan system to combat the generated heat. A dedicated button to the left of the keyboard enables the "Cooler Boost" feature to aid in cooling under extreme conditions.
The fans are always on, so the notebook remains audible even during idle and emits about 33 dB. Under full load (stress test), the noise level can increase to about 40 dB, which is still acceptable. Enabling Cooler Boost results in a noise level of about 53 dB, which is quite obtrusive during longer sessions. Under normal condition - and the lower ambient temperatures during wintertime - this really isn't necessary.
Noise level
| Idle |
| 33.3 / 33.4 / 33.5 dB(A) |
| DVD |
| 34 / dB(A) |
| Load |
| 38.8 / 40.2 dB(A) |
 | ||
30 dB silent 40 dB(A) audible 50 dB(A) loud |
||
min: | ||
Temperature
Since the fan system is always on, the notebook doesn't get hot at all during idle (power saver mode; dGPU active) and normal workloads. During the stress test, we only observed a maximum of 43 degrees, which is very acceptable for a system this powerful. The palm rests remain remarkably cool at 26 degrees, so there are no concerns even during prolonged use.
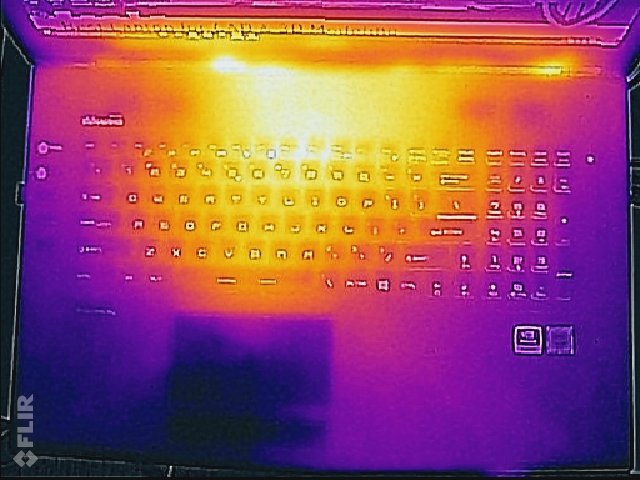
(±) The maximum temperature on the upper side is 40.6 °C / 105 F, compared to the average of 38.2 °C / 101 F, ranging from 22.2 to 69.8 °C for the class Workstation.
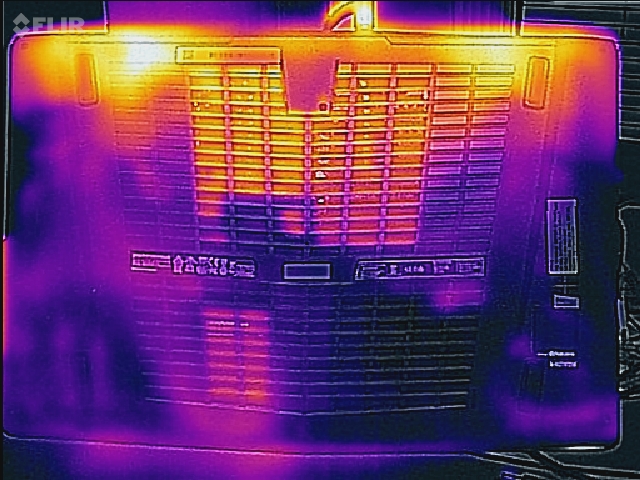
(±) The bottom heats up to a maximum of 42.6 °C / 109 F, compared to the average of 41.1 °C / 106 F
(+) In idle usage, the average temperature for the upper side is 25.5 °C / 78 F, compared to the device average of 32 °C / 90 F.
(+) The palmrests and touchpad are cooler than skin temperature with a maximum of 26.4 °C / 79.5 F and are therefore cool to the touch.
(±) The average temperature of the palmrest area of similar devices was 27.8 °C / 82 F (+1.4 °C / 2.5 F).
Stress Test
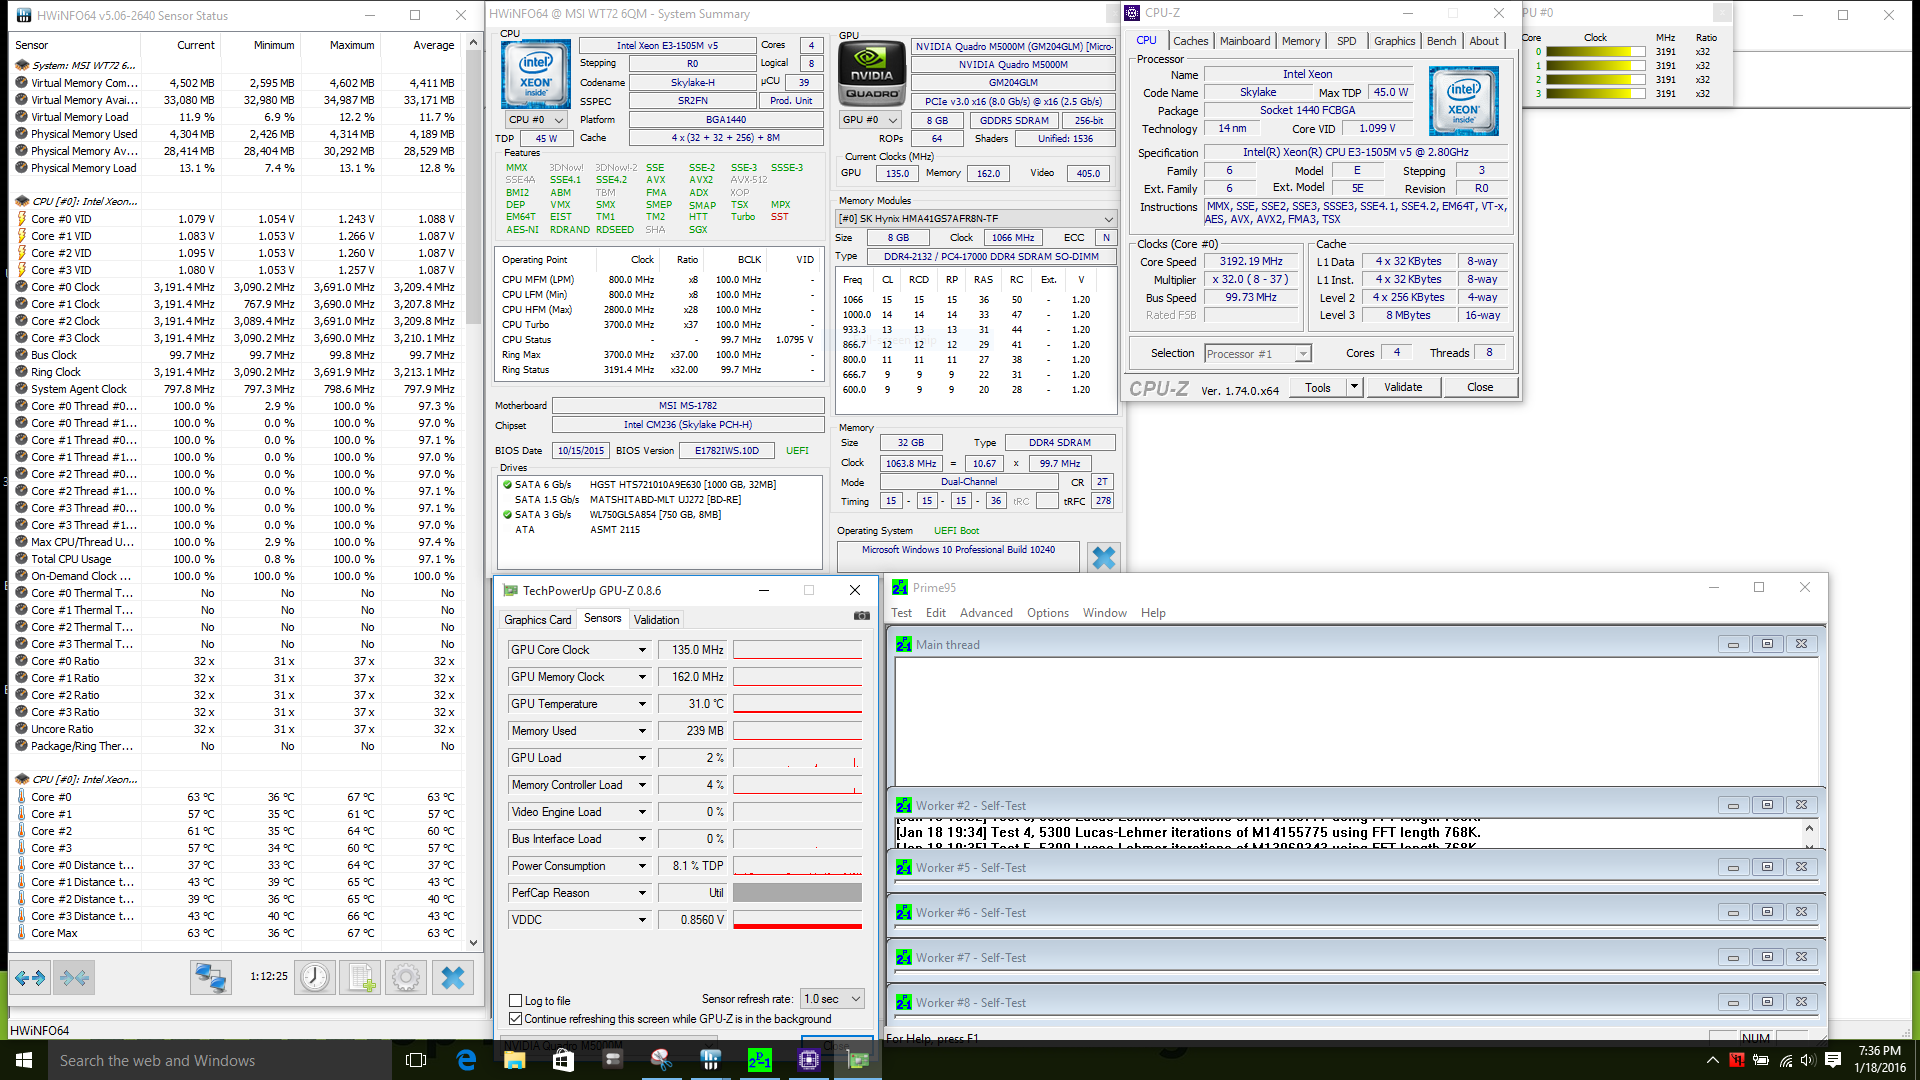
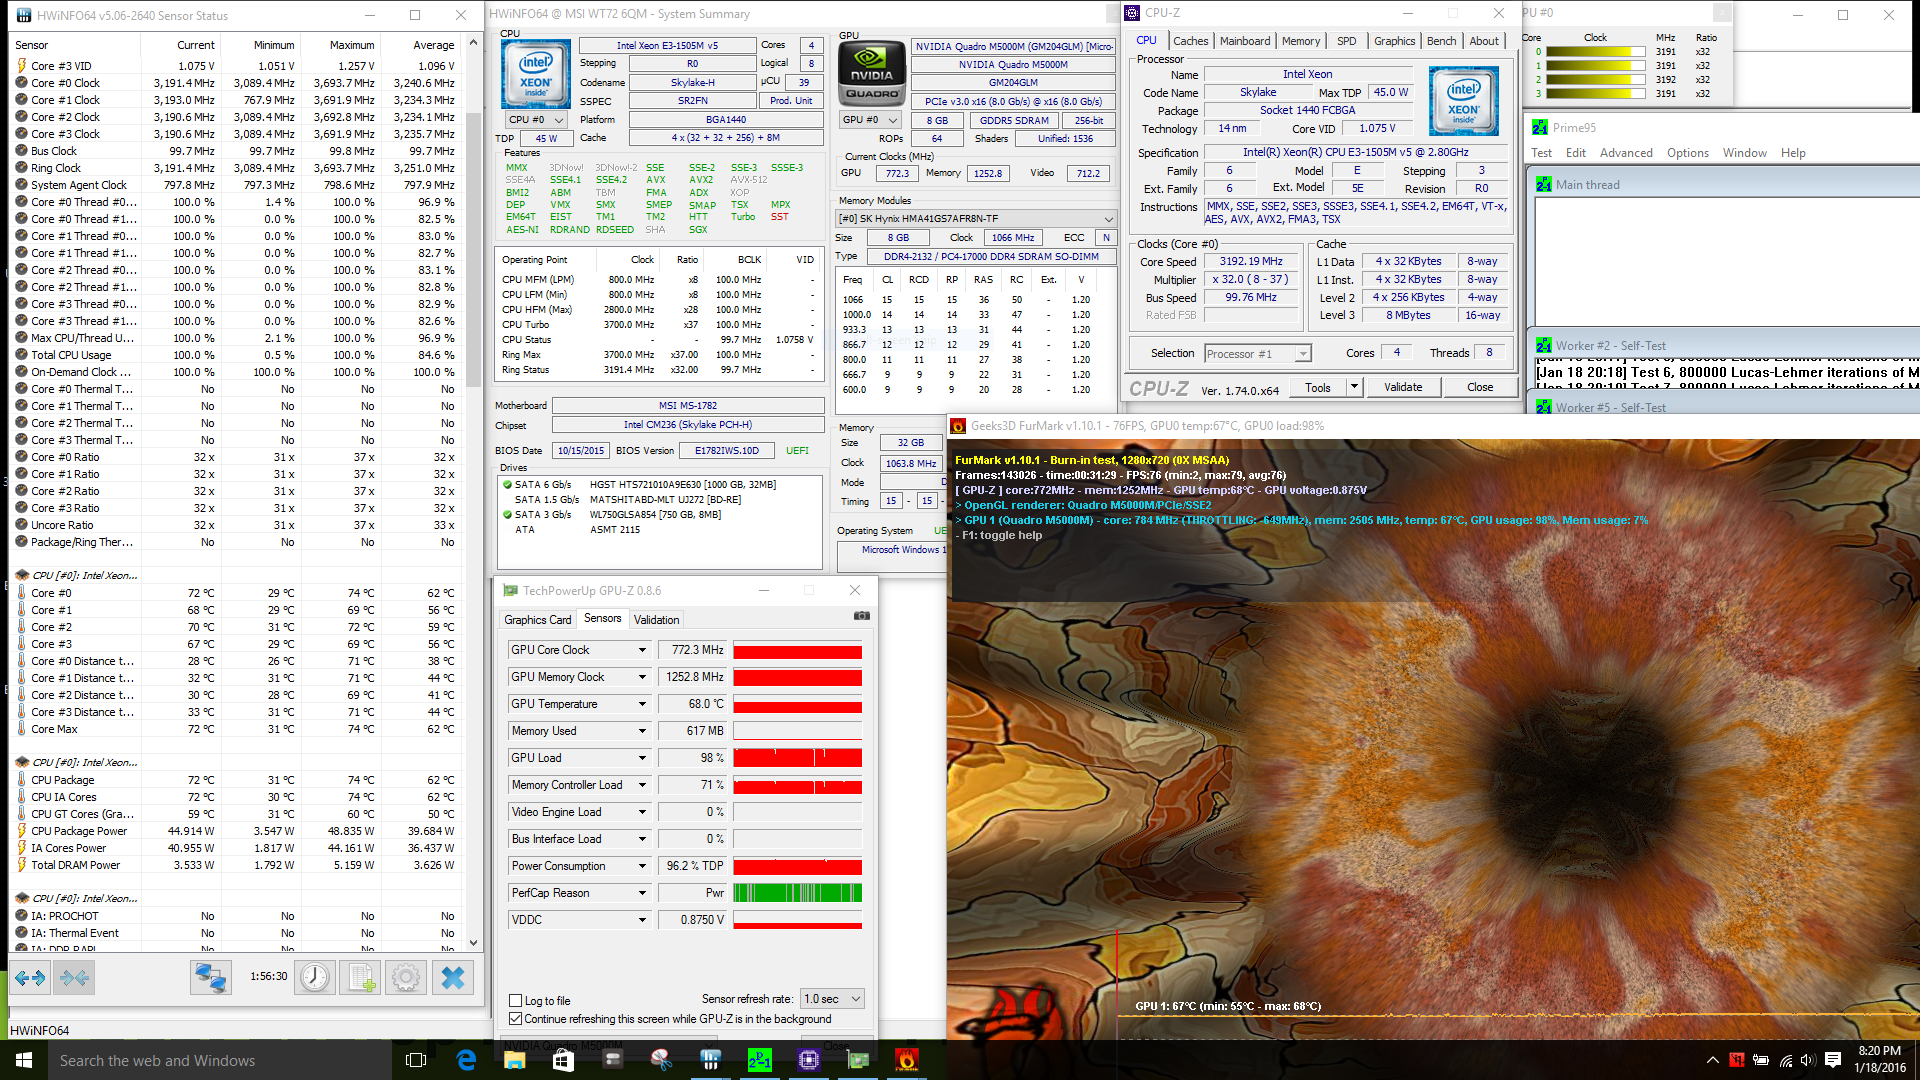
To see how the workstation handles stress above and beyond what would normally be encountered - even during gaming - we subject the WT72 to our stress test with Prime95 and FurMark. Since the workstation is equipped with a powerful additional "Cooler Boost", we decided to use it - after all, this feature is supposed to keep the notebook cool and performing well even under adverse conditions.
With only Prime95 running, the four CPU cores remained at 3.2 GHz for the duration of the test - not quite the possible theoretical Turbo-maximum of 3.3 GHz, but still impressive, especially considering that the CPU maintained a temperature of around 63 degrees C. With Furmark active, we saw an initial GPU speed between 772 and 800 MHz at a temperature of 60 degrees C. After about 15 minutes, the GPU only reached a maximum of 785 MHz; the temperature averaged about 63 degrees C.
Even with Prime95 and Furmark running at the same time, we saw no significant drops in performance: after about 15 minutes, the CPU stabilized at frequency of between 3.1 and 3.2 GHz with the temperature at 68 degrees C; the GPU fluctuated between 772 and 785 MHz and stabilized at 68 degrees. Even two hours later, there was no change whatsoever. Running the workstation on battery power is not a good idea: the GPU drops to about 324 MHz and the CPU dips down to 800 MHz.

Energy Management
Battery Life
The battery life is decent considering the size and performance. Keep in mind though that a halfway decent battery life requires switching to the integrated GPU. The WT72 shut down after a little over 4 hours during our WLAN test, which is about an hour shorter than what we recorded for the previous version. The HP ZBook 17 G2, however, only lasted half as long. Under load, the workstation lasted one hour and 15 minutes - although at the cost of a vastly reduced performance, as we've seen earlier. The battery is integrated and thus not removable.
| MSI WT72-6QM 87 Wh | HP ZBook 17 G2 J8Z55ET 75 Wh | Bullman E-Klasse 5 83 Wh | Dell Precision M6800 97 Wh | Schenker XMG U705 82 Wh | |
|---|---|---|---|---|---|
| Battery runtime | -50% | -31% | 10% | -26% | |
| Reader / Idle (h) | 6.9 | 2.7 -61% | 2.8 -59% | 8.2 19% | 2.3 -67% |
| WiFi v1.3 (h) | 4.1 | 2.4 -41% | |||
| Load (h) | 1.3 | 0.8 -38% | 1.4 8% | 1.3 0% | 1.5 15% |
| WiFi (h) | 2.5 | 5.9 |
Pros
Cons
Verdict
With the WT72-6QME workstation, MSI delivers a solid update to an already very decent product. While the performance of the Xeon E3-1505M CPU isn't groundbreaking, it does offer support for ECC RAM, which in turn increases reliability. Speaking of reliability: while a RAID 0 array might make perfect sense for a gaming notebook, we still wonder if it wouldn't be better to include fault tolerance on a system where stability and reliability are key. Originally designed for gaming, the chassis features an exceptionally well-designed cooling solution and even all-day, maximum-load work sessions are possible without caveats. Activating the "Cooler Boost"-feature might infuriate coworkers though, as the noise level is pretty substantial. The display - used in many 17-inch gaming systems - is decent as well, although we would wish for better coverage of the professional color spaces.
MSI's updated WT72 workstation is once again a solid choice in this segment - although the top-of-the-line configuration seems almost prohibitively expensive for a modified gaming notebook.
MSI WT72-6QM
- 03/17/2016 v5 (old)
Bernie Pechlaner
Price comparison