 Deutsch
 English
 Español
 Français
 Italiano
 Nederlands
 Polski
 Português
 Русский
 Türkçe
 Svenska
 Chinese
 Magyar
NVIDIA Quadro NVS 320M vs NVIDIA Quadro FX 1700M
NVIDIA Quadro NVS 320M
► remove from comparison
DirectX 10 medium class business graphic card, which is optimized for compatibility and stability. The graphic card seems to have the same core like the 8700M series and therefore shows good performance data.
A particularity of the graphic card are the "Unified Shaders". There don't exist any more dedicated pixel- and vertex shaders but 16 so called Stream processors maintain the upcomming graphic work (which was done by the pixel and vertex Shaders, up to now).
The memory clock of the Quadro NVS 320M depends on the implemented memory type: 400 MHz with GDDR2 and 700 MHz with GDDR3.
NVIDIA Quadro FX 1700M
► remove from comparison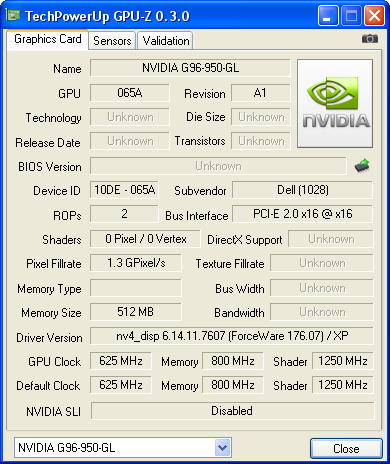
The Nvidia Quadro FX 1700M is a professional graphics adapter for CAD and 3D applications. It is based on the G96 core (GeForce 9650M e.g.) but with different drivers, that are optimized for OpenGL and professional applications. The drivers are zertified to work flawlessly with different applications.
Compared to the Quadro FX 1600M, the FX 1700M GPU supports Powermizer 8.0.
| NVIDIA Quadro NVS 320M | NVIDIA Quadro FX 1700M | |||||||||||||||||||||||||||||||||||||||||||||||||||||||||||||||||||||||||||||||||||||
| Quadro FX Series |
|
| ||||||||||||||||||||||||||||||||||||||||||||||||||||||||||||||||||||||||||||||||||||
| Codename | G84M | NB9P-GLM | ||||||||||||||||||||||||||||||||||||||||||||||||||||||||||||||||||||||||||||||||||||
| Architecture | G8x | G9x | ||||||||||||||||||||||||||||||||||||||||||||||||||||||||||||||||||||||||||||||||||||
| Pipelines | 32 - unified | 32 - unified | ||||||||||||||||||||||||||||||||||||||||||||||||||||||||||||||||||||||||||||||||||||
| Core Speed | 575 MHz | 625 MHz | ||||||||||||||||||||||||||||||||||||||||||||||||||||||||||||||||||||||||||||||||||||
| Shader Speed | 1150 MHz | 1250 MHz | ||||||||||||||||||||||||||||||||||||||||||||||||||||||||||||||||||||||||||||||||||||
| Memory Speed | 700 MHz | 800 MHz | ||||||||||||||||||||||||||||||||||||||||||||||||||||||||||||||||||||||||||||||||||||
| Memory Bus Width | 128 Bit | 128 Bit | ||||||||||||||||||||||||||||||||||||||||||||||||||||||||||||||||||||||||||||||||||||
| Memory Type | GDDR3, GDDR2 | GDDR3 | ||||||||||||||||||||||||||||||||||||||||||||||||||||||||||||||||||||||||||||||||||||
| Max. Amount of Memory | 512 MB | 256 MB | ||||||||||||||||||||||||||||||||||||||||||||||||||||||||||||||||||||||||||||||||||||
| Shared Memory | no | no | ||||||||||||||||||||||||||||||||||||||||||||||||||||||||||||||||||||||||||||||||||||
| API | DirectX 10, Shader 4.0 | DirectX 10, Shader 4.0 | ||||||||||||||||||||||||||||||||||||||||||||||||||||||||||||||||||||||||||||||||||||
| Power Consumption | 20 Watt | 50 Watt | ||||||||||||||||||||||||||||||||||||||||||||||||||||||||||||||||||||||||||||||||||||
| Transistors | 289 Million | 289 Million | ||||||||||||||||||||||||||||||||||||||||||||||||||||||||||||||||||||||||||||||||||||
| technology | 80 nm | 65 nm | ||||||||||||||||||||||||||||||||||||||||||||||||||||||||||||||||||||||||||||||||||||
| Features | Shader clock frequence 1200 MHz, PureVideo technology (H.264, VC-1, MPEG2, WMV9 decoder acceleration), HDCP-capable, PowerMizer 7.0 energy management (dynamic switching between performance and energy saving), HDR (high dynamic-range lighting), designed for Windows Vista, 16x full image AA, 16x AF independent on angles, 128-bit HDR illumination with AA, Dual-Link DVI exits for TFT resolutions up to 2560x1600, PCI-E 16x, OpenGL 2.1, Gigathread technology | OpenGL 2.1, PureVideo HD, Powermizer 8.0, possible interfaces: LVDS, DVI, VGA, HDTV, HDCP, HDMI | ||||||||||||||||||||||||||||||||||||||||||||||||||||||||||||||||||||||||||||||||||||
| Notebook Size | large | large | ||||||||||||||||||||||||||||||||||||||||||||||||||||||||||||||||||||||||||||||||||||
| Date of Announcement | 09.06.2007 | 01.10.2008 | ||||||||||||||||||||||||||||||||||||||||||||||||||||||||||||||||||||||||||||||||||||
| Link to Manufacturer Page | www.nvidia.de | www.nvidia.com | ||||||||||||||||||||||||||||||||||||||||||||||||||||||||||||||||||||||||||||||||||||
| Information | CG shading language, 32 Bit floating point precision, 12 Bit subpixel precision, 128 Bit precision of the graphics pipeline, FSAA with rotated raster, nView Mutlidisplay Support, High-Precision-Dynamic-Range (HPDR), Hardware 3D Clipping on window recognision, full screen AA |


