Performance comparison: Microsoft Surface Pro 6 (2018), HP Elite x2 1013 G3, Lenovo ThinkPad X1 Tablet G3
Who can offer the best Windows tablet? One rather important aspect we need to take into consideration to answer this question is performance. All manufacturers, from Microsoft, HP and Lenovo to Dell, promise the processing power of full-fledged laptops - or at least of those based on 15 watts.
For many years we have been experiencing that test units - whether this is a slim tablet convertible or a laptop - cannot access their processor's full potential, or at least not over an extended period. Thermal throttling is caused when the cooling system (with or without a fan) is not able to transport the heat the processor produces out of the device fast enough. As a result, the processor and (integrated) graphics card lower their clock rate.
Intel's SoCs are made to do this to avoid overheating - nobody wants a tablet with a surface temperature of 90 °C (~194 °F).
So it is no easy feat for the engineers at Microsoft, HP, Lenovo or Dell to develop a cooling system that enables good processing performance without letting the case temperature get too high and also avoids regular heat-related shutdowns.
We have taken a look at the Core i7 versions of the ThinkPad X1 tablet G3, the HP Elite x2 1013 G3 LTE and the Surface Pro 6 2018 to find out how their performance compares. Unfortunately, we could not obtain a test unit with a Core i7 from Dell, which is why we can only use the i5 results for this device.
| Lenovo ThinkPad X1 Tablet G3 LTE | HP Elite x2 1013 G3 LTE | Surface Pro 6 2018 | Dell Latitude 5290 2-in-1 (i7 not included in the review) |
|---|---|---|---|
| i7-8550U | i7-8550U | i7-8650U | i7-8650U |
| 16 GB RAM | 16 GB RAM | 16 GB RAM | 16 GB RAM |
| 512 GB (Intel) | 1 TB (Samsung) | 512 GB (Toshiba BG3) | 512 GB (Toshiba KXG) |
| ~$1700 | ~$1800 | ~$1900 | ~$1700 |
Performance
All manufacturers have equipped their premium model with a Kaby Lake Refresh Core i7. This is a real quad-core processor that can work with eight threads.
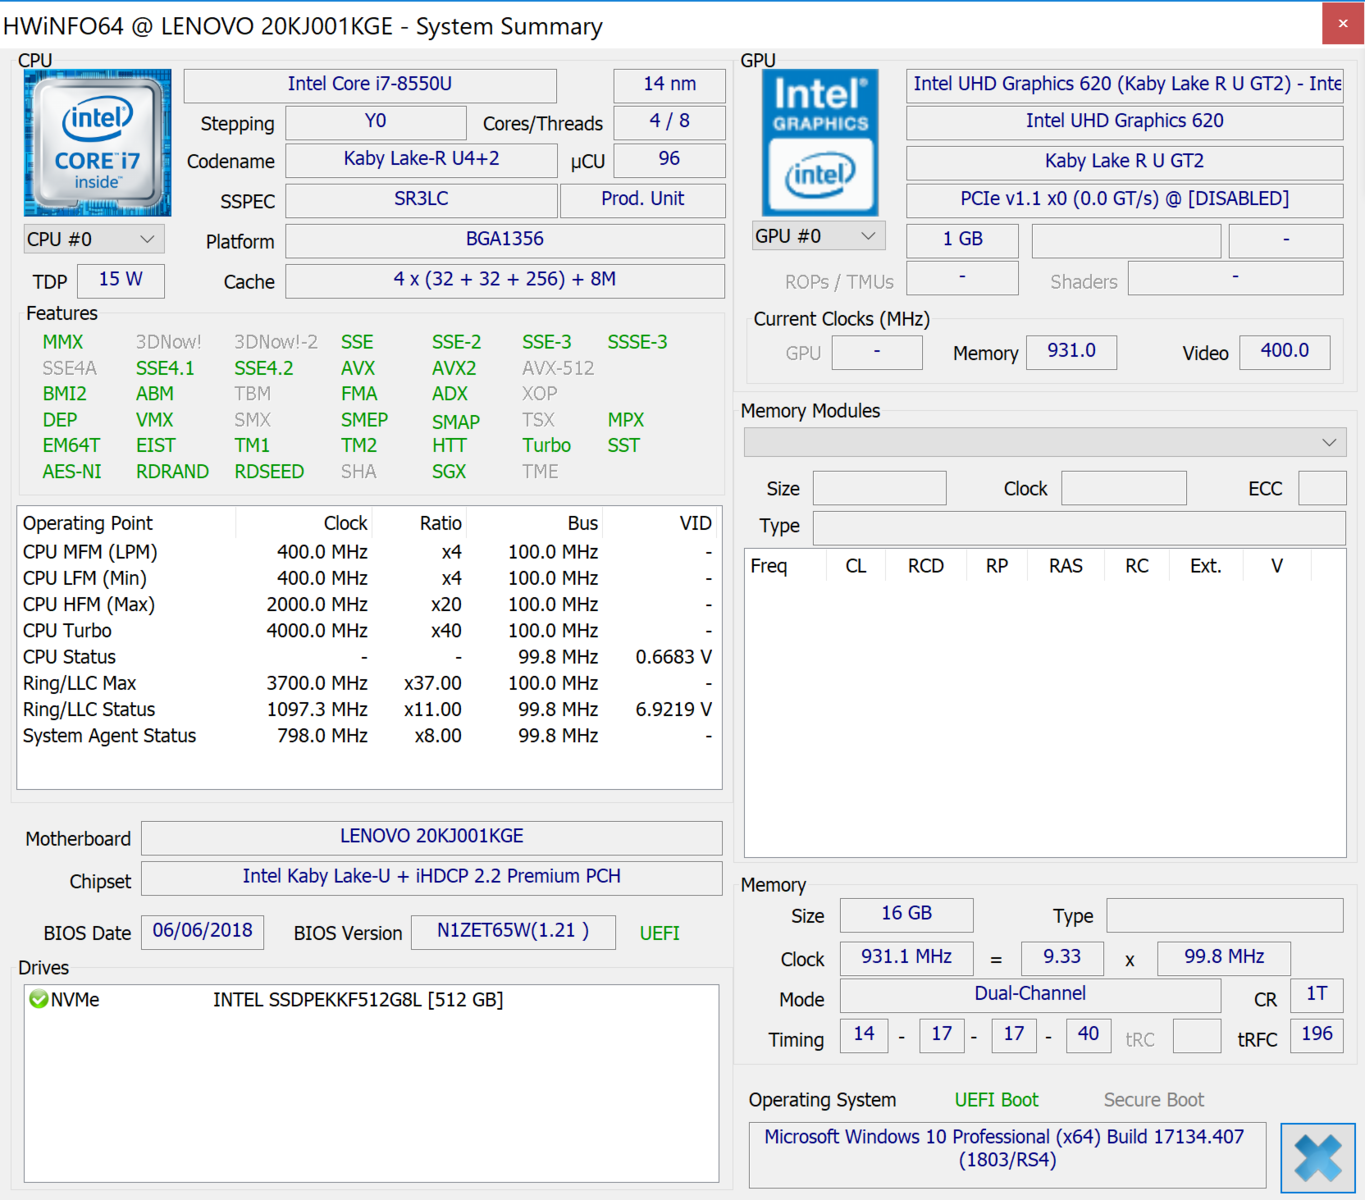
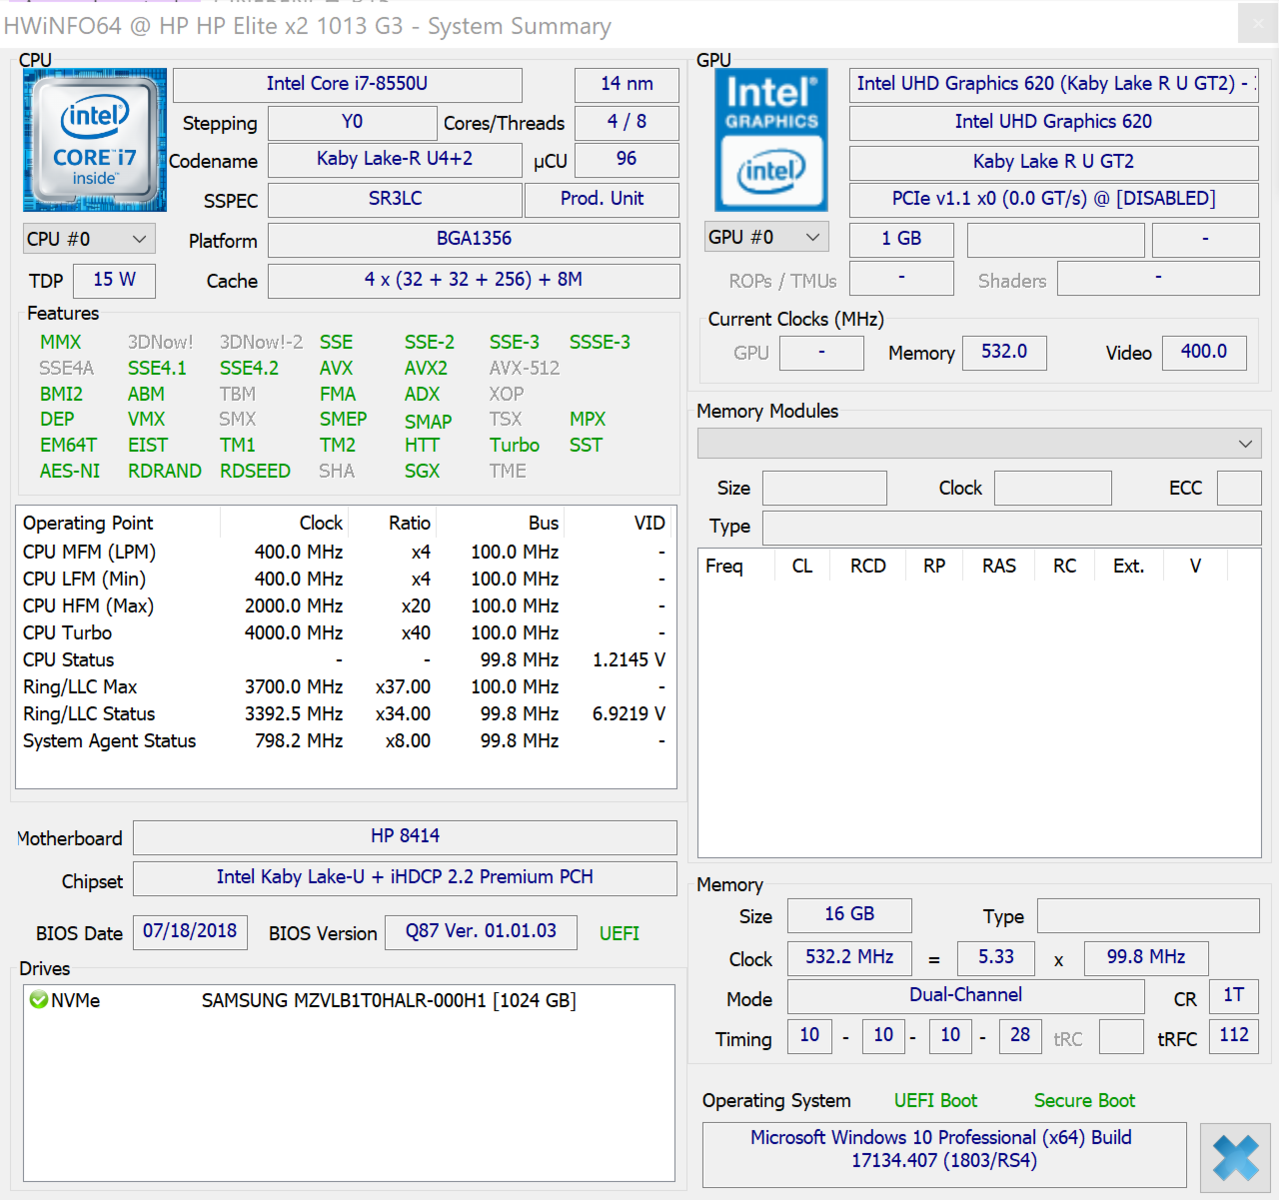
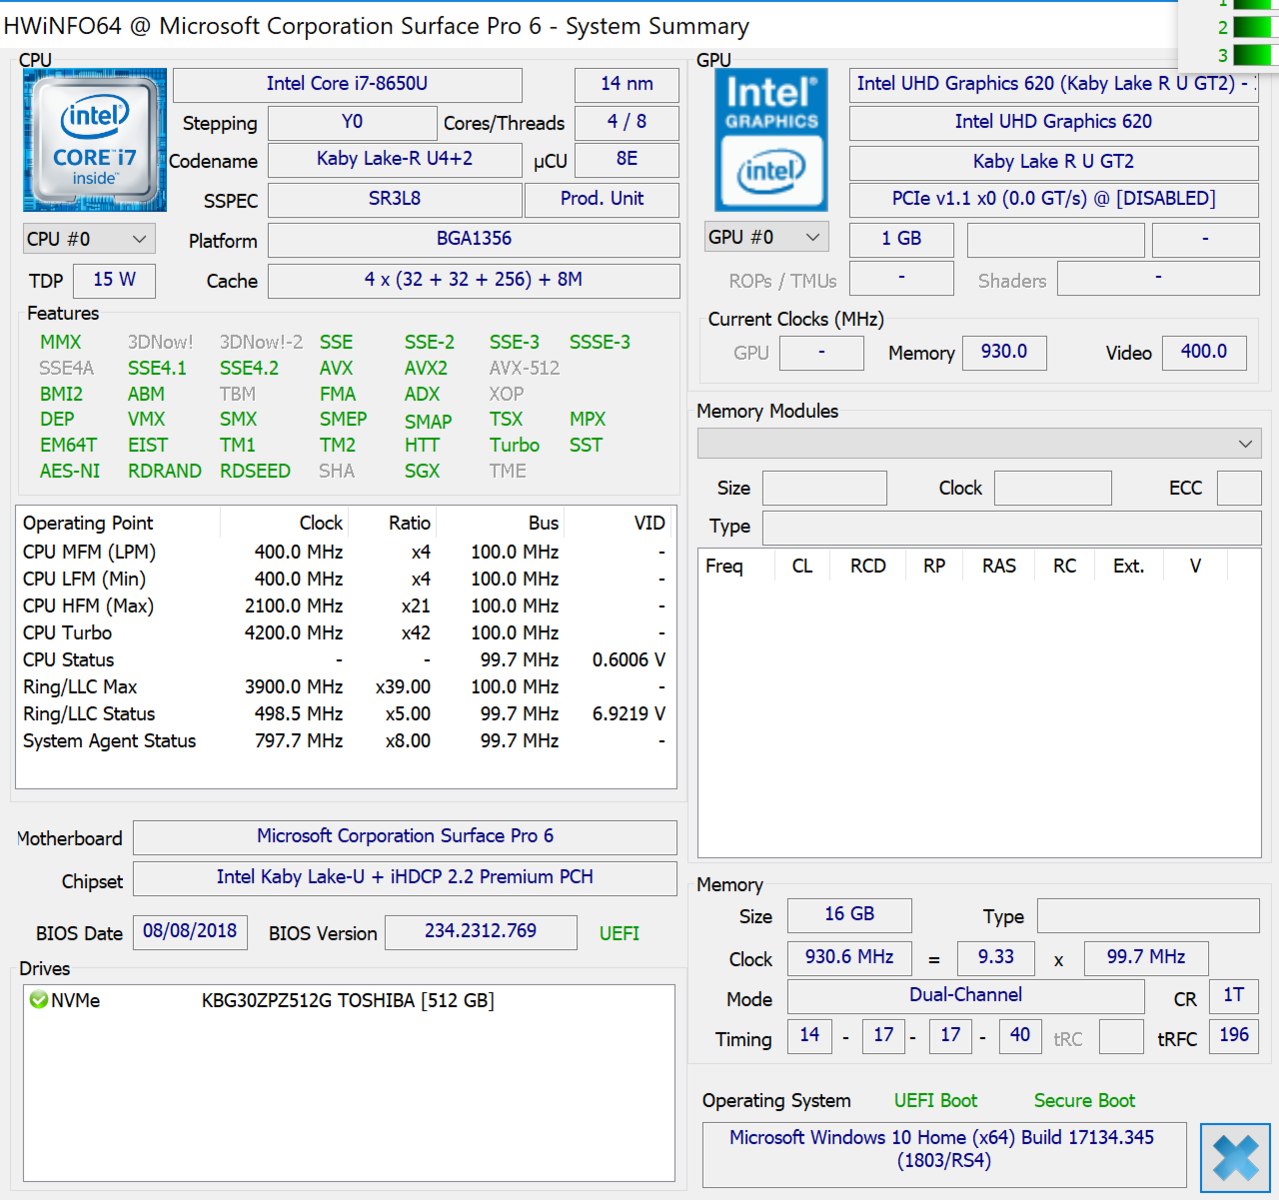
Lenovo and HP use the i7-8550U (1.8 to 4 GHz) while Microsoft and Dell use the i7-8650U (1.9 to 4.2 GHz). Both chips have a DDR4-2400 / LPDDR3-2133 Dual-Channel memory controller and VP9 and H.265 video encoders and decoders and are manufactured using the 14-nm process.
Both are equipped with a UHD Graphics 620 (300 - 1150 MHz) and have a TDP of 15 watts. The chips can consume a little more power for a short period while running in turbo mode. The only real difference between the 8550U and the 8650U is the higher base and turbo clock rate.
All test units are equipped with 16 GB of RAM in dual-channel mode and fast NVMe SSDs from Toshiba (Microsoft, Dell), Samsung (HP) and Intel (Lenovo). None of the devices should have difficulties scoring well in the benchmarks.
Cinebench R15 Loop
We run the Cinebench R15 multi-core test in a loop and log temperatures, clock rates, power consumption etc. via HWinfo. Microsoft clearly offers the highest performance: The Surface Pro 6 starts at 638 points and then drops by 11% after the fifth round. It then remains at around 565 points. Lenovo's competitor starts with a higher score, but its performance drops by 32% in the second round and then remains at 420 points, which is 26% lower than the Microsoft's performance. But remember this is continuous load we are talking about.
HP does not fare much better. Its first-round results cannot even reach the Microsoft's performance during continuous load. Therefore, it does not have a lot to lose and we measured -16% overall. This positions the HP 22% behind the Microsoft during continuous load. We have included the results of the various i5 versions, including that of the Latitude 5290. You can see that the difference between the i5 and the i7 is only minimal during the Cinebench R15 loop. Only the Microsoft tablet offers a noticeable difference between the i5 and i7 versions. This is due to the different cooling systems. While the i5 version uses passive cooling (no noise), the i7 version has a fan.
CPU benchmarks
The benchmarks tell a different story from the R15 loop, as they only look at the first round of the Cinebench R15. Here, Lenovo makes first place, with Microsoft following immediately behind. Interestingly enough, the performance of the ThinkPad T580 - a full-fledged notebook with plenty of space for a cooling system - is actually 5% below that of the Surface Pro 6.
HP cannot keep up: The Elite x2 is positioned 18% below the Surface tablet. Its i5 version is almost as fast as the HP i7 model in the multi-test. With the single-core R15 performance only being 10% faster as well, it is not really clear why customers should purchase the i7 version of the HP. We would not recommend it.
The single core results are similar. Microsoft and the ThinkPad T580 are at the forefront with HP and Lenovo falling behind with a 10% difference. They share third place with the Dell Latitude 5290 2-in-1 (i5).
| Cinebench R15 | |
| CPU Single 64Bit | |
| Average of class Convertible (149.8 - 317, n=48, last 2 years) | |
| Lenovo ThinkPad T580-20L9001AUS | |
| Average Intel Core i7-8650U (128 - 178, n=17) | |
| Microsoft Surface Pro 6, Core i7, 512 GB | |
| HP Elite x2 1013 G3 LTE i7 | |
| Dell Latitude 5290 2-in-1 | |
| Lenovo ThinkPad X1 Tablet G3 LTE i7 | |
| HP Elite x2 1013 G3-2TT14EA | |
| Microsoft Surface Pro 6, Core i5, 128 GB | |
| CPU Multi 64Bit | |
| Average of class Convertible (478 - 4940, n=48, last 2 years) | |
| Lenovo ThinkPad X1 Tablet G3 LTE i7 | |
| Microsoft Surface Pro 6, Core i7, 512 GB | |
| Lenovo ThinkPad T580-20L9001AUS | |
| Average Intel Core i7-8650U (451 - 675, n=19) | |
| Microsoft Surface Pro 6, Core i5, 128 GB | |
| Dell Latitude 5290 2-in-1 | |
| HP Elite x2 1013 G3 LTE i7 | |
| HP Elite x2 1013 G3-2TT14EA | |
System Performance
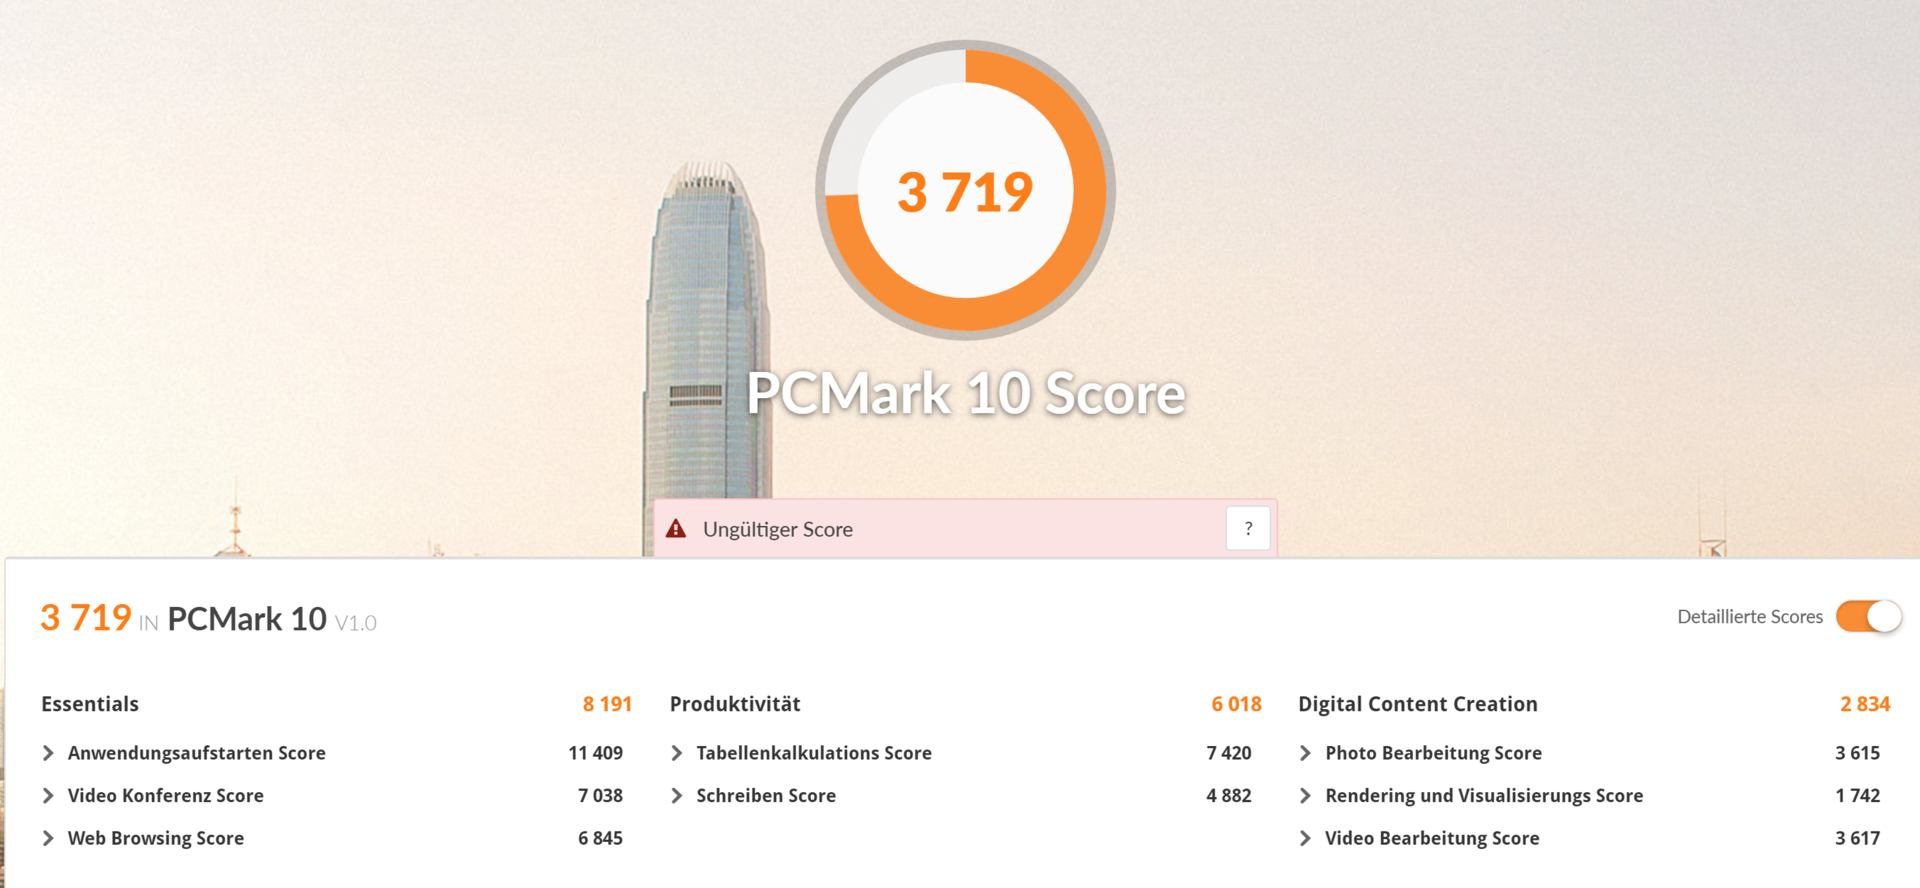
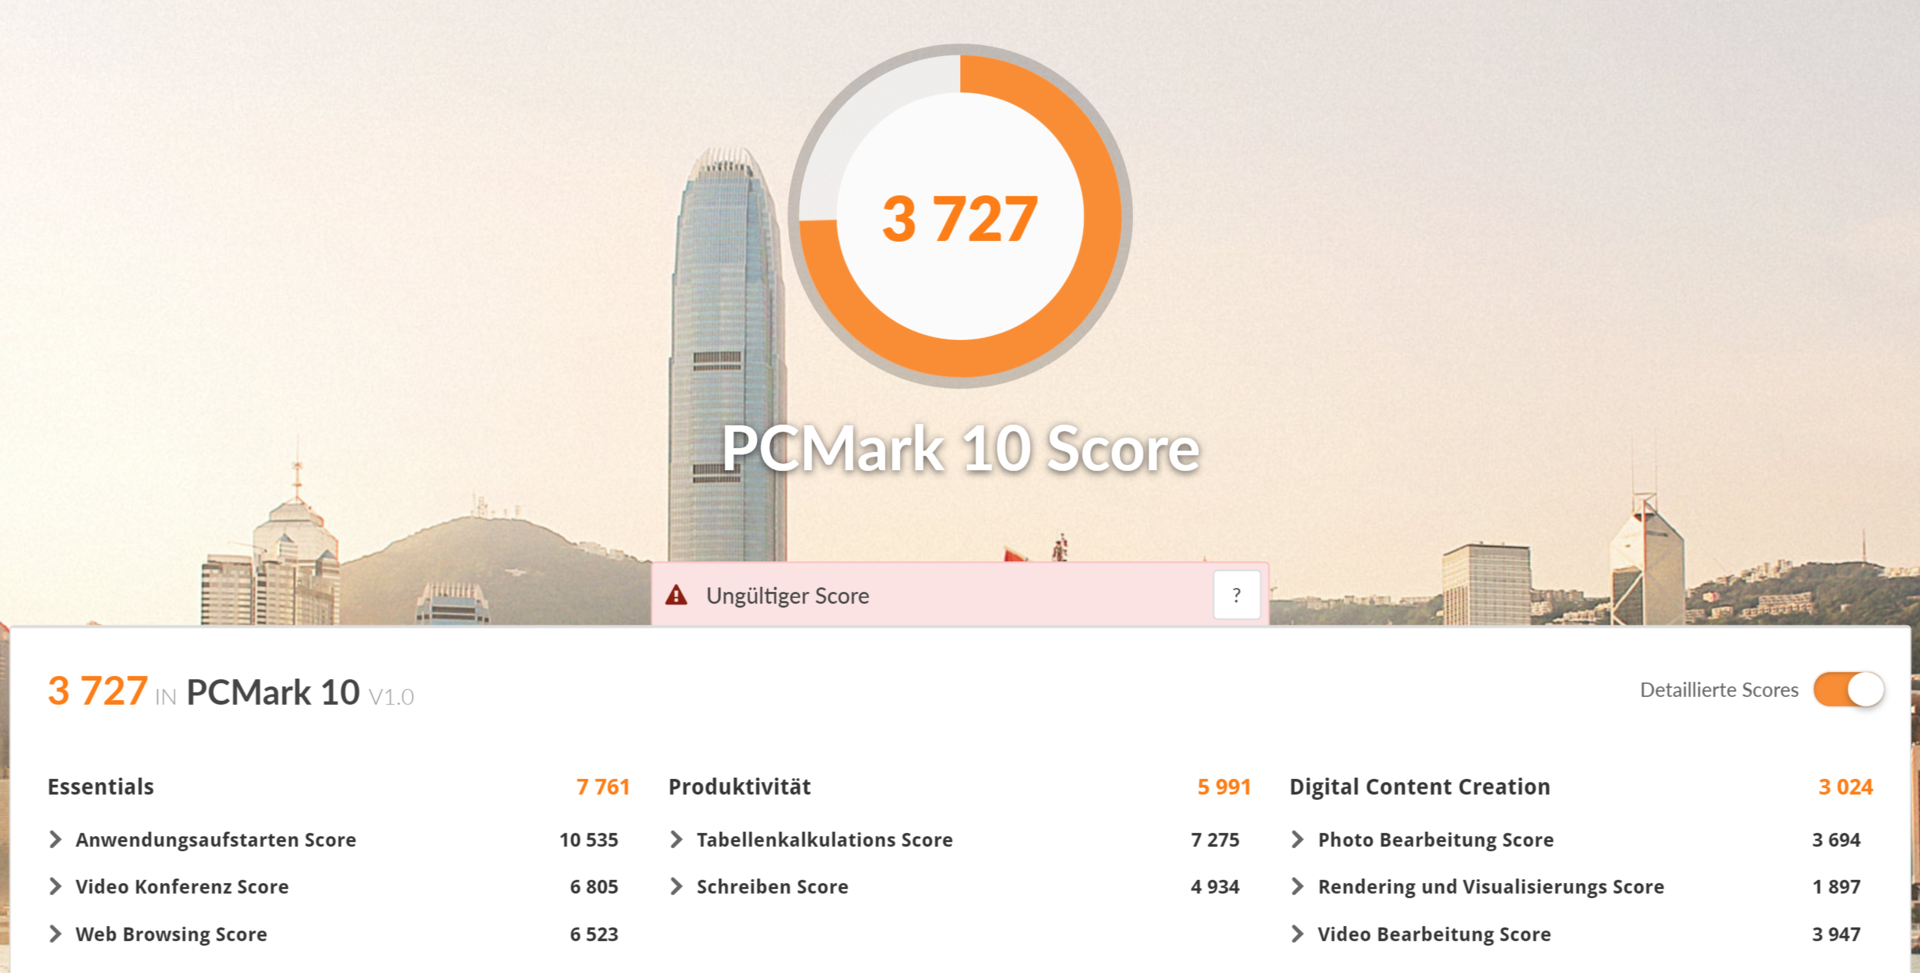
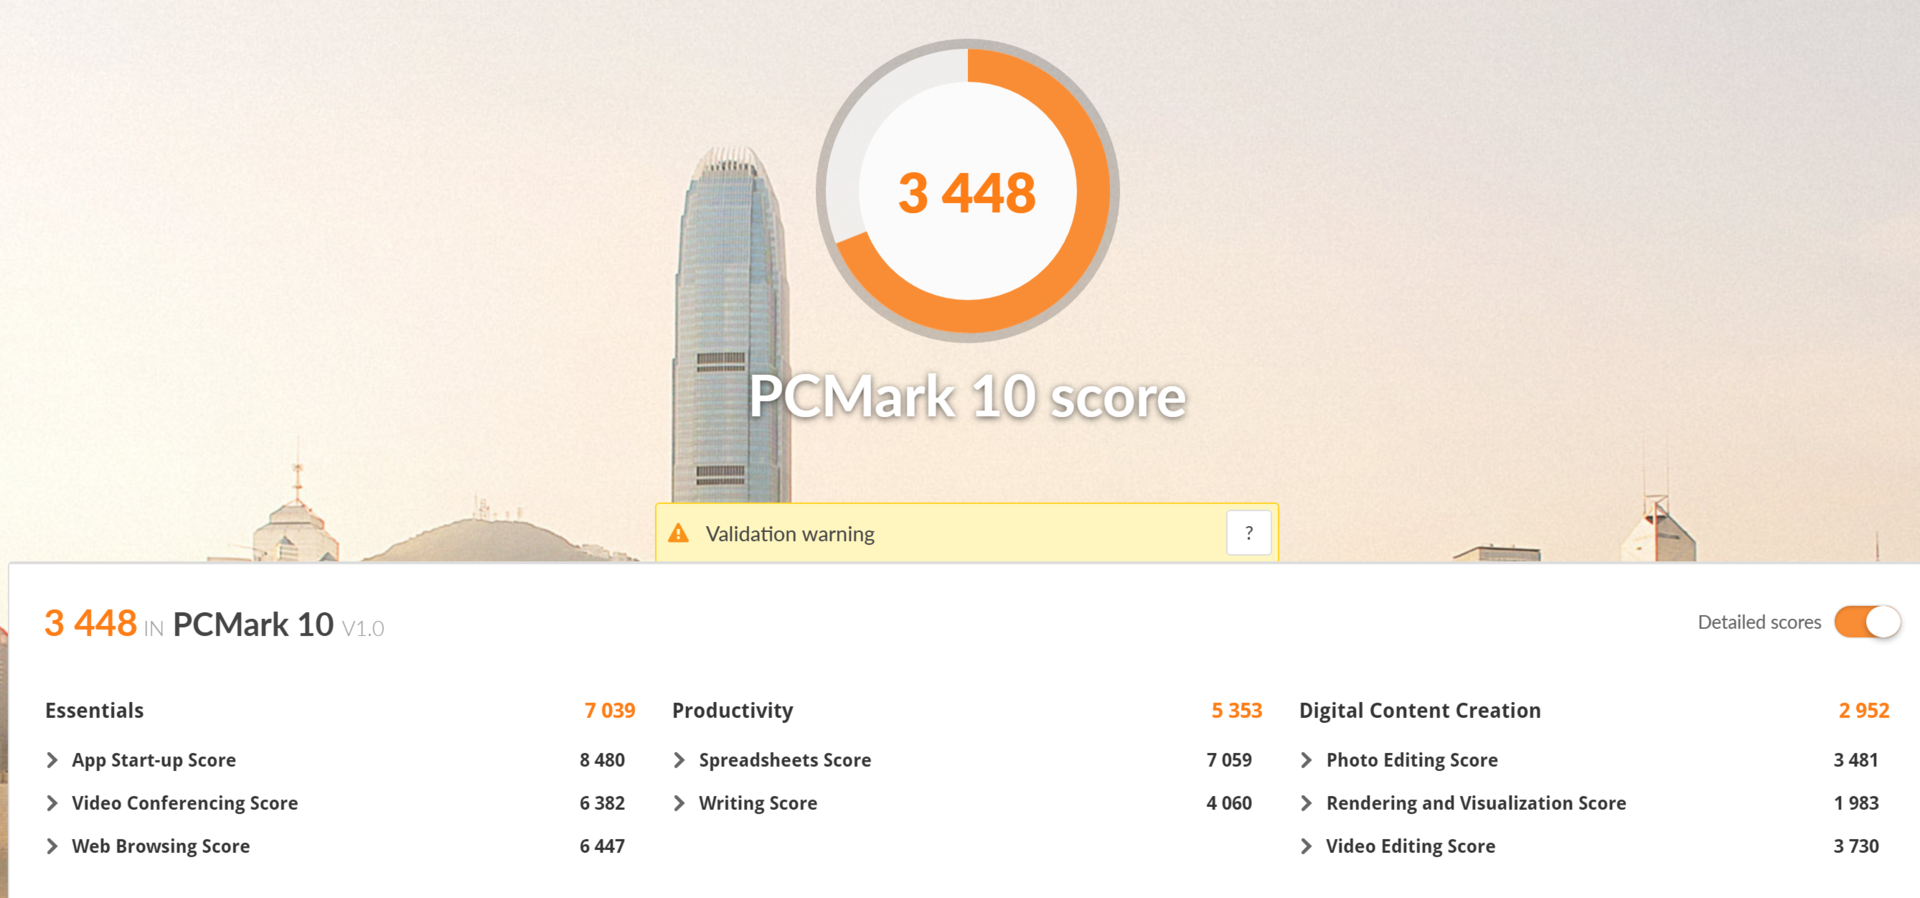
The system benchmarks offer similar results. The ThinkPad X1 and the Surface Pro 6 offer very similar performance in the PCMark 10 benchmark while the result of the Elite x2 1013 is 5% lower (Digital Content Creation).
The HP Elite x2 i7 and the Lenovo ThinkPad X1 take the lead when looking at productivity (PCMark 10) while the Microsoft lags behind with a difference of 11%. HP also does well in the Essential Subscore, leaving the others behind by 5% (Lenovo) and 14% (Microsoft). The overall score of the PCMark 10 confirms this image: The Lenovo and HP devices' results are 7% higher than those of our Microsoft test unit.
The PCMark 8 offers similar results to the PCMark 10, although they are closer together here. The Elite x2 leads with 9% in the Work score and with 7% in the Home score.
The reason for the "bad" PCMark results of the Surface Pro 6 is mainly connected to the mediocre Toshiba SSD. We already noticed this during our review of the Core i5/i7 versions.
Therefore, Microsoft cannot be crowned winner here, despite its higher processing performance. The competition clearly made a better choice of storage device.
| PCMark 8 | |
| Home Score Accelerated v2 | |
| Average of class Convertible (n=1last 2 years) | |
| Dell Latitude 5290 2-in-1 | |
| Average Intel Core i7-8650U, Intel UHD Graphics 620 (3216 - 4103, n=10) | |
| HP Elite x2 1013 G3 LTE i7 | |
| Lenovo ThinkPad X1 Tablet G3 LTE i7 | |
| Microsoft Surface Pro 6, Core i7, 512 GB | |
| Microsoft Surface Pro 6, Core i5, 128 GB | |
| Work Score Accelerated v2 | |
| Average of class Convertible (n=1last 2 years) | |
| Average Intel Core i7-8650U, Intel UHD Graphics 620 (3926 - 5200, n=8) | |
| Dell Latitude 5290 2-in-1 | |
| HP Elite x2 1013 G3 LTE i7 | |
| Microsoft Surface Pro 6, Core i7, 512 GB | |
| Lenovo ThinkPad X1 Tablet G3 LTE i7 | |
| Microsoft Surface Pro 6, Core i5, 128 GB | |
Storage Devices
The system benchmarks indicate that the Microsoft's Toshiba SSD is rather weak. The light green areas of the table (CrystalDiskMark, AS SSD) show that the Toshiba KBG30ZPZ512G (BG3) has lower results in almost all areas compared to the Samsung PM981 and the Intel 600p.
| Microsoft Surface Pro 6, Core i7, 512 GB Toshiba KBG30ZPZ512G | HP Elite x2 1013 G3 LTE i7 Samsung SSD PM981 MZVLB1T0HALR | Lenovo ThinkPad X1 Tablet G3 LTE i7 Intel SSD 600p SSDPEKKW512G8L | Dell Latitude 5290 2-in-1 Toshiba XG5 KXG50ZNV256G | Average Toshiba KBG30ZPZ512G | |
|---|---|---|---|---|---|
| CrystalDiskMark 5.2 / 6 | |||||
| Write 4K (MB/s) | 83.2 | 100 | 120 | 121.7 | 83.2 ? |
| Read 4K (MB/s) | 43.84 | 40.23 | 49.9 | 32.66 | 43.8 ? |
| Write Seq (MB/s) | 636 | 1839 | 1540 | 359.3 | 636 ? |
| Read Seq (MB/s) | 900 | 2024 | 2503 | 1463 | 900 ? |
| Write 4K Q32T1 (MB/s) | 192.9 | 314.9 | 239.4 | 353.6 | 192.9 ? |
| Read 4K Q32T1 (MB/s) | 247.4 | 269.8 | 360.4 | 387 | 247 ? |
| Write Seq Q32T1 (MB/s) | 861 | 2402 | 1568 | 358.1 | 861 ? |
| Read Seq Q32T1 (MB/s) | 1615 | 3306 | 2997 | 1779 | 1615 ? |
| AS SSD | |||||
| Score Total (Points) | 1225 | 2742 | 2578 | 1469 | 1225 ? |
| Score Write (Points) | 280 | 1323 | 1128 | 544 | 280 ? |
| Score Read (Points) | 644 | 966 | 986 | 642 | 644 ? |
| Access Time Write * (ms) | 0.3 | 0.033 | 0.048 | 0.053 | 0.3 ? |
| Access Time Read * (ms) | 0.213 | 0.038 | 0.036 | 0.082 | 0.213 ? |
| 4K-64 Write (MB/s) | 171.3 | 1088 | 850 | 411.2 | 171.3 ? |
| 4K-64 Read (MB/s) | 494.1 | 693 | 654 | 472.7 | 494 ? |
| 4K Write (MB/s) | 68.9 | 112 | 125.3 | 102.7 | 68.9 ? |
| 4K Read (MB/s) | 34.42 | 45.49 | 60.7 | 30.97 | 34.4 ? |
| Seq Write (MB/s) | 393.6 | 1227 | 1532 | 302.1 | 394 ? |
| Seq Read (MB/s) | 1154 | 2267 | 2706 | 1385 | 1154 ? |
| Total Average (Program / Settings) |
* ... smaller is better
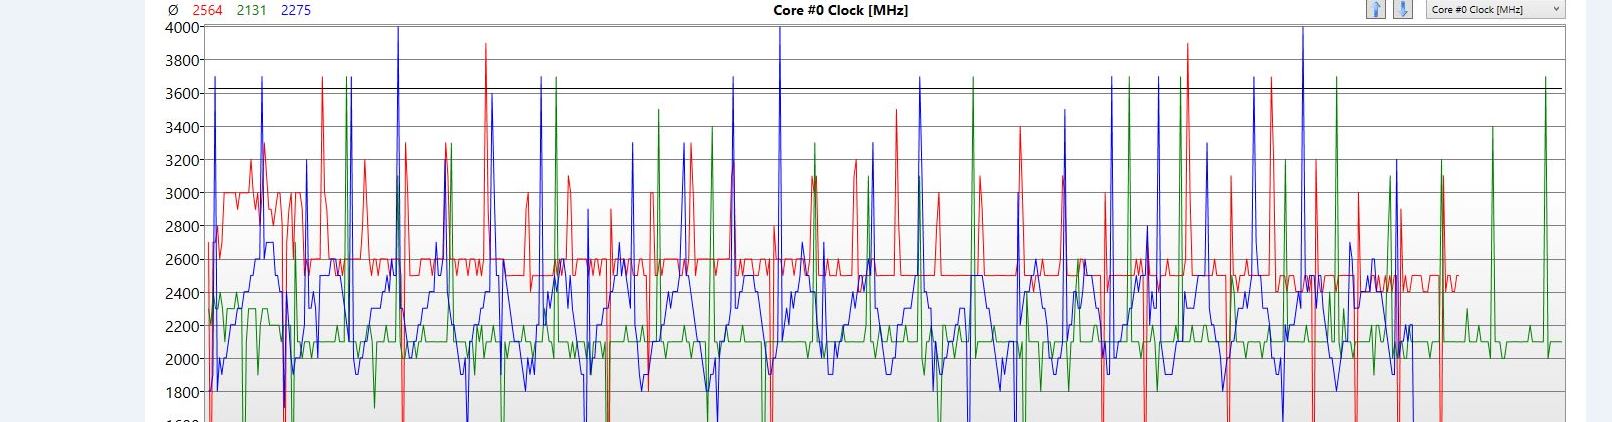
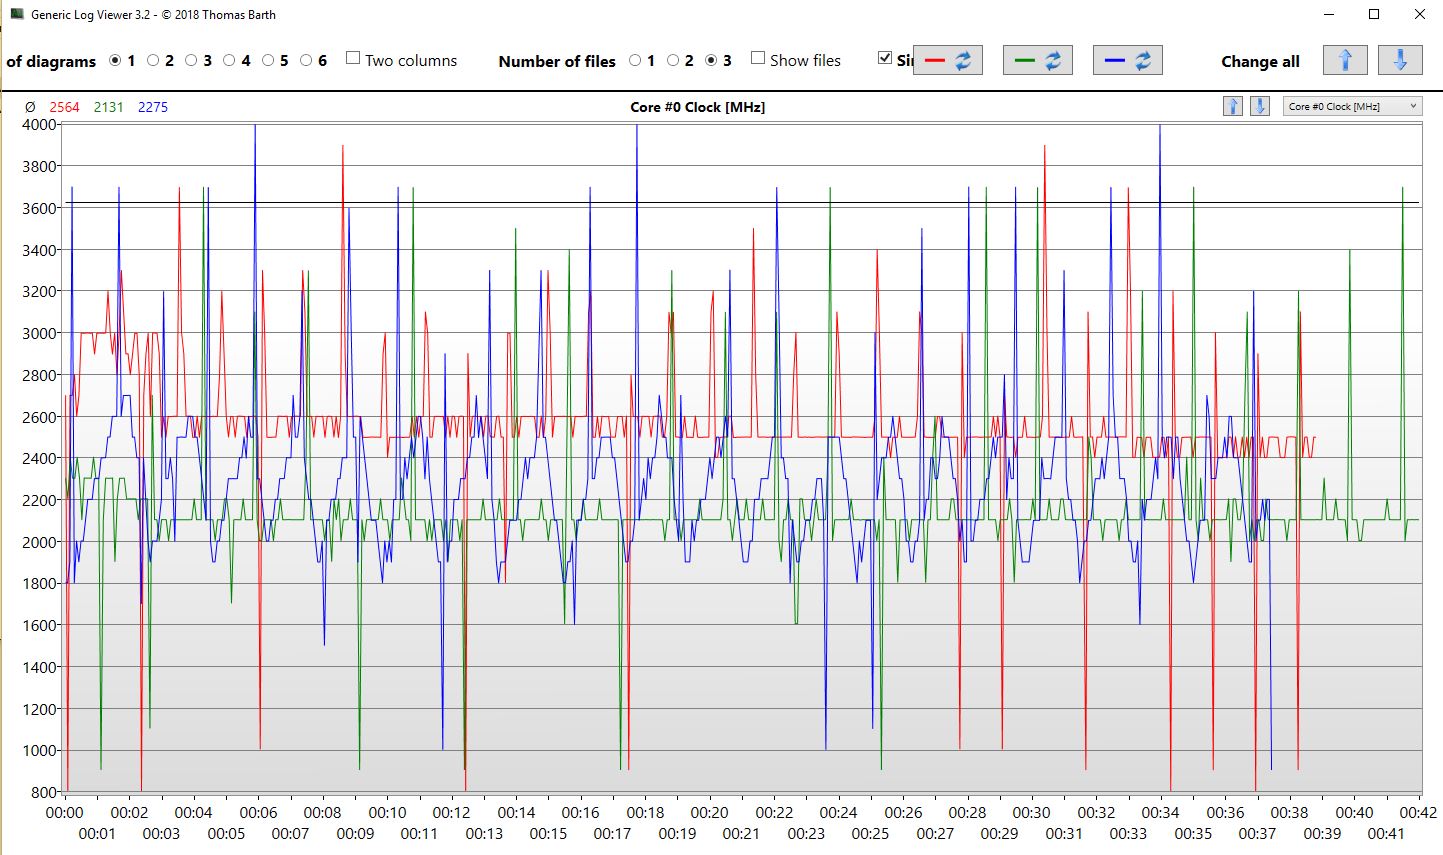
Core temperatures, power consumption and clock rates
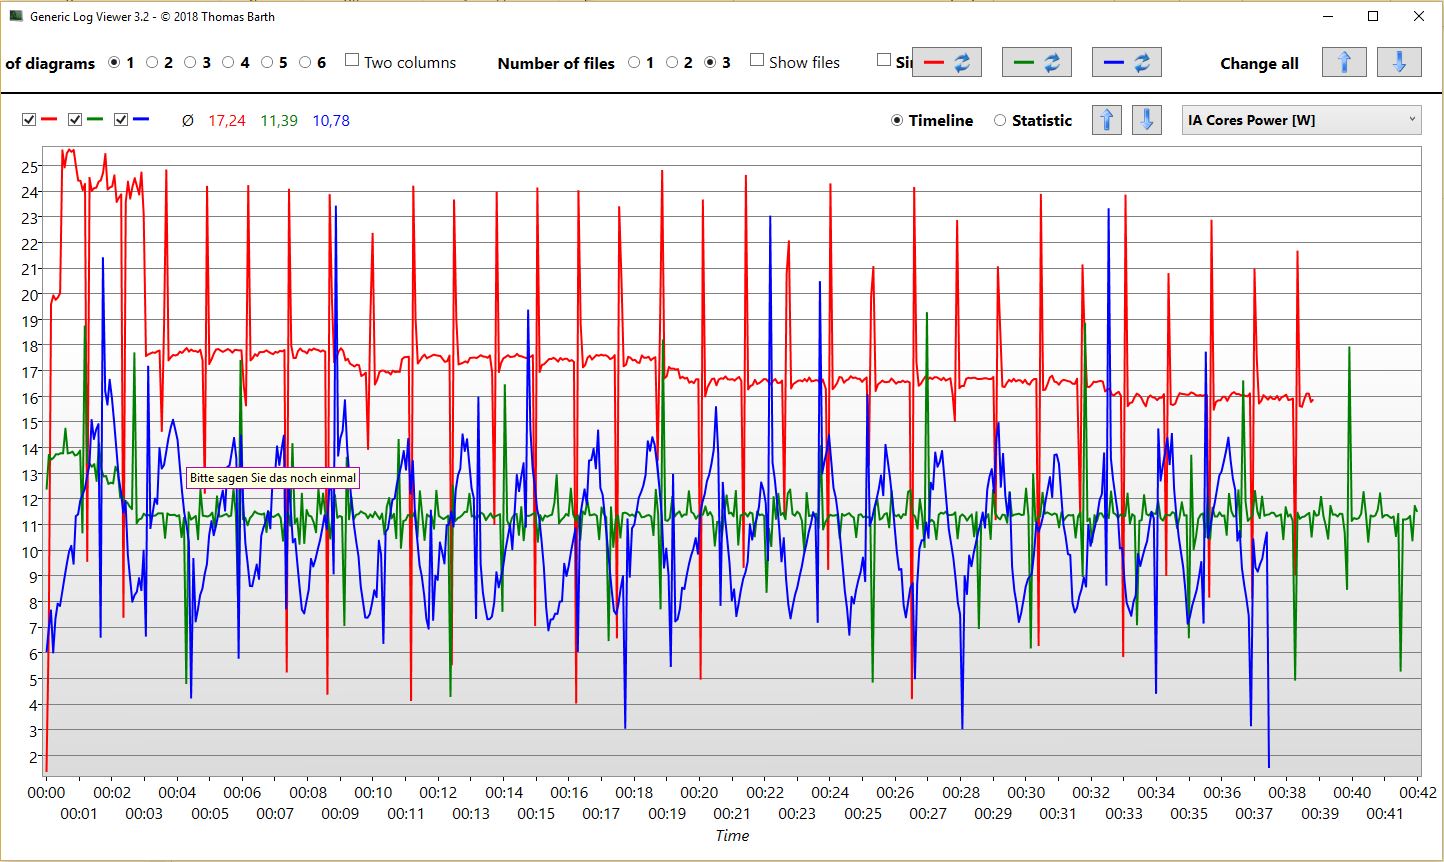
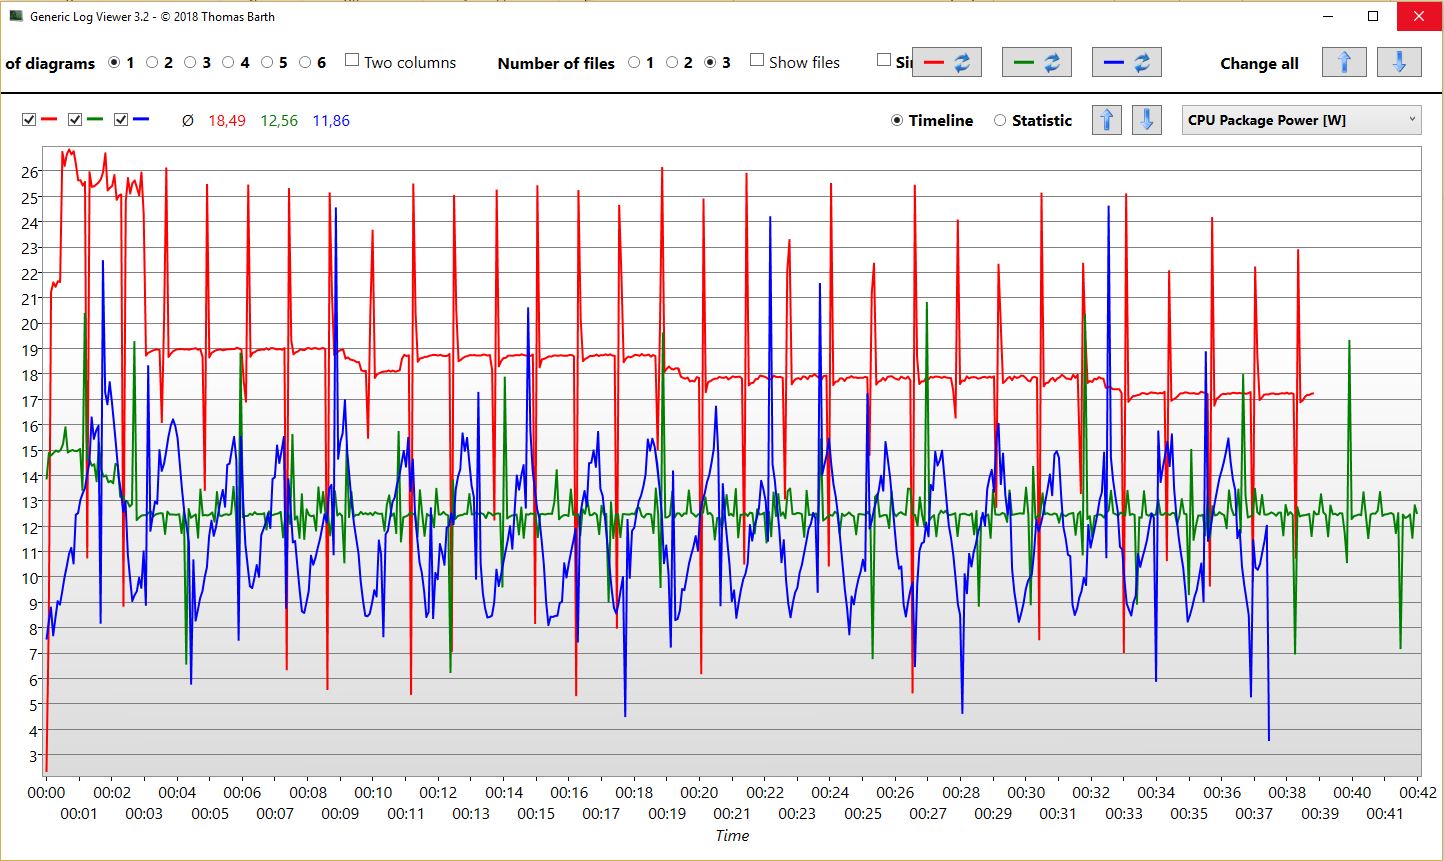
The graphics below show details of how the processors behave during the Cinebench R15 loop. Microsoft (red) works at 3 GHz during the first round and then remains at 2.6 GHz. HP (green) starts at only 2.3 GHz and then drops to 2.1 GHz. Lenovo (blue) slowly works up from 2.0 to 2.9 GHz during every round with an average of 2.3 GHz. The Microsoft's average is 2.6 GHz and that of HP is 2.1 GHz.
The temperatures of the Microsoft device (red) slowly climb up to a maximum of 81 °C (~178 °F) while the Lenovo (blue) reaches 85 °C (~185 °F). Throttling reduces the average temperatures to 72 °C (~162 °F/Microsoft) and 75 °C (~167 °F/Lenovo). HP has chosen to have a cooler case and has an average of only 69 °C while the temperature only reaches 72 °C (~162 °F) for a short period at the beginning of the loop.
This also makes the HP more energy-efficient than the Microsoft, which is why we were not surprised by the lower power consumption. Microsoft consumes up to 25 watts during the first three R15 loops. Lenovo requires 18 watts right at the beginning, but then drops its consumption to significantly below 14 watts. The average consumption of the Surface Pro 6 is 17 watts while that of the Lenovo is only 11 watts.
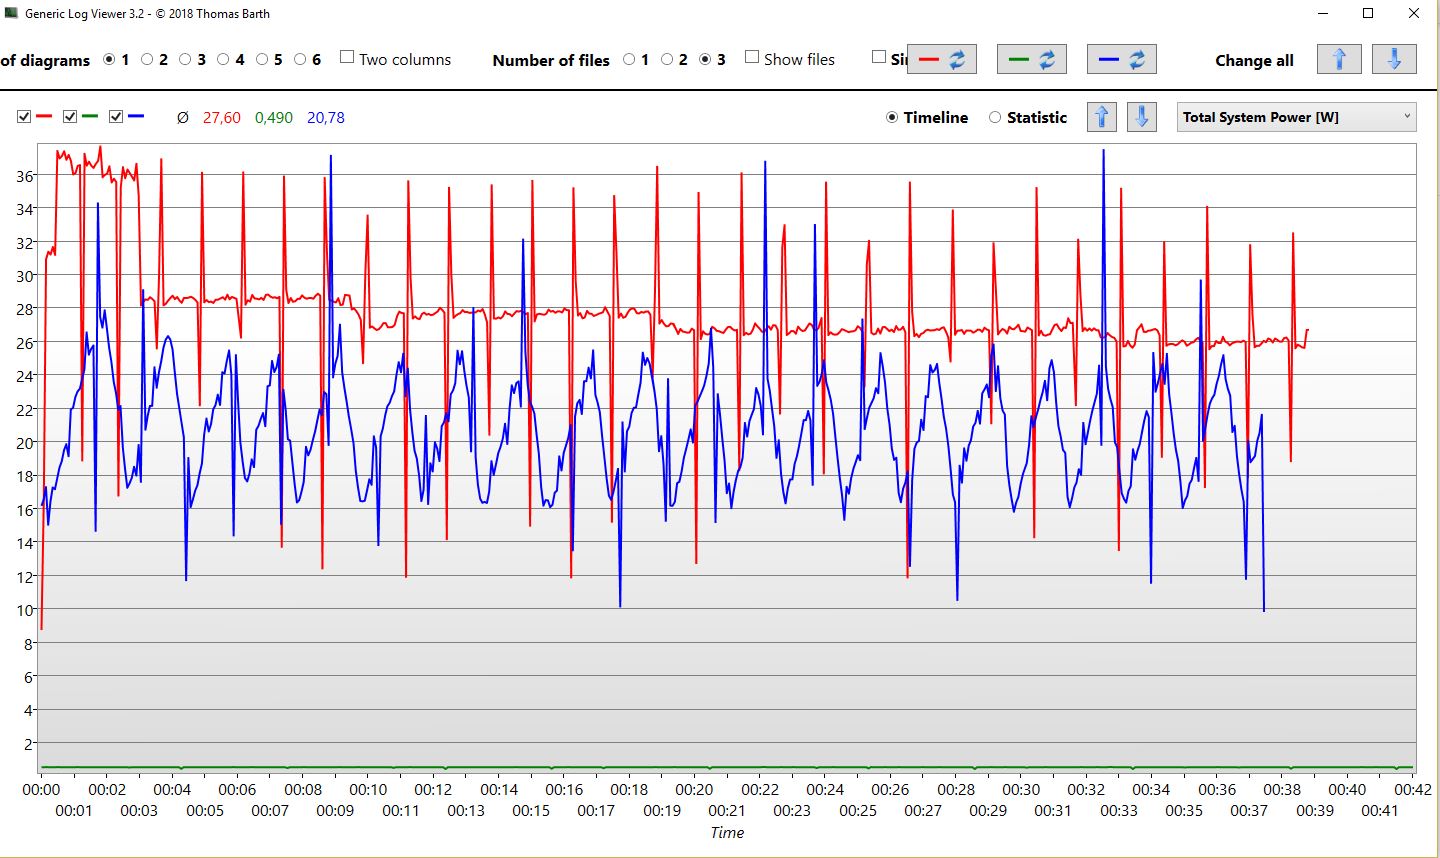
Total System Power records the maximum power consumption of the Microsoft, which is 38 watts at the beginning, but then settles to around 27 watts. The Lenovo's consumption settles down around 21 watts. Unfortunately, we made a mistake while measuring the HP's consumption here.

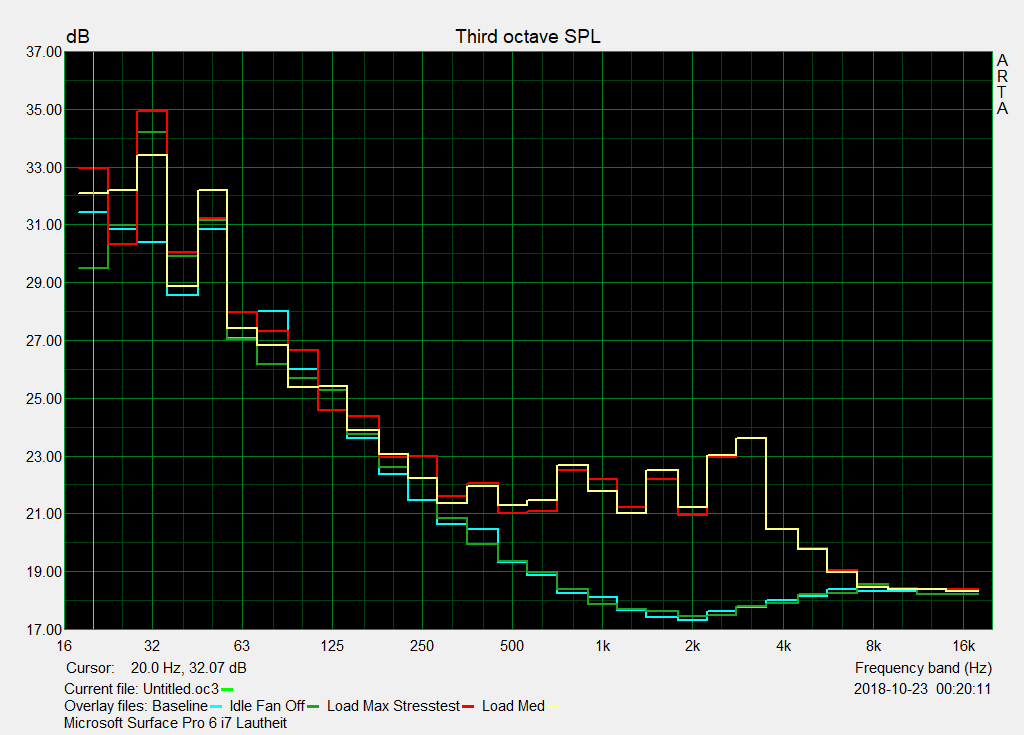
Noise and Power
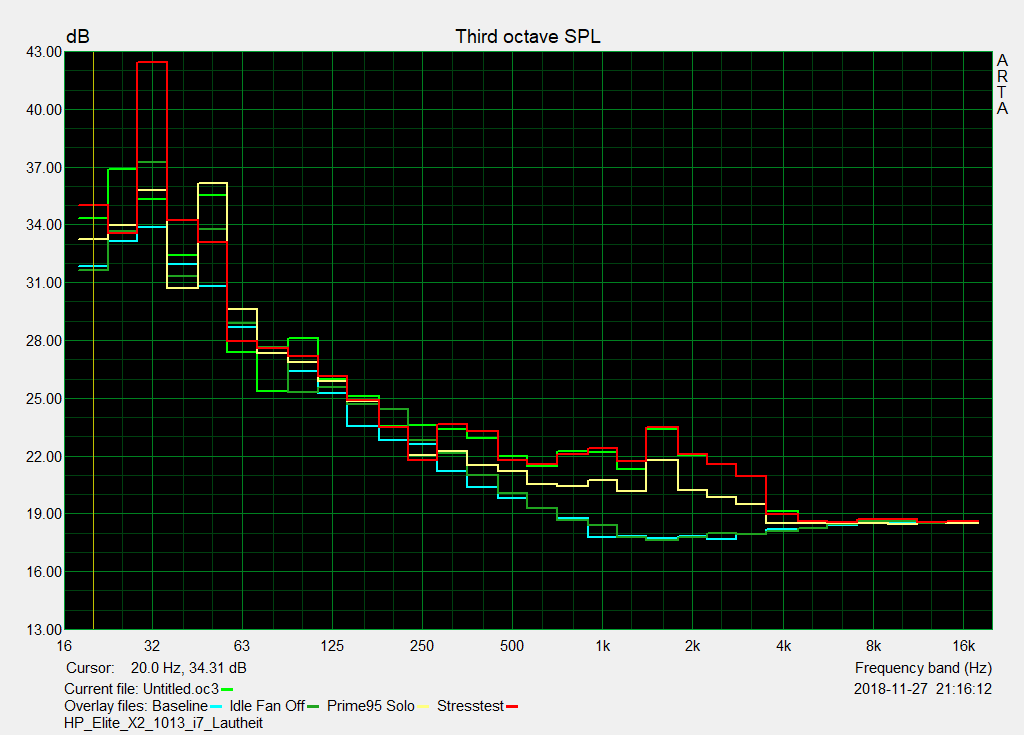
The Lenovo is clearly the quietest tablet. At only 31.5 dB(A), it is only slightly louder than normal ambient noise. The HP's fan and particularly that of the Microsoft is significantly louder, although we still would not consider 33 dB(A) as particularly loud. And the fans only reach this volume when the processor is under continuous load. Otherwise, all three devices are silent.

Microsoft tablet has the highest power consumption of our comparison field under load. This is not surprising as there is hardly any throttling. Nonetheless, Microsoft has managed to lower its minimum consumption to only 3.2 watts. We measured the power consumption during the first minute of our stress test. Because the Lenovo throttles so quickly, the power consumption is rather low. It is actually even lower in this scenario than when under average load, which we reproduce using 3DMark.
| Microsoft Surface Pro 6, Core i7, 512 GB i7-8650U, UHD Graphics 620, Toshiba KBG30ZPZ512G, IPS, 2736x1824, 12.3" | HP Elite x2 1013 G3 LTE i7 i5-8550U, UHD Graphics 620, Samsung SSD PM981 MZVLB1T0HALR, , 3000x2000, 13" | Lenovo ThinkPad X1 Tablet G3 LTE i7 i5-8550U, UHD Graphics 620, Intel SSD 600p SSDPEKKW512G8L, , 3000x2000, 13" | Dell Latitude 5290 2-in-1 i5-8350U, UHD Graphics 620, Toshiba XG5 KXG50ZNV256G, IPS, 1920x1280, 12.3" | Average Intel UHD Graphics 620 | Average of class Convertible | |
|---|---|---|---|---|---|---|
| Power Consumption | ||||||
| Idle Minimum * (Watt) | 3.2 | 4.2 | 5.2 | 3 | 3.81 ? | 4.2 ? |
| Idle Average * (Watt) | 8.7 | 5.5 | 9.2 | 7.2 | 6.94 ? | 6.87 ? |
| Idle Maximum * (Watt) | 10.4 | 7.7 | 9.6 | 10 | 8.75 ? | 8.57 ? |
| Load Average * (Watt) | 29.2 | 28 | 38 | 37.1 | 35 ? | 44.1 ? |
| Load Maximum * (Watt) | 40.8 | 34.2 | 28 | 38.2 | 47.5 ? | 66.4 ? |
* ... smaller is better
There are significant differences in the battery runtimes of these Core i7 models. While the Surface can manage 8:30 hours in our Wi-Fi test, the Lenovo (6:19 hours) and the HP (7:02 hours) are not as long-lasting. The Microsoft’s battery is 45-Wh large while that of the HP has a capacity of 48 and that of the Lenovo 42 Wh. The battery runtime of the Surface is 40 minutes shorter than that of its Core i5 version (fanless). The same can be said for the HP and its i5 model. Lenovo’s i5 version lasts 6.5 hours (395 minutes) which is only 5 minutes longer than our i7 version of the X1 tablet.
| Microsoft Surface Pro 6, Core i7, 512 GB i7-8650U, UHD Graphics 620, 45 Wh | HP Elite x2 1013 G3 LTE i7 i5-8550U, UHD Graphics 620, 48 Wh | Lenovo ThinkPad X1 Tablet G3 LTE i7 i5-8550U, UHD Graphics 620, 42 Wh | Microsoft Surface Pro 6, Core i5, 128 GB i5-8250U, UHD Graphics 620, 45 Wh | Dell Latitude 5290 2-in-1 i5-8350U, UHD Graphics 620, 42 Wh | HP Elite x2 1013 G3-2TT14EA i5-8350U, UHD Graphics 620, 50 Wh | Average of class Convertible | |
|---|---|---|---|---|---|---|---|
| Battery runtime | |||||||
| WiFi v1.3 (h) | 8.5 | 7 | 6.3 | 9.1 | 5 | 7.7 | 12.1 ? |
Verdict
Our performance comparison of high-end Windows tablets shows that HP and Lenovo cannot keep up with its competitor from Microsoft. The Surface Pro 6 with a Core i7 has higher processing power and can also keep up its performance for long periods of time.
This is great for users who do any kind of graphics rendering or image processing with large files. If you are only interested in opening and reading office files or having ten browser tabs open simultaneously, you will not need to handle continuous load.
There was one aspect of the Microsoft tablet that did not quite win us over. The competition clearly made a better choice of storage device. The Toshiba SSD in the Surface Pro 6 is noticeably slower than the Samsung and Intel SSDs in the HP and Lenovo. This results in lower system performance despite higher processing performance. However, the differences are so small (between 5 and 14%) that they should not be noticeable during everyday use.
In short: If you are interested in pure processing power, the Microsoft Surface Pro 6 i7 is the best choice for you. However, if you only need Office applications and have up to, say, 15 browser tabs open at any given time, you can safely go for an i5 version and save the surcharge for an i7 processor - no matter whether this is from Microsoft, HP or Lenovo. The performance differences between the i5 and i7 are very low to nonexistent, particularly once thermal throttling starts.
However, 16 GB of RAM would be quite useful - this is actually more important than an allegedly faster Kaby Lake Refresh Core i7 if you have 15 Chrome tabs open simultaneously.

