Notebookcheck Logo

MediaTek MT8163 V/A 1.5 GHz vs Mediatek MT8766B

MediaTek MT8163 V/A 1.5 GHz

► remove from comparison

The MediaTek MT8163 V/A is an ARM based entry-level to mid-range SoC for (Android based) tablets. It offers four ARM Cortex-A53 processor cores (quad-core) that are clocked with up to 1.5 GHz. Furthermore, an ARM Mali-T720 MP2 graphics card clocked at 600 MHz, a DDR3x32 1600Mbps memory controller, Bluetooth 4.0, 802.11 b/g/n, GPS and FM are integrated in the SoC.

The similar named MediaTek MT8163 V/B is the slower clocked version, with a CPU clock o up to 1.3 GHz (-6%) and GPU of up to 520 MHz (-13%).

The performance is situated in the entry level of 2015 and often similar to the Kirin 910T (see benchmark below).

Mediatek MT8766B

► remove from comparison  Helio MT8766B

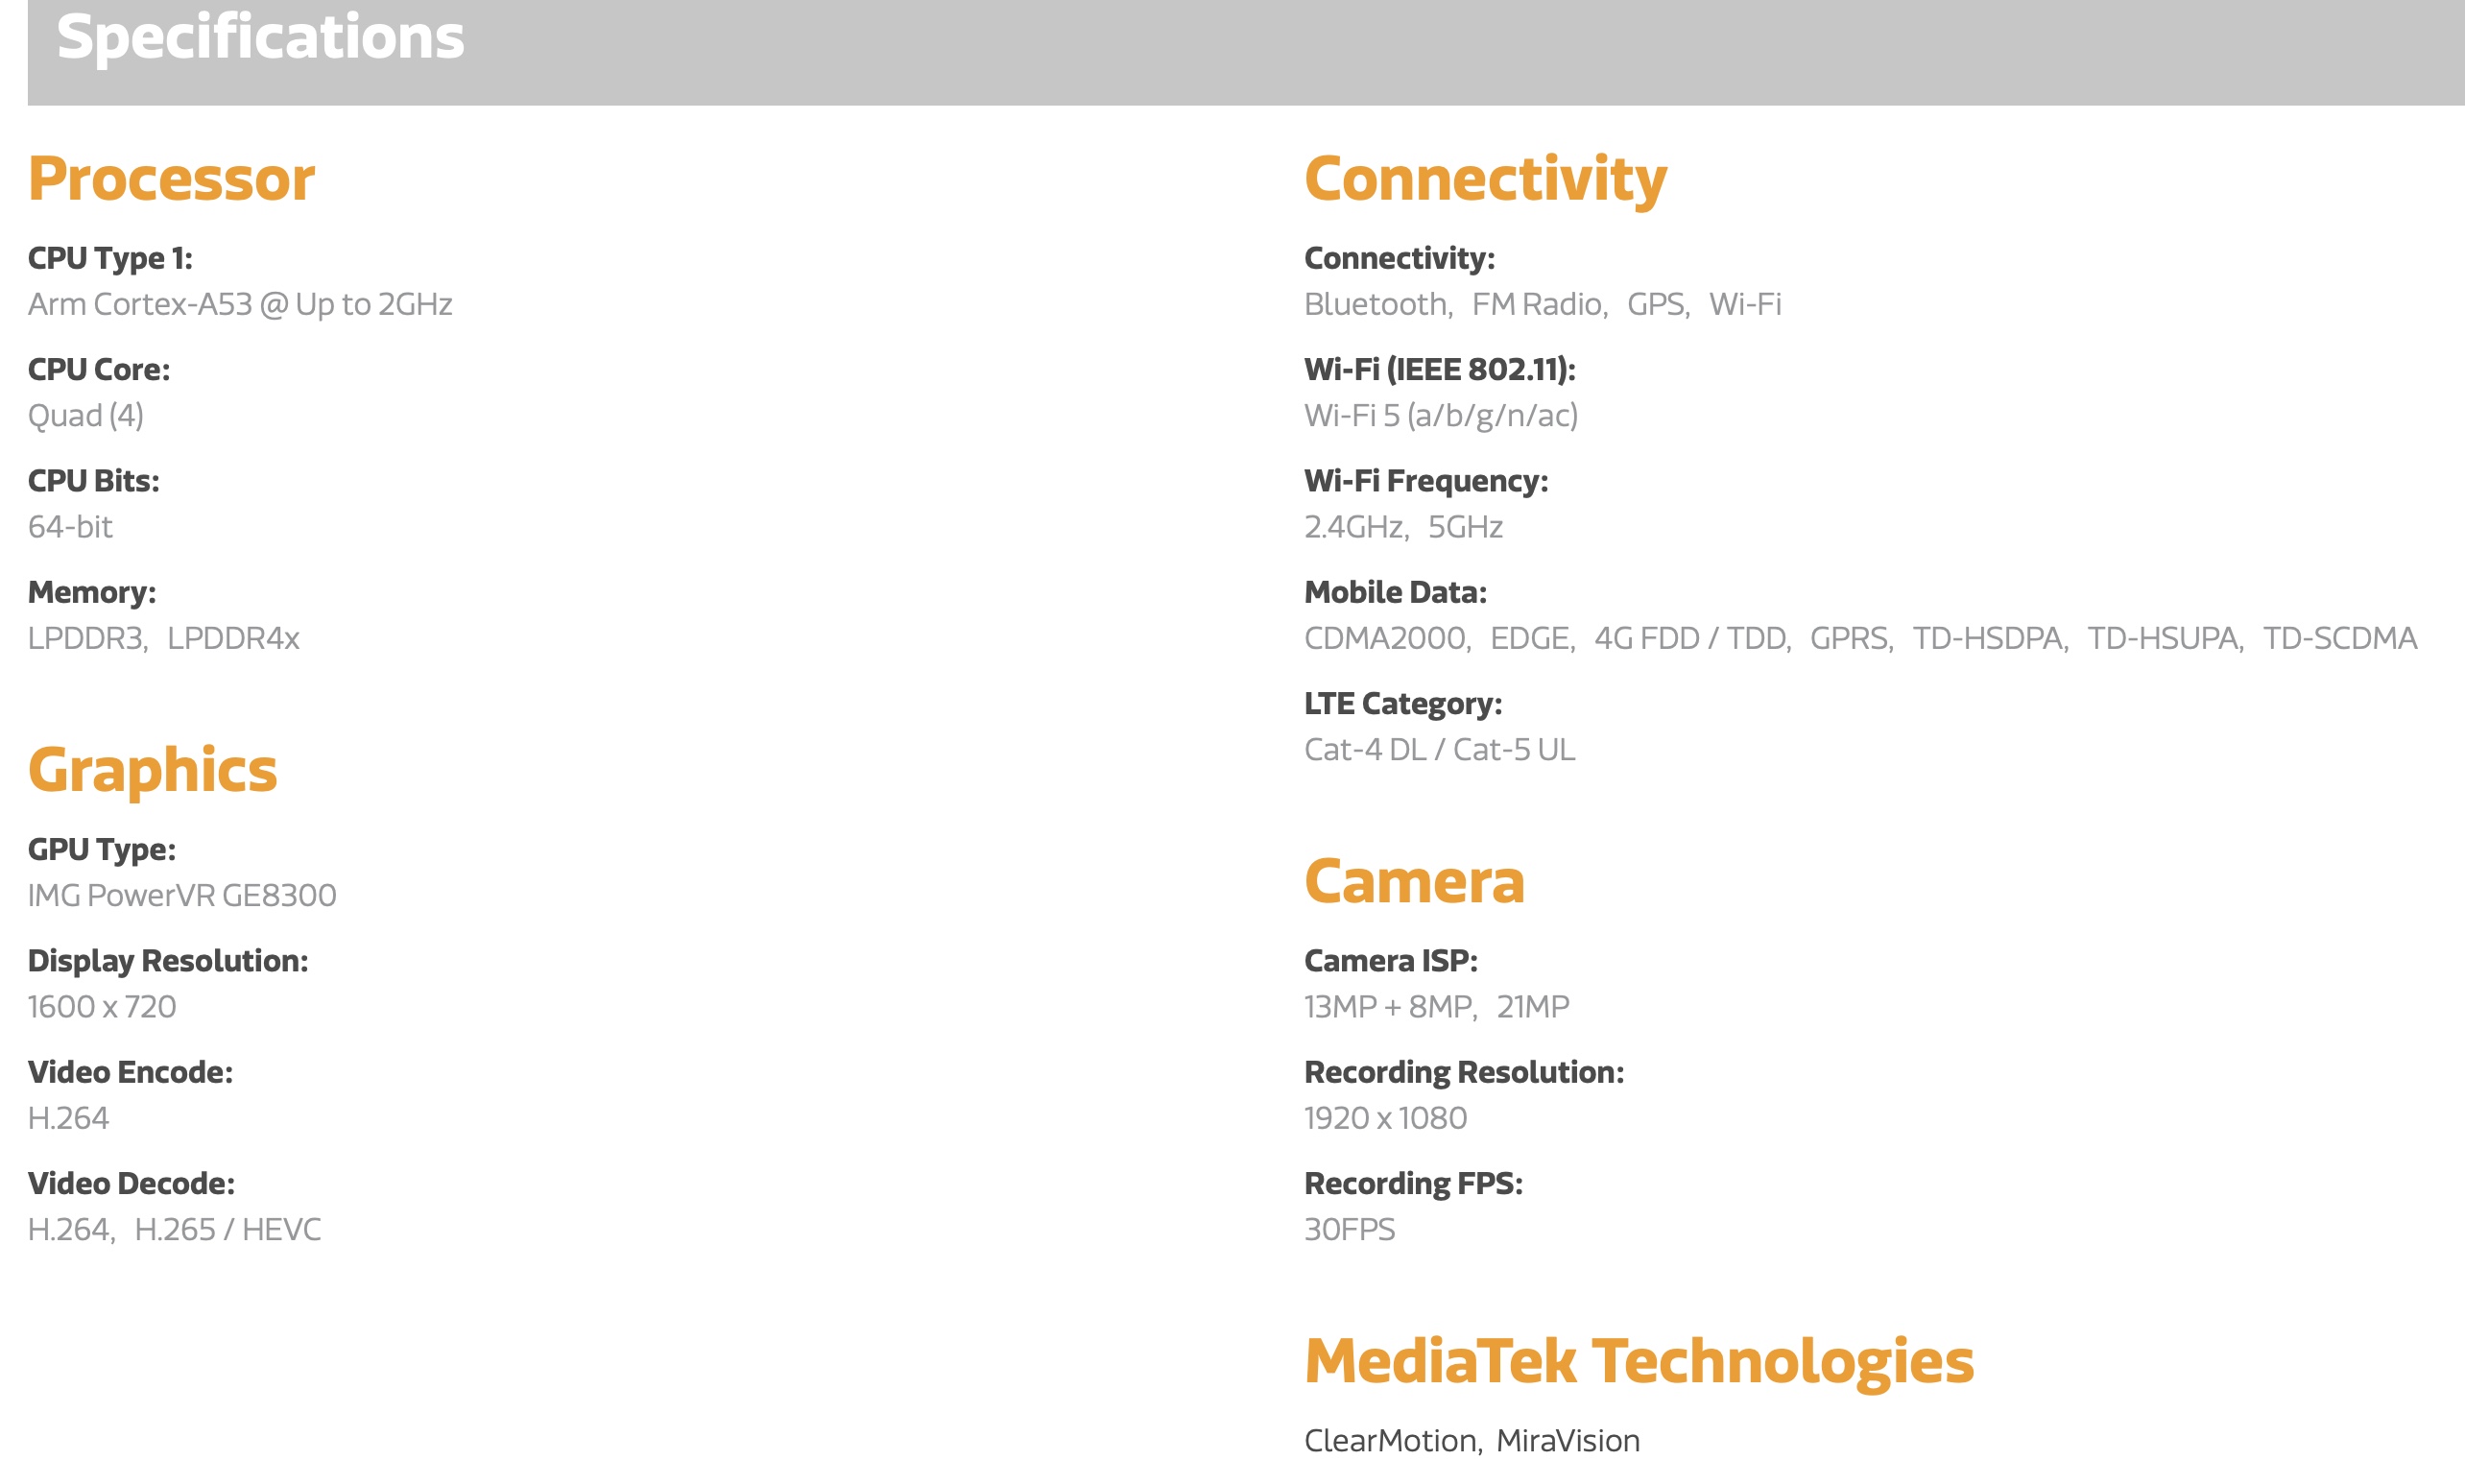
The Mediatek MT8766B is an entry-level ARM SoC for smartphones and tablets (mainly Android-based) that was introduced in 2020. It integrates four ARM Cortex-A53 cores clocked at up to 2 GHz. and a PowerVR GE6300 GPU. It looks very similar to the older Helio A20 (-200 MHz CPU core clock).

The integrated memory controller supports LPDDR4x. Furthermore, a LTE radio with Cat-4 DL (150 Mbps download) and Cat-5 UL (75 Mbps upload) and a 802.11 a/b/g/n/ac Wi-Fi 5 modem is integrated.

The SoC should be produced in the same 12nm process as the Helio A20 (most likely the same chip).

ModelMediaTek MT8163 V/A 1.5 GHzMediatek MT8766B
SeriesMediatek Mediatek MT8
CodenameCortex-A53Cortex-A53
Series: Mediatek MT8 Cortex-A53
JLQ JR510 compare1.5 - 2 GHz8 / 8 cores Cortex-A53
HiSilicon Kirin 935 compare2.2 GHz8 / 8 cores Cortex-A53
HiSilicon Kirin 659 compare2.36 GHz8 / 8 cores Cortex-A53
HiSilicon Kirin 658 compare2.35 GHz8 / 8 cores Cortex-A53
HiSilicon Kirin 655 compare2.1 GHz8 / 8 cores Cortex-A53
HiSilicon Kirin 650 compare2 GHz8 / 8 cores Cortex-A53
HiSilicon Kirin 930 compare2 GHz8 / 8 cores Cortex-A53
HiSilicon Kirin 620 compare1.2 GHz8 / 8 cores Cortex-A53
MediaTek MT8163 V/A 1.5 GHz « 1.5 GHz4 / 4 cores Cortex-A53
MediaTek MT8163 V/B 1.3 GHz compare1.3 GHz4 / 4 cores Cortex-A53
MediaTek MT8161 compare1.3 GHz4 / 4 cores Cortex-A53
Marvell Armada PXA1908 compare1.2 GHz4 / 4 cores Cortex-A53
Mediatek MT8768 compare1.5 - 2 GHz8 / 8 cores Cortex-A53
MediaTek MT8168 compare2 GHz4 / 4 cores Cortex-A53
Mediatek MT8766B « 2 GHz4 / 4 cores Cortex-A53
Clock1500 MHz2000 MHz
Cores / Threads4 / 44 / 4
Technology28 nm12 nm
FeaturesDDR3x32 memory controller 1600Mbps, T720 MP2@520MHz, internal Display up to 1366x768, HMID up to 1080p, H.265 1080p video decode, 13MP image signal processor, WiFi 802.11 a/b/g/n, embedded GPS module, Bluetooth 4.0, FM radio support, ARM TrustZonePowerVR GE8300, Dual-Channel LPDDR3 / LPDDR4X, Wi-Fi 5, Bluetooth, LTE Cat-4 DL / Cat-5 UL, H.264 Encode, H.265 Decode
iGPUARM Mali-T720 MP2 (600 MHz)PowerVR GE8300
ArchitectureARMARM
Announced
Manufacturerwww.mediatek.com

Benchmarks

Performance Rating - Geekbench 5.5, PCM Work, Sling Shot Physics, Antutu v8 CPU - Helio MT8766B
0.2 pt (13%)
3DMark - 3DMark Ice Storm Unlimited Physics
min: 8790     avg: 10063     median: 9926 (8%)     max: 11472 Points
13779 Points (12%)
3DMark - 3DMark Sling Shot Extreme (ES 3.1) Unlimited Physics
776 Points (9%)
853 Points (10%)
3DMark - 3DMark Sling Shot (ES 3.0) Unlimited Physics
min: 768     avg: 831     median: 781 (9%)     max: 945 Points
860 Points (10%)
Geekbench 5.5 - Geekbench 5.1 - 5.4 64 Bit Single-Core
133 Points (6%)
Geekbench 5.5 - Geekbench 5.1 - 5.4 64 Bit Multi-Core
455 Points (1%)
Geekbench 5.0 - Geekbench 5.0 64 Bit Single-Core
134 Points (1%)
Geekbench 5.0 - Geekbench 5.0 64 Bit Multi-Core
375 Points (1%)
Geekbench 4.4 - Geekbench 4.1 - 4.4 64 Bit Single-Core
min: 549     avg: 636     median: 636 (6%)     max: 723 Points
783 Points (8%)
Geekbench 4.4 - Geekbench 4.1 - 4.4 64 Bit Multi-Core
min: 1553     avg: 1781     median: 1781 (2%)     max: 2009 Points
2217 Points (2%)
Geekbench 4.0 - Geekbench 4.0 64 Bit Single-Core
741 Points (10%)
Geekbench 4.0 - Geekbench 4.0 64 Bit Multi-Core
2043 Points (5%)
Geekbench 3 - Geekbench 3 64 Bit Multi-Core
2112 Points (3%)
Geekbench 3 - Geekbench 3 64 Bit Single-Core
722 Points (11%)
Geekbench 2 - 32 Bit - Geekbench Stream
725 Points (6%)
Geekbench 2 - 32 Bit - Geekbench Memory
1727 Points (16%)
Geekbench 2 - 32 Bit - Geekbench Floating Point
3305 Points (6%)
Geekbench 2 - 32 Bit - Geekbench Integer
1865 Points (4%)
Geekbench 2 - 32 Bit - Geekbench Total Score
2227 Points (6%)
Mozilla Kraken 1.1 - Kraken 1.1 Total Score *
min: 12550     avg: 14061     median: 14060.5 (16%)     max: 15571 ms
11505 ms (13%)
Sunspider - Sunspider 1.0 Total Score *
1609 ms (18%)
Octane V2 - Octane V2 Total Score
min: 2972     avg: 3261     median: 3261 (3%)     max: 3550 Points
3920 Points (4%)
WebXPRT 3 - WebXPRT 3 Score
27 Points (6%)
AnTuTu v6 - AnTuTu v6 Total Score
min: 33452     avg: 37816     median: 37815.5 (13%)     max: 42179 Points
AnTuTu v7 - AnTuTu v7 MEM
min: 4042     avg: 4277     median: 4276.5 (13%)     max: 4511 Points
AnTuTu v7 - AnTuTu v7 UX
min: 13724     avg: 15979     median: 15979 (20%)     max: 18234 Points
AnTuTu v7 - AnTuTu v7 GPU
min: 2431     avg: 2672     median: 2671.5 (1%)     max: 2912 Points
AnTuTu v7 - AnTuTu v7 CPU
min: 19354     avg: 21013     median: 21013 (13%)     max: 22672 Points
AnTuTu v7 - AnTuTu v7 Total Score
min: 39551     avg: 43893     median: 43892.5 (8%)     max: 48234 Points
AnTuTu v8 - AnTuTu v8 UX
15424 Points (13%)
AnTuTu v8 - AnTuTu v8 MEM
24878 Points (20%)
AnTuTu v8 - AnTuTu v8 GPU
4722 Points (1%)
AnTuTu v8 - AnTuTu v8 CPU
30304 Points (11%)
AnTuTu v8 - AnTuTu v8 Total Score
75328 Points (7%)
PCMark for Android - PCM f. Android Computer Vision
2133 Points (11%)
2761 Points (15%)
PCMark for Android - PCM f. Android Storage
1923 Points (4%)
6844 Points (15%)
PCMark for Android - PCM f. Android Work Score 2.0
min: 3071     avg: 3328     median: 3424 (22%)     max: 3489 Points
4808 Points (31%)
PCMark for Android - PCM f. Android Work Score
4576 Points (23%)
6431 Points (32%)

Average Benchmarks MediaTek MT8163 V/A 1.5 GHz → 100% n=11

Average Benchmarks Mediatek MT8766B → 145% n=11

- Range of benchmark values for this graphics card
- Average benchmark values for this graphics card
* Smaller numbers mean a higher performance
1 This benchmark is not used for the average calculation

Add one or more devices and compare

In the following list you can select (and also search for) devices that should be added to the comparison. You can select more than one device.

restrict list:

show all (including archived), 2024, 2023
v1.26
log 04. 16:21:37

#0 checking url part for id 8109 +0s ... 0s

#1 checking url part for id 13125 +0s ... 0s

#2 not redirecting to Ajax server +0s ... 0s

#3 did not recreate cache, as it is less than 5 days old! Created at Sat, 04 May 2024 05:40:37 +0200 +0.001s ... 0.001s

#4 composed specs +0.054s ... 0.055s

#5 did output specs +0s ... 0.055s

#6 getting avg benchmarks for device 8109 +0.003s ... 0.058s

#7 got single benchmarks 8109 +0.015s ... 0.073s

#8 getting avg benchmarks for device 13125 +0.011s ... 0.084s

#9 got single benchmarks 13125 +0.011s ... 0.095s

#10 got avg benchmarks for devices +0s ... 0.095s

#11 min, max, avg, median took s +0.147s ... 0.241s

#12 return log +0.036s ... 0.277s

Please share our article, every link counts!
> Expert Reviews and News on Laptops, Smartphones and Tech Innovations > Benchmarks / Tech > Processor Comparison - Head 2 Head
Redaktion, 2017-09- 8 (Update: 2023-07- 1)