Notebookcheck Logo

Apple M1 vs Apple A12Z Bionic vs Apple A9X

Apple M1

► remove from comparison Apple M1

The Apple M1 is a System on a Chip (SoC) from Apple that is found in the late 2020 MacBook Air, MacBook Pro 13, and Mac Mini. It offers 8 cores divided in four performance cores and four power-efficiency cores. The big cores offer 192 KB instruction cache, 128 KB data cache, and 12 MB shared L2 cache. According to Apple the performance of these cores should be better than anything on the market (in late 2020). The four efficiency cores are a lot smaller and offer only 128 KB instruction cache, 64 KB data cache, and 4 MB shared cache. The efficiency cores (E cluster) clock with 600 - 2064 MHz, the performance cores (P cluster) with 600 - 3204 MHz.

The M1 is available in two TDP variants, a passive cooled 10 Watt variant for the MacBook Air and an active cooled faster variant for the MacBook Pro 13 and Mac Mini. Those should offer a better-sustained performance according to Apple.

The integrated graphics card in the M1 offers 8 cores (7 cores in the entry MacBook Air) and a peak performance of 2.6 teraflops. Apple claims that it is faster than any other iGPU at the time of announcement.

Furthermore, the SoC integrates a fast 16 core neural engine with a peak performance of 11 TOPS (for AI hardware acceleration), a secure enclave (e.g., for encryption), a unified memory architecture, Thunderbolt / USB 4 controller, an ISP, and media de- and encoders.

The Apple M1 includes 16 billion transistors (up from the 10 billion of the A12Z Bionic and therefore double the amount of a Tiger Lake-U chip like the i7-1185G7) and is manufactured in 5nm at TSMC.

Apple A12Z Bionic

► remove from comparison Apple A12Z Bionic

The Apple A12Z Bionic is a System on a Chip (SoC) from Apple that is found in the iPad Pro 11 and 12.5-inch from 2020. It offers 8 cores divided in four performance cores and four power efficiency cores (up from the 6 cores in the A12 of the iPhone XS). The difference to the older Apple A12X Bionic in the iPad Pro 2018 models seems to be an additional GPU core. Regarding CPU Apple noted: "Enhanced thermal design means higher peak and longer sustained performance". More details were not published by Apple, so it may be even the same chip with an additional enabled GPU core. On the other hand, it could be also manufactured in an improved 7nm (EUV?) process and offer higher clock rates. As Apple states no performance improvements on the CPU side, we don't expect big gains. However, the A12X was a very fast ARM based SoC and currently there is no competitor in the Android space that should beat the performance.

The chip also includes the M12 Motion co-processor and a Neural Engine with 8 cores for up to 5 trillion operations per second (unverified, numbers from the A12X).

The Apple A12X included 10 billion transistors (A12 6.9 billion) and the A12Z should be therefore offer a similar amount. This makes it a quite big chip, especially compared to the Snapdragon 835 (3 Billion) or a Skylake desktop quad-core SoC (1.75 Billion).

Apple A9X

► remove from comparison Apple A9X

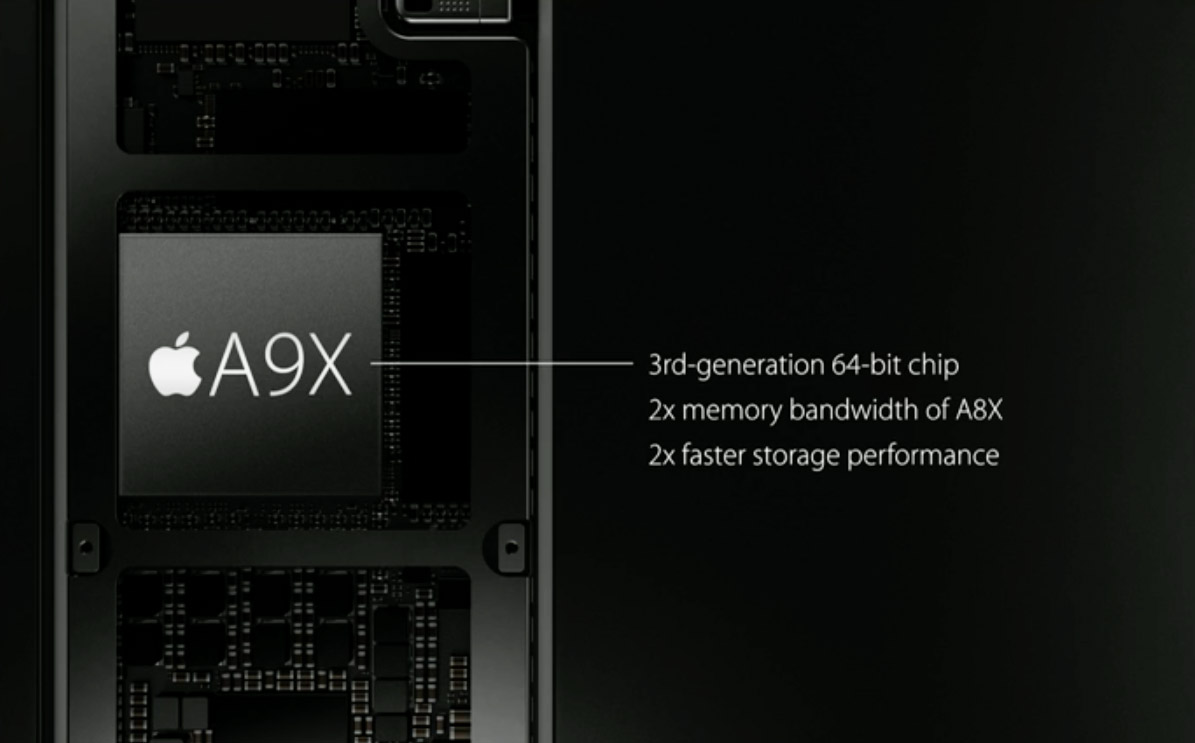
The Apple A9X is a high-end ARM SoC (System on a Chip) that was announced in September 2015 in the iPad Pro. Technical details are scarce, what we know is that it is based on the third generation of Apples 64 Bit architecture (Cyclone 3) and manufactured with a "new transistor technology" (14 or 16nm FINFet probably).

The performance of the A9X did improve a lot according to Apple. The CPU part should be 1.8x faster and the GPU part even 2x faster than the already speedy Apple A8X. Apple even stated in the keynote of the iPad Pro that the performance should be "faster than 80% of portable PCs shipped in the last 12 month". Furthermore the iPad Pro now features a 2x higher memory bandwidth (DDR4?) and 2x faster storage performance. The integrated graphics card will most likely be a PowerVR design again (Power VR Series7?).

ModelApple M1Apple A12Z BionicApple A9X
SeriesApple Apple M-SeriesApple Apple A-SeriesApple
Series: Cyclone 3
Apple M1 Max2.06 - 3.22 GHz10 / 10 cores48 MB L3
Apple M1 Pro2.06 - 3.22 GHz10 / 10 cores24 MB L3
Apple M1 Pro 8-Core2.06 - 3.22 GHz8 / 8 cores16 MB L3
Apple M1 « 2.06 - 3.22 GHz8 / 8 cores8 MB L3
Apple A12Z Bionic « - 2.49 GHz8 / 8 cores Vortex, Tempest
Apple A12X Bionic - 2.49 GHz8 / 8 cores Vortex, Tempest
Apple A9X « 2.26 GHz2 / 2 cores Cyclone 3
Apple A91.8 GHz2 / 2 cores Cyclone 3
Clock2064 - 3220 MHz <=2490 MHz2260 MHz
L1 Cache2 MB2 MB
L2 Cache16 MB8 MB
L3 Cache8 MB
Cores / Threads8 / 88 / 82 / 2
Transistors16000 Million10000 Million
Technology5 nm7 nm14/16 nm
FeaturesARMv8 Instruction SetARMv8 Instruction SetARMv8 Instruction Set
iGPUApple M1 8-Core GPUApple A12Z Bionic GPUApple A9X / PowerVR Series 7XT
ArchitectureARMARMARM
Announced
CodenameVortex, TempestCyclone 3
Die Size147 mm2

Benchmarks

Cinebench 2024 - CB24 CPU Single Core
100%
1 M1 +
110 Points (76%)
Cinebench 2024 - CB24 CPU Multi Core
100%
1 M1 +
444 Points (8%)
Cinebench R23 - Cinebench R23 Multi Core
100%
1 M1 +
min: 7409     avg: 7728     median: 7800.5 (7%)     max: 7830 Points
Cinebench R23 - Cinebench R23 Single Core
100%
1 M1 +
min: 1496     avg: 1512     median: 1514.5 (64%)     max: 1520 Points
Cinebench R20 - Cinebench R20 CPU (Single Core)
100%
1 M1 +
min: 401     avg: 403     median: 402.5 (45%)     max: 406 Points
Cinebench R20 - Cinebench R20 CPU (Multi Core)
100%
1 M1 +
min: 1863     avg: 2040     median: 2093.5 (5%)     max: 2109 Points
Cinebench R15 - Cinebench R15 CPU Multi 64 Bit
100%
1 M1 +
min: 1020     avg: 1063     median: 1072 (7%)     max: 1087 Points
Cinebench R15 - Cinebench R15 CPU Single 64 Bit
100%
1 M1 +
min: 206     avg: 207.3     median: 208 (63%)     max: 208 Points
7-Zip 18.03 - 7-Zip 18.03 Multli Thread 4 runs
100%
1 M1 +
34614 MIPS (20%)
7-Zip 18.03 - 7-Zip 18.03 Single Thread 4 runs
100%
1 M1 +
5441 MIPS (65%)
Blender - Blender 3.3 Classroom CPU *
100%
1 M1 +
964 Seconds (12%)
Blender - Blender 2.79 BMW27 CPU *
100%
1 M1 +
min: 412     avg: 561     median: 561 (4%)     max: 710 Seconds
R Benchmark 2.5 - R Benchmark 2.5 *
100%
1 M1 +
0.7 sec (16%)
3DMark - 3DMark Ice Storm Unlimited Physics
min: 40279     avg: 40289     median: 40289 (34%)     max: 40299 Points
39%
1 A9X +
min: 15473     avg: 15748     median: 15748 (13%)     max: 16023 Points
3DMark - 3DMark Sling Shot Extreme (ES 3.1) Unlimited Physics
100%
1 M1 +
2711 Points (11%)
63%
1 A9X +
1713 Points (7%)
3DMark - 3DMark Sling Shot (ES 3.0) Unlimited Physics
100%
1 M1 +
min: 1956     avg: 3137     median: 3136.5 (36%)     max: 4317 Points
53%
1 A9X +
1649 Points (19%)
Geekbench 6.2 - Geekbench 6.2 Single-Core
100%
1 M1 +
2363 Points (65%)
Geekbench 6.2 - Geekbench 6.2 Multi-Core
100%
1 M1 +
8622 Points (34%)
Geekbench 5.5 - Geekbench 5.1 - 5.4 64 Bit Single-Core
100%
1 M1 +
min: 1710     avg: 1729     median: 1730 (73%)     max: 1745 Points
min: 1117     avg: 1122     median: 1122 (47%)     max: 1127 Points
Geekbench 5.5 - Geekbench 5.1 - 5.4 64 Bit Multi-Core
100%
1 M1 +
min: 7034     avg: 7501     median: 7578 (14%)     max: 7710 Points
min: 4707     avg: 4710     median: 4709.5 (8%)     max: 4712 Points
Geekbench 4.4 - Geekbench 4.1 - 4.4 64 Bit Single-Core
100%
1 A9X +
3097 Points (31%)
Geekbench 4.4 - Geekbench 4.1 - 4.4 64 Bit Multi-Core
100%
1 A9X +
5284 Points (6%)
Geekbench 3 - Geekbench 3 64 Bit Multi-Core
100%
1 A9X +
min: 5268     avg: 5344     median: 5343.5 (8%)     max: 5419 Points
Geekbench 3 - Geekbench 3 64 Bit Single-Core
100%
1 A9X +
min: 3079     avg: 3140     median: 3139.5 (47%)     max: 3200 Points
Linpack Android / IOS - Linpack Multi Thread
100%
1 A9X +
min: 1550     avg: 1560     median: 1559.5 (53%)     max: 1569 MFLOPS
Linpack Android / IOS - Linpack Single Thread
100%
1 A9X +
855 MFLOPS (84%)
Mozilla Kraken 1.1 - Kraken 1.1 Total Score *
100%
M1 +
min: 418     avg: 473.8     median: 483 (1%)     max: 516 ms
99%
A9X +
min: 1499     avg: 1523     median: 1522.5 (2%)     max: 1546 ms
Sunspider - Sunspider 1.0 Total Score *
100%
M1 +
min: 65.2     avg: 75.9     median: 76.4 (1%)     max: 86.1 ms
125 ms (1%)
99%
A9X +
181 ms (2%)
Sunspider - Sunspider 0.9.1 Total Score *
114 ms (1%)
Octane V2 - Octane V2 Total Score
100%
M1 +
min: 62055     avg: 63340     median: 62589.5 (56%)     max: 66974 Points
min: 42372     avg: 42618     median: 42425 (38%)     max: 43057 Points
32%
A9X +
min: 19621     avg: 19737     median: 19736.5 (18%)     max: 19852 Points
WebXPRT 4 - WebXPRT 4 Score
100%
1 M1 +
189 Points (54%)
WebXPRT 3 - WebXPRT 3 Score
100%
M1 +
min: 216     avg: 266.3     median: 280.5 (58%)     max: 304 Points
min: 140     avg: 158.3     median: 141 (29%)     max: 194 Points
36%
A9X +
101 Points (21%)
AnTuTu v6 - AnTuTu v6 Total Score
100%
1 A9X +
min: 168840     avg: 176593     median: 176593 (60%)     max: 184346 Points
AnTuTu v7 - AnTuTu v7 MEM
100%
1 A9X +
7954 Points (24%)
AnTuTu v7 - AnTuTu v7 UX
100%
1 A9X +
38538 Points (47%)
AnTuTu v7 - AnTuTu v7 GPU
100%
1 A9X +
89250 Points (28%)
AnTuTu v7 - AnTuTu v7 CPU
100%
1 A9X +
81273 Points (50%)
AnTuTu v7 - AnTuTu v7 Total Score
100%
1 A9X +
217015 Points (38%)
AnTuTu v8 - AnTuTu v8 UX
100%
1 M1 +
min: 104389     avg: 105297     median: 105297 (88%)     max: 106205 Points
min: 77253     avg: 77589     median: 77588.5 (65%)     max: 77924 Points
AnTuTu v8 - AnTuTu v8 MEM
100%
1 M1 +
min: 110874     avg: 111266     median: 111266 (90%)     max: 111658 Points
min: 74998     avg: 92841     median: 92841 (75%)     max: 110684 Points
AnTuTu v8 - AnTuTu v8 GPU
100%
1 M1 +
min: 533978     avg: 539206     median: 539206 (99%)     max: 544434 Points
min: 373781     avg: 375589     median: 375589 (69%)     max: 377397 Points
AnTuTu v8 - AnTuTu v8 CPU
100%
1 M1 +
min: 267169     avg: 271808     median: 271808 (98%)     max: 276446 Points
min: 185841     avg: 186014     median: 186014 (67%)     max: 186186 Points
AnTuTu v8 - AnTuTu v8 Total Score
100%
1 M1 +
min: 1017190     avg: 1027580     median: 1027580 (99%)     max: 1037960 Points
min: 712218     avg: 732032     median: 732032 (71%)     max: 751846 Points
Antutu v9 - AnTuTu v9 Total Score
100%
1 M1 +
min: 1040910     avg: 1113810     median: 1113810 (67%)     max: 1186710 Points
Antutu v9 - AnTuTu v9 CPU
100%
1 M1 +
min: 244643     avg: 254253     median: 254252 (70%)     max: 263862 Points
PassMark PerformanceTest Mobile V1 - PerformanceTest Mobile V1 CPU Tests
100%
1 A9X +
min: 58793     avg: 59226     median: 59226 (8%)     max: 59659 Points
CrossMark - CrossMark Overall
100%
1 M1 +
min: 1266     avg: 1301     median: 1283 (49%)     max: 1355 Points
Power Consumption - Cinebench R15 Multi Power Consumption - external Monitor *
100%
1 M1 +
27.2 Watt (5%)
Power Consumption - Geekbench 5.5 Power Consumption 150cd *
100%
1 M1 +
min: 8.23     avg: 8.7     median: 8.5 (4%)     max: 9.49 Watt
Power Consumption - Idle Power Consumption - external Monitor *
100%
1 M1 +
3 Watt (2%)
Power Consumption - Idle Power Consumption 150cd 1min *
100%
1 M1 +
min: 2.29     avg: 2.9     median: 3.1 (3%)     max: 3.22 Watt
Power Consumption - Cinebench R15 Multi Power Efficiency - external Monitor
100%
1 M1 +
37.5 Points per Watt (28%)

Average Benchmarks Apple M1 → 100% n=4

Average Benchmarks Apple A12Z Bionic → 79% n=4

Average Benchmarks Apple A9X → 66% n=4

- Range of benchmark values for this graphics card
- Average benchmark values for this graphics card
* Smaller numbers mean a higher performance
1 This benchmark is not used for the average calculation

v1.26
log 19. 01:00:45

#0 checking url part for id 12937 +0s ... 0s

#1 checking url part for id 11937 +0s ... 0s

#2 checking url part for id 7087 +0s ... 0s

#3 not redirecting to Ajax server +0s ... 0s

#4 did not recreate cache, as it is less than 5 days old! Created at Fri, 17 May 2024 11:21:47 +0200 +0.001s ... 0.001s

#5 composed specs +0.063s ... 0.064s

#6 did output specs +0s ... 0.064s

#7 getting avg benchmarks for device 12937 +0.003s ... 0.067s

#8 got single benchmarks 12937 +0.02s ... 0.088s

#9 getting avg benchmarks for device 11937 +0.004s ... 0.091s

#10 got single benchmarks 11937 +0.009s ... 0.1s

#11 getting avg benchmarks for device 7087 +0.003s ... 0.103s

#12 got single benchmarks 7087 +0.009s ... 0.112s

#13 got avg benchmarks for devices +0s ... 0.112s

#14 min, max, avg, median took s +0.206s ... 0.318s

#15 return log +0s ... 0.318s

Please share our article, every link counts!
> Expert Reviews and News on Laptops, Smartphones and Tech Innovations > Benchmarks / Tech > Processor Comparison - Head 2 Head
Redaktion, 2017-09- 8 (Update: 2023-07- 1)