Notebookcheck Logo

HiSilicon Kirin 658 vs Mediatek MT8768

HiSilicon Kirin 658

► remove from comparison  Kirin 658

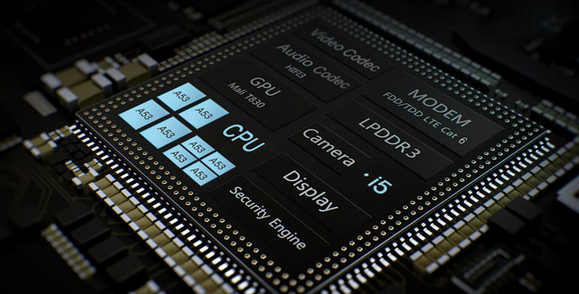
The HiSilicon Kirin 658 is an ARM-based octa-core SoC for mid-range smartphones and tablets. It was announced early 2017 and features eight ARM Cortex-A53 cores. Four cores can be clocked with up to 1.7 GHz (power saving cores) and four with up to 2.35 GHz (performance cores). The difference to the older Kirin 650 and Kirin 655 SoCs is the higher clock speed of the performance cores (2.35 versus 2.1 and 2.0 GHz).

Furthermore, a ARM Mali-T830 MP2 graphics card (at 900 MHz with 40.8 GFLOPS), a 64-Bit LPDDR3 memory controller and a dual-sim capable LTE Cat. 6 (max. 300 MBit/s and GSM, WCDMA, UMTS, HSPA+) radio are integrated in the SoC. The processor performance can be compared with the older Kirin 930 and therefore sufficient for daily usage as browsing and non demanding apps. High-end SoCs with Cortex-A57 or A72 cores however should be noticeably faster. The SoC is produced in a modern 16nm FinFET process and is therefore very power efficient.

Mediatek MT8768

► remove from comparison Mediatek Helio MT8768

The MediatekMT8768 is an entry level ARM SoC for smartphones (mainly Android based) and tablets that was introduced in early 2020. It is most likely manufactured in a 12 nm FinFET process (like the similar Helio A25) and is equipped with 8 ARM Cortex-A53 CPU cores divided in two clusters. A performance cluster with four cores clocked at up to 2 GHz and a efficiency cluster clocked at up to 1.5 GHz.

Furthermore, the SoC integrates a LTE modem, a LPDDR3 / LPDDR4x-1600 memory controller, a IMG PowerVR GE8320 graphics card and a 1080p30 video de- and encoder (H.265 decoding, H.264 encoding).

ModelHiSilicon Kirin 658Mediatek MT8768
Series Mediatek Mediatek MT8
CodenameCortex-A53Cortex-A53
Series: Mediatek MT8 Cortex-A53
JLQ JR510 compare1.5 - 2 GHz8 / 8 cores Cortex-A53
HiSilicon Kirin 935 compare2.2 GHz8 / 8 cores Cortex-A53
HiSilicon Kirin 659 compare2.36 GHz8 / 8 cores Cortex-A53
HiSilicon Kirin 658 « 2.35 GHz8 / 8 cores Cortex-A53
HiSilicon Kirin 655 compare2.1 GHz8 / 8 cores Cortex-A53
HiSilicon Kirin 650 compare2 GHz8 / 8 cores Cortex-A53
HiSilicon Kirin 930 compare2 GHz8 / 8 cores Cortex-A53
HiSilicon Kirin 620 compare1.2 GHz8 / 8 cores Cortex-A53
MediaTek MT8163 V/A 1.5 GHz compare1.5 GHz4 / 4 cores Cortex-A53
MediaTek MT8163 V/B 1.3 GHz compare1.3 GHz4 / 4 cores Cortex-A53
MediaTek MT8161 compare1.3 GHz4 / 4 cores Cortex-A53
Marvell Armada PXA1908 compare1.2 GHz4 / 4 cores Cortex-A53
Mediatek MT8768 « 1.5 - 2 GHz8 / 8 cores Cortex-A53
MediaTek MT8168 compare2 GHz4 / 4 cores Cortex-A53
Mediatek MT8766B compare2 GHz4 / 4 cores Cortex-A53
Clock2350 MHz1500 - 2000 MHz
Cores / Threads8 / 88 / 8
Technology16 nm
FeaturesARMv8-ISA, Mali-T830 MP2, Dual SIM LTE (Cat. 6), LPDDR3 Memory ControllerLTE Cat-7 DL / Cat-13 UL, LPDDR3 / LPDDR4x Memory Controller, 1080p30 H.264 Video Encoder, H.264 / H.265 1080p30 Decoder
iGPUARM Mali-T830 MP2 (900 MHz)PowerVR GE8320 ( - 650 MHz)
ArchitectureARMARM
Announced
Manufacturerwww.mediatek.com

Benchmarks

Performance Rating - Geekbench 5.5, PCM Work, Sling Shot Physics, Antutu v8 CPU - Helio MT8768
0.3 pt (22%)
3DMark - 3DMark Ice Storm Unlimited Physics
13510 Points (11%)
min: 11228     avg: 11876     median: 11431 (10%)     max: 12969 Points
3DMark - 3DMark Sling Shot Extreme (ES 3.1) Unlimited Physics
1608 Points (6%)
min: 957     avg: 1390     median: 1251.5 (5%)     max: 2101 Points
3DMark - 3DMark Sling Shot (ES 3.0) Unlimited Physics
1554 Points (18%)
min: 969     avg: 1146     median: 1144 (13%)     max: 1328 Points
Geekbench 6.2 - Geekbench 6.2 Single-Core
185 Points (5%)
Geekbench 6.2 - Geekbench 6.2 Multi-Core
848 Points (3%)
Geekbench 5.5 - Geekbench 5.1 - 5.4 64 Bit Single-Core
min: 135     avg: 156     median: 155 (7%)     max: 179 Points
Geekbench 5.5 - Geekbench 5.1 - 5.4 64 Bit Multi-Core
min: 498     avg: 775     median: 798.5 (1%)     max: 1003 Points
Geekbench 4.4 - Geekbench 4.1 - 4.4 64 Bit Single-Core
913 Points (9%)
789 Points (8%)
Geekbench 4.4 - Geekbench 4.1 - 4.4 64 Bit Multi-Core
3460 Points (4%)
3745 Points (4%)
Geekbench 4.0 - Geekbench 4.0 64 Bit Single-Core
874 Points (12%)
Geekbench 4.0 - Geekbench 4.0 64 Bit Multi-Core
3348 Points (8%)
Mozilla Kraken 1.1 - Kraken 1.1 Total Score *
8591 ms (10%)
min: 10163.3     avg: 11131     median: 11009 (13%)     max: 12342 ms
Octane V2 - Octane V2 Total Score
4589 Points (4%)
min: 4070     avg: 4855     median: 4215 (4%)     max: 6281 Points
WebXPRT 4 - WebXPRT 4 Score
30 Points (9%)
WebXPRT 3 - WebXPRT 3 Score
min: 24     avg: 31.8     median: 32 (7%)     max: 39 Points
AnTuTu v6 - AnTuTu v6 Total Score
60438 Points (21%)
AnTuTu v8 - AnTuTu v8 UX
min: 19097     avg: 21572     median: 21571.5 (18%)     max: 24046 Points
AnTuTu v8 - AnTuTu v8 MEM
min: 15791     avg: 19538     median: 19538 (16%)     max: 23285 Points
AnTuTu v8 - AnTuTu v8 GPU
min: 11434     avg: 11546     median: 11546 (2%)     max: 11658 Points
AnTuTu v8 - AnTuTu v8 CPU
min: 35898     avg: 37935     median: 37935 (14%)     max: 39972 Points
AnTuTu v8 - AnTuTu v8 Total Score
min: 89714     avg: 90591     median: 90590.5 (9%)     max: 91467 Points
Antutu v9 - AnTuTu v9 Total Score
132881 Points (8%)
Antutu v9 - AnTuTu v9 CPU
40100 Points (11%)
PCMark for Android - PCM f. Android Work Score 2.0
4464 Points (29%)
min: 4536     avg: 4750     median: 4750 (31%)     max: 4964 Points
PCMark for Android - PCM f. Android Work Score
5794 Points (29%)
min: 5647     avg: 6171     median: 6170.5 (31%)     max: 6694 Points
PCMark for Android - PCM f. Android Storage 2.0 random write internal
6.9 MB/s (5%)
PCMark for Android - PCM f. Android Storage 2.0 seq write internal
171.2 MB/s (5%)
PCMark for Android - PCM f. Android Storage 2.0 random read internal
18.7 MB/s (23%)
PCMark for Android - PCM f. Android Storage 2.0 seq read internal
249 MB/s (7%)
PCMark for Android - PCM f. Android Storage 2.0 score
6296 Points (10%)
PCMark for Android - PCM f. Android Work Score 3.0
min: 4564     avg: 5215     median: 5215 (24%)     max: 5866 Points
PCMark for Android - PCM f. Android Computer Vision
2269 Points (12%)
PCMark for Android - PCM f. Android Storage
5264 Points (11%)
CrossMark - CrossMark Overall
232 Points (9%)
Power Consumption - Geekbench 5.5 Power Consumption 150cd *
2.1 Watt (1%)
Power Consumption - Idle Power Consumption 150cd 1min *
0.8 Watt (1%)

Average Benchmarks HiSilicon Kirin 658 → 100% n=9

Average Benchmarks Mediatek MT8768 → 92% n=9

- Range of benchmark values for this graphics card
- Average benchmark values for this graphics card
* Smaller numbers mean a higher performance
1 This benchmark is not used for the average calculation

Add one or more devices and compare

In the following list you can select (and also search for) devices that should be added to the comparison. You can select more than one device.

restrict list:

show all (including archived), 2024, 2023
v1.26
log 19. 01:00:11

#0 checking url part for id 8960 +0s ... 0s

#1 checking url part for id 12755 +0s ... 0s

#2 not redirecting to Ajax server +0s ... 0s

#3 did not recreate cache, as it is less than 5 days old! Created at Fri, 17 May 2024 11:21:47 +0200 +0.001s ... 0.001s

#4 composed specs +0.061s ... 0.062s

#5 did output specs +0s ... 0.062s

#6 getting avg benchmarks for device 8960 +0.003s ... 0.065s

#7 got single benchmarks 8960 +0.007s ... 0.072s

#8 getting avg benchmarks for device 12755 +0.013s ... 0.085s

#9 got single benchmarks 12755 +0.015s ... 0.101s

#10 got avg benchmarks for devices +0s ... 0.101s

#11 min, max, avg, median took s +0.109s ... 0.21s

#12 return log +0.025s ... 0.235s

Please share our article, every link counts!
> Expert Reviews and News on Laptops, Smartphones and Tech Innovations > Benchmarks / Tech > Processor Comparison - Head 2 Head
Redaktion, 2017-09- 8 (Update: 2023-07- 1)