SK Hynix BC711 HFM256GD3GX013N vs Samsung PM991 MZ9LQ512HALU
SK Hynix BC711 HFM256GD3GX013N
► remove from comparison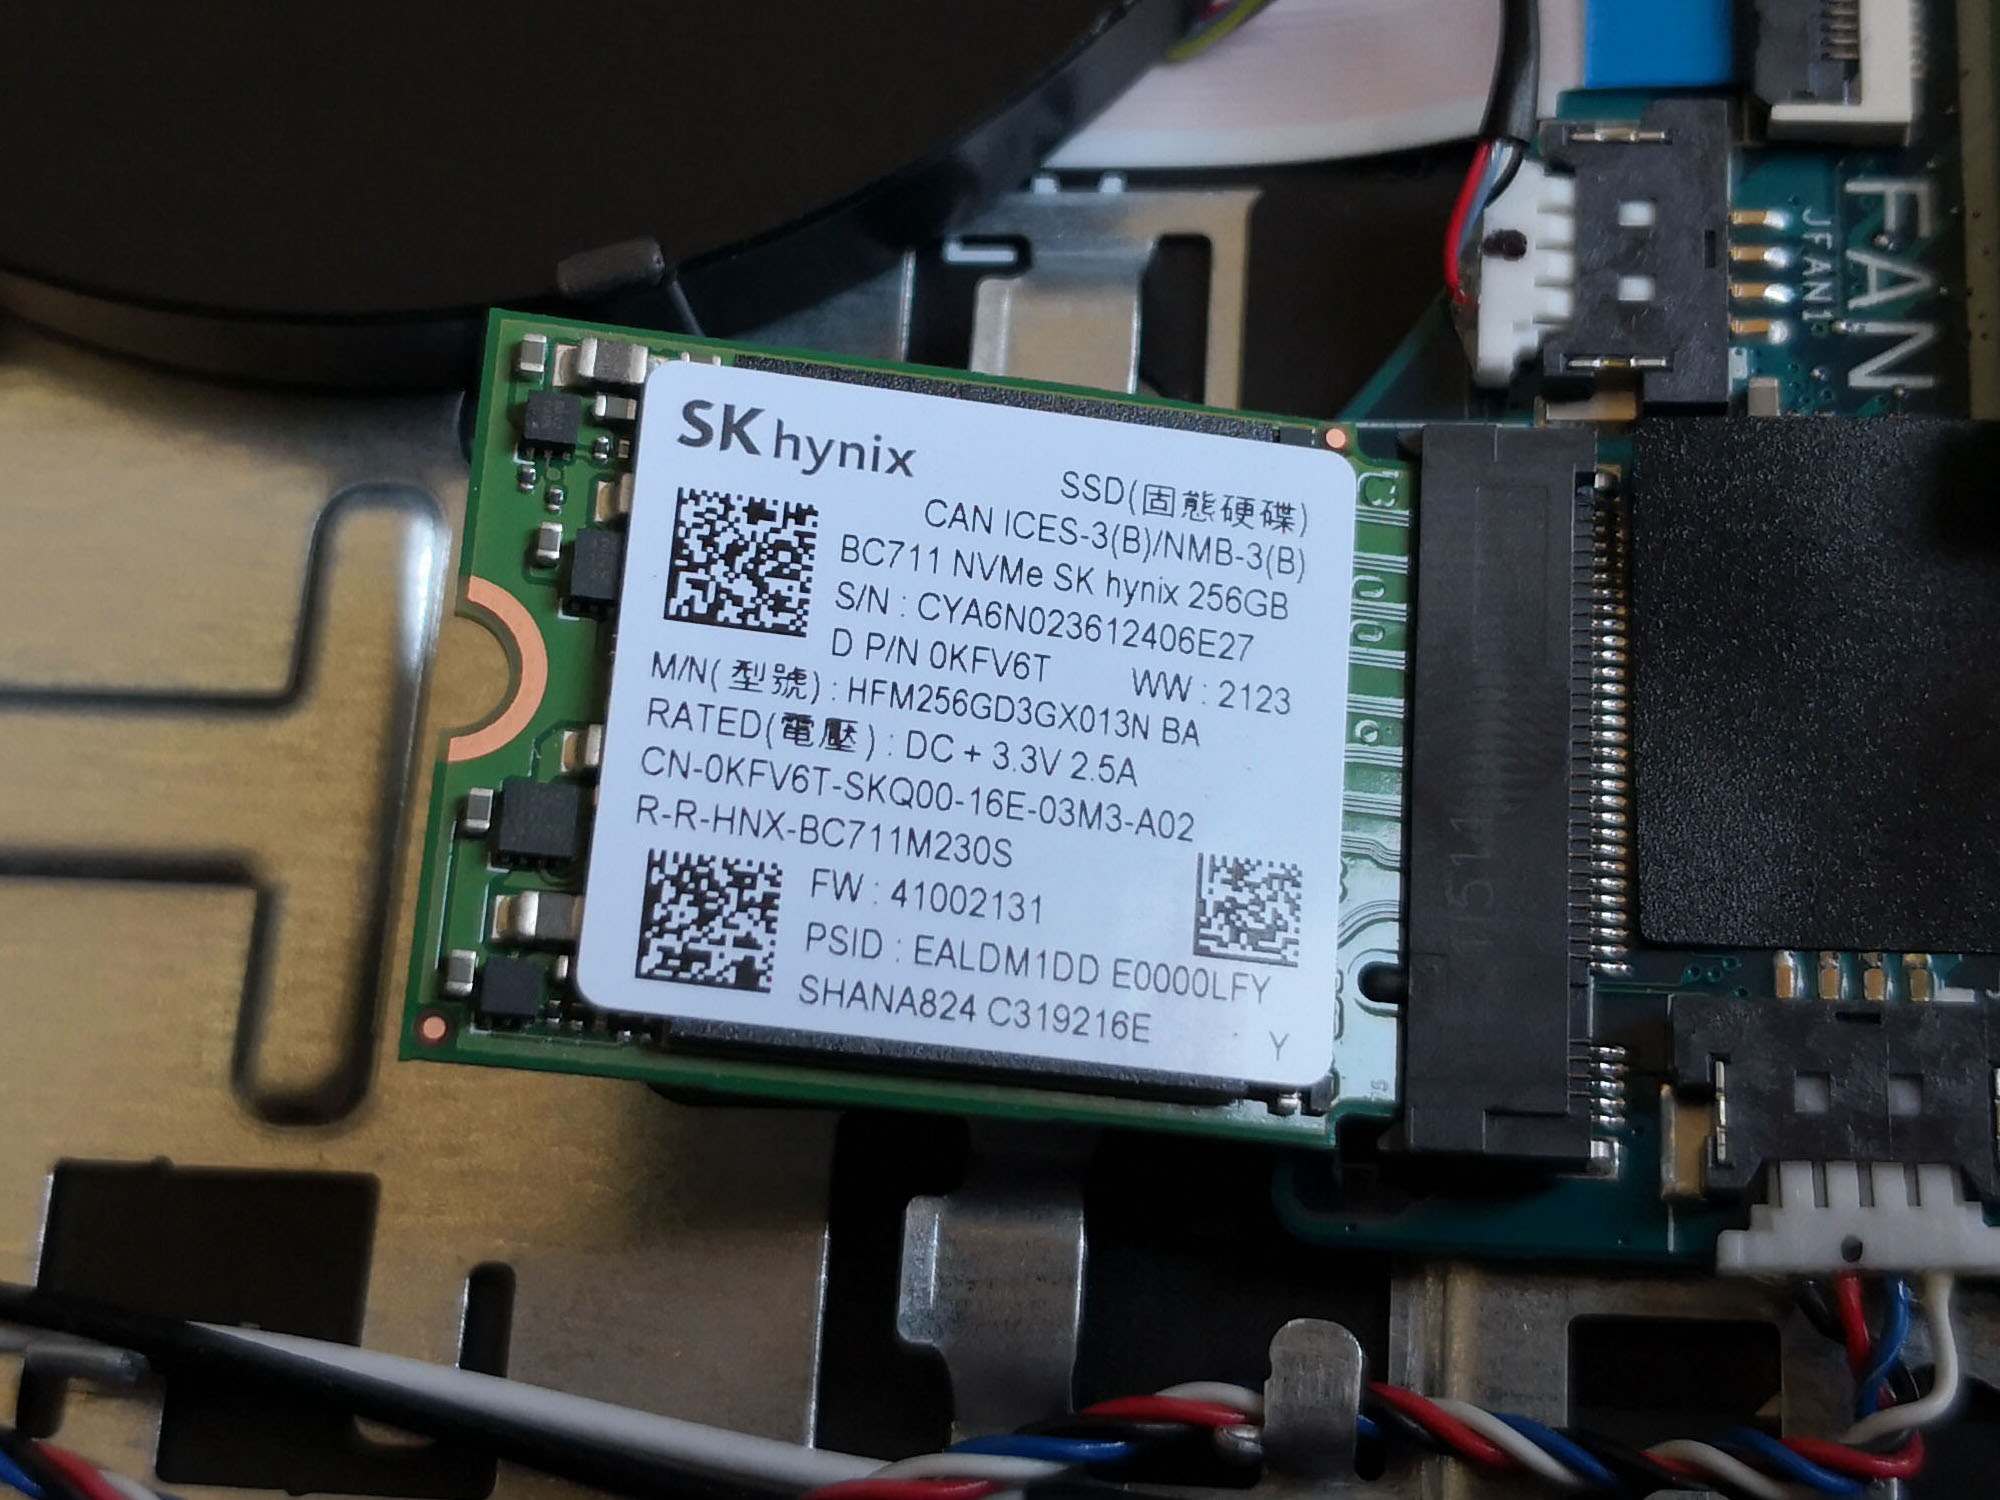
The SK Hynix BC711 HFM256GD3GX013N NVMe Pyrite is a mid range PCIe M.2 2242 drive that was first found in the Dell Inspiron 15 3000 3511 laptop. It uses a PCIe Gen3 x 4 interface and offers 256 GB of storage. We tested with firmware 41002131.
Samsung PM991 MZ9LQ512HALU
► remove from comparison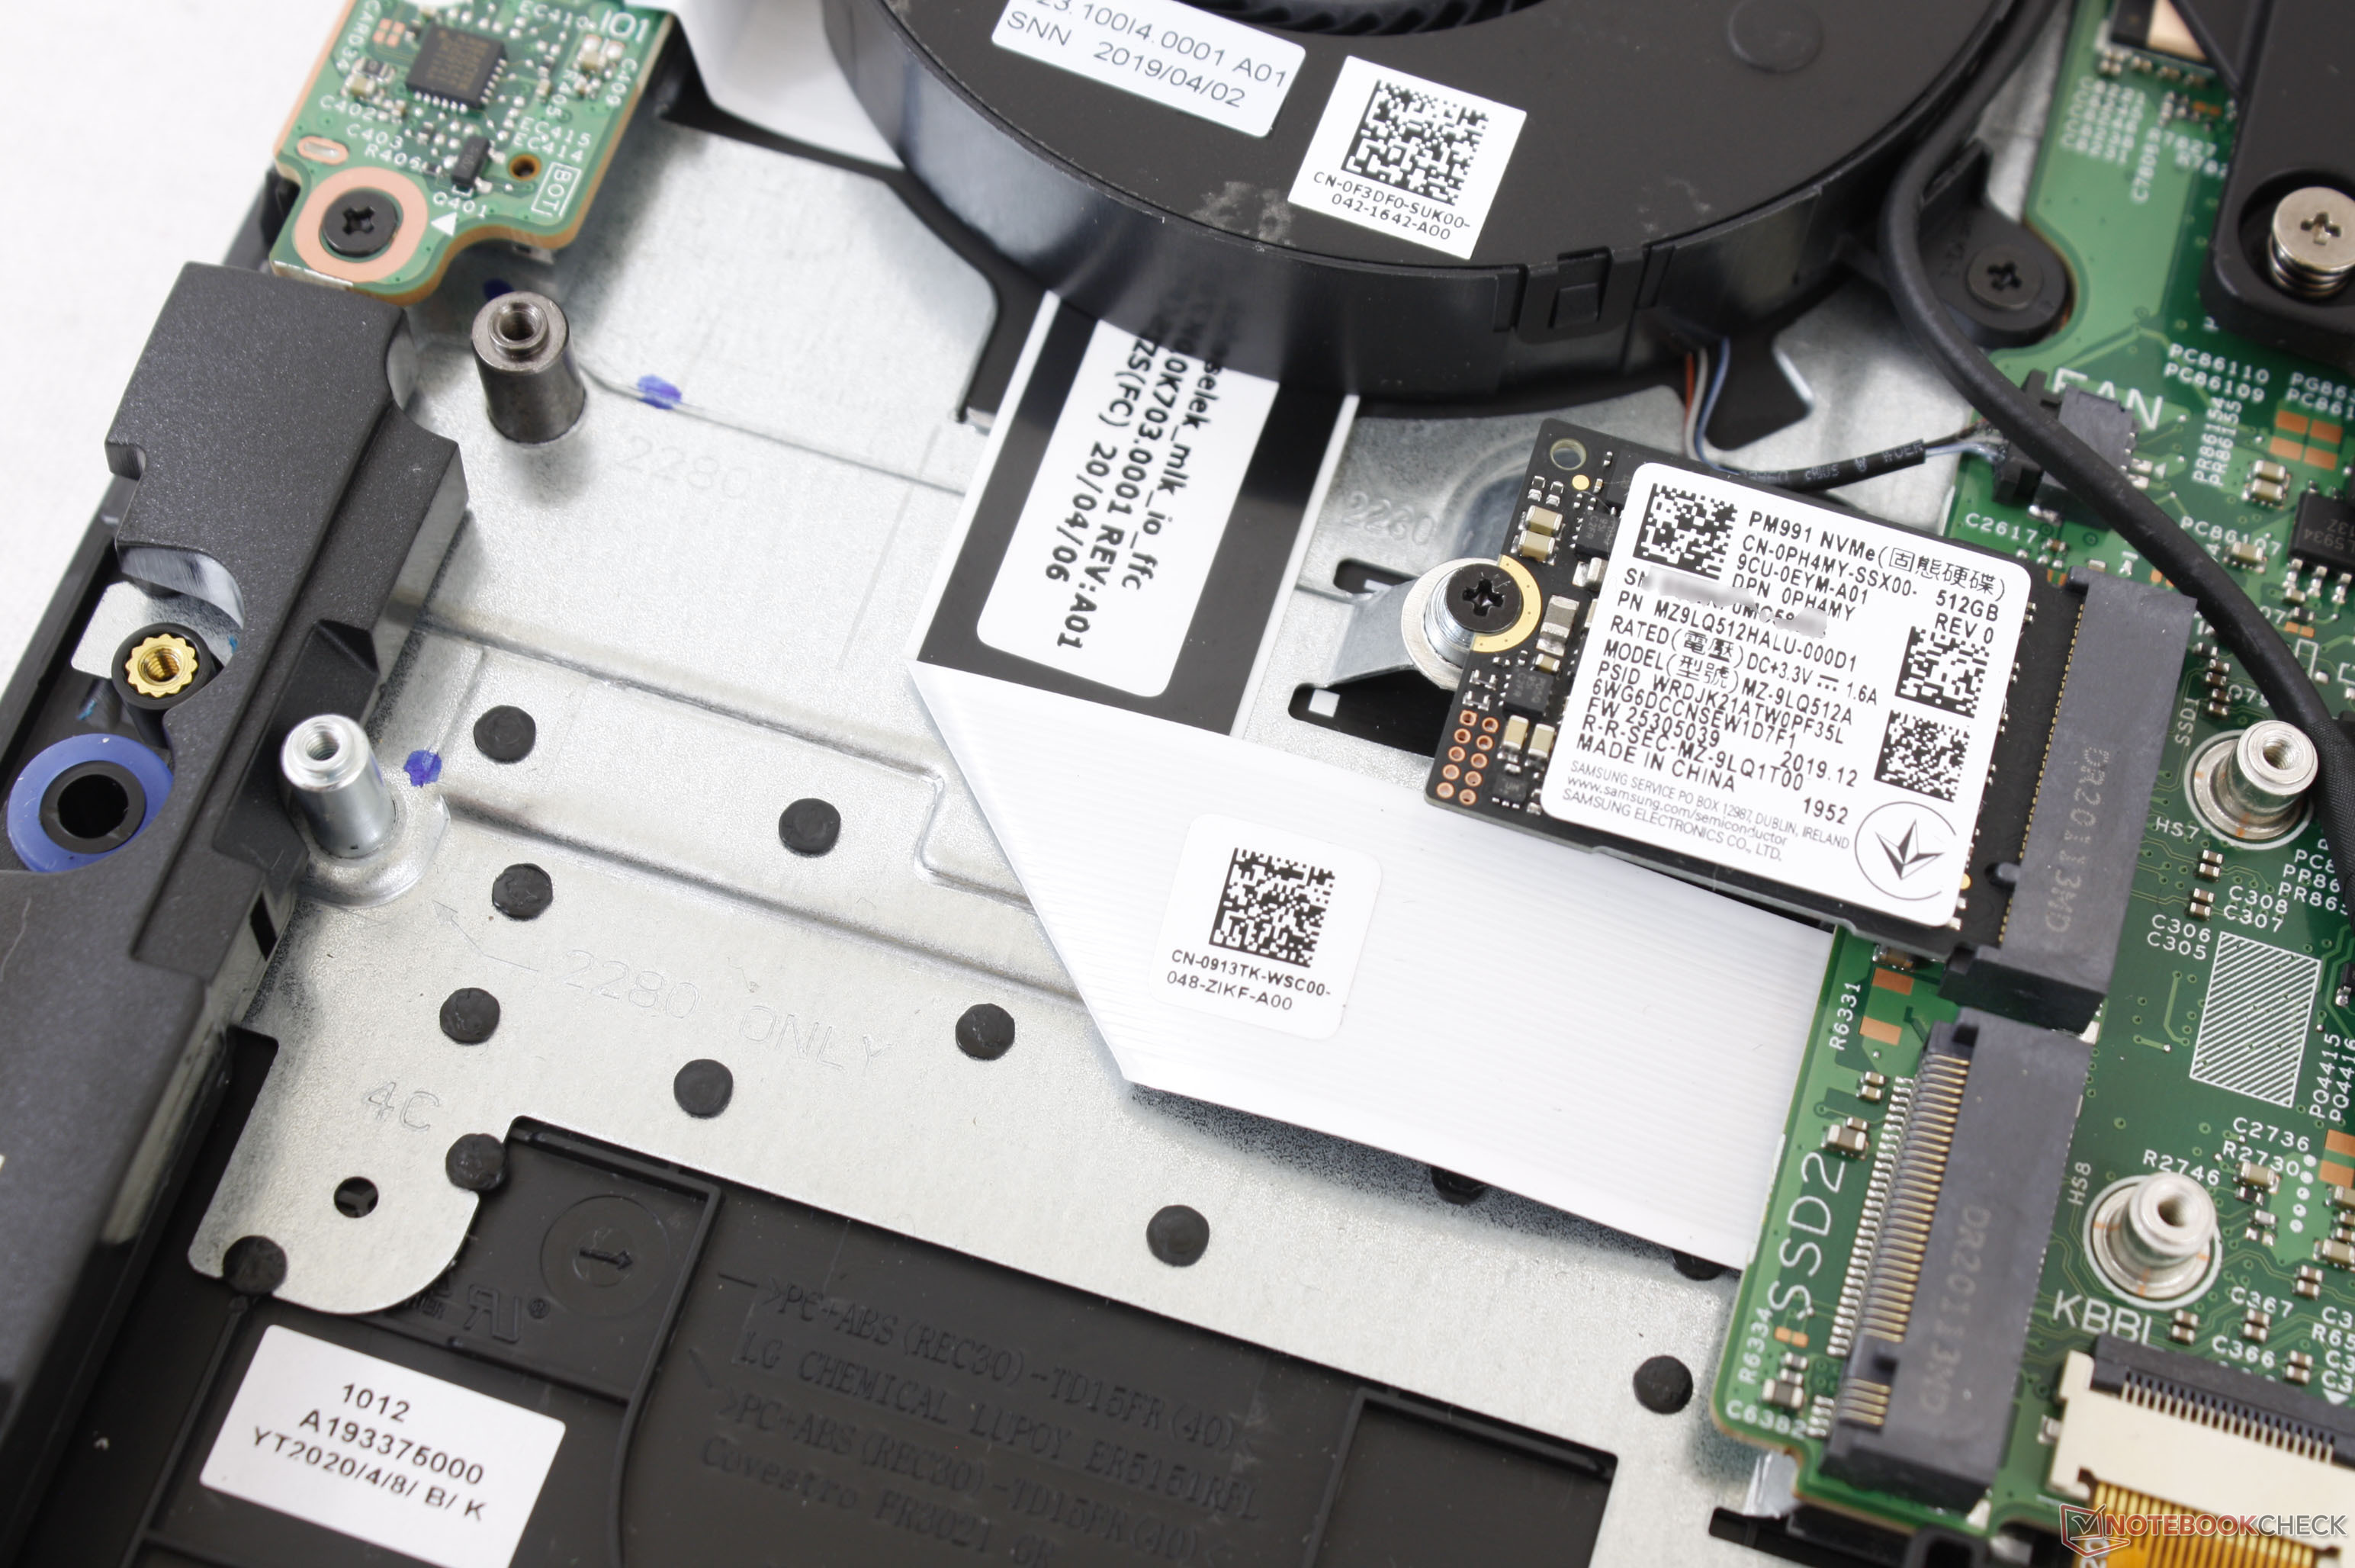
The Samsung PM991 MZ9LQ512HALU is a mid range PCIe M.2 2230 NVMe SSD.
| SK Hynix BC711 HFM256GD3GX013N | Samsung PM991 MZ9LQ512HALU | |
| Type | SSD | SSD |
| Size | M.2 2242 | M.2 2230 |
| Capacity | 256 GB | 512 GB |
| Interface | NVMe | M.2 |
| Announced | 06.01.2021 | 23.06.2020 |
Benchmarks
Performance Rating - DiskSpd - BC711 HFM256GD3GX013N
19.9 pt (23%)
Seagate ST1000LM014 Solid State Hybrid Drive
...
512 GB UFS 4.0 Flash
Foresee VP1000F512G
Lexar NM610 500GB
ASint AS806
SK Hynix BC711 HFM256GD3GX013N
Micron 2550 1TB MTFDKCD1T0TGE
2x Intel SSD 660p 1TB SSDPEKNW010T8 (RAID 0)
Samsung SSD PM981a MZVLB256HBHQ
...
Kingston Fury Renegade G5 4TB
0%
100%
Performance Rating - DiskSpd - PM991 MZ9LQ512HALU
16 pt (18%)
Seagate ST1000LM014 Solid State Hybrid Drive
...
Gofatoo 256GB
Intel SSD 660p SSDPEKNW512G8
Toshiba KBG40ZNS256G NVMe
TWSC TSC3AN512-F6Q10S
SK hynix BC501 HFM512GDHTNG-8310A
Samsung PM991 MZ9LQ512HALU
WDC PC SN530 SDBQNPZ-512G
WDC PC SN520 SDAPNUW-512G
Samsung SSD 950 Pro 512GB m.2 NVMe
WDC PC SN520 SDAPMUW-512
...
Kingston Fury Renegade G5 4TB
0%
100%
AS SSD - Copy Game
min: 446.1 avg: 462.8 median: 462.8 (8%) max: 479.5 MB/s
215%
PM991 MZ9LQ512HALU +min: 976 avg: 995 median: 994.5 (17%) max: 1013 MB/s
AS SSD - Copy Program
min: 268.65 avg: 305.6 median: 305.6 (11%) max: 342.6 MB/s
168%
PM991 MZ9LQ512HALU +min: 401.9 avg: 515 median: 515 (19%) max: 628 MB/s
AS SSD - Copy ISO
min: 1199 avg: 1429 median: 1429.5 (5%) max: 1659.9 MB/s
min: 1243 avg: 1264 median: 1263.5 (5%) max: 1284 MB/s
AS SSD - Score Total
min: 2493 avg: 2711 median: 2710.5 (17%) max: 2928 Points
min: 2477 avg: 2507 median: 2506.5 (15%) max: 2536 Points
AS SSD - Score Write
min: 545 avg: 795 median: 794.5 (11%) max: 1044 Points
123%
PM991 MZ9LQ512HALU +min: 973 avg: 980 median: 980 (14%) max: 987 Points
AS SSD - Score Read
min: 1279 avg: 1315 median: 1315 (21%) max: 1351 Points
min: 1012 avg: 1023 median: 1023 (16%) max: 1034 Points
AS SSD - Access Time Write *
min: 0.032 avg: 0.1 median: 0.1 (0%) max: 0.096 ms
105%
PM991 MZ9LQ512HALU +min: 0.027 avg: 0.1 median: 0.1 (0%) max: 0.095 ms
AS SSD - Access Time Read *
min: 0.07 avg: 0.1 median: 0.1 (0%) max: 0.071 ms
min: 0.098 avg: 0.1 median: 0.1 (0%) max: 0.191 ms
AS SSD - 4K-64 Write
min: 280.68 avg: 559 median: 558.8 (9%) max: 837 MB/s
133%
PM991 MZ9LQ512HALU +min: 721 avg: 744 median: 743.5 (13%) max: 766 MB/s
AS SSD - 4K-64 Read
min: 1026.51 avg: 1027 median: 1026.8 (20%) max: 1027 MB/s
min: 782 avg: 818 median: 818 (16%) max: 854 MB/s
min: 128 avg: 134.8 median: 134.8 (26%) max: 141.6 MB/s
min: 41.32 avg: 44.4 median: 44.4 (14%) max: 47.54 MB/s
AS SSD - Sequential Write
min: 644.67 avg: 745 median: 744.8 (7%) max: 845 MB/s
136%
PM991 MZ9LQ512HALU +min: 794 avg: 1014 median: 1014 (9%) max: 1234 MB/s
AS SSD - Sequential Read
min: 2023 avg: 2378 median: 2378.3 (19%) max: 2733.64 MB/s
min: 1386 avg: 1604 median: 1603.5 (13%) max: 1821 MB/s
CrystalDiskMark 5.2 / 6 - CDM 5/6 Write 4K
min: 138.7 avg: 154.9 median: 154.9 (14%) max: 171.1 MB/s
min: 118.2 avg: 130.2 median: 130.2 (12%) max: 142.1 MB/s
CrystalDiskMark 5.2 / 6 - CDM 5/6 Read 4K
min: 55.8 avg: 59.1 median: 59.1 (2%) max: 62.49 MB/s
min: 37.54 avg: 42 median: 42 (1%) max: 46.43 MB/s
CrystalDiskMark 5.2 / 6 - CDM 5 Write Seq
min: 790 avg: 873 median: 873.5 (5%) max: 956.9 MB/s
122%
PM991 MZ9LQ512HALU +min: 1017 avg: 1063 median: 1062.5 (6%) max: 1108 MB/s
CrystalDiskMark 5.2 / 6 - CDM 5 Read Seq
min: 1890 avg: 1950 median: 1950 (21%) max: 2010 MB/s
min: 926 avg: 1274 median: 1274 (14%) max: 1622 MB/s
CrystalDiskMark 5.2 / 6 - CDM 5/6 Write 4K Q32T1
min: 399 avg: 434.1 median: 434.1 (9%) max: 469.1 MB/s
min: 354.2 avg: 410.6 median: 410.6 (9%) max: 467 MB/s
CrystalDiskMark 5.2 / 6 - CDM 5/6 Read 4K Q32T1
min: 408.1 avg: 494.7 median: 494.7 (7%) max: 581.2 MB/s
min: 352.6 avg: 438.8 median: 438.8 (6%) max: 525 MB/s
CrystalDiskMark 5.2 / 6 - CDM 5/6 Write Seq Q32T1
min: 869.1 avg: 941 median: 940.6 (6%) max: 1012 MB/s
126%
PM991 MZ9LQ512HALU +min: 1174 avg: 1189 median: 1188.5 (8%) max: 1203 MB/s
CrystalDiskMark 5.2 / 6 - CDM 5/6 Read Seq Q32T1
min: 3304 avg: 3361 median: 3361 (18%) max: 3418 MB/s
min: 2261 avg: 2275 median: 2274.5 (12%) max: 2288 MB/s
DiskSpd - DiskSpd 4k_q1t1_write
min: 141 avg: 151.8 median: 151.8 (35%) max: 162.5 MB/s
min: 117 avg: 128.5 median: 128.5 (30%) max: 140 MB/s
DiskSpd - DiskSpd 4k_q1t1_read
min: 52.3 avg: 53.2 median: 53.2 (15%) max: 54 MB/s
min: 47.3 avg: 47.7 median: 47.7 (14%) max: 48 MB/s
DiskSpd - DiskSpd 4k_q32t16_write
min: 411 avg: 460.5 median: 460.5 (7%) max: 510 MB/s
122%
PM991 MZ9LQ512HALU +min: 361 avg: 562 median: 562 (8%) max: 763 MB/s
DiskSpd - DiskSpd 4k_q32t16_read
min: 667 avg: 898 median: 897.5 (11%) max: 1128 MB/s
min: 531 avg: 737 median: 737 (9%) max: 943 MB/s
DiskSpd - DiskSpd seq_write
min: 1606 avg: 1786 median: 1785.5 (17%) max: 1965 MB/s
min: 1050 avg: 1097 median: 1097 (11%) max: 1144 MB/s
DiskSpd - DiskSpd seq_read
min: 1680 avg: 1835 median: 1834.5 (19%) max: 1989 MB/s
min: 998 avg: 1174 median: 1173.5 (12%) max: 1349 MB/s
DiskSpd - DiskSpd seq_q8t1_write
min: 863 avg: 878 median: 878 (6%) max: 893 MB/s
131%
PM991 MZ9LQ512HALU +min: 1122 avg: 1147 median: 1146.5 (8%) max: 1171 MB/s
DiskSpd - DiskSpd seq_q8t1_read
min: 3398 avg: 3411 median: 3411 (21%) max: 3424 MB/s
min: 1942 avg: 2076 median: 2076 (13%) max: 2210 MB/s
DiskSpd - DiskSpd Loop seq_q8t1_read
min: 3302 avg: 3343 median: 3343 (21%) max: 3384 MB/s
min: 1328 avg: 1753 median: 1753 (11%) max: 2178 MB/s
- Range of benchmark values for this graphics card
 - Average benchmark values for this graphics card
* Smaller numbers mean a higher performance
* Smaller numbers mean a higher performance
Average Benchmarks
SK Hynix BC711 HFM256GD3GX013N → 100% n=31
Samsung PM991 MZ9LQ512HALU → 96% n=31
Average of the median scores above. 1 ... This benchmark is not used for the average calculation
- $97.99Solid State Drive KFV6T 0KFV6T CN-0KFV6T Compatible Replacement Spare Part for Dell SK Hynix BC711 HFM256GD3GX013N 256GB M.2 2230 NVMe PCIe Gen3 x4 SSD
- $43.00SK Hynix BC711 128GB PCIe NVMe M.2 2230 Gen 3 x 4 SSD, 0X3K2X, HFM128GD3GX013N, OEM Package
- $119.99SKHynix BC711 512GB NVMe PCIe M.2 2230 30mm Solid State Drive - HFM512GD3GX013N BA- OEM Packaging
- $69.00SK Hynix SSD 512GB M.2 2280 PCIe Gen3 x4 PC601 HFS512GD9TNG for Laptop Desktop Ultrabook
- $66.90SK Hynix 256GB M.2 SSD (Solid State Drive) NVMe PCIe Model: HFS256GD9MND-5510A BA - OEM
v1.35