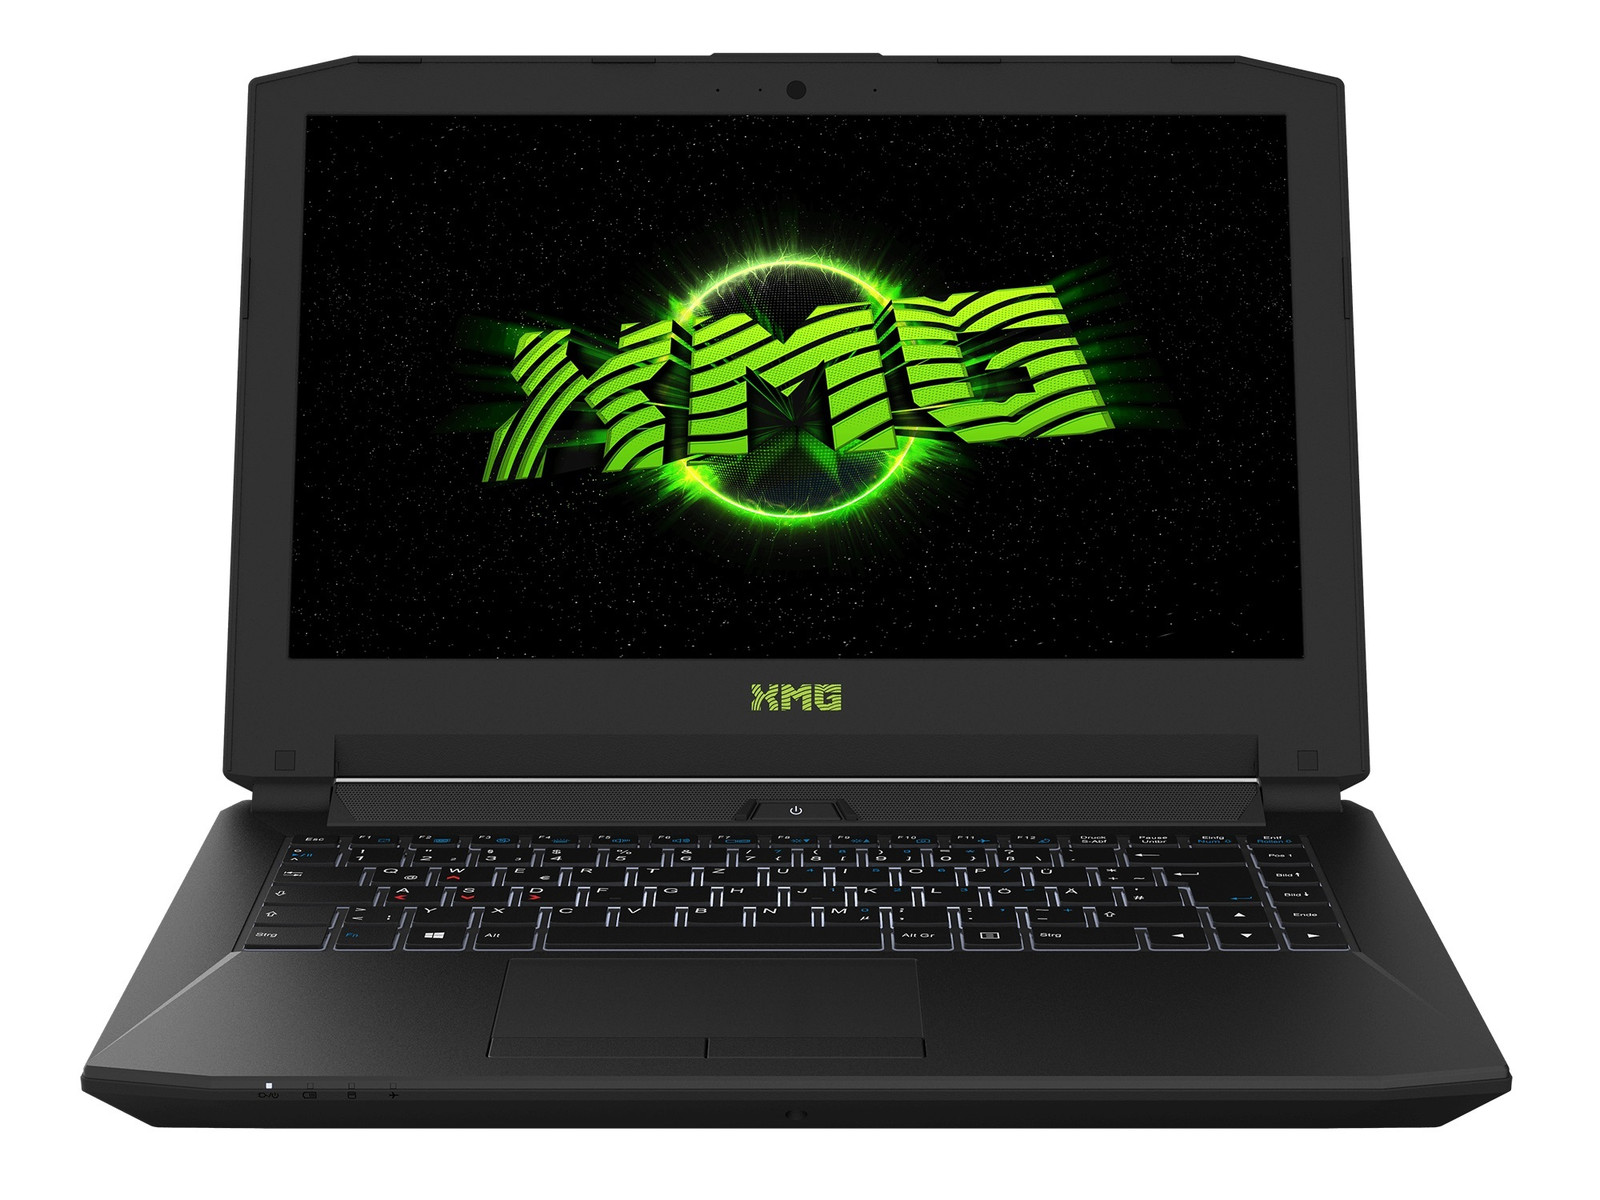
Schenker XMG P406 (Clevo P640RE) Notebook Review

For the original German review, see here.
Just like the Schenker XMG P506 we reviewed back in October 2015, you can also configure the 14-inch XMG P406 (base price 1399 Euros/~$1525) comprehensively on the homepage of the manufacturer. All configurations are equipped with a Full HD IPS display as well as the Nvidia GeForce GTX 970M with 3 GB dedicated GDDR5-VRAM. Furthermore, every buyer gets the Intel Gaming Bundle (consisting of Just Cause 3, CS: GO and World of Warships) for free.
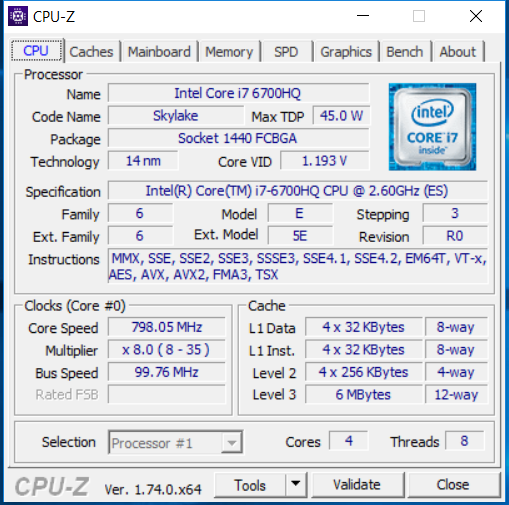
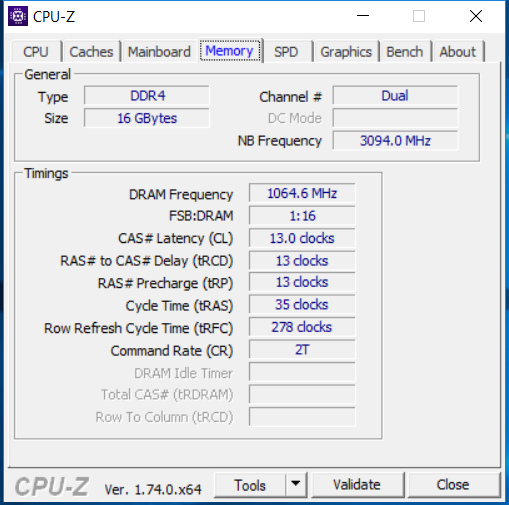
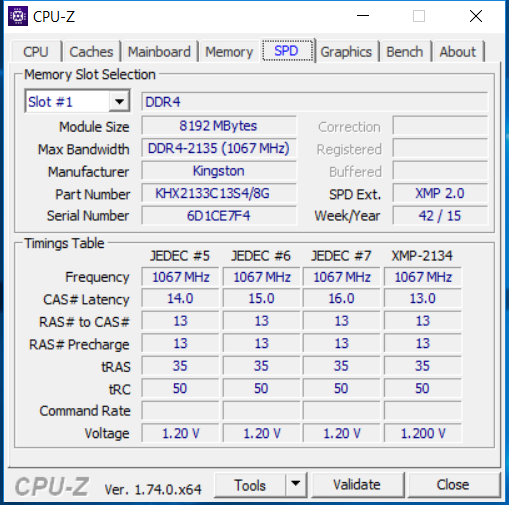
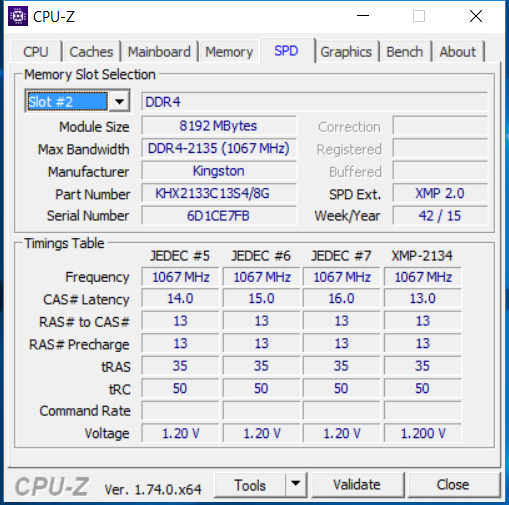
Our review unit was equipped with the Intel Core i7-6700HQ (4x 2.6 up to 3.5 GHz, Hyperthreading, 45 W TDP), but you can also select the even faster i7-6820HK (4x 2.7 up to 3.6 GHz, Hyperthreading, 45 W TDP). However, we do not think that this makes much sense. Other upgrades are available for the memory equipment, hard drive, Wi-Fi module, WWAN (without, UMTS or LTE), warranty, operating system and security software. The tested configuration with the Core i7-6700HQ, 16 GB DDR4-RAM (2133 MHz), 256 GB PCIe-SSD, conventional 1 TB HDD and the wireless adapter Intel Dual Band Wireless AC-8260 costs 1839 Euros (~$2004) and tips the scale at 2.2 kg (~4.85 pounds). We also have to note that some part designations of the review unit differ from the configurator.
We use the following comparison devices for this article: The P406 is only the third gaming notebook with a 14-inch screen that we checked within the last 10 months, so we obviously include the Schenker XMG C405 and Gigabyte P34W v3. We also use two 15-inch gaming devices with high scores. The Alienware 15 R2 uses a faster GeForce GTX 980M, while the Nexoc G515 II is equipped with a GTX 960M. The comparison tables also include the main rival from MSI, the GS40, which was in review at the same time.
Case
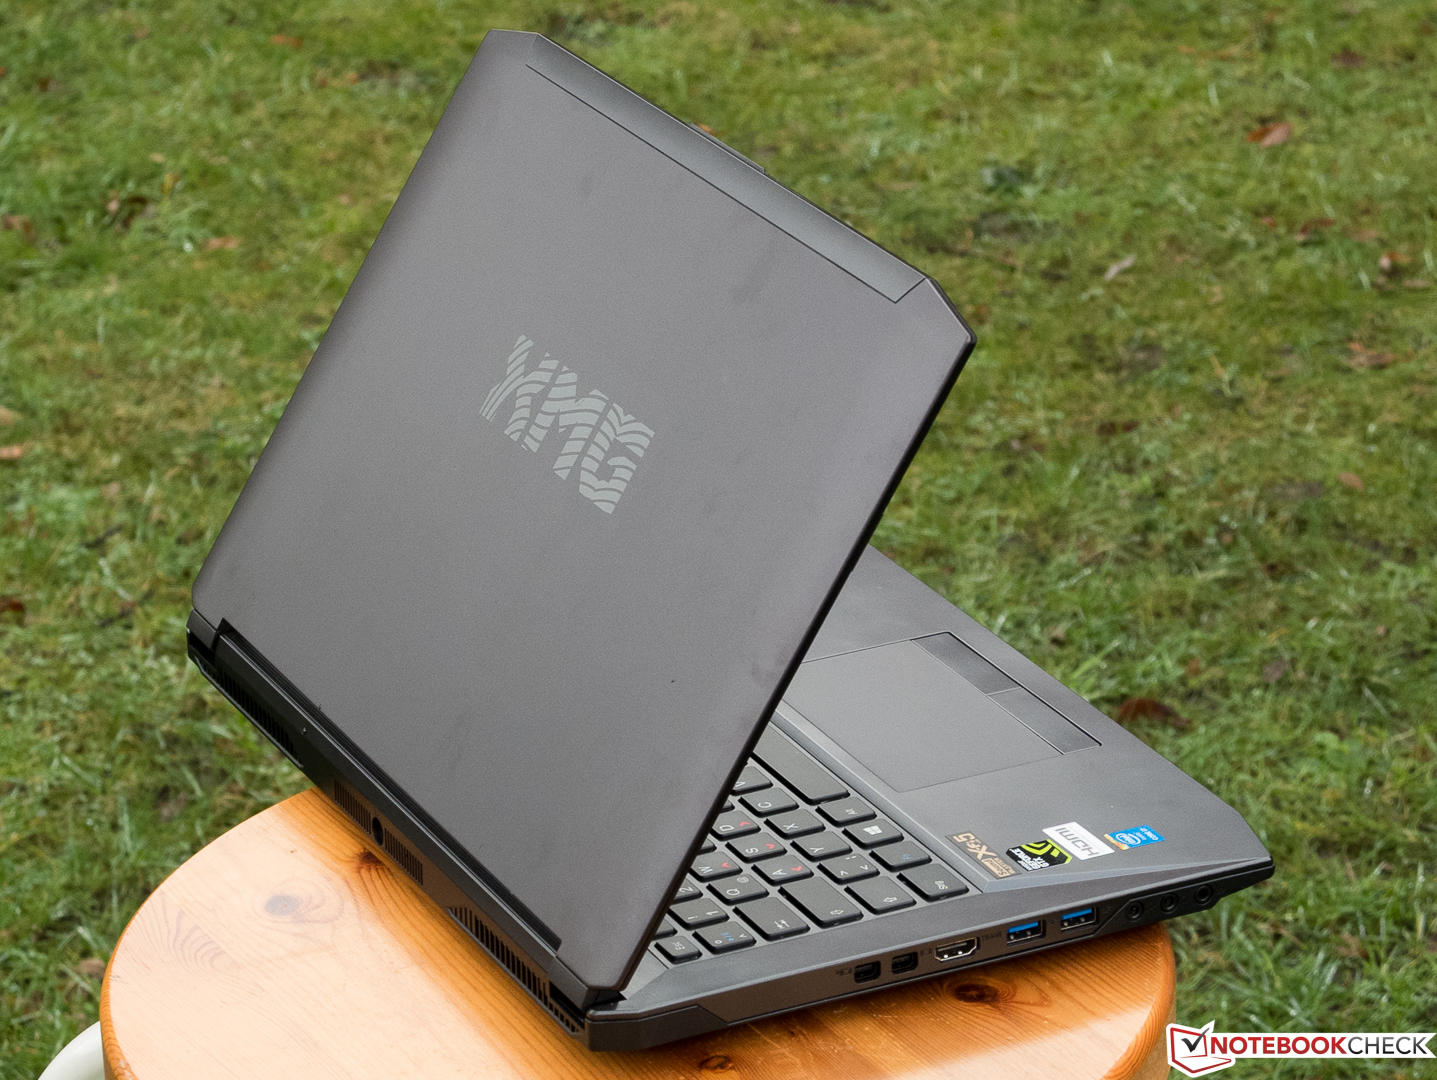
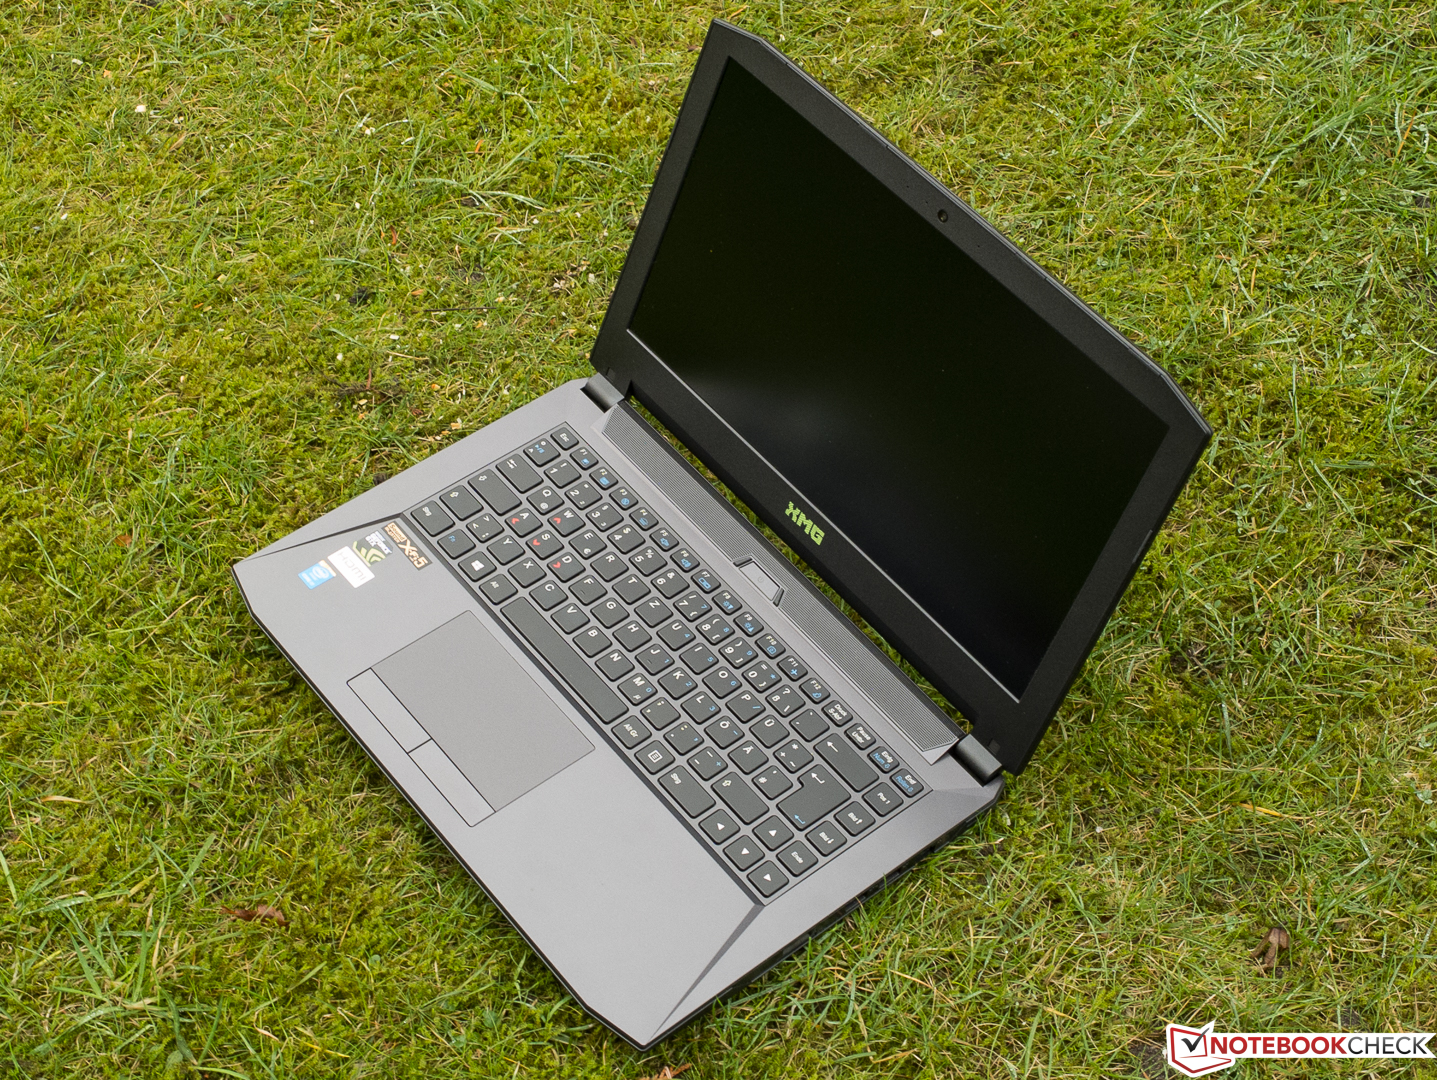
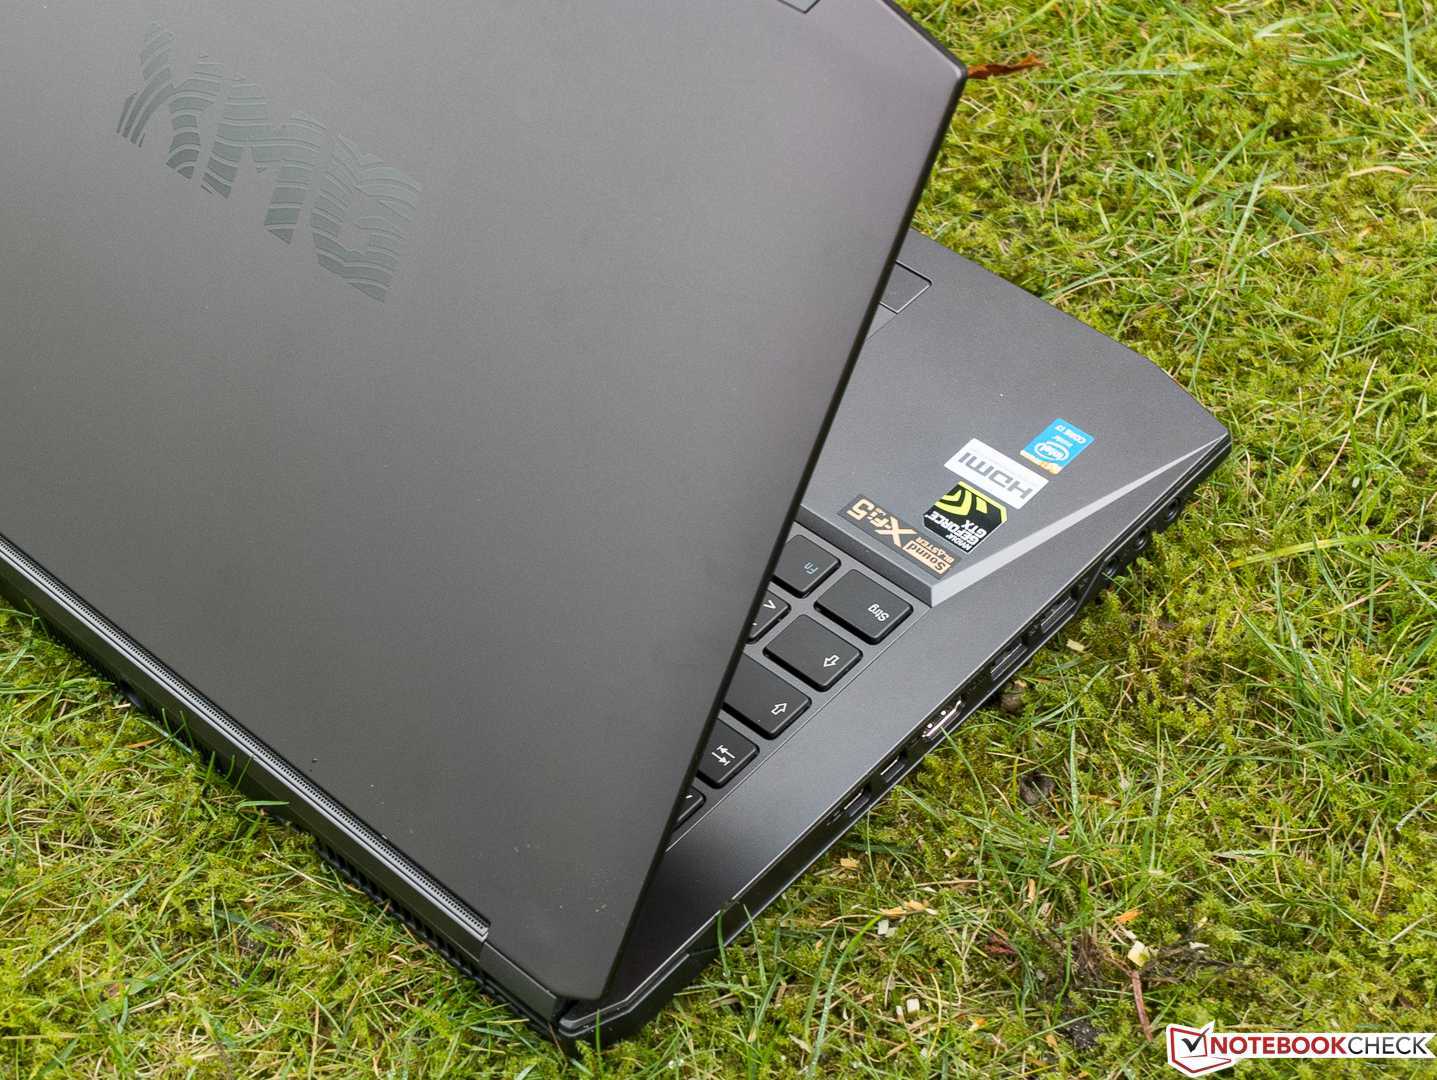
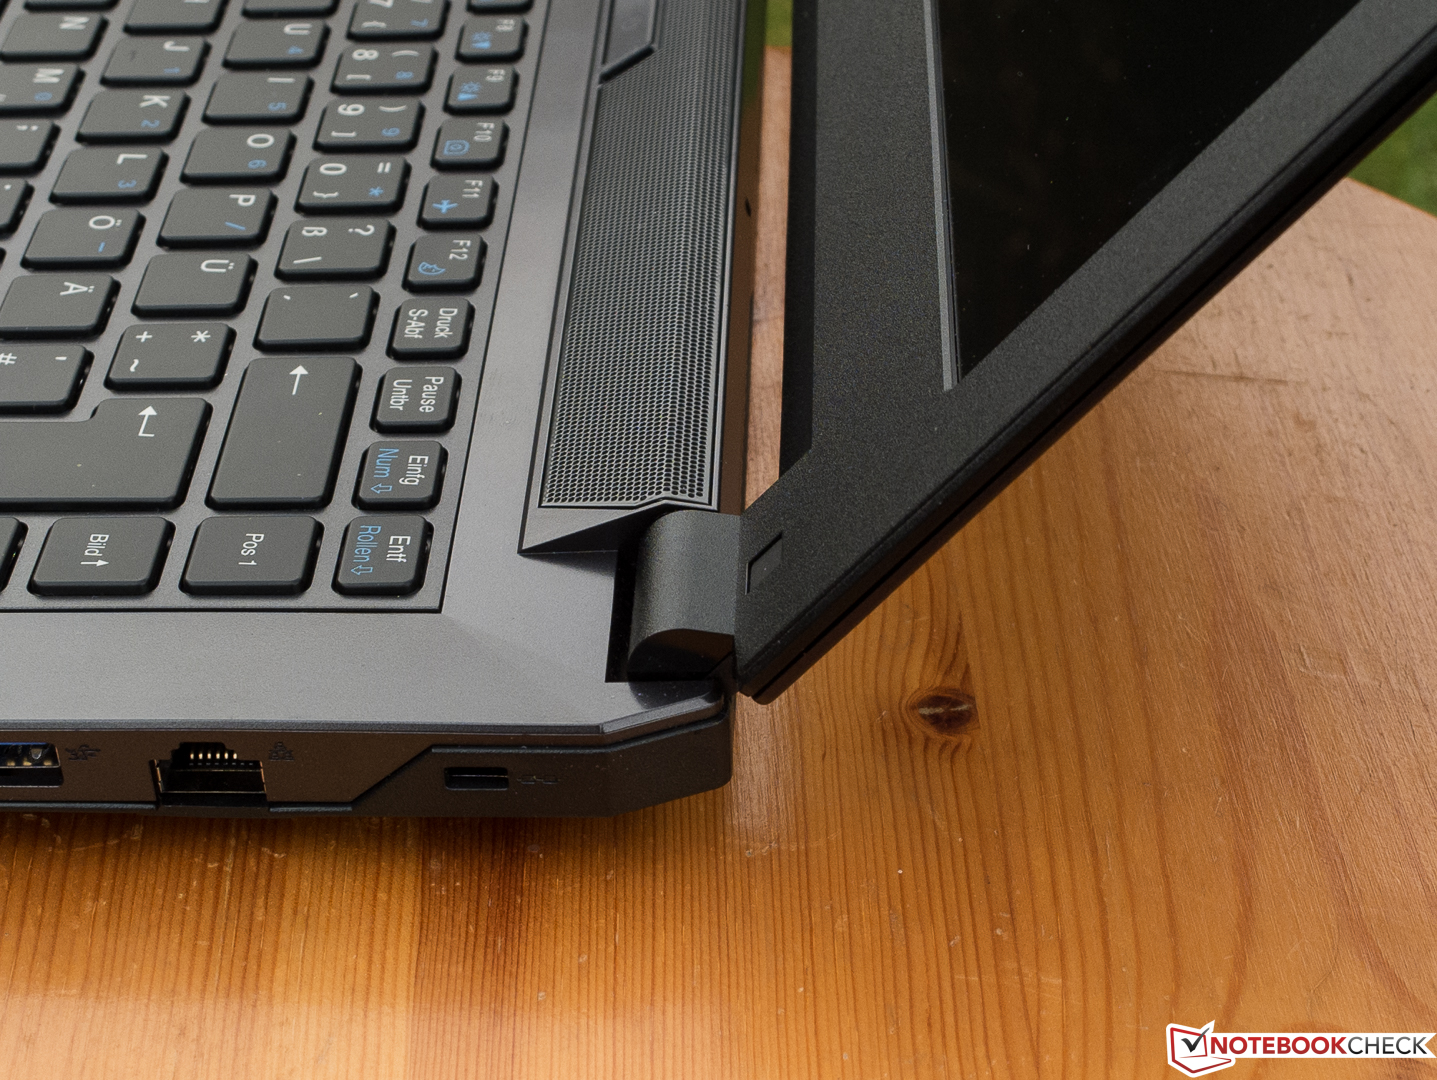
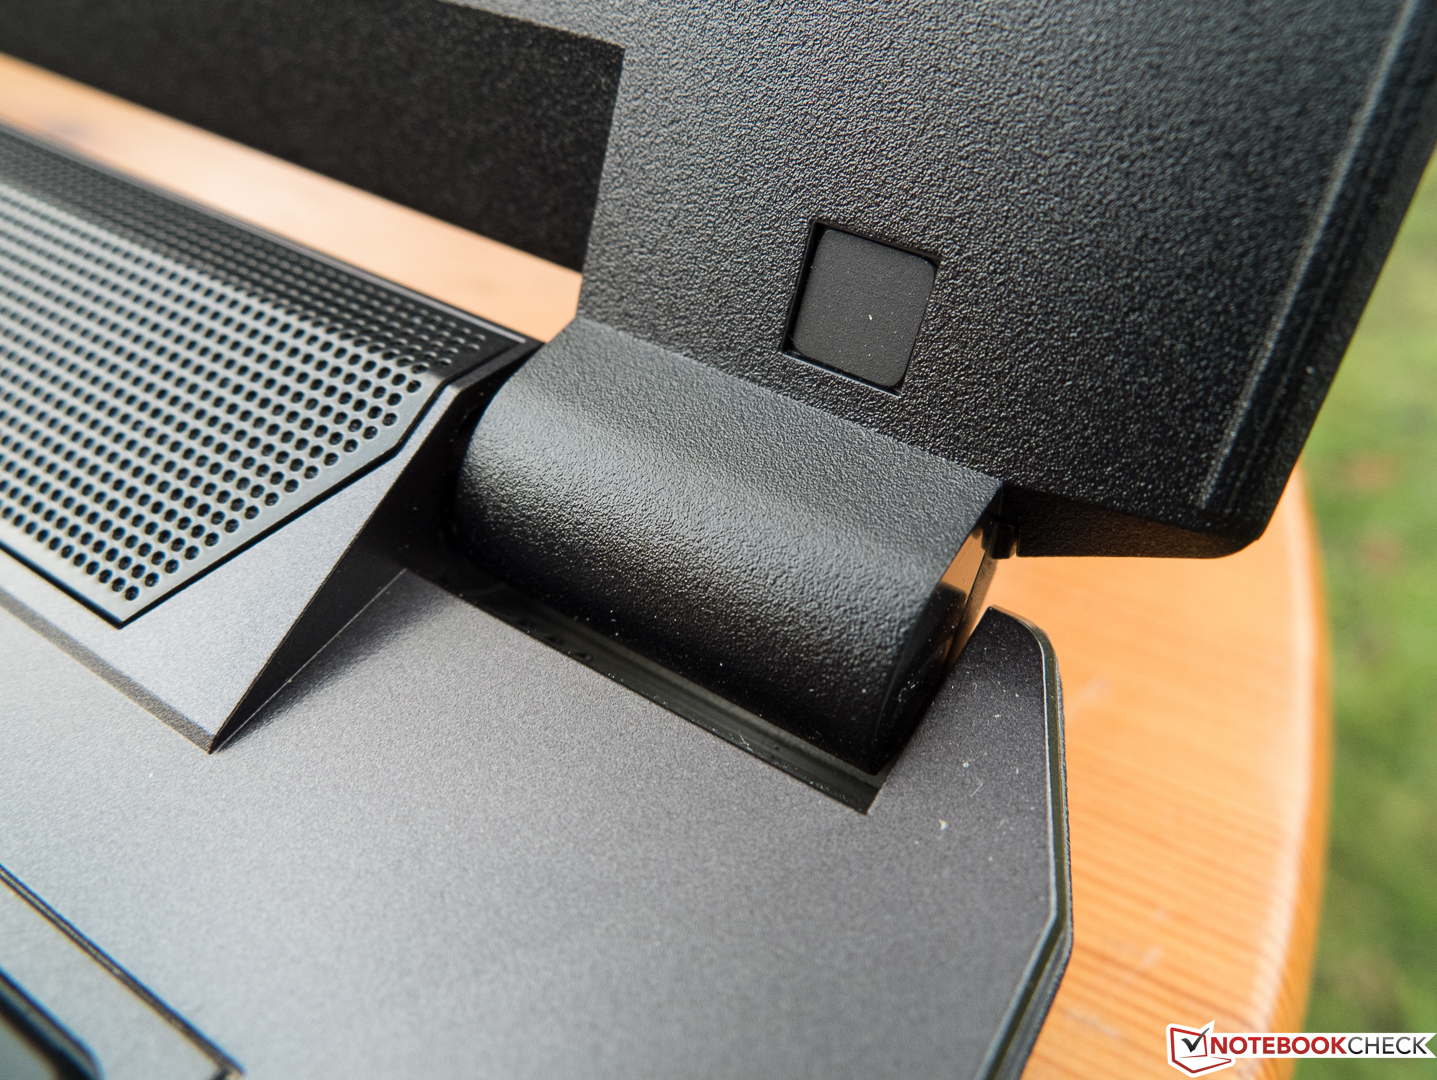
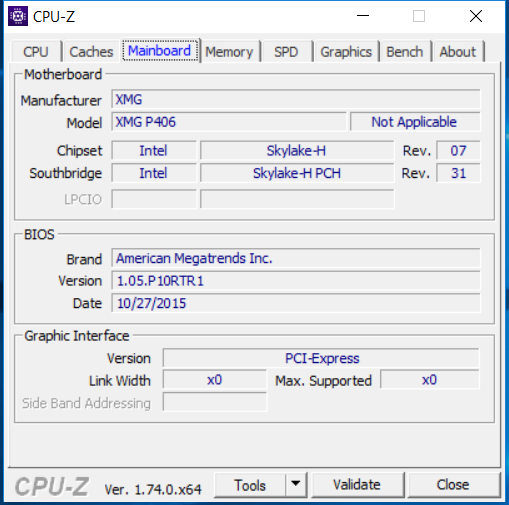
Schenker advertises a metal chassis for its XMG P406, which is based on the Clevo barebone P640RE. This might be true for the lid and the top of the base, but both the bottom and the display frame are made of plastic. Typical for the XMG-series is the edgy-futuristic design that can easily be spotted. The metal surfaces, which are actually smooth, are painted in a dark gray matte finish. Against our expectations, they are pretty grippy and fingerprints are not a big problem.
Twisting attempts are handled pretty well by the base, but there is some creaking. It is no problem to open the lid with just one hand. Protruding edges, which are obviously part of the design, are found everywhere. We did not find any noteworthy inconsistencies in respect of the build quality. All in all, the chassis leaves a solid and sophisticated impression that can match the price of at least 1399 Euros (~$1525). The review unit is very light for a gaming device at 2.2 kg (4.85 lb), but not in comparison with common 14-inch models.


Connectivity
Ports
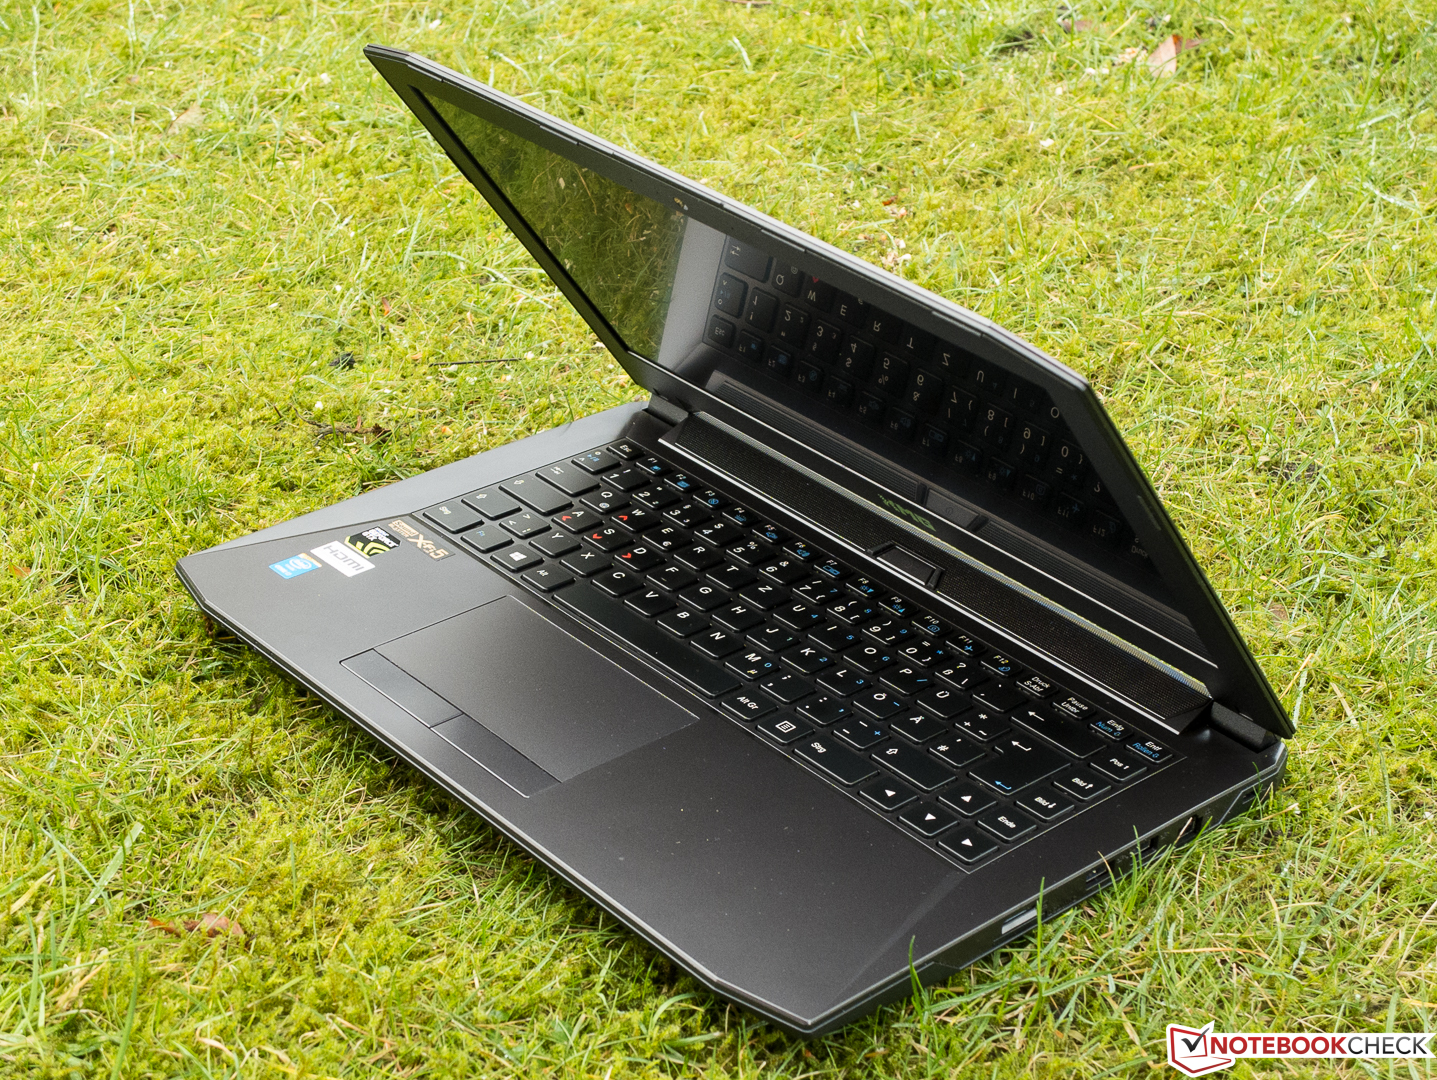
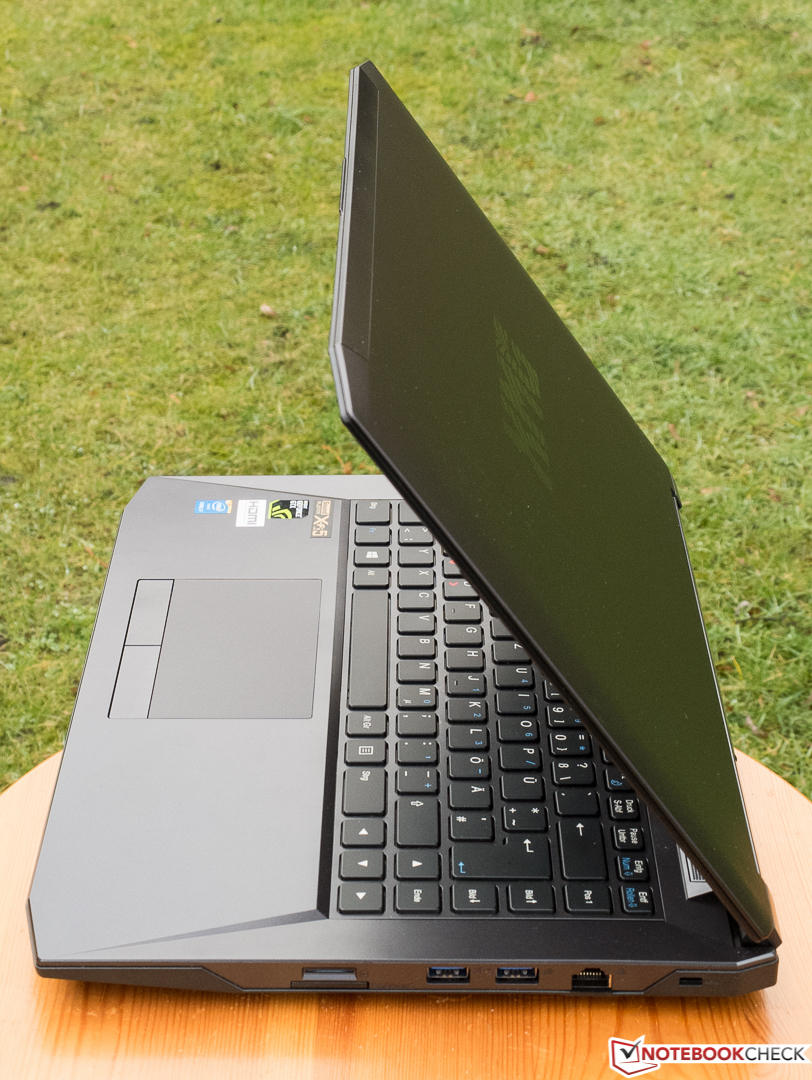
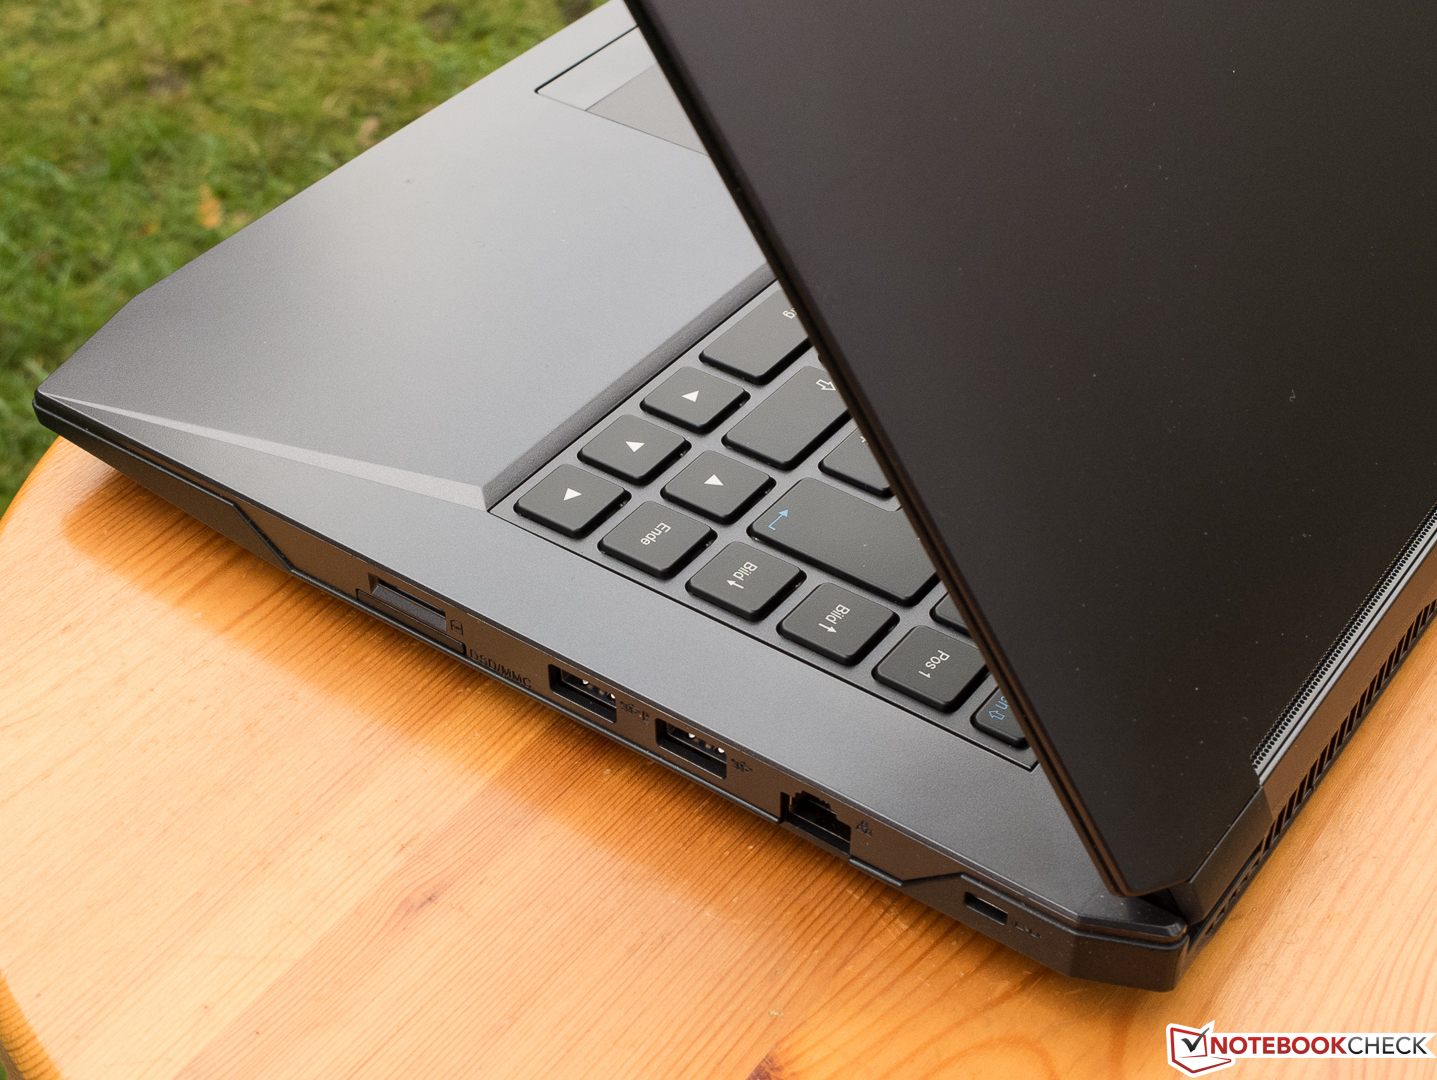
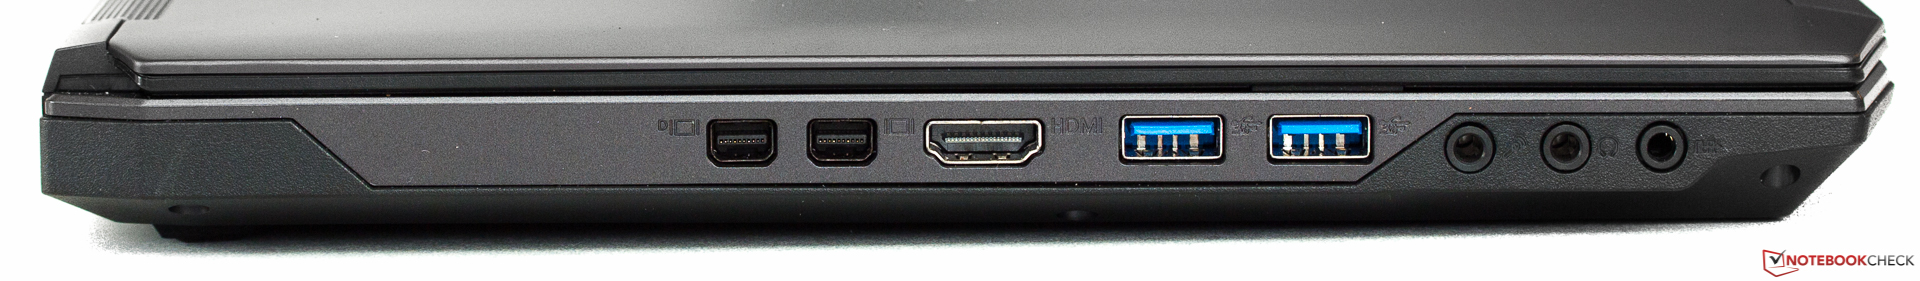
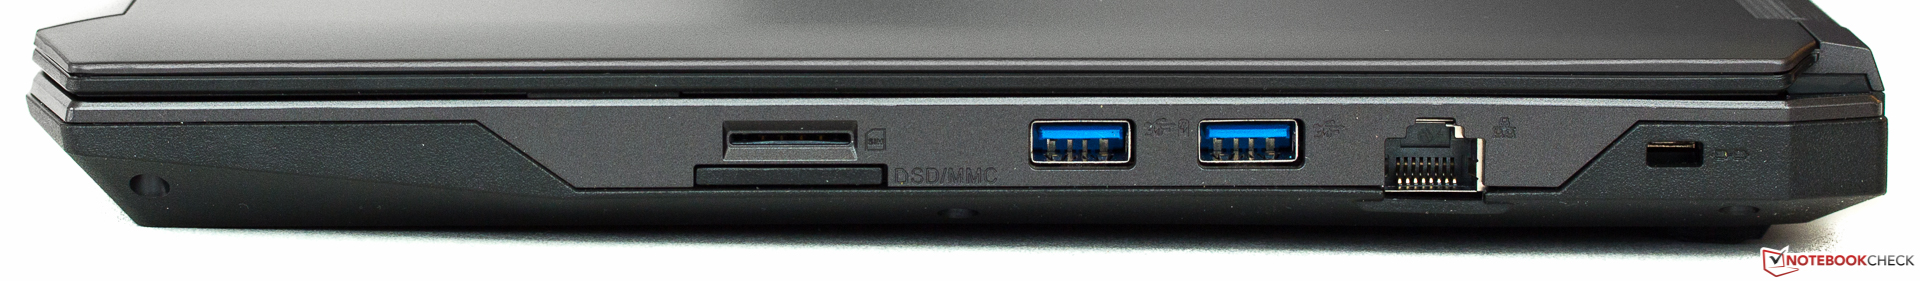
You will not be disappointed by the Schenker XMG P406 if you want to attach multiple external displays to your gaming notebook. Thanks to one HDMI and two Mini-DisplayPorts (1.2), you can drive up to three external monitors simultaneously besides the internal display. HDMI 2.0 is missing, the HDMI port can only display UHD or 4K videos at 25 Hz (according to the manufacturer), while QHD (2160x1440) is possible at 60 Hz. Schenker does not cut any corners in respect of the other ports and includes 4x USB 3.0, coaxial S/PDIF port and separate stereo jacks for in- and outputs for microphones and headphones, so you can use conventional headsets. The card reader supports many formats and there is even a Gigabit-Ethernet port for stationary operation.
The best position for ports from an ergonomic point of view is the rear area of the sides or at the back. The manufacturer does not fully follow this philosophy. The power connector is actually at the back, but most ports are at the left front, where at least right-handed mouse users are not affected by attached flash drives or cables. We measured a transfer rate of up to 100 MB/s when we copied large files from our USB 3.0 hard drive.
Maintenance
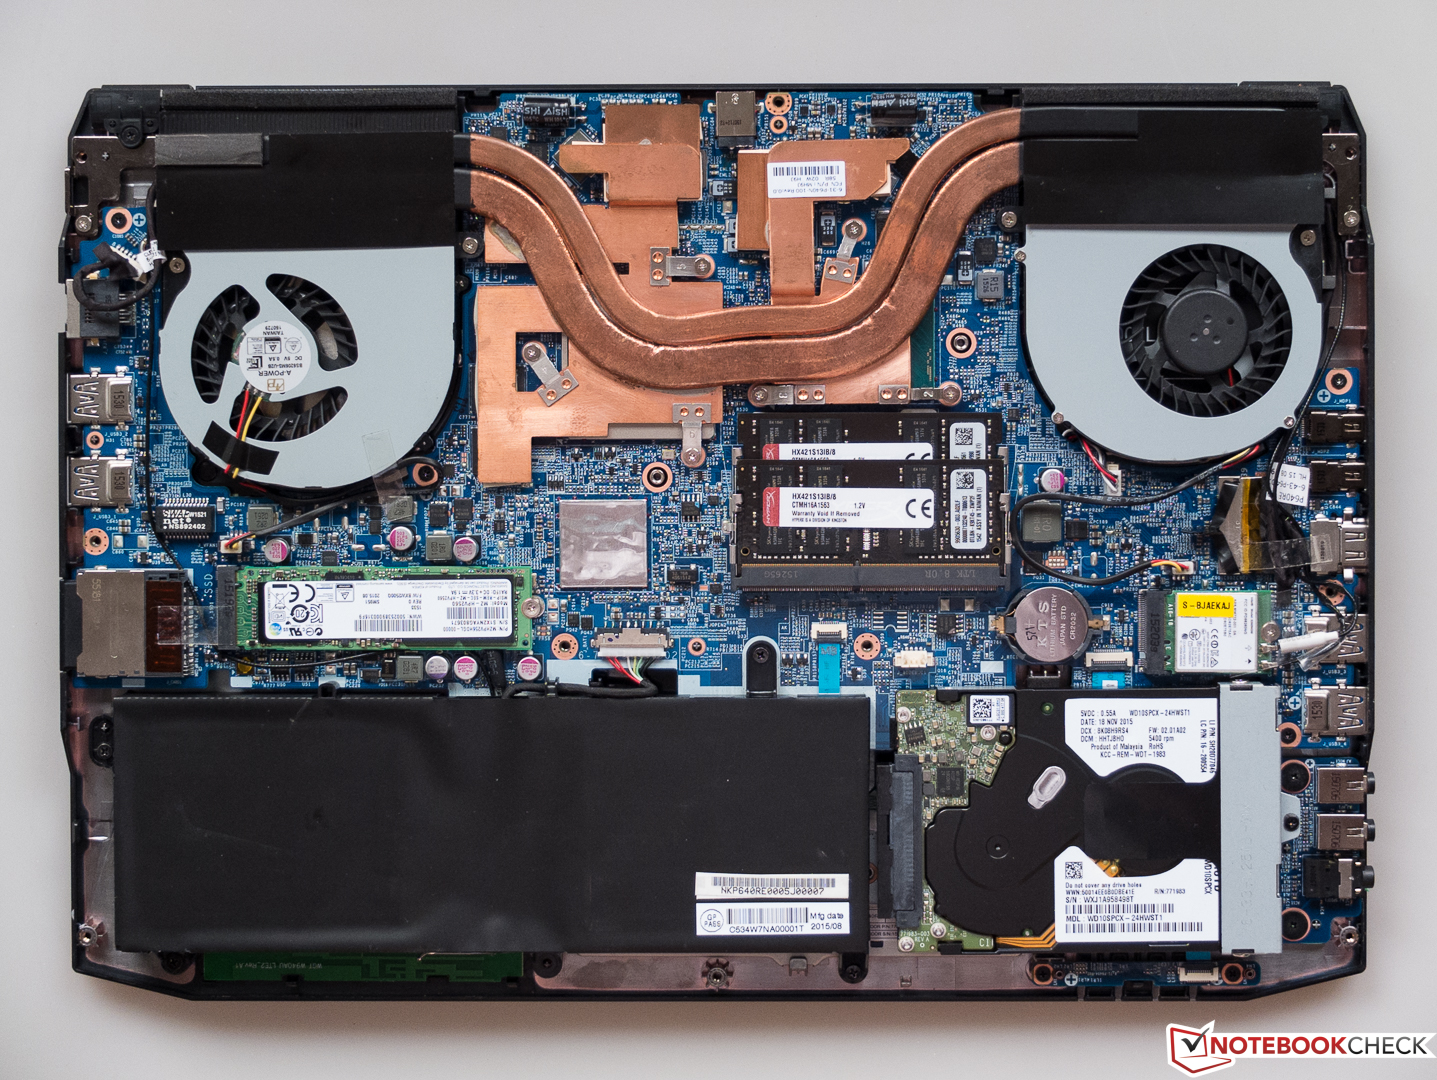
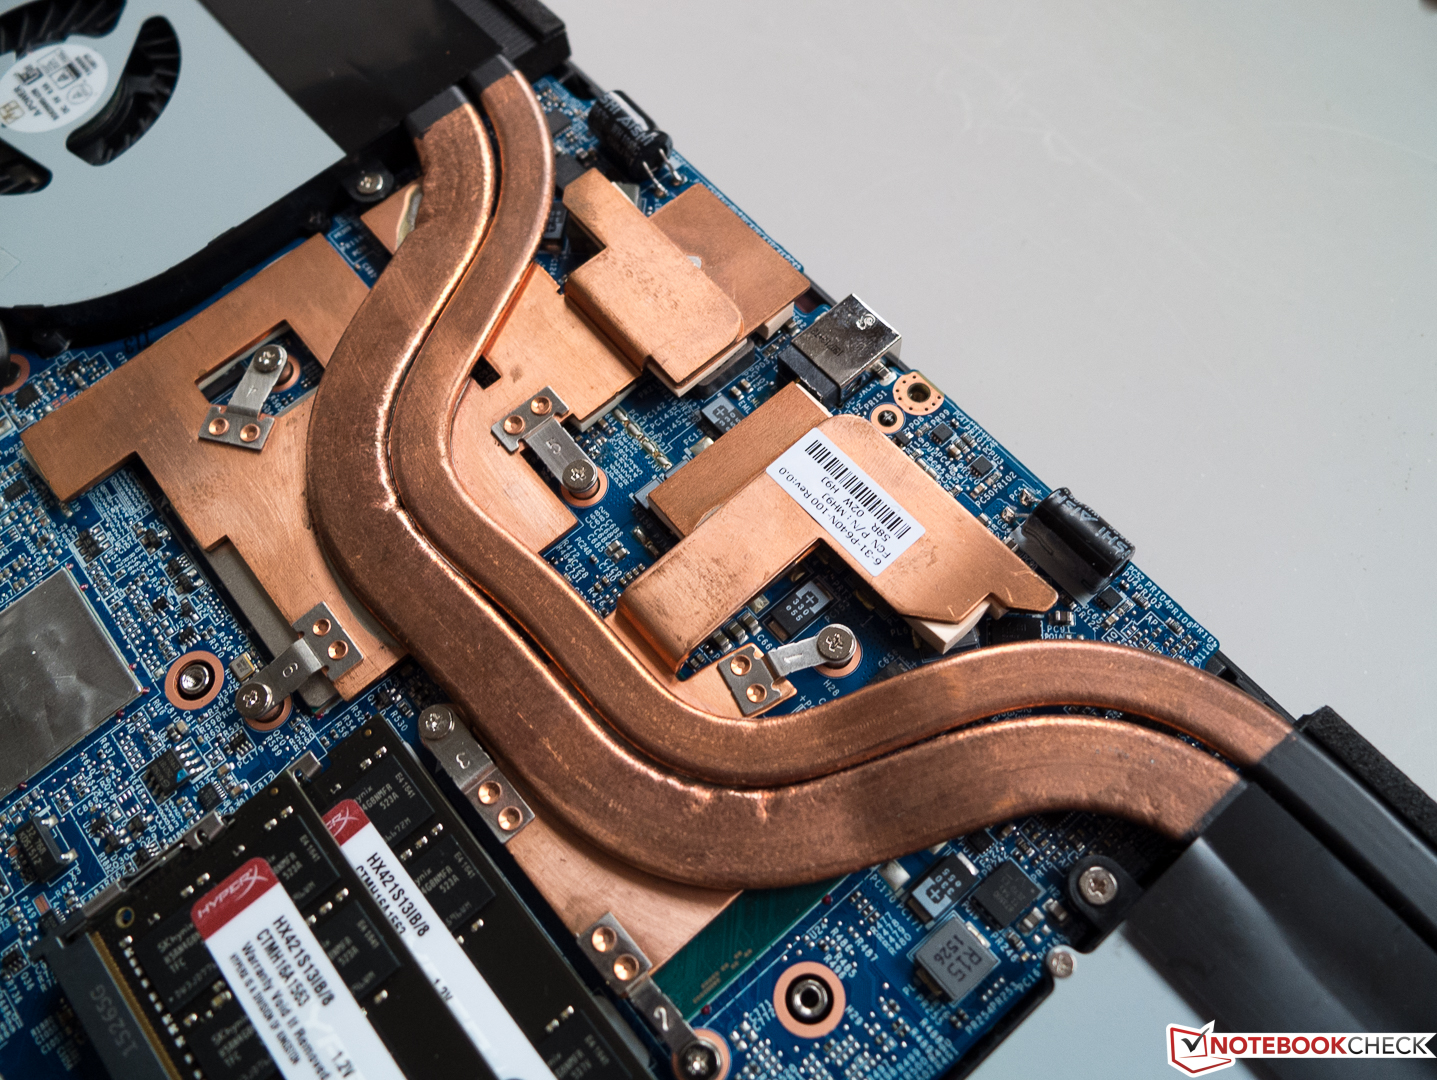
There is no maintenance hatch and the battery is not accessible from the outside, either, so you will have to remove the whole bottom cover (secured by 11 screws) for upgrades or cleaning the fan. The process is pretty easy though, and once the cover is removed, you can access all-important components including the fans. The soldered CPU cannot be replaced (the same applies for the GPU).
Communication
Schenker equips its gamer with a modern Wi-Fi module with the designation Intel Dual Band Wireless AC-8260, which supports both the often crowded and therefore slower 2.4 GHz band and the less crowded 5 GHz band. Intel advertises a maximum transfer rate of 867 Mbps in an ac-network. Bluetooth 4.0 is included as well. The author recently changed his test environment with a new router, so we currently have no comparison data for the signal quality. However, the modules from Intel usually provide a very good signal quality as long as the manufacturer does not mess up the antenna design.
Accessories
The simple box of our review sample includes the mandatory power adapter plus a power cord, a self-created DVD with unknown content that we could not read, a microfiber cloth, an XMG key chain as well as an XMG sticker. The usual quick-start guide and warranty information were missing.
Warranty
Schenker grants a standard warranty period of 24 months for the XMG P406.
Input Devices
Touchpad
Gaming notebooks are usually operated with an external mouse, but we obviously have a look at the quality of the classic touchpad with its dedicated buttons anyway. The comfortably sized surface, which does not always accept inputs in the peripheral areas, is slightly roughened. This also adds to the good tactile feedback and gliding capabilities (even with slightly wet fingers). Responsiveness and precision are very good and even fast movements were recognized very well. Drag-&-Drop via double-tap always worked on the first attempt.
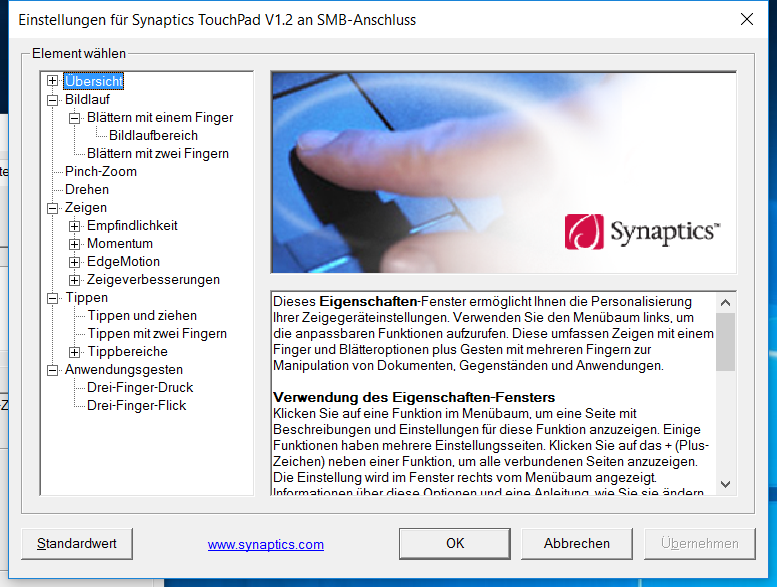
The good impression is supported by the convenient resistance of the mouse buttons over the whole width as well as the firm pressure point and the flawless build quality. Numerous settings for gestures for up to three fingers are available in the familiar Synaptics driver (picture).
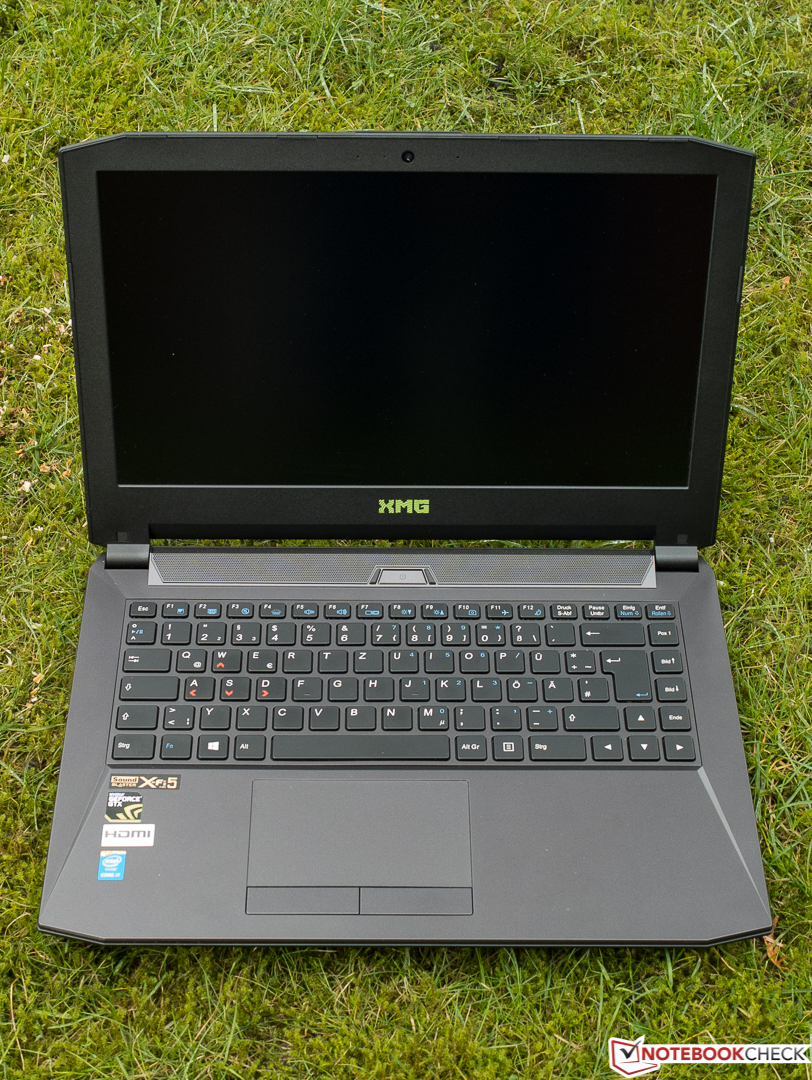
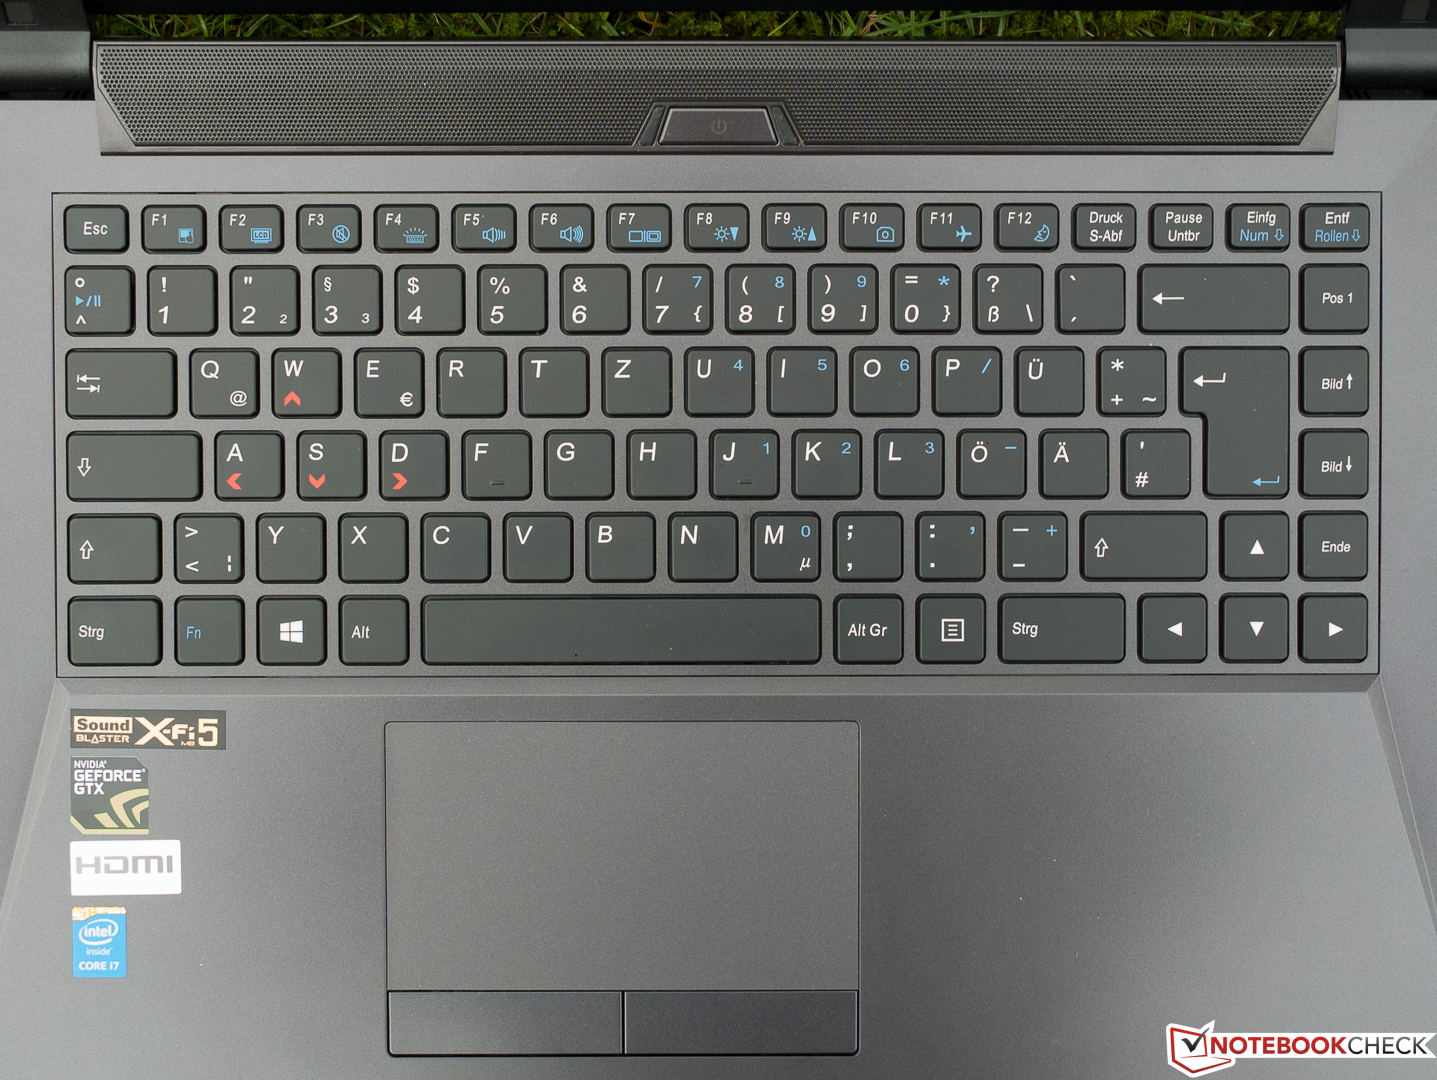
Keyboard
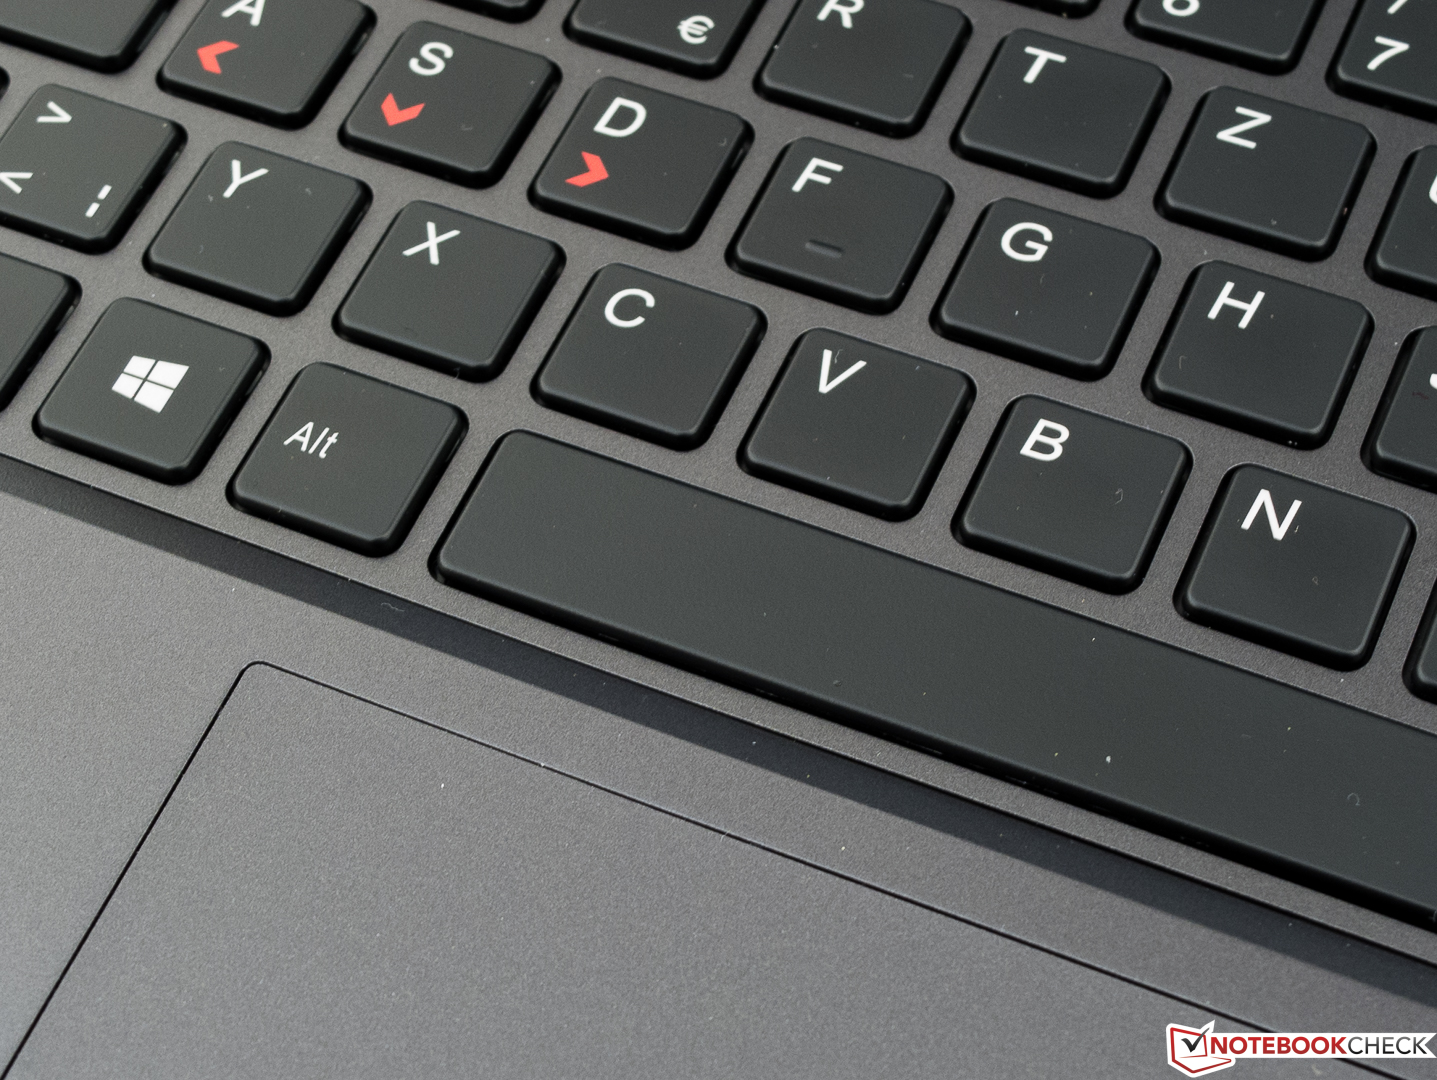
Schenker decided against a separate numeric keypad, which enables normal-sized keys with a sufficient spacing of around 3 mm (~0.12 in). The layout is a bit special, because some keys like Pos 1, Page Up/Down and End are in an additional column right next to the Return key, but you should get used to it quickly. The flat and non-slip keys have an average travel as well as a firm pressure point and a well-defined pressure point. The typing experience was fast and free of fatigue.
Both the lettering and the even illumination, which can be adjusted in five levels, leave an excellent impression. The build quality did not reveal any flaws, either. That the keyboard can hardly be dented only supports the great overall impression it left during the review. Even demanding frequent writers should be satisfied. Only the high noise from the bigger keys like the space bar could be an issue for noise-sensitive users.
Display
IPS panels are synonymous for wide viewing angles and good color reproduction, but sometimes still have small issues with reaction times. This is also the case for the matte screen of the Schenker XMG P406, even though the Full HD resolution is nearly ideal for gamers. The situation is better for the decent, but not overwhelming maximum brightness of 266 cd/m² (on average). The same also applies for the rivals except for the Alienware and Nexoc, which are too dark for their price. Due to the 14-inch screen, you get a pixel density of 157 PPI, which creates a sharp picture where you cannot see individual pixels.
Despite the low brightness distribution of 81%, a black picture looks very homogenous. Our review sample only shows small signs of screen bleeding at the lower left frame, but it is not visible in practice. The manufacturer does not offer any other panel options.
| |||||||||||||||||||||||||
Brightness Distribution: 81 %
Center on Battery: 282 cd/m²
Contrast: 1282:1 (Black: 0.22 cd/m²)
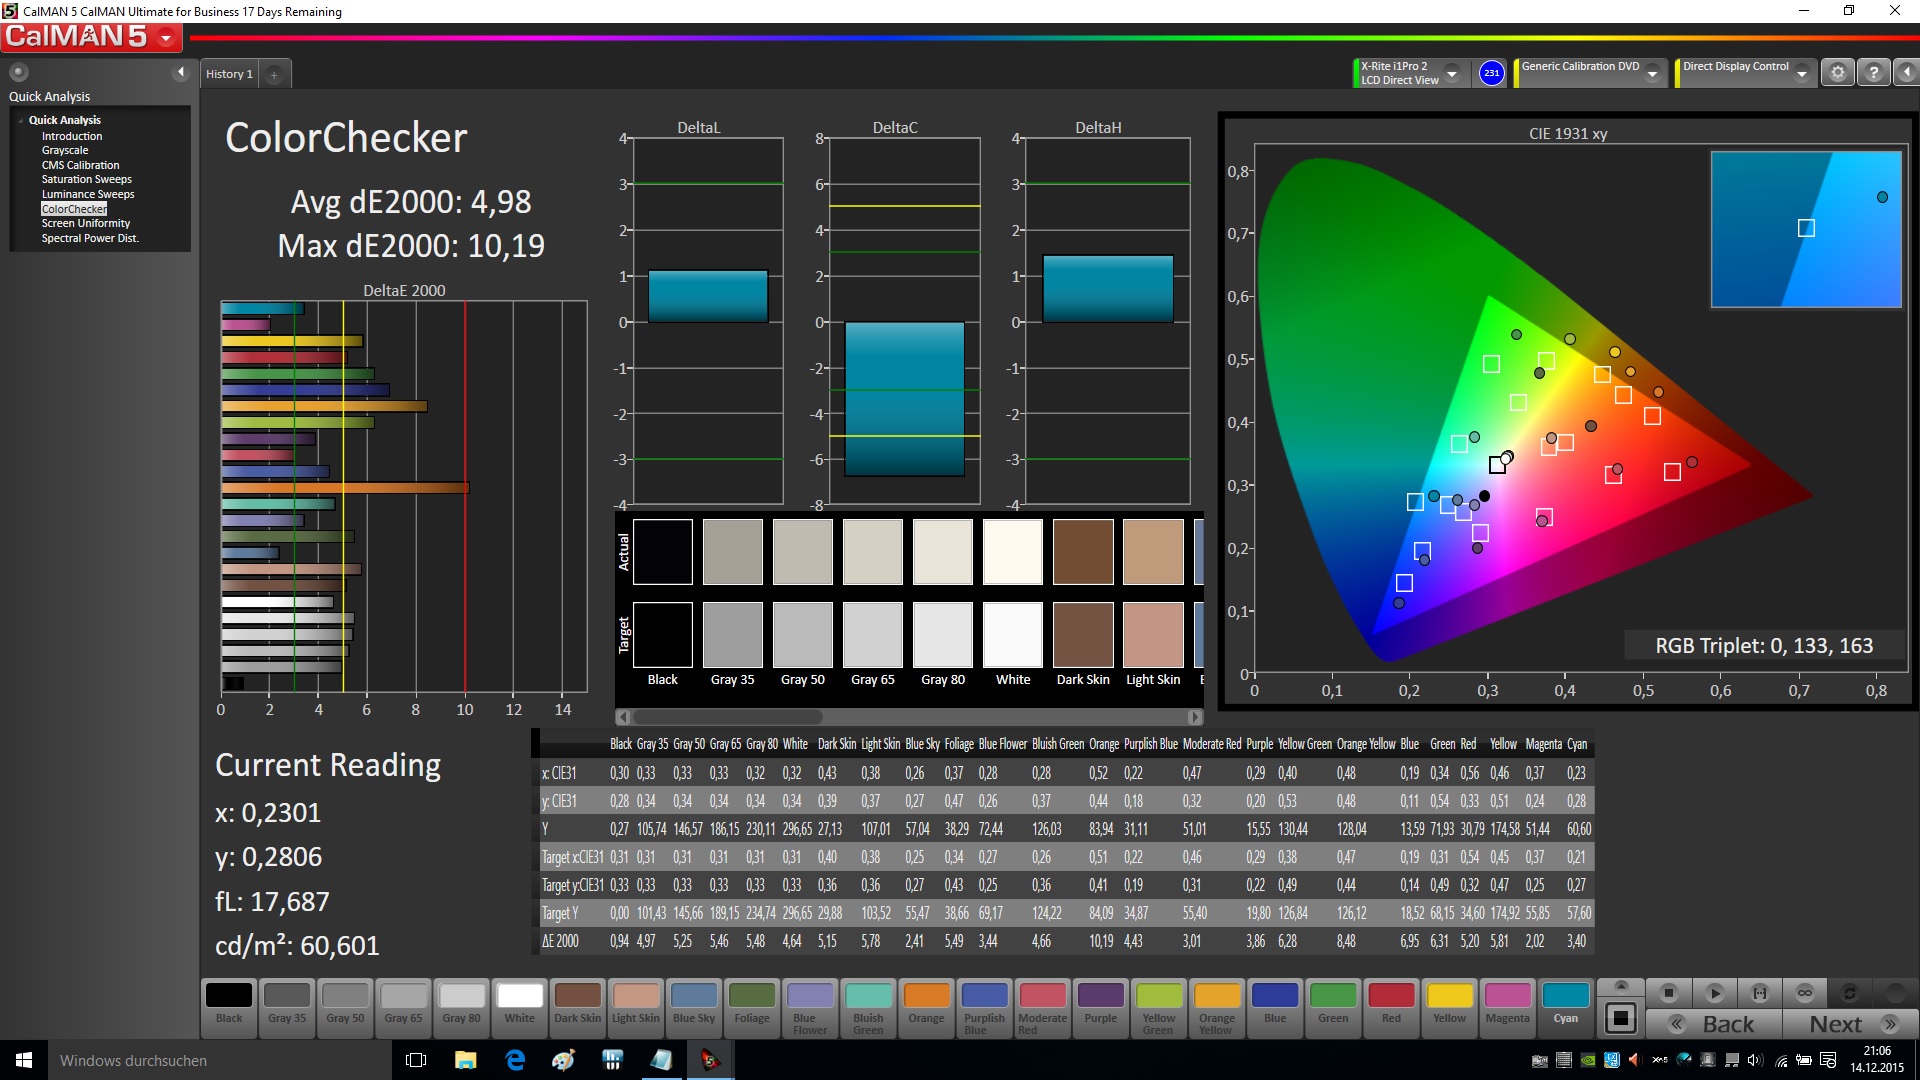
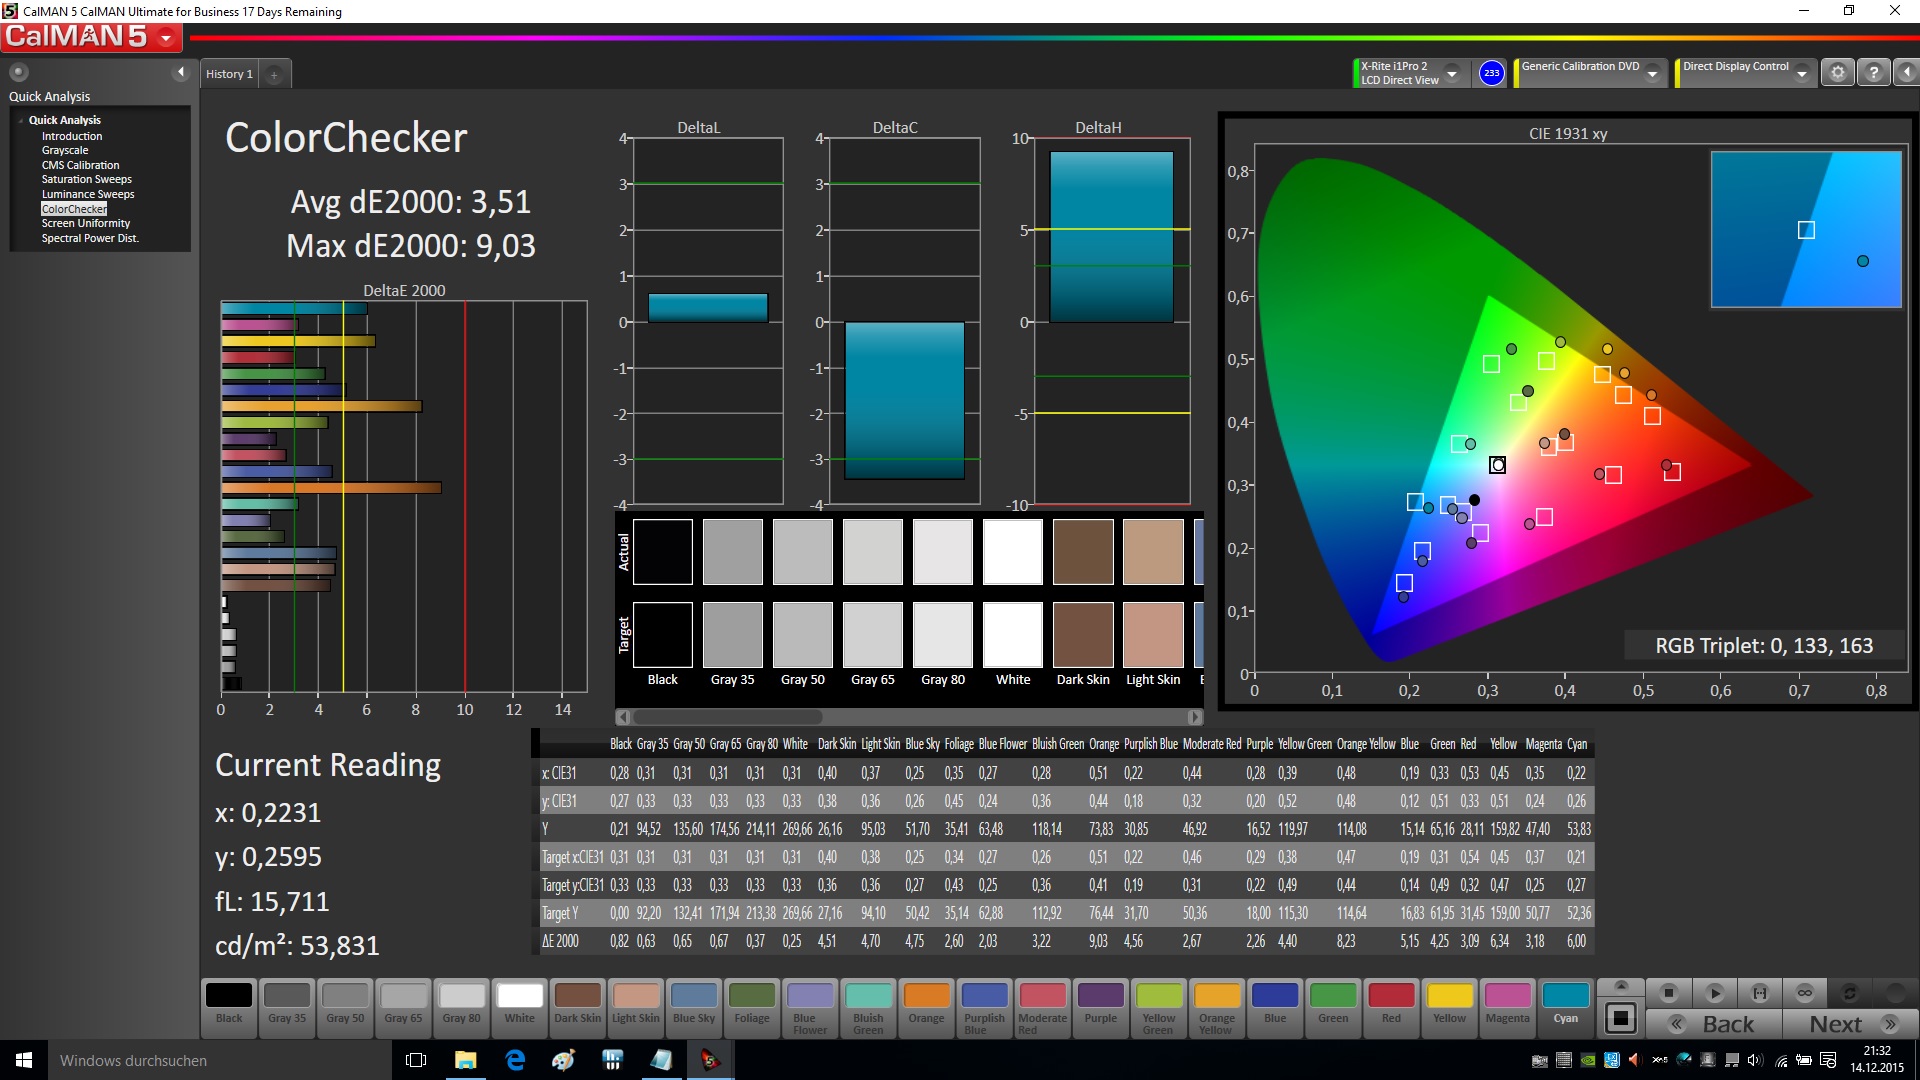
ΔE ColorChecker Calman: 4.98 | ∀{0.5-29.43 Ø4.72}
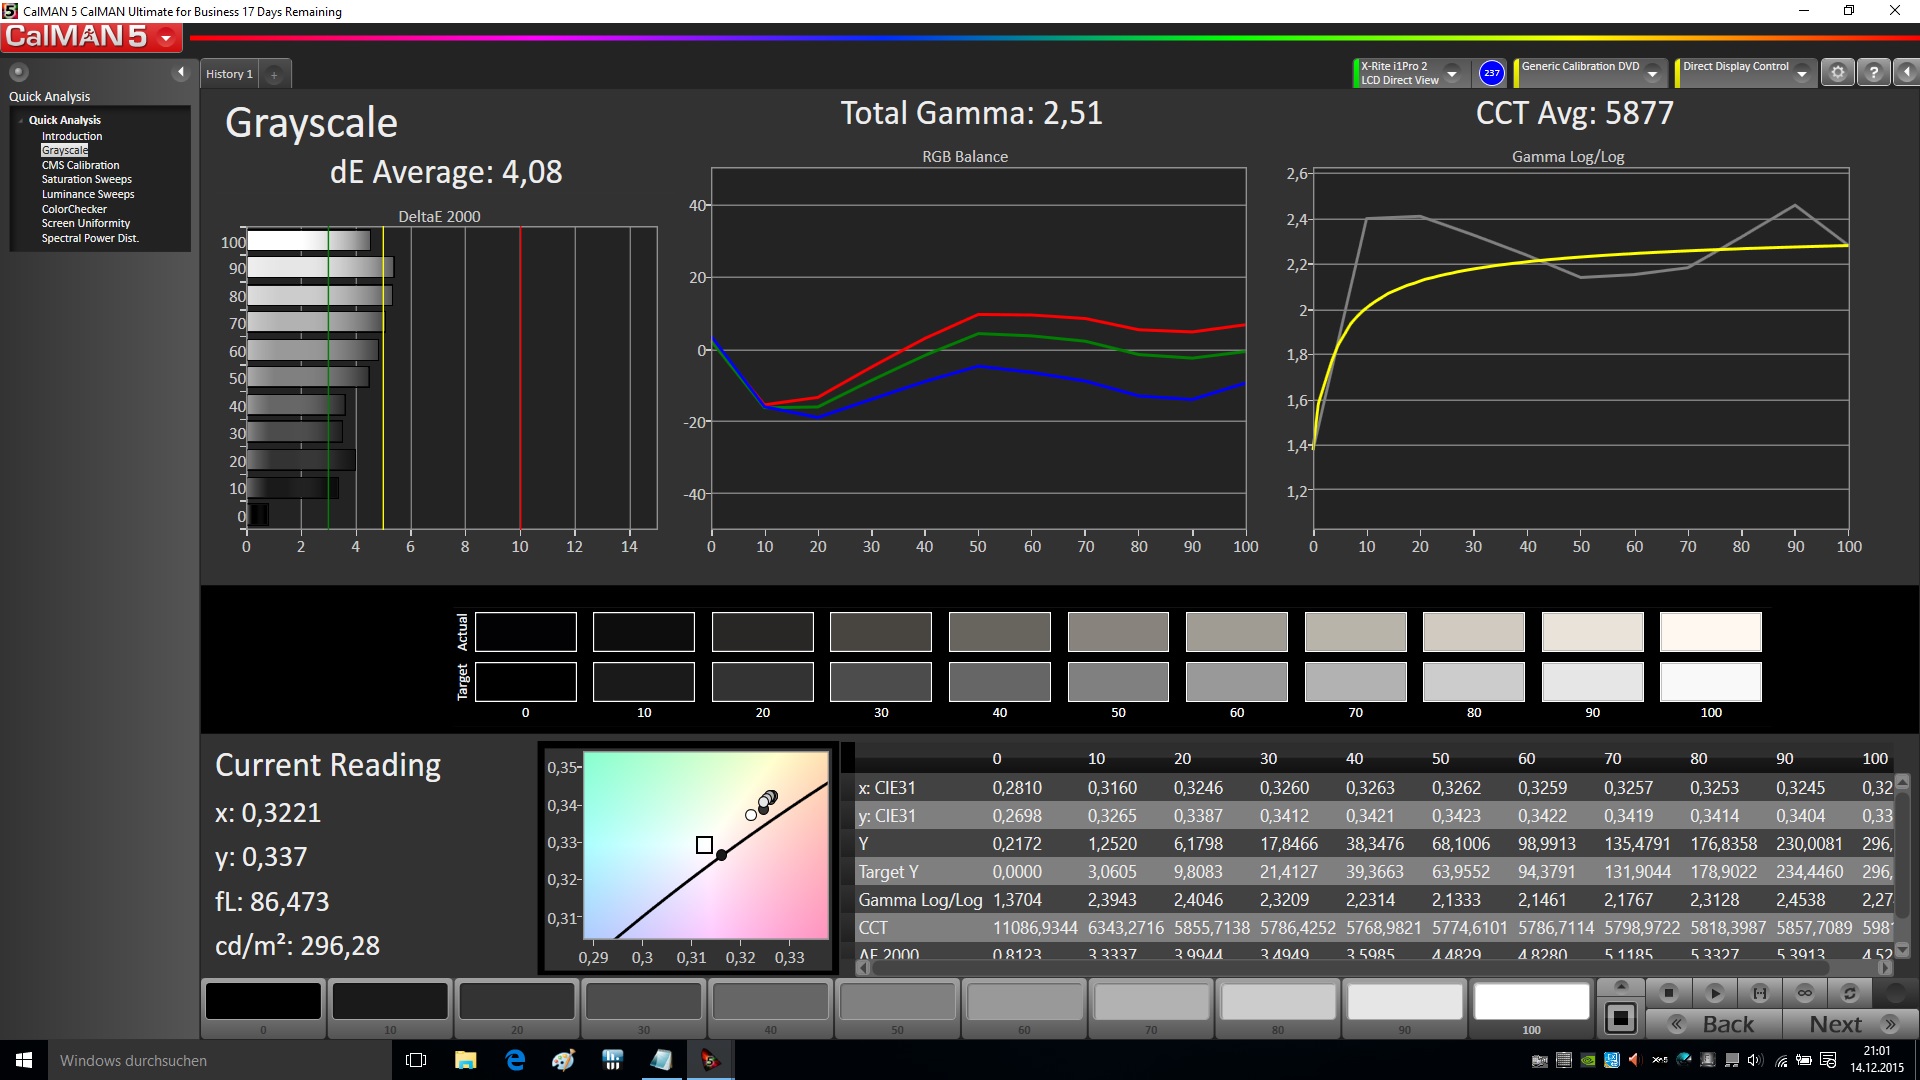
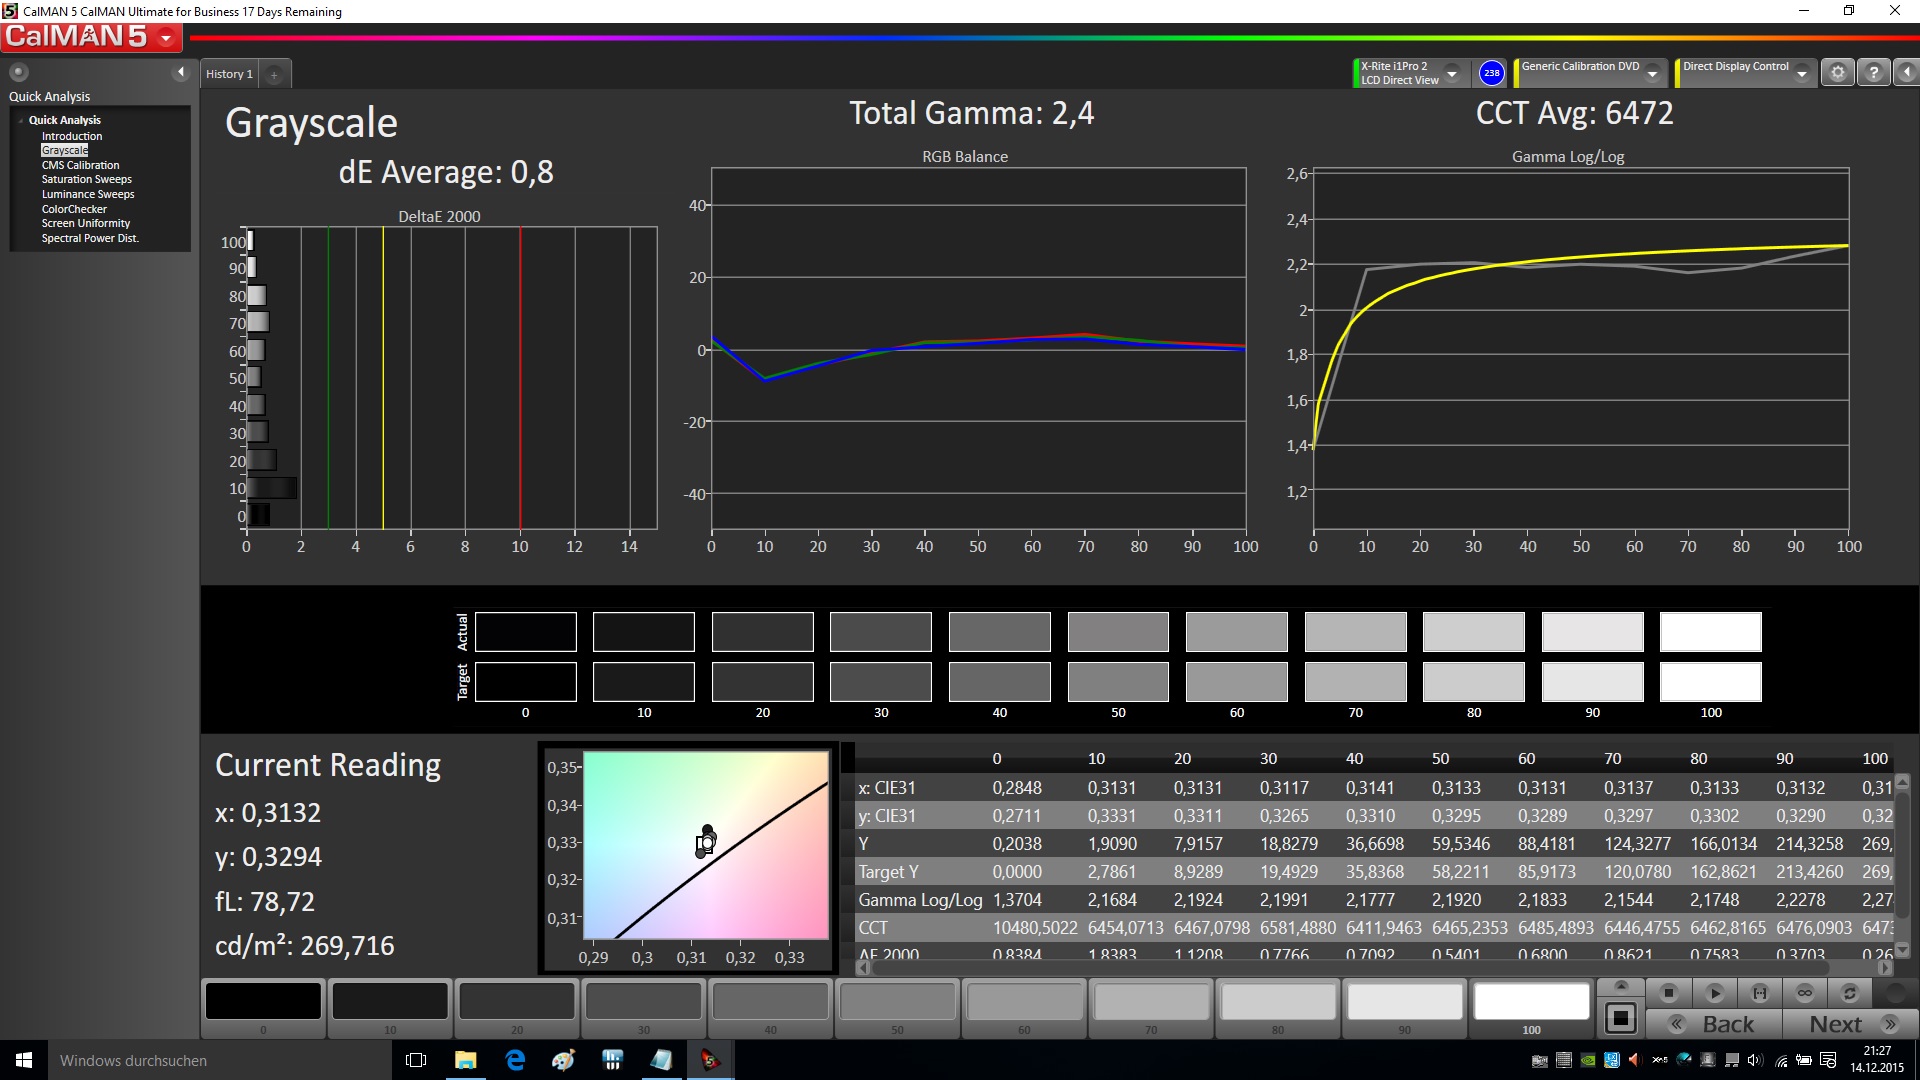
ΔE Greyscale Calman: 4.08 | ∀{0.09-98 Ø4.97}
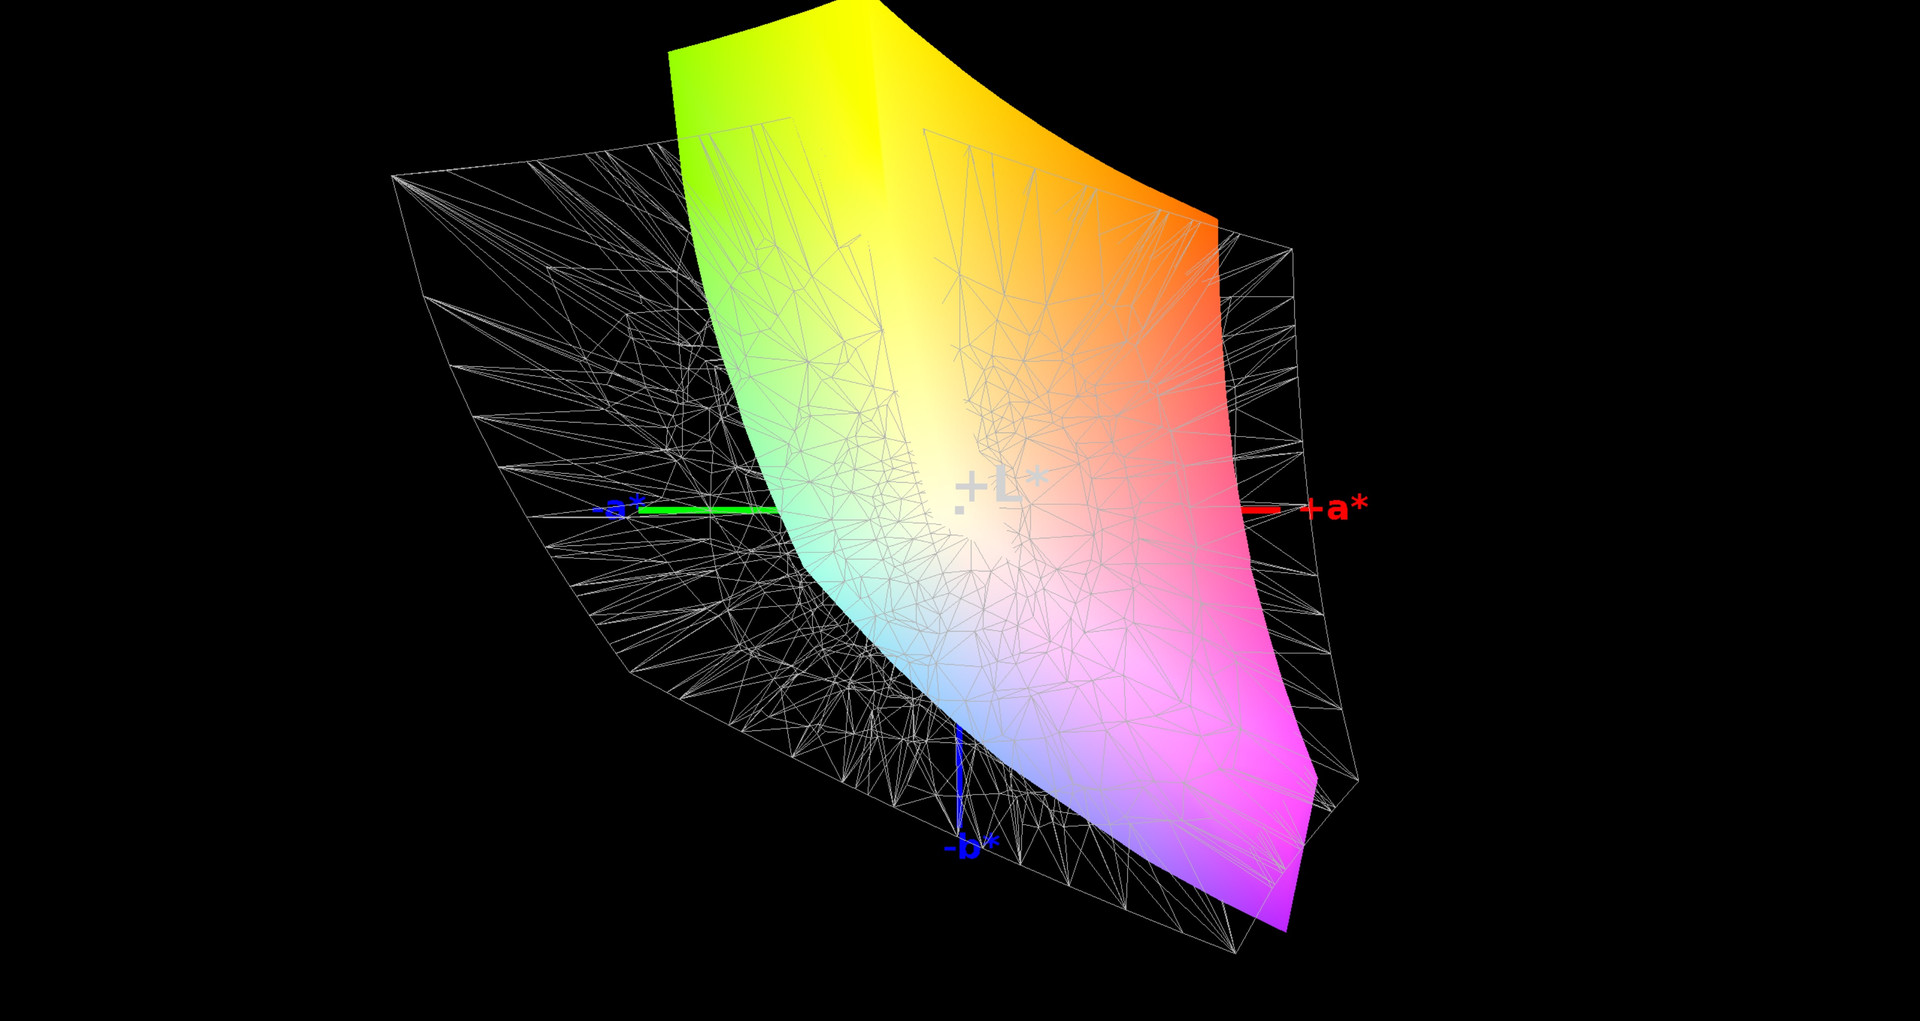
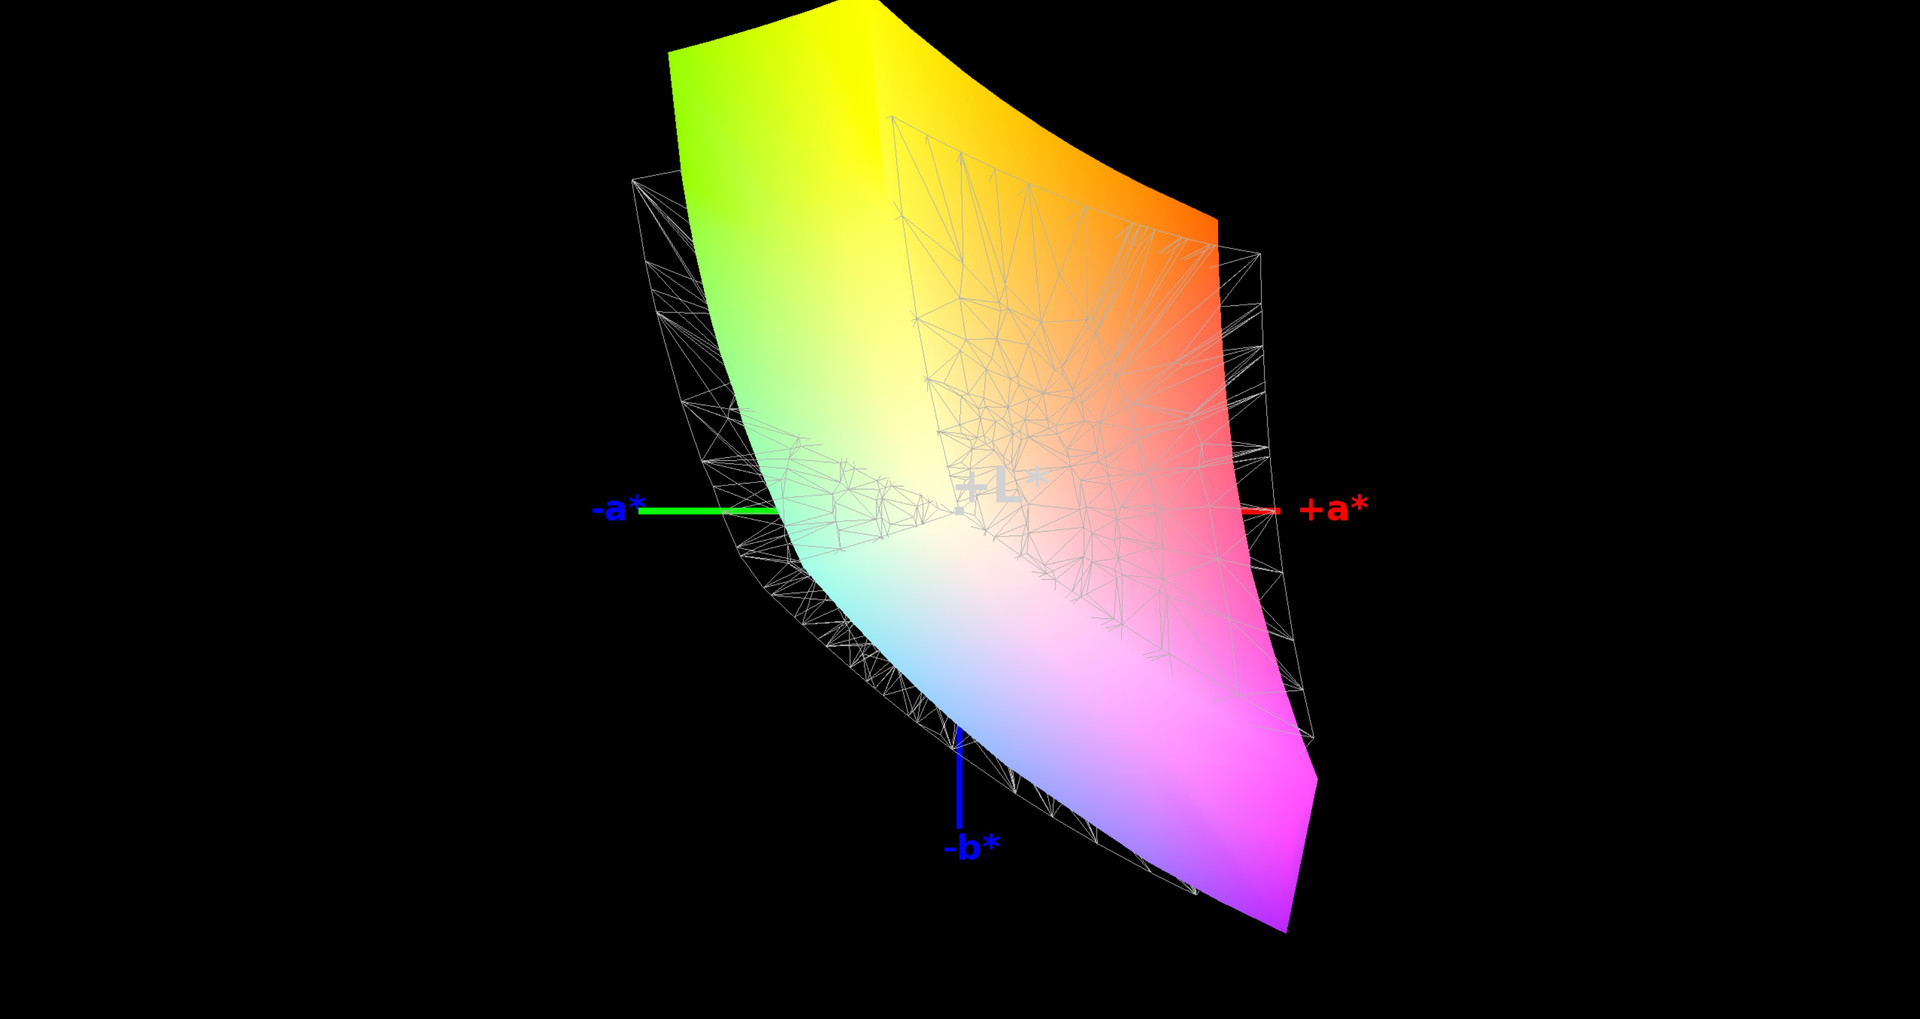
83% sRGB (Argyll 1.6.3 3D)
54% AdobeRGB 1998 (Argyll 1.6.3 3D)
60.5% AdobeRGB 1998 (Argyll 3D)
82.8% sRGB (Argyll 3D)
66.2% Display P3 (Argyll 3D)
Gamma: 2.51
CCT: 5877 K
Surprisingly low is the black value of the review unit (0.22 cd/m²), which supports our subjective impression of rich blacks. This will result in a great contrast ratio of 1282:1 in combination with the decent luminance. The Alienware 15 R2 can even display deeper blacks, but "only" manages 947:1, which is still very good, due to the lower luminance. The black value of the Gigabyte P34W is way too high at 0.72 cd/m². This results in a poor contrast of 424:1 that you would expect from a notebook for 400 Euros (~$436).
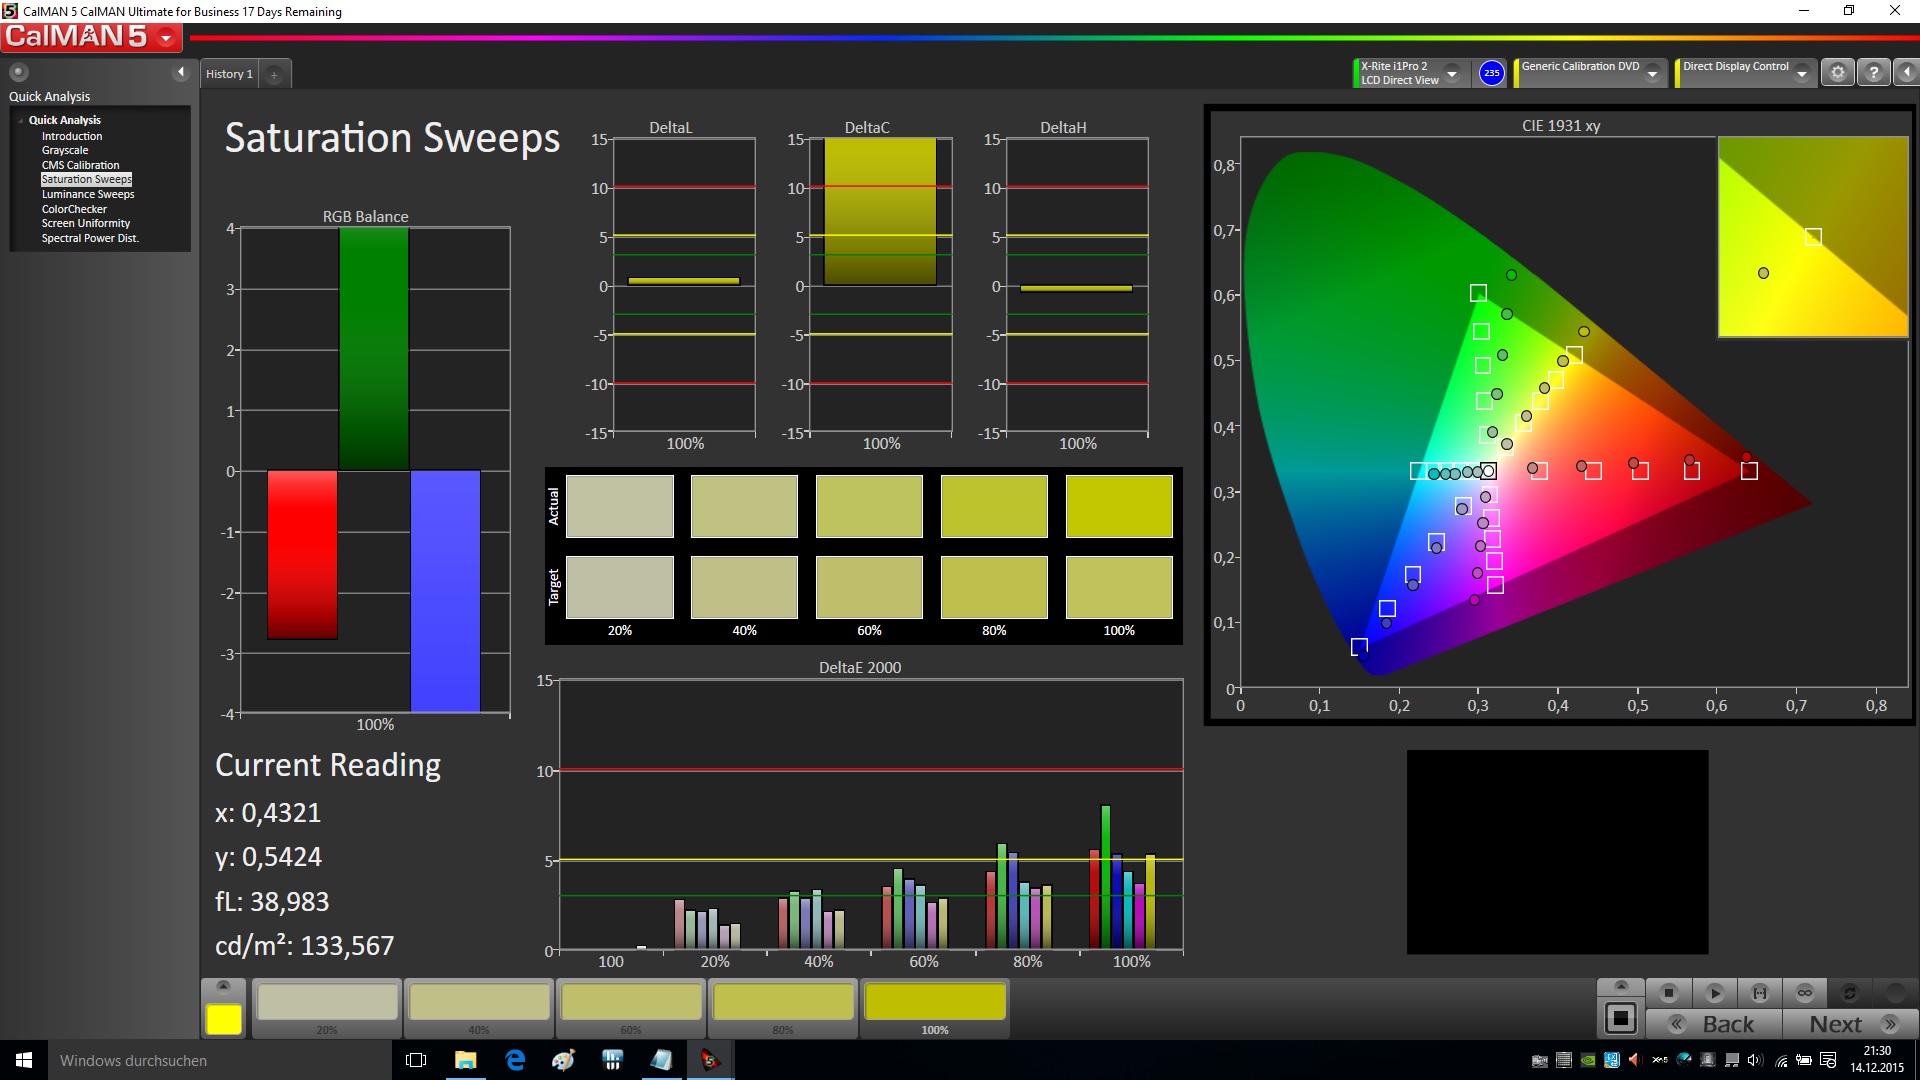
The color deviations from the standard, which are represented by the DeltaE value, are okay for an IPS display at 4 (Grayscale) and 5 (ColorChecker), respectively. The target values should be smaller than three, which is actually realized by the aforementioned and criticized Gigabyte and also the review unit after the calibration (profile linked in the box). The AdobeRGB color space is usually only important for serious picture editing, and the measured coverage of 54% is slightly behind the best panels (60% +) in this comparison, where the low-contrast Gigabyte is once again at the top.
| Schenker XMG P406 | MSI GS40-6QE16H11 | Schenker XMG C405 | Gigabyte P34W V3 | Alienware 15 R2 (Skylake) | Nexoc G515 II | |
|---|---|---|---|---|---|---|
| Display | 2% | 6% | 9% | -32% | -35% | |
| Display P3 Coverage (%) | 66.2 | 66.2 0% | 66.8 1% | 69.4 5% | 40.3 -39% | 38.59 -42% |
| sRGB Coverage (%) | 82.8 | 85.7 4% | 89.6 8% | 92.6 12% | 60.2 -27% | 57.8 -30% |
| AdobeRGB 1998 Coverage (%) | 60.5 | 62.6 3% | 65.6 8% | 67.4 11% | 41.67 -31% | 39.88 -34% |
| Response Times | 34% | 10% | ||||
| Response Time Grey 50% / Grey 80% * (ms) | 56 ? | 31 ? 45% | 48.8 ? 13% | |||
| Response Time Black / White * (ms) | 30 ? | 23 ? 23% | 28 ? 7% | |||
| PWM Frequency (Hz) | 200 ? | |||||
| Screen | -20% | -13% | -21% | -26% | -25% | |
| Brightness middle (cd/m²) | 282 | 304 8% | 280 -1% | 305.4 8% | 180 -36% | 232 -18% |
| Brightness (cd/m²) | 266 | 282 6% | 267 0% | 277 4% | 179 -33% | 216 -19% |
| Brightness Distribution (%) | 81 | 88 9% | 85 5% | 84 4% | 83 2% | 82 1% |
| Black Level * (cd/m²) | 0.22 | 0.37 -68% | 0.32 -45% | 0.72 -227% | 0.19 14% | 0.3 -36% |
| Contrast (:1) | 1282 | 822 -36% | 875 -32% | 424 -67% | 947 -26% | 773 -40% |
| Colorchecker dE 2000 * | 4.98 | 7.47 -50% | 4.75 5% | 2.81 44% | 6.74 -35% | 6.26 -26% |
| Colorchecker dE 2000 max. * | 10.2 | |||||
| Greyscale dE 2000 * | 4.08 | 6.51 -60% | 5.91 -45% | 1.92 53% | 6.44 -58% | 4.98 -22% |
| Gamma | 2.51 88% | 3.71 59% | 2.52 87% | 2.21 100% | 2.29 96% | 2.25 98% |
| CCT | 5877 111% | 7840 83% | 5742 113% | 6384 102% | 6465 101% | 6968 93% |
| Color Space (Percent of AdobeRGB 1998) (%) | 54 | 56 4% | 59 9% | 60.4 12% | 38 -30% | 37 -31% |
| Color Space (Percent of sRGB) (%) | 83 | 86 4% | 60 -28% | 58 -30% | ||
| Total Average (Program / Settings) | 5% /
-8% | -4% /
-8% | -6% /
-13% | -16% /
-22% | -30% /
-27% |
* ... smaller is better
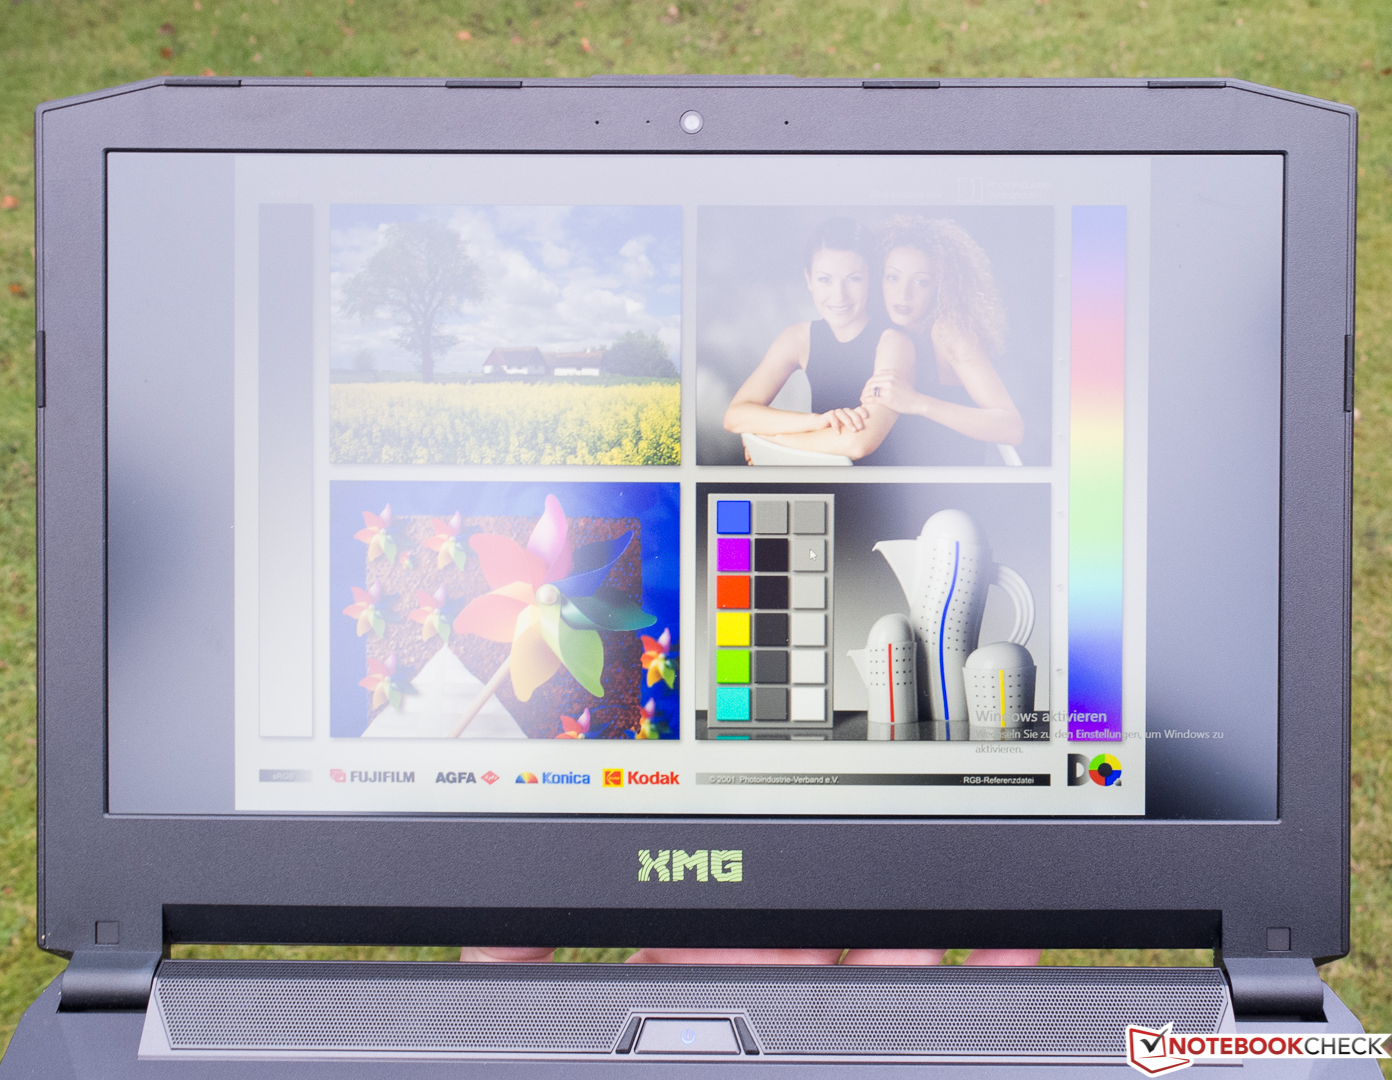
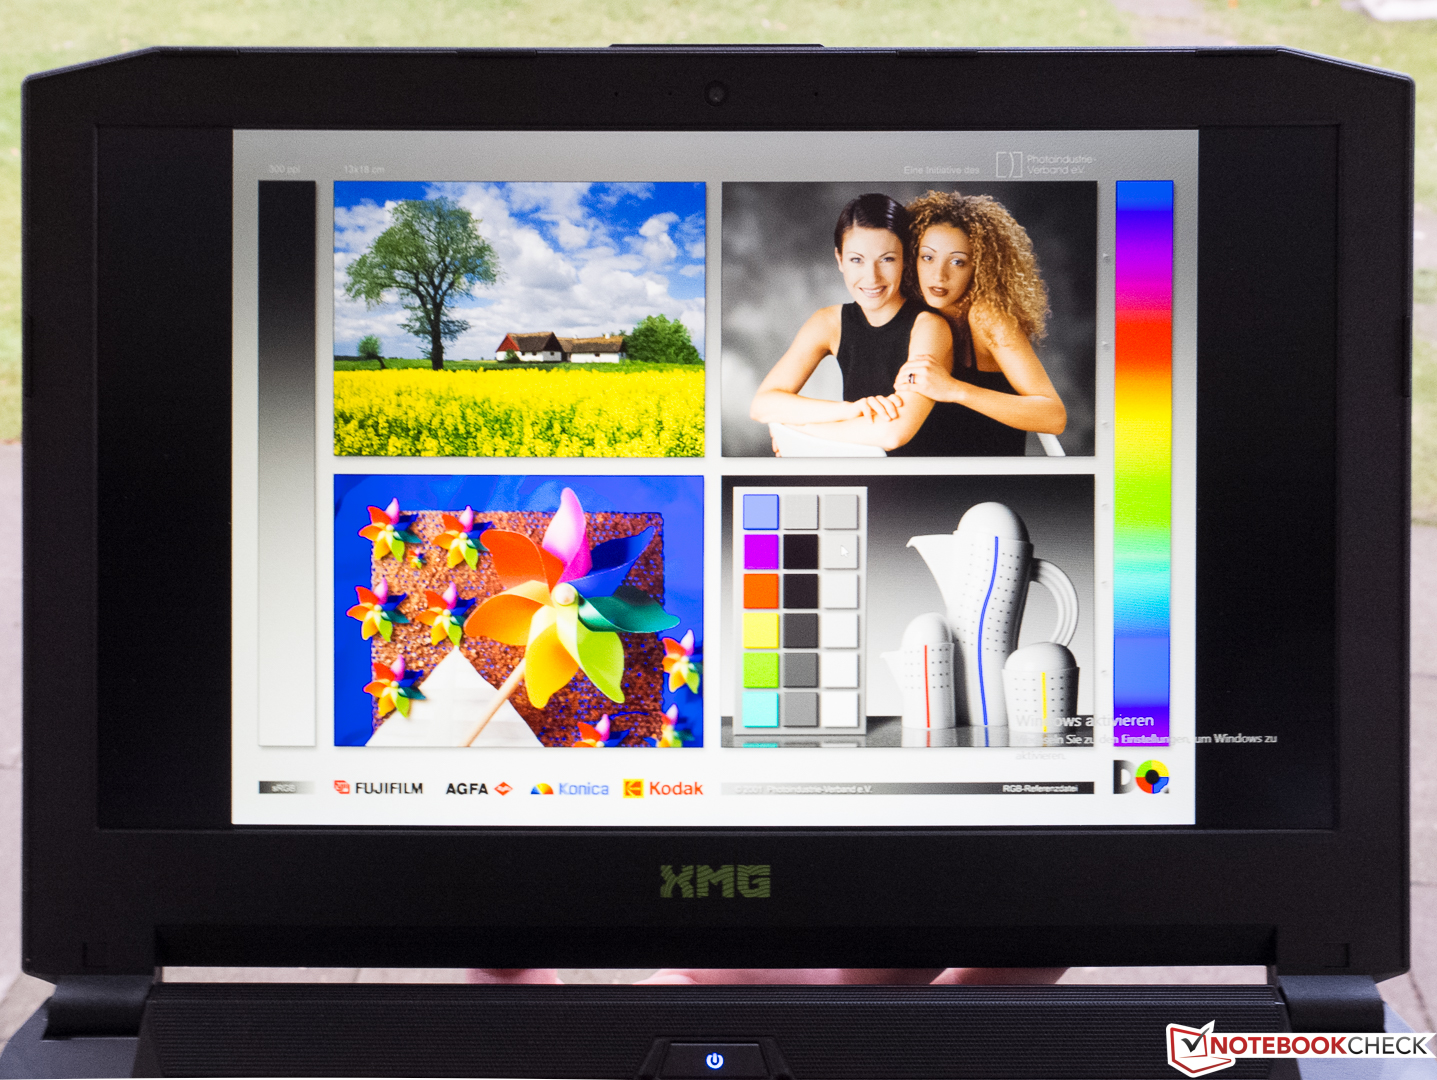
Due to the current weather situation, we were only able to check the outdoor capabilities on a cloudy and gray day. The picture on the right shows the ideal position with a house entry behind the notebook, where the usability is not limited. The left picture represents the worst-case scenario where the panel is turned directly towards the sky. The P406 is still usable in this case, but this would have been different under sunlight. The decent maximum brightness and the matte display are the best prerequisites for the outdoor usability in general.
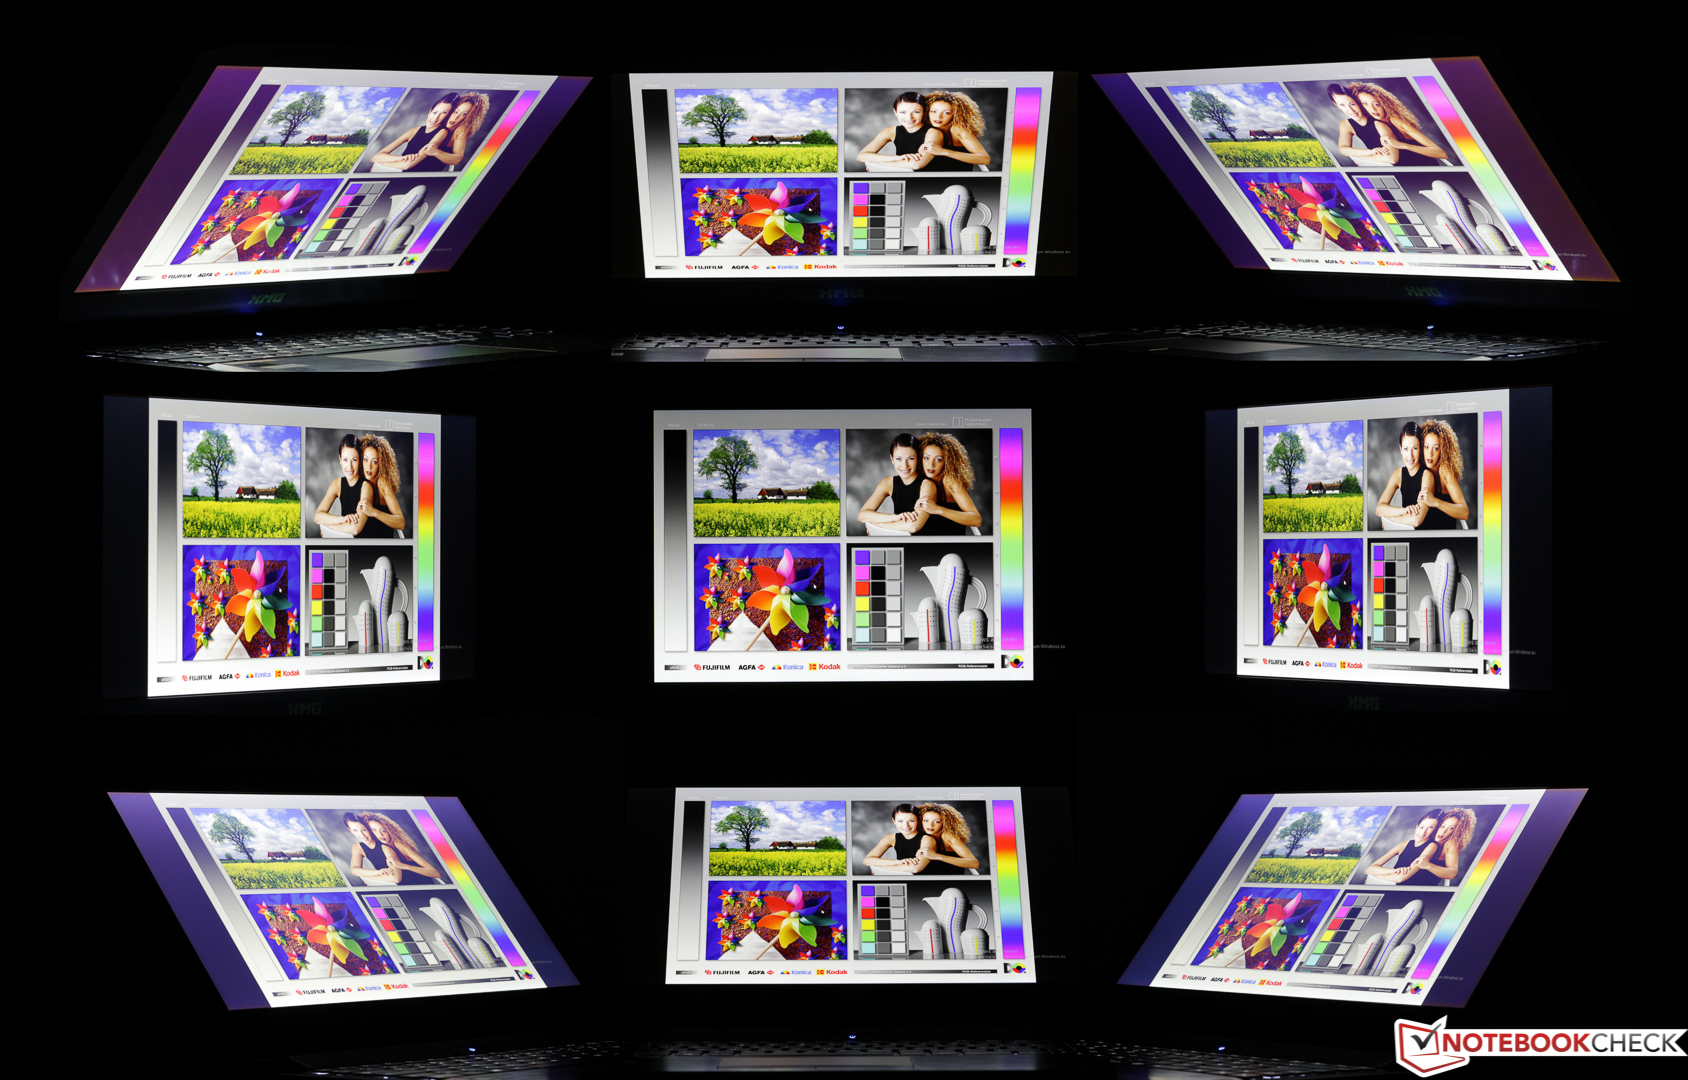
The IPS display of the XMG P406 offers the expected wide viewing angles, but the usual brightness and contrast drops from angles from above or below are visible pretty early compared to other IPS panels, while the colors hardly deviate at all. Our viewing angle picture can unfortunately hardly show this behavior. You get the best picture when you look at the panel from above. We have already seen better performances in this price range.
Display Response Times
| ↔ Response Time Black to White | ||
|---|---|---|
| 30 ms ... rise ↗ and fall ↘ combined | ↗ 8 ms rise | 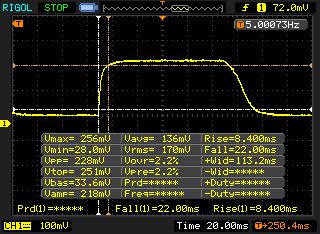 |
| ↘ 22 ms fall | ||
| The screen shows slow response rates in our tests and will be unsatisfactory for gamers. In comparison, all tested devices range from 0.1 (minimum) to 240 (maximum) ms. » 80 % of all devices are better. This means that the measured response time is worse than the average of all tested devices (19.8 ms). | ||
| ↔ Response Time 50% Grey to 80% Grey | ||
| 56 ms ... rise ↗ and fall ↘ combined | ↗ 22 ms rise | 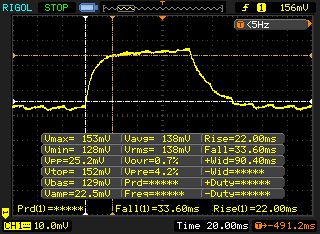 |
| ↘ 34 ms fall | ||
| The screen shows slow response rates in our tests and will be unsatisfactory for gamers. In comparison, all tested devices range from 0.165 (minimum) to 636 (maximum) ms. » 93 % of all devices are better. This means that the measured response time is worse than the average of all tested devices (31 ms). | ||
Screen Flickering / PWM (Pulse-Width Modulation)
| Screen flickering / PWM not detected | 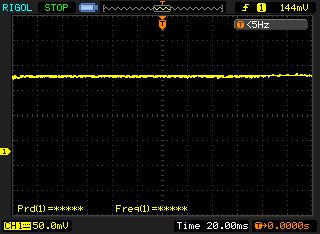 | ||
In comparison: 52 % of all tested devices do not use PWM to dim the display. If PWM was detected, an average of 7781 (minimum: 5 - maximum: 343500) Hz was measured. | |||
Performance
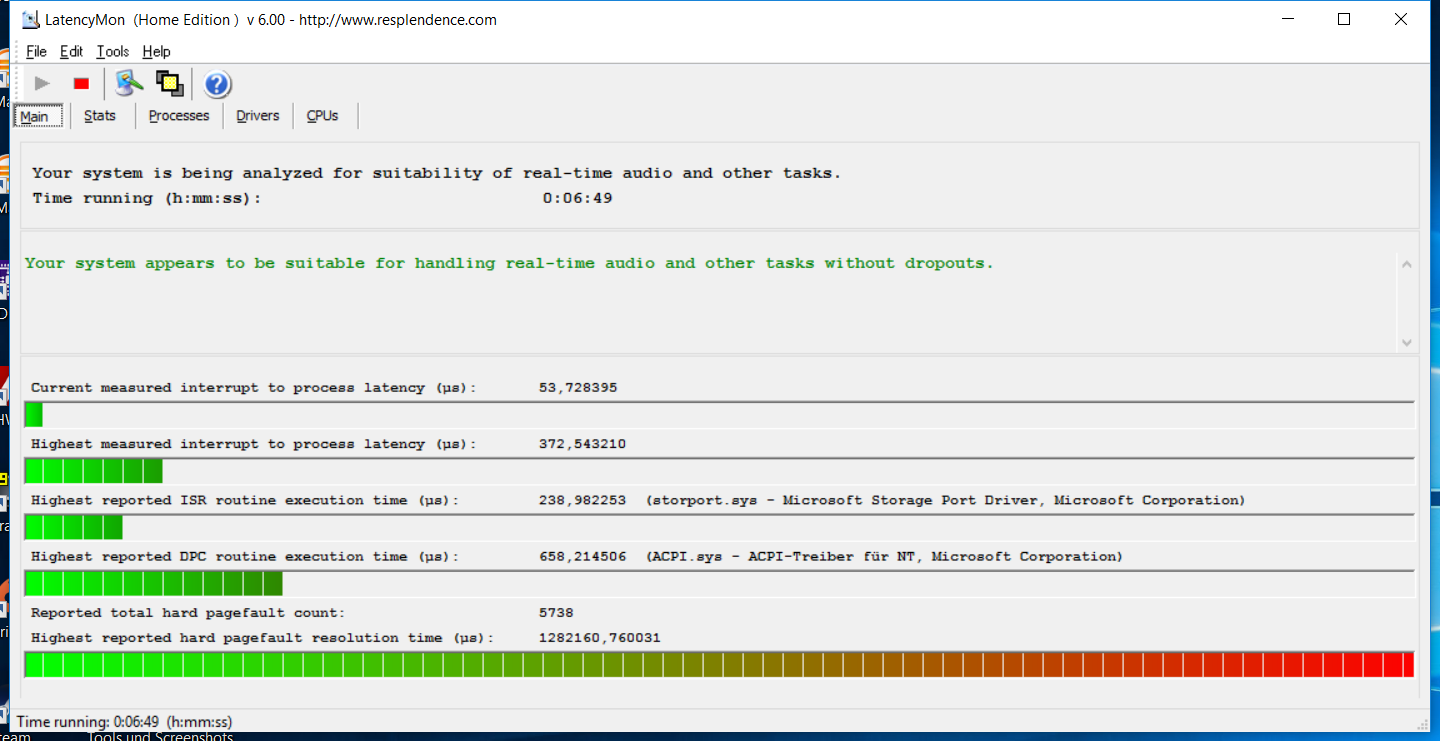
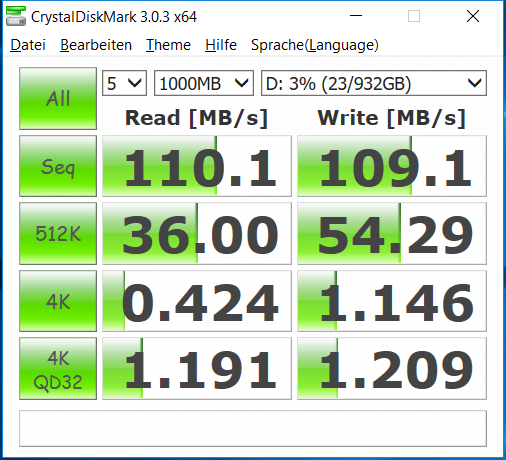
The XMG P406 is a compact gaming notebook that can usually handle even modern and GPU-demanding titles smoothly at the highest settings. Notebooks with this kind of performance are obviously more than powerful enough for all other possible usage scenarios and every common application. The fast quad-core from Intel (Core i7-6700HQ @ 2.6-3.5 GHz) supports Hyperthreading and is supported by 16 GB DDR4-RAM (dual-channel), so this even applies for heavily parallelized applications like 3D rendering that can often utilize the very powerful graphics card. A smooth operation is ensured by the fast M.2-SSD with a capacity of 256 GB, while the 1 TB HDD offers plenty of storage space. The latencies are okay according to LatencyMon.
Processor
The soldered CPU from Intel's current Skylake generation is usually designed for bigger notebooks. Thanks to the renewed architecture (Tock) and the 14 nm manufacturing process, the new chips have a slightly higher performance compared to the previous Haswell chips like the comparable i7-4810MQ (4x 2.6 up to 3.6 GHz, Hyperthreading, 47 W TDP), but more importantly a higher efficiency. The Turbo Boost is limited to 3.1 GHz when you stress all four cores and 3.3 GHz for two cores. Intel also includes a frugal GPU with the designation HD Graphics 530, which can automatically be activated via Nvidia Optimus for simple tasks. A new feature of Skylake is the support for fast DDR4-RAM.
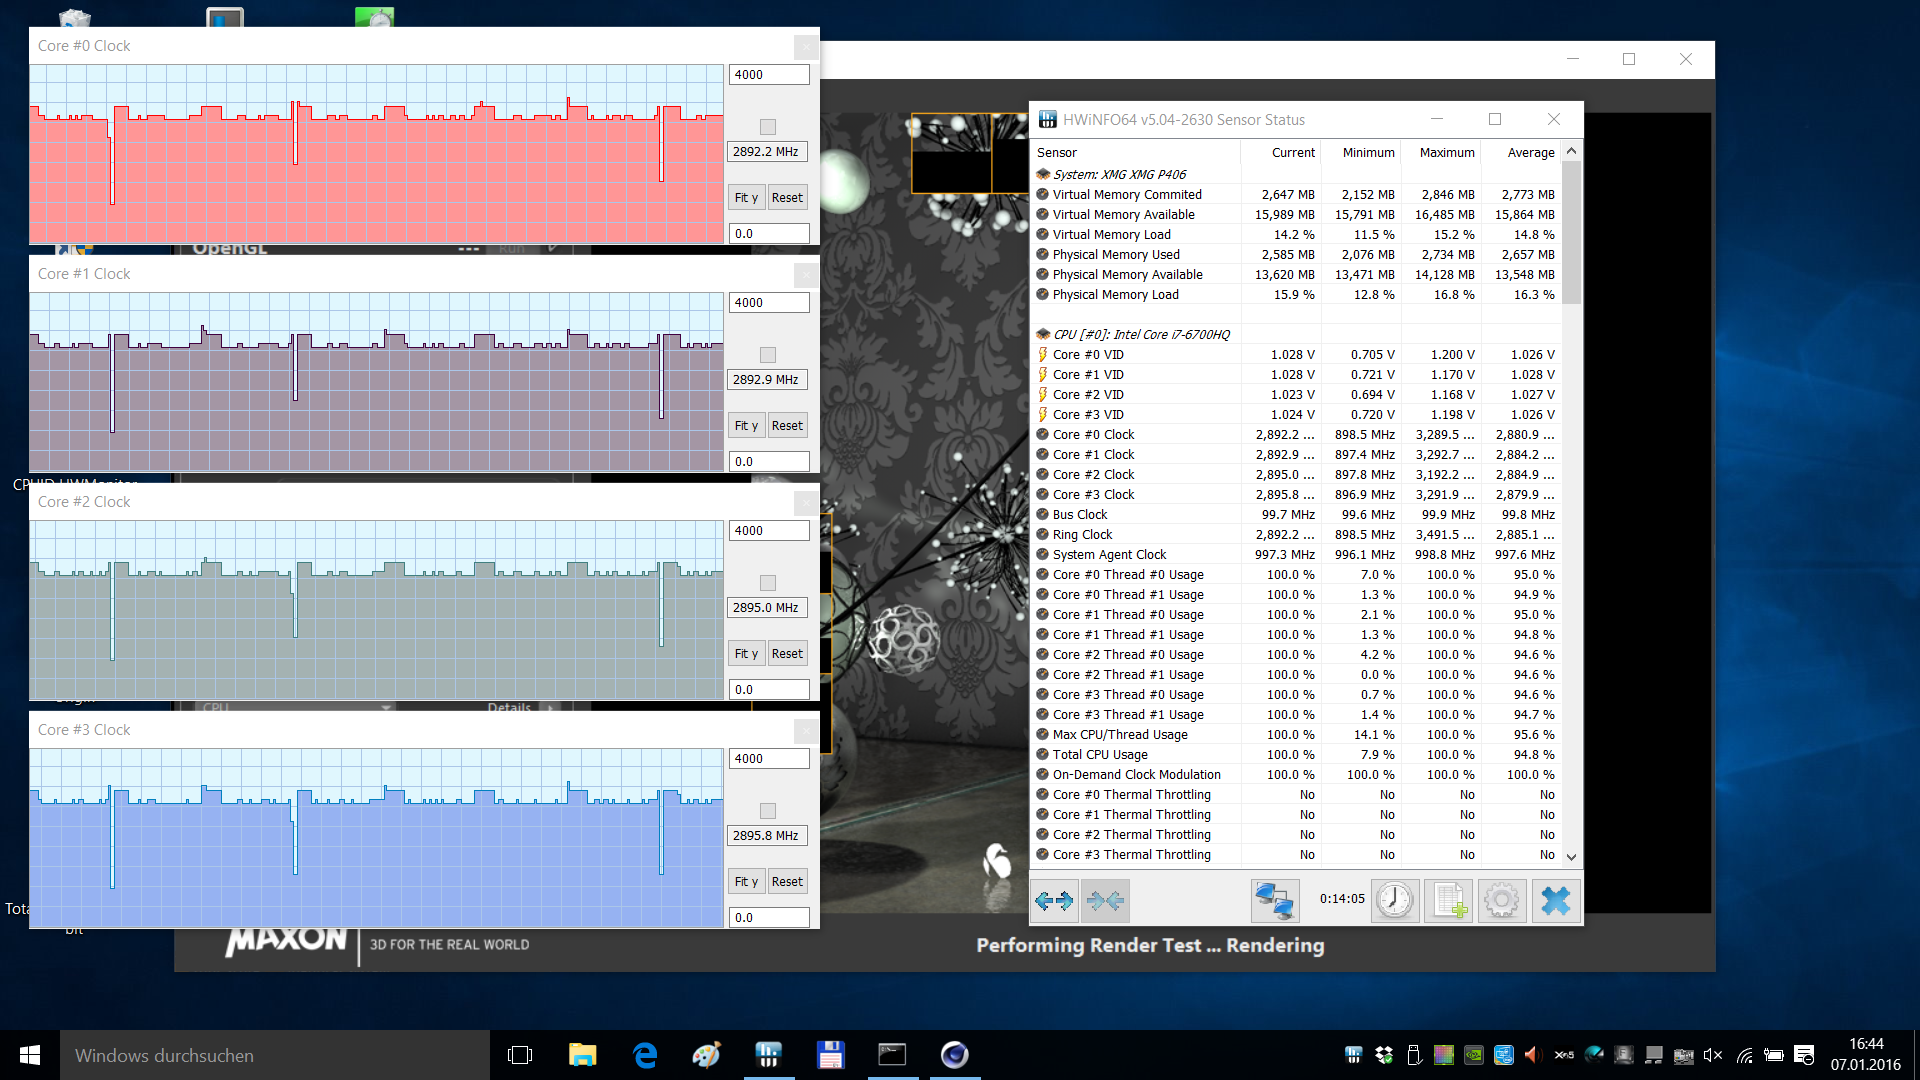
The Cinebench scores are on the expected performance level, and the comparison below does not show any surprises, either. The i7-6700HQ chips of the comparison notebooks are on par; the two i7-4720HQ chips cannot quite keep up, but do not affect the gaming performance. Our Cinebench 15 loop (Multi) was executed with 3.1 GHz at first, but then started to fluctuate. The average frequency was 2.9 GHz after 15 minutes, so the Turbo utilization is not perfect. The CB R15 score drops by 47% to 357 points on battery power. Even more benchmarks are available in our Tech-section.
| Cinebench R10 | |
| Rendering Multiple CPUs 32Bit (sort by value) | |
| Schenker XMG P406 | |
| Schenker XMG C405 | |
| Gigabyte P34W V3 | |
| Nexoc G515 II | |
| Rendering Single 32Bit (sort by value) | |
| Schenker XMG P406 | |
| Schenker XMG C405 | |
| Gigabyte P34W V3 | |
| Nexoc G515 II | |
System Performance
The powerful hardware can meet the expectations. Starting with the proven PCMark 7, which benefits from fast storage drives in particular, there are no noteworthy differences between the comparison devices. The situation is similar in PCMark 8, even though the Schenker falls behind by 11 up to 16% in the Home benchmark (v2). This is not a big problem though.
| PCMark 7 Score | 6147 points | |
| PCMark 8 Home Score Accelerated v2 | 3371 points | |
| PCMark 8 Work Score Accelerated v2 | 5023 points | |
Help | ||
| PCMark 7 - Score (sort by value) | |
| Schenker XMG P406 | |
| MSI GS40-6QE16H11 | |
| Gigabyte P34W V3 | |
| Alienware 15 R2 (Skylake) | |
| Nexoc G515 II | |
| PCMark 8 | |
| Home Score Accelerated v2 (sort by value) | |
| Schenker XMG P406 | |
| MSI GS40-6QE16H11 | |
| Schenker XMG C405 | |
| Gigabyte P34W V3 | |
| Alienware 15 R2 (Skylake) | |
| Nexoc G515 II | |
| Work Score Accelerated v2 (sort by value) | |
| Schenker XMG P406 | |
| MSI GS40-6QE16H11 | |
| Schenker XMG C405 | |
| Gigabyte P34W V3 | |
| Alienware 15 R2 (Skylake) | |
| Nexoc G515 II | |
Storage Devices
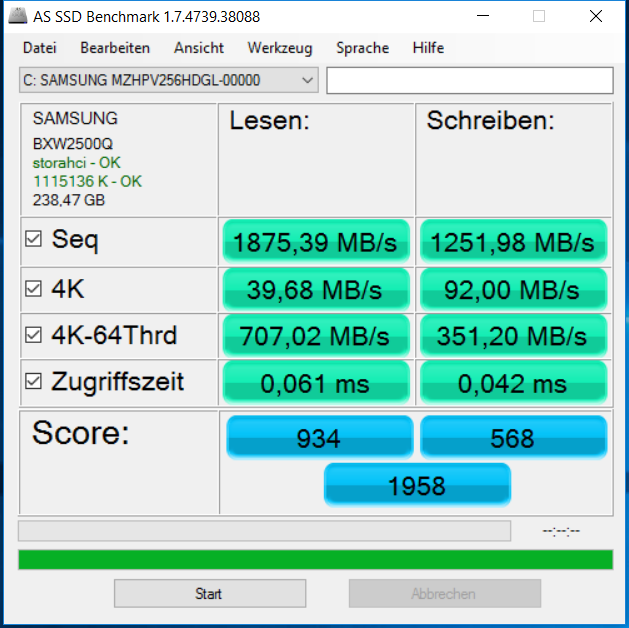
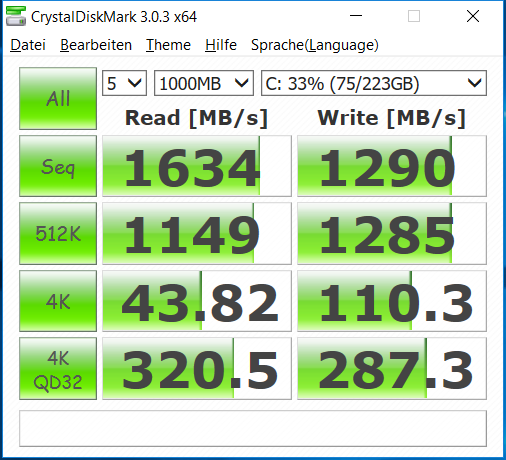
Schenker implements a removable M.2-SSD, which is not limited by the SATA-3 standard thanks to the PCIe interface. This is clearly visible when we look at the enormous sequential read result of almost 1900 MB/s (!), which can only be matched by the similarly equipped Nexoc G515 II. Gamers can benefit from the high transfer rates, because many games load data in large bundled files from the drive. However, you will not feel a difference compared to a SATA-3 SSD in common tasks.
The read performance of small and random 4K blocks (~40 MB/s) is also excellent, where 30 MB/s are already a good result. A small drawback, which should not really matter in practice, is the read performance of 4K blocks with multiple threads (4K-64 Read) simultaneously, since it falls behind the Nexoc G515 II by 36%. The Schenker XMG can secure the first place in terms of writing performance, which is not that important.

| Schenker XMG P406 Samsung SM951 MZHPV256HDGL m.2 PCI-e | MSI GS40-6QE16H11 Samsung MZFLV128 NVMe | Schenker XMG C405 Crucial M550 CT256M550SSD3 | Gigabyte P34W V3 Lite-On LMT-128L9M | Alienware 15 R2 (Skylake) Samsung PM951 NVMe MZ-VLV256D | Nexoc G515 II Samsung SM951 MZHPV256HDGL m.2 PCI-e | |
|---|---|---|---|---|---|---|
| AS SSD | -23% | -37% | -48% | 6% | ||
| Seq Read (MB/s) | 1875 | 1834 -2% | 523 -72% | 487 -74% | 1863 -1% | |
| Seq Write (MB/s) | 1252 | 289.1 -77% | 475.6 -62% | 322.9 -74% | 1174 -6% | |
| 4K Read (MB/s) | 39.68 | 45.54 15% | 30.61 -23% | 30.97 -22% | 39.56 0% | |
| 4K Write (MB/s) | 92 | 102.4 11% | 97.6 6% | 67.9 -26% | 92.6 1% | |
| Score Read (Points) | 934 | 967 4% | 468 -50% | 446 -52% | 1326 42% | |
| Score Write (Points) | 568 | 65 -89% | 450 -21% | 357 -37% | 554 -2% | |
| CrystalDiskMark 3.0 | -7% | -39% | -50% | -19% | -2% | |
| Read Seq (MB/s) | 1634 | 1332 -18% | 517 -68% | 504 -69% | 1213 -26% | 1612 -1% |
| Write Seq (MB/s) | 1290 | 687 -47% | 496.6 -62% | 337.4 -74% | 306 -76% | 1196 -7% |
| Read 4k (MB/s) | 43.82 | 49.57 13% | 33.03 -25% | 33.13 -24% | 42.62 -3% | 43.92 0% |
| Write 4k (MB/s) | 110.3 | 138.8 26% | 111.3 1% | 75 -32% | 143.7 30% | 110.9 1% |
| Total Average (Program / Settings) | -15% /
-16% | -38% /
-38% | -49% /
-48% | -19% /
-19% | 2% /
3% |
GPU Performance
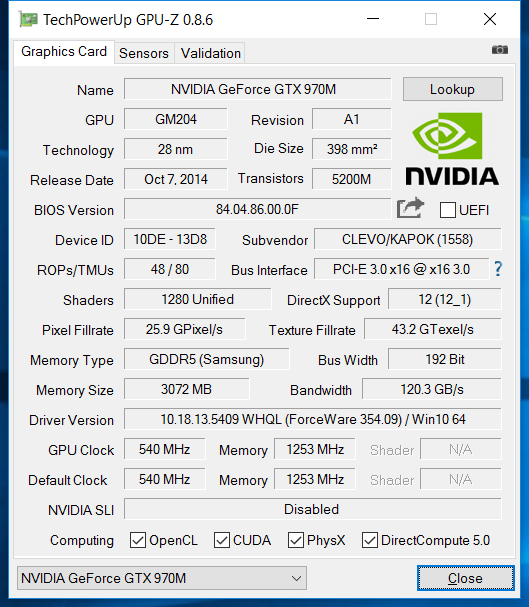
Just like the even faster high-end model GTX 980M (+ 20-30%), the GTX 970M inside the P406 is also based on Nvidia's Maxwell chip GM204, which is manufactured in a 28-nm process. The memory size of 3 GB is actually not that generous anymore, and the memory is attached via a 192-bit interface. The card supports DirectX 12 with feature level 12_1, which is already available in Windows 10. It can even handle modern and GPU-demanding titles in maximum settings and quality features like anti-aliasing, as long as you are satisfied with the Full HD resolution. If you want to use these quality settings with even higher resolutions, you should have a look at the GTX 980M or GTX 980.
How does the Schenker XMG P406 perform compared to other high-end notebooks with the GTX 970M? If you ignore SLI systems and look at the 3DMark scores, you can see that the performance is on the expected level. Interesting is also the comparison with notebooks that are equipped with the much slower GTX 960M (Nexoc G515 II) and the GTX 980M of the Alienware 15 R2. 3DMark 11 determines the expected score with an advantage of 19-27% for the 980M and a deficit of 39-43% for the GTX 960M. The CPU performance is already significantly reduced on battery power, so we can assume the same for the GPU.
| 3DMark 11 Performance | 9332 points | |
| 3DMark Cloud Gate Standard Score | 21052 points | |
| 3DMark Fire Strike Score | 6564 points | |
Help | ||
| 3DMark | |
| 1920x1080 Fire Strike Graphics (sort by value) | |
| Schenker XMG P406 | |
| MSI GS40-6QE16H11 | |
| Schenker XMG C405 | |
| Gigabyte P34W V3 | |
| Alienware 15 R2 (Skylake) | |
| Nexoc G515 II | |
| 1280x720 Cloud Gate Standard Graphics (sort by value) | |
| Schenker XMG P406 | |
| MSI GS40-6QE16H11 | |
| Schenker XMG C405 | |
| Gigabyte P34W V3 | |
| Alienware 15 R2 (Skylake) | |
| Nexoc G515 II | |
| 3DMark 11 - 1280x720 Performance GPU (sort by value) | |
| Schenker XMG P406 | |
| MSI GS40-6QE16H11 | |
| Schenker XMG C405 | |
| Gigabyte P34W V3 | |
| Alienware 15 R2 (Skylake) | |
| Nexoc G515 II | |
Gaming Performance
We just want to refer to the table below to avoid any repetitions. The biggest challenge for the GTX 970M was the amazing looking Dragon Age Inquisition from 2014 in the highest settings. Numerous benchmarks for mobile graphics cards and some desktop models are available in our Tech-section.
| low | med. | high | ultra | |
|---|---|---|---|---|
| Metro: Last Light (2013) | 130 | 126.2 | 96.9 | 54.1 |
| Battlefield 4 (2013) | 134.2 | 58.1 | ||
| Thief (2014) | 84.3 | 49 | ||
| Middle-earth: Shadow of Mordor (2014) | 125.3 | 68.6 | 50.8 | |
| Dragon Age: Inquisition (2014) | 124.1 | 54.8 | 36.6 | |
| Batman: Arkham Knight (2015) | 102 | 59 | 0 | |
| Fallout 4 (2015) | 98.9 | 53.1 | 42.2 | |
| Just Cause 3 (2015) | 102.3 | 59.3 | 50.8 |
Emissions
System Noise
Both fans are usually deactivated while idling, but the fan that takes care of the heat from the processor likes to spin up during the boot and other occasions that cannot really be repeated and it is quite audible in this case. More stress for the CPU via Prime95 will increase the speed of the CPU fan until you can hear a loud, but convenient murmur without annoying characteristics even from a couple of meters (~6 feet) away. The GPU fan will join the party when we stress the GPU via FurMark; this does not really increase the system noise, but the murmur is more intense and therefore more disturbing. The HDD is only audible when you put your ear against the notebook.
Compared to other 14-inch models with the GTX 970M, the differences are not that big. Larger notebooks like the Alienware 15 R2 or the Nexoc G515 II are often quieter under load.
Noise level
| Idle |
| 30 / 32 / 40 dB(A) |
| HDD |
| 33 dB(A) |
| Load |
| 47 / 51 dB(A) |
 | ||
30 dB silent 40 dB(A) audible 50 dB(A) loud |
||
min: | ||
| Schenker XMG P406 GeForce GTX 970M, 6700HQ | MSI GS40-6QE16H11 GeForce GTX 970M, 6700HQ | Schenker XMG C405 GeForce GTX 965M, 4720HQ | Gigabyte P34W V3 GeForce GTX 970M, 4720HQ | Alienware 15 R2 (Skylake) GeForce GTX 980M, 6700HQ | Nexoc G515 II GeForce GTX 960M, 6700HQ | |
|---|---|---|---|---|---|---|
| Noise | -1% | -5% | -3% | 2% | 10% | |
| Idle Minimum * (dB) | 30 | 33 -10% | 29.2 3% | 34.2 -14% | 33.6 -12% | 29.4 2% |
| Idle Average * (dB) | 32 | 34 -6% | 34.6 -8% | 34.3 -7% | 33.8 -6% | 30.2 6% |
| Idle Maximum * (dB) | 40 | 38 5% | 38.8 3% | 38 5% | 34 15% | 35.6 11% |
| Load Average * (dB) | 47 | 44 6% | 54 -15% | 43.8 7% | 39.3 16% | 39.8 15% |
| Load Maximum * (dB) | 51 | 52 -2% | 54.4 -7% | 55 -8% | 51.4 -1% | 41.6 18% |
* ... smaller is better
Temperature
Hardly anybody plays demanding games on their lap, but we still want to mention it: Up to 56 °C (132.8 °F) at the bottom would be uncomfortable. Normal applications on the other hand are no problem. If the notebook is standing on a table, the temperatures around the palm rest are more important, which do not even reach body temperature in any scenario.
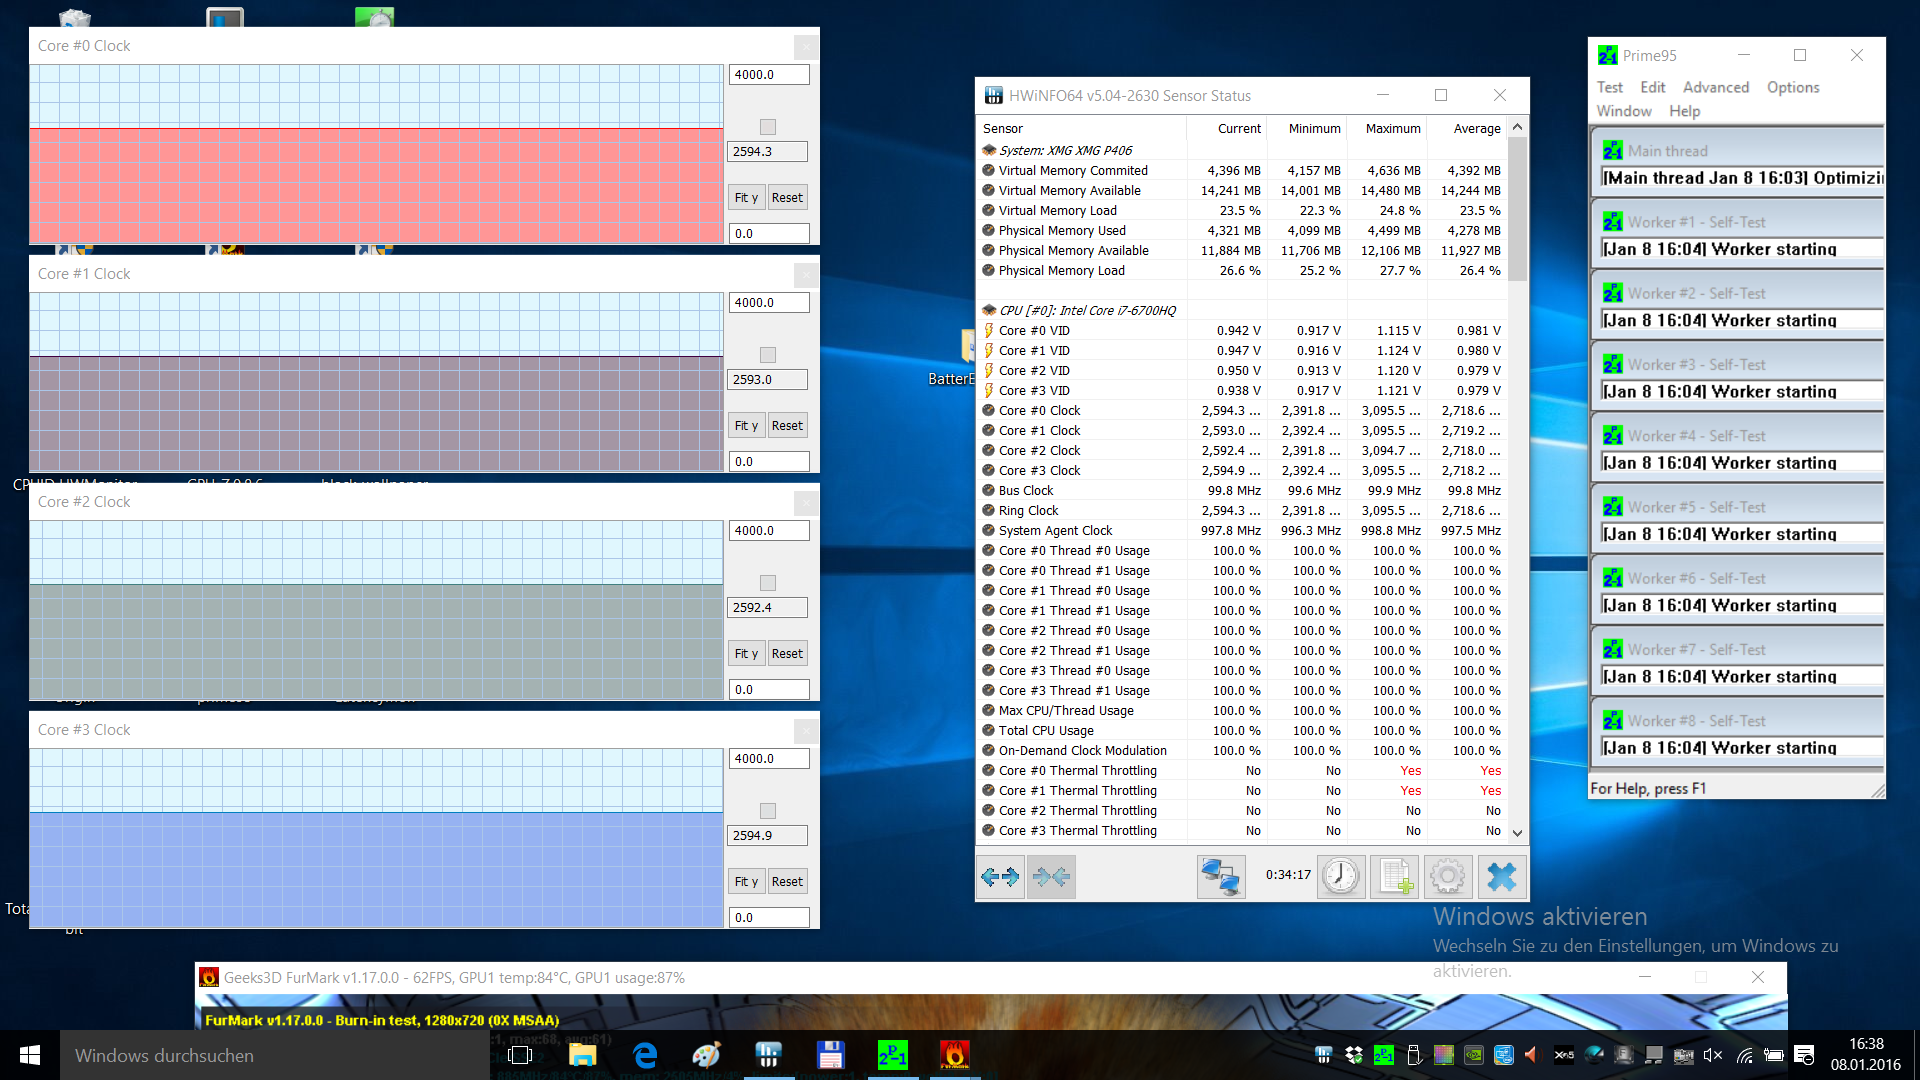
Maximum load for the system via Prime95 and FurMark can result in a CPU temperature of up to 100 °C (212 °F, according to HWMonitor). The CPU clock will eventually level off at a steady 2.6 GHz after a while. This is not below the nominal clock, so there is no throttling, but the Turbo is not utilized, either. Such a high, sustained load is not even possible with very demanding games in practice, so the effects on the gaming performance are limited, which is also supported by the modest benchmark results. It is, however, unfortunate that the GPU core tends to throttle a bit (~ 870 MHz) under maximum load.
(-) The maximum temperature on the upper side is 55 °C / 131 F, compared to the average of 40.4 °C / 105 F, ranging from 21.2 to 68.8 °C for the class Gaming.
(-) The bottom heats up to a maximum of 58.7 °C / 138 F, compared to the average of 43.2 °C / 110 F
(±) In idle usage, the average temperature for the upper side is 33.5 °C / 92 F, compared to the device average of 33.9 °C / 93 F.
(±) The palmrests and touchpad can get very hot to the touch with a maximum of 36.1 °C / 97 F.
(-) The average temperature of the palmrest area of similar devices was 28.8 °C / 83.8 F (-7.3 °C / -13.2 F).
| Schenker XMG P406 GeForce GTX 970M, 6700HQ | MSI GS40-6QE16H11 GeForce GTX 970M, 6700HQ | Schenker XMG C405 GeForce GTX 965M, 4720HQ | Gigabyte P34W V3 GeForce GTX 970M, 4720HQ | Alienware 15 R2 (Skylake) GeForce GTX 980M, 6700HQ | Nexoc G515 II GeForce GTX 960M, 6700HQ | |
|---|---|---|---|---|---|---|
| Heat | -5% | 0% | 6% | 12% | -3% | |
| Maximum Upper Side * (°C) | 55 | 57.4 -4% | 47.8 13% | 45.2 18% | 48 13% | 56.8 -3% |
| Maximum Bottom * (°C) | 58.7 | 68.8 -17% | 60.4 -3% | 56.8 3% | 57.3 2% | 62 -6% |
| Idle Upper Side * (°C) | 36.9 | 36.3 2% | 37.7 -2% | 34.6 6% | 31.9 14% | 39.6 -7% |
| Idle Bottom * (°C) | 41.7 | 41.2 1% | 44.8 -7% | 43.6 -5% | 33.4 20% | 39.1 6% |
* ... smaller is better
Speakers
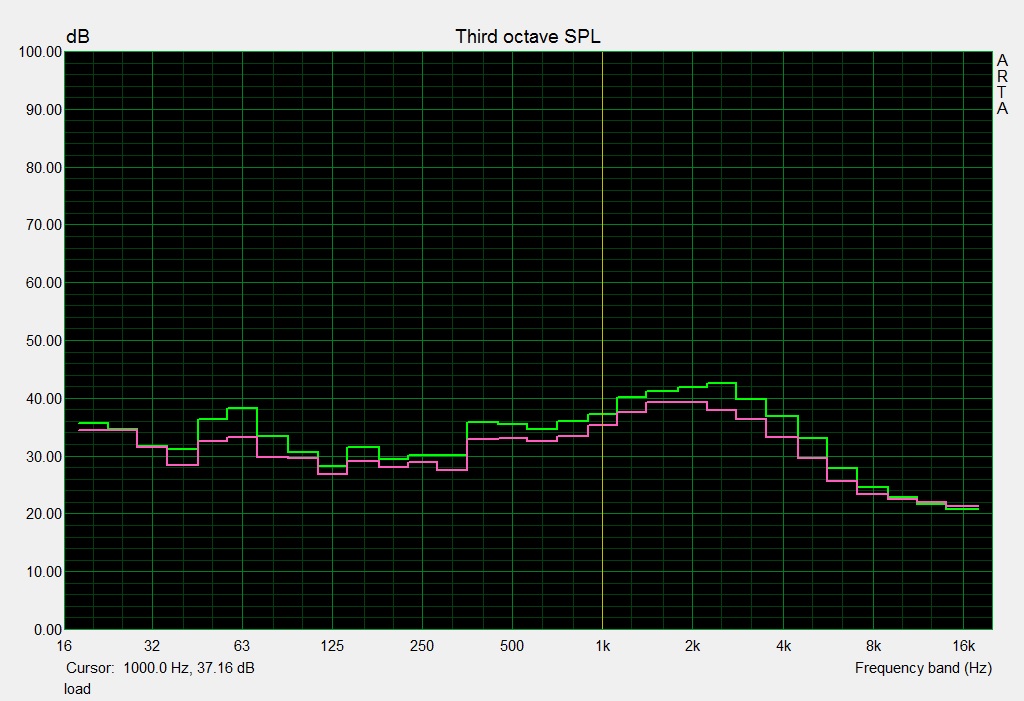
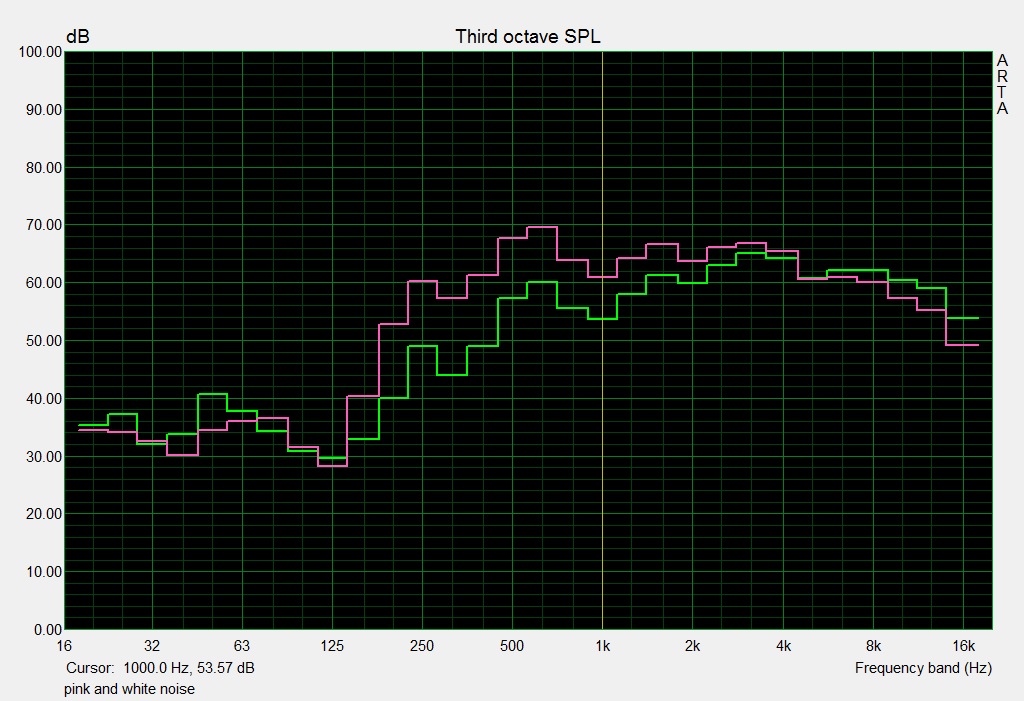
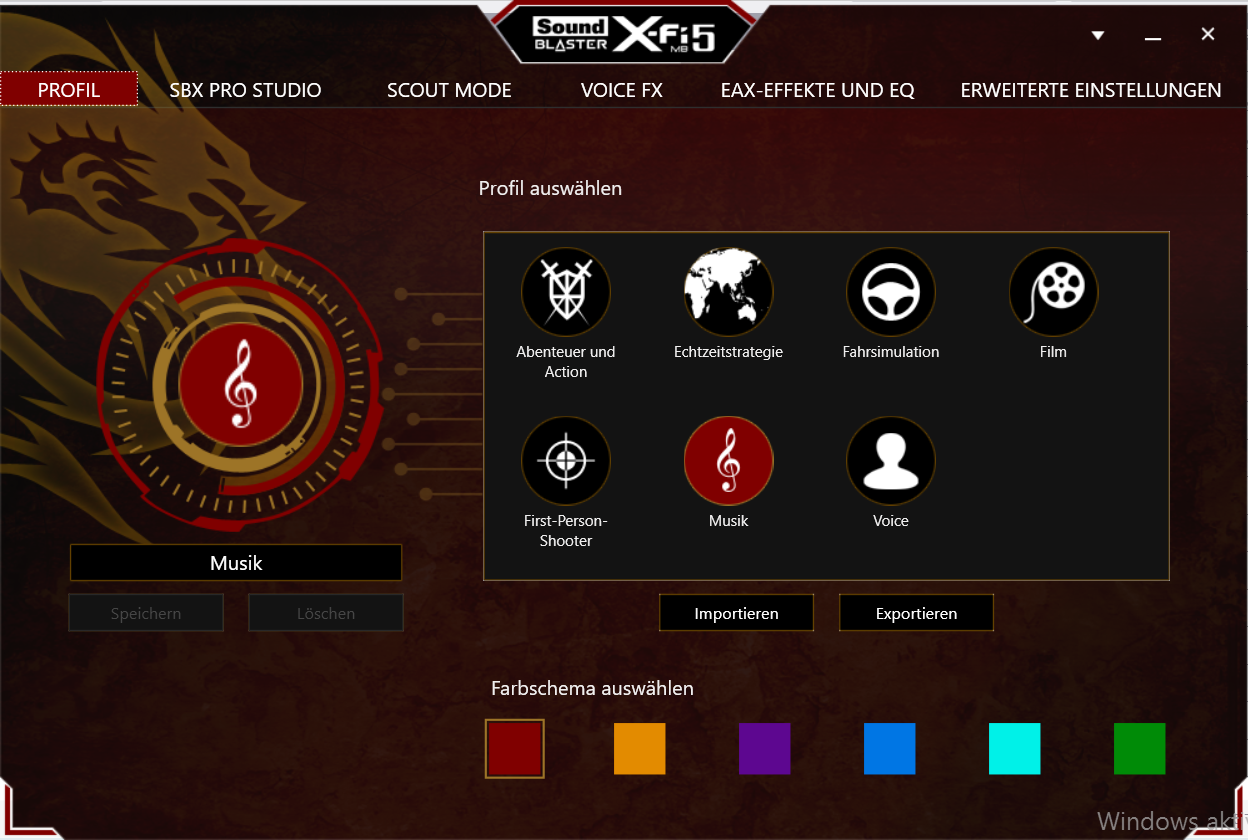
Schenker equipped the XMG P406 with the Sound Blaster X-Fi technology from Creative. Still, we learned that the big name does not automatically result in a good sound experience. The maximum volume is not very high, making it only sufficient for medium-sized rooms at best. However, this is a result of the modules themselves. The sound is a bit focused in the default "Music" preset due to the missing bass, but still balanced and pretty natural in general. The speakers, which are located underneath the display, even show signs of dynamic and a spatial effect.
We used a couple of songs with a focus on high tones to check if the playback will distort. This is not the case and there were no volume fluctuations, either. The low maximum volume was most noticeable with metal music with tuned guitars and drums; the tracks did not sound rich but slightly distorted. The individual instruments are fortunately not blurred and can be easily differentiated. There were no problems during gaming, but the author would have preferred a richer sound and recommends headphones or external speakers for a better sound experience.
Energy Management
Power Consumption
The consumption values of the review unit are modest when we compare them with similarly fast 14- and 15-inch gaming notebooks that we reviewed over the last 12 months. The only surprise is the big difference to the XMG C405 with the i7-4720HQ and GTX 965M, which needs more power in all load scenarios (except for the stress test).
| Schenker XMG P406 GeForce GTX 970M, 6700HQ | MSI GS40-6QE16H11 GeForce GTX 970M, 6700HQ | Schenker XMG C405 GeForce GTX 965M, 4720HQ | Gigabyte P34W V3 GeForce GTX 970M, 4720HQ | Alienware 15 R2 (Skylake) GeForce GTX 980M, 6700HQ | Nexoc G515 II GeForce GTX 960M, 6700HQ | |
|---|---|---|---|---|---|---|
| Power Consumption | 4% | -21% | -3% | 10% | ||
| Idle Minimum * (Watt) | 12 | 10 17% | 15.8 -32% | 11.4 5% | 11.2 7% | |
| Idle Average * (Watt) | 16 | 14 12% | 22.8 -43% | 16.5 -3% | 14.6 9% | |
| Idle Maximum * (Watt) | 22 | 24 -9% | 27.3 -24% | 22 -0% | 21.8 1% | |
| Load Average * (Watt) | 90 | 90 -0% | 106.8 -19% | 94.2 -5% | 78.3 13% | |
| Load Maximum * (Watt) | 170 | 172 -1% | 152 11% | 192.2 -13% | 132.6 22% |
* ... smaller is better
| Off / Standby | |
| Idle | |
| Load |
|
Key:
min: | |
Battery Runtime
Despite the moderate consumption, the runtimes are affected by the small 45-Wh battery. Potential buyers of the XMG P406 sacrifice screen estate and rightly expect a better mobility with decent runtimes in return. However, a bigger battery would also increase the weight. The Alienware 15 R2 (15.6-inch) lasts much longer, but it also has a battery with twice the capacity and the whole system is 900 grams (~2 lb) heavier.
You can expect around one hour at the maximum brightness level when you want to play games on battery power. However, our Wi-Fi script at around 150 nits (how we test) only determines little more than three hours as well. All in all, the battery runtimes are a pretty significant drawback of the device.
| Schenker XMG P406 | MSI GS40-6QE16H11 | Schenker XMG C405 | Gigabyte P34W V3 | Alienware 15 R2 (Skylake) | Nexoc G515 II | |
|---|---|---|---|---|---|---|
| Battery runtime | 16% | 18% | 53% | 120% | 43% | |
| Reader / Idle (h) | 4.6 | 5.2 13% | 8.7 89% | 12.8 178% | ||
| WiFi v1.3 (h) | 3.3 | 5 52% | 3.9 18% | 7.4 124% | 4.2 27% | |
| Load (h) | 1.2 | 1 -17% | 1.4 17% | 1.9 58% | 1.9 58% | |
| H.264 (h) | 5 | 7.6 | ||||
| WiFi (h) | 4.7 |
Pros
Cons
Verdict
Schenker did a nice job with the small XMG P406 and offers a generally convenient gaming notebook, which can be adjusted to your own preferences in the configurator. However, our review unit, for around 1840 Euros (~$2004), is certainly no bargain. A look at the cons shows that there are only three drawbacks that are really important for gamers: the long reaction times of the display, the significantly reduced performance on battery power (when you plan to use it on the road) as well as the slightly pulsating cooling solution while idling, which is not quiet under load either.
Positive aspects are the solid chassis, the good input devices, numerous ports, the easy disassembly of the bottom cover (does not affect the warranty in the case of Schenker) as well as the high-contrast display, even though it is not suited for professional picture editing even after a calibration. The sound system is probably a bit quiet, but works well otherwise.
The device scores a good 86% in our review, so we can give it a purchase recommendation. The other 14-inch devices in the comparison group cannot quite keep up with the review unit.
Schenker XMG P406
- 02/23/2016 v5 (old)
Sven Kloevekorn
Price comparison

