

Nexoc G515 II (Clevo N150RD) Notebook Review

For the original German review, see here.
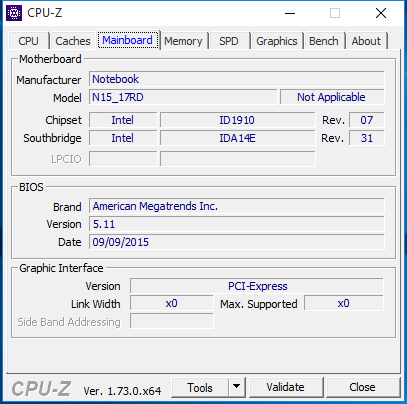
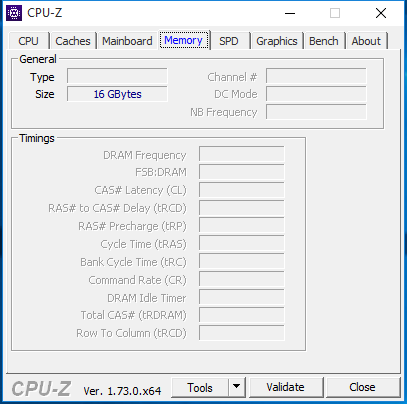
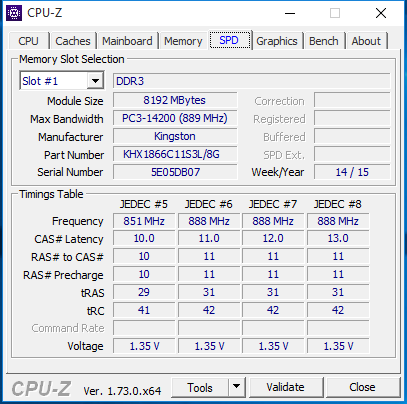
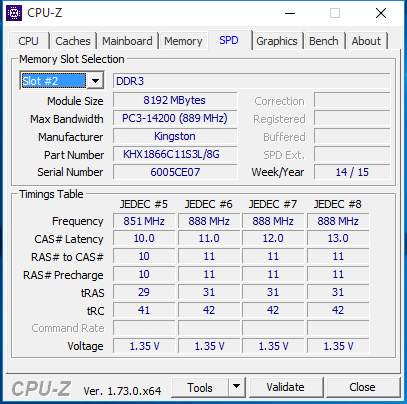
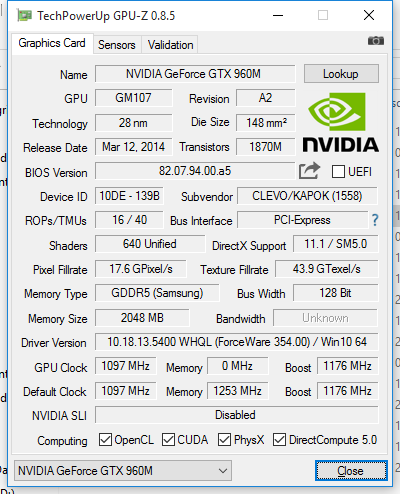
After reviewing the Clevo Barebone N150SD-based Schenker XMG A505 this past March, we now have a device in our hands based on a very similar Clevo Barebone. While the Schenker device was equipped with a Haswell Intel Core i7-4720HQ CPU (4x 2.6-3.6 GHz, Hyperthreading, TDP 47 W), the Nexoc G515 II's Clevo N150RD is outfitted with a brand new Core i7-6700HQ (4x 2.6-3.5 GHz, Hyperthreading, TDP 45 W) from the current Skylake generation. The Intel HM170 chipset is also new and replaces its predecessor, the HM87. While the Schenker system employs a generous 16 GB of DDR3 RAM (dual-channel) with an effective clock rate of 1600 MHz, the Nexoc's 16 GB are specified at 1866 MHz. Native to this performance class, the Nvidia GeForce GTX 960M with 2 GB of dedicated GDDR5 RAM remains the same. Visually, the manufacturer logos are the only features that distinguish the two devices. In this review, we will compare this Nexoc computer to both the Schenker XMG A505 and the popular, technologically comparable Acer Aspire V 15 Nitro Black Edition VN7-591G.
The configuration of the Nexoc G515 II currently under our scrutiny is a bonafide gaming notebook, whose processor and RAM can easily handle any game on the market, as well as all manner of commercial software -- and yet its graphics card restricts the system's capabilities. The GTX 960M can fluidly render many of today's games in Full HD and at maximum settings, but it lags far behind the high-end GeForce GTX 970M, 980M and 980 (notebook model) GPUs, all of which can tackle even the most demanding titles. The mass storage devices deserve special attention: Alongside a 1 TB conventional hard drive, Nexoc equipped their computer with a 256 GB Samsung SSD attached via PCI Express, and thus extraordinarily fast. The notebook's connections also help it to stand out from the crowd: Separate audio input and output jacks, an S/PDIF interface and a Mini DisplayPort are not exactly commonplace features. Also unusual for a gaming notebook is the fingerprint scanner integrated into the touchpad. In terms of the display, Nexoc settled on a matte IPS panel with Full HD. Our test configuration is priced at just under 1500 Euros (~$1660).
Case
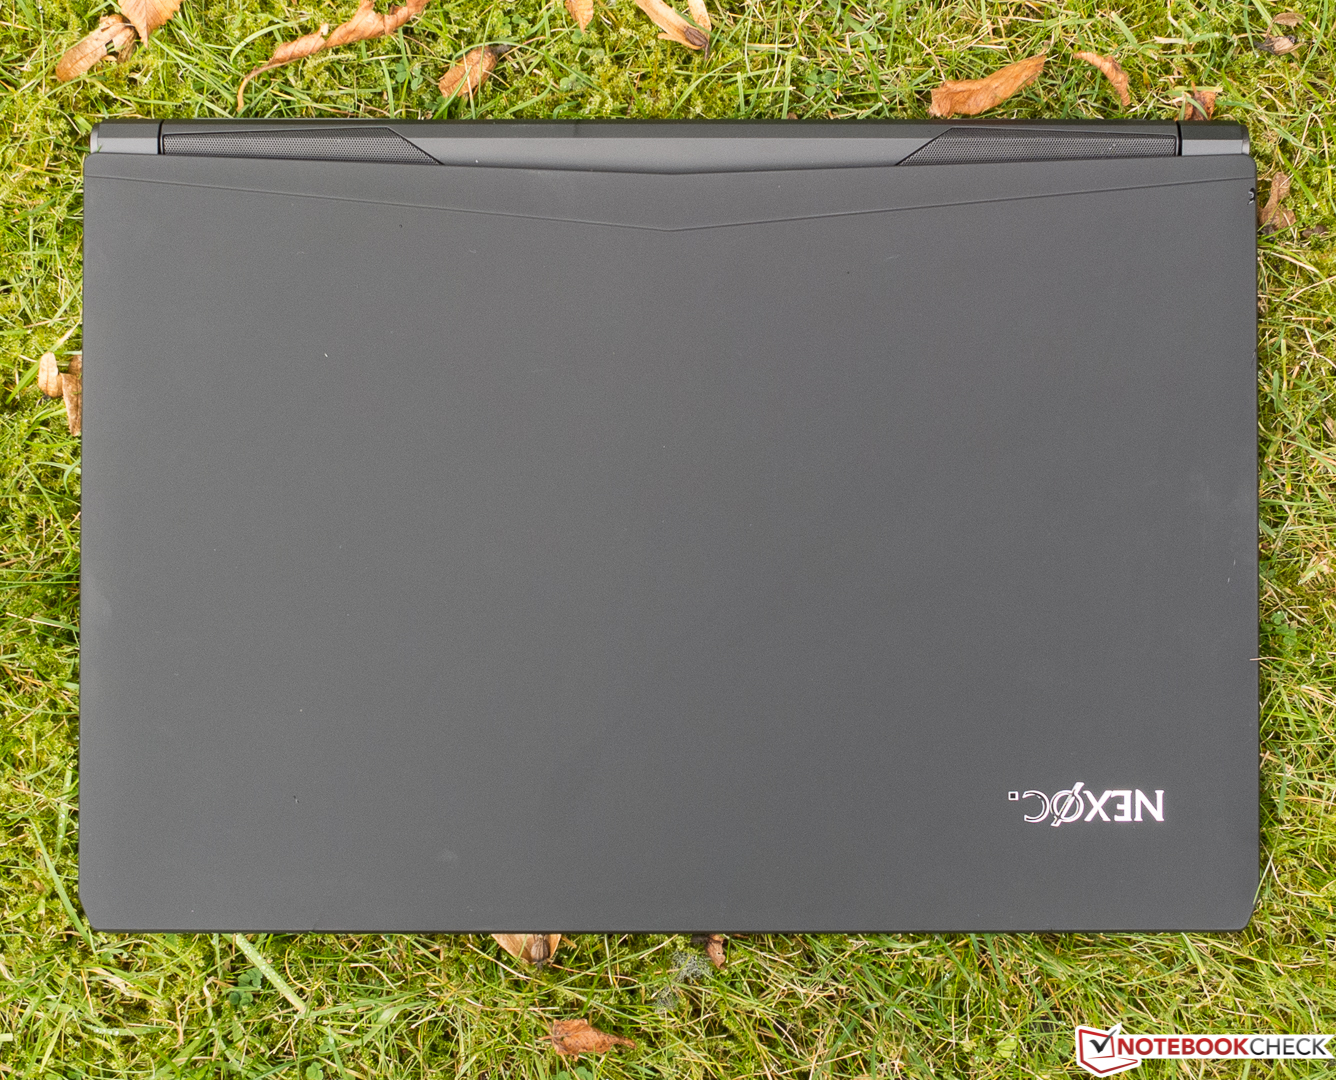
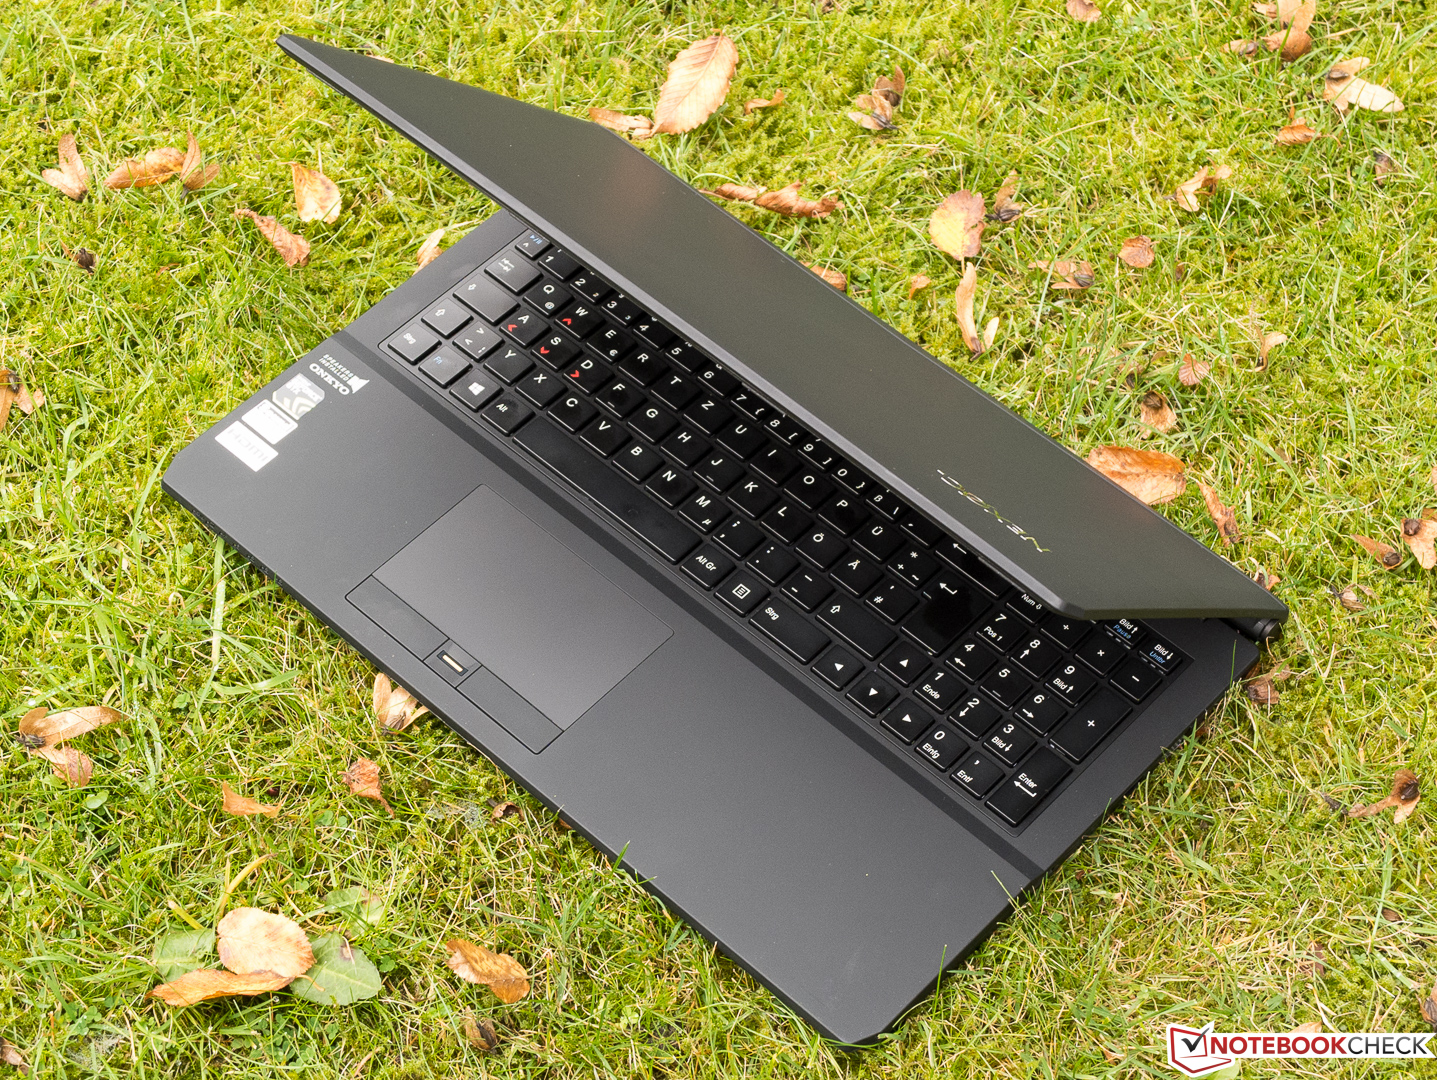
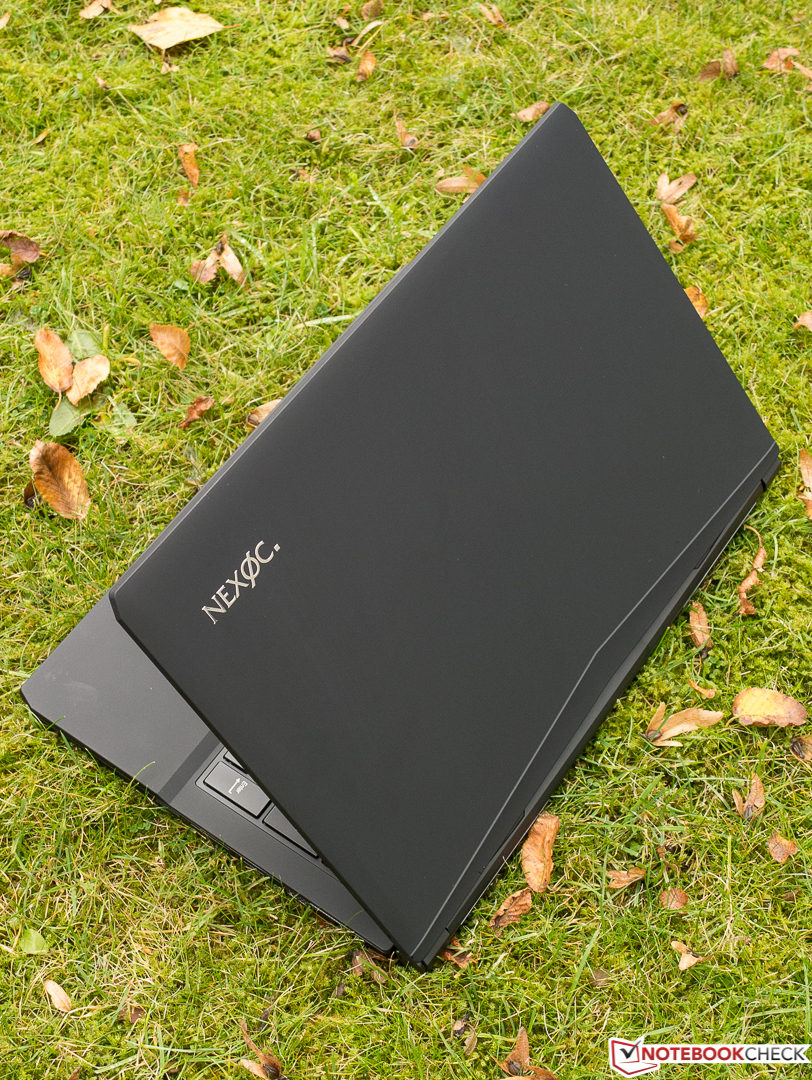
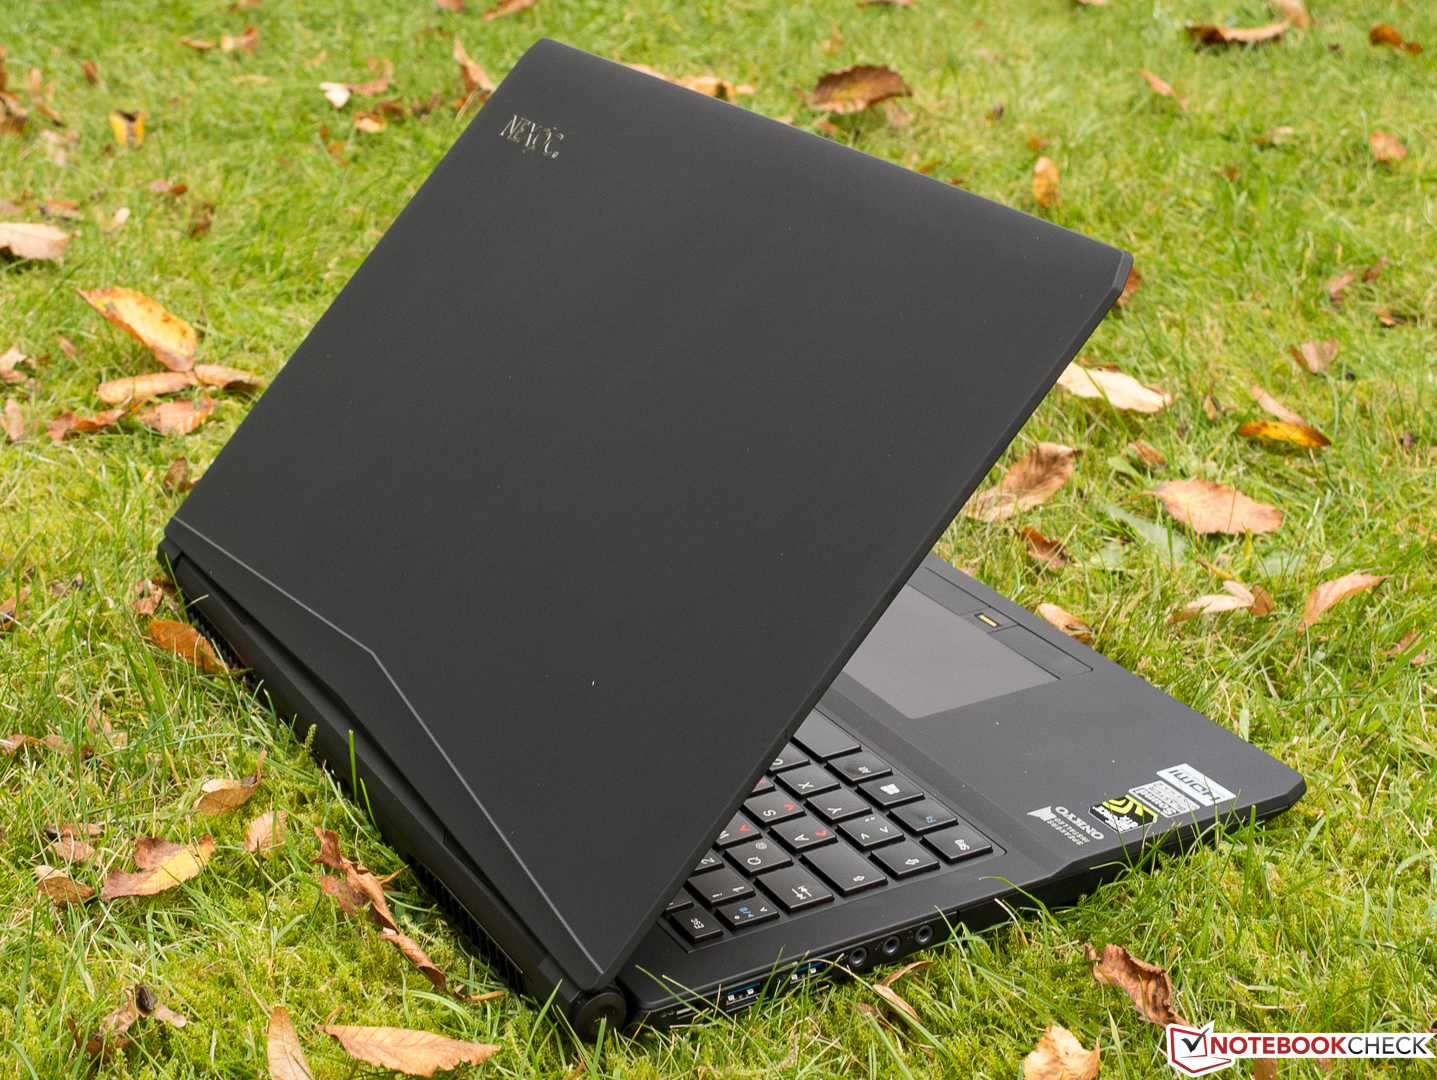
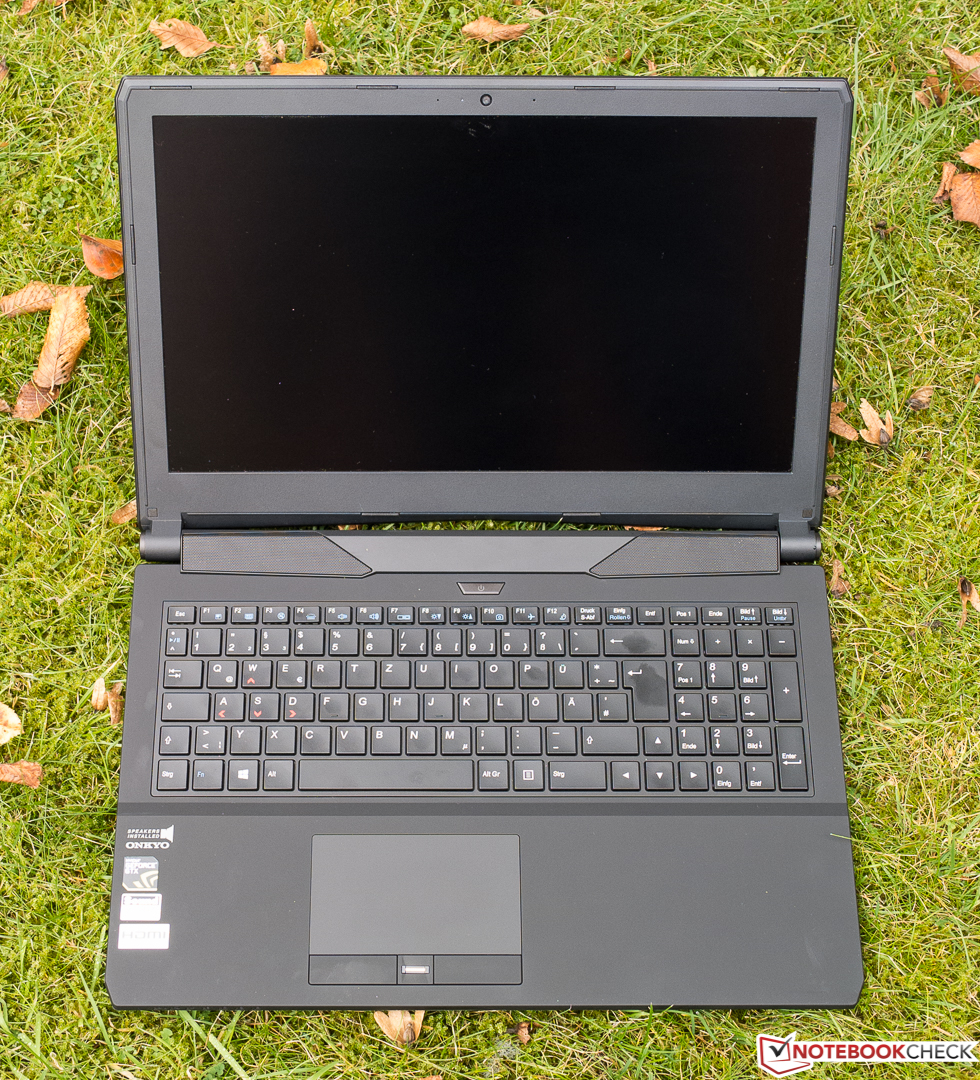
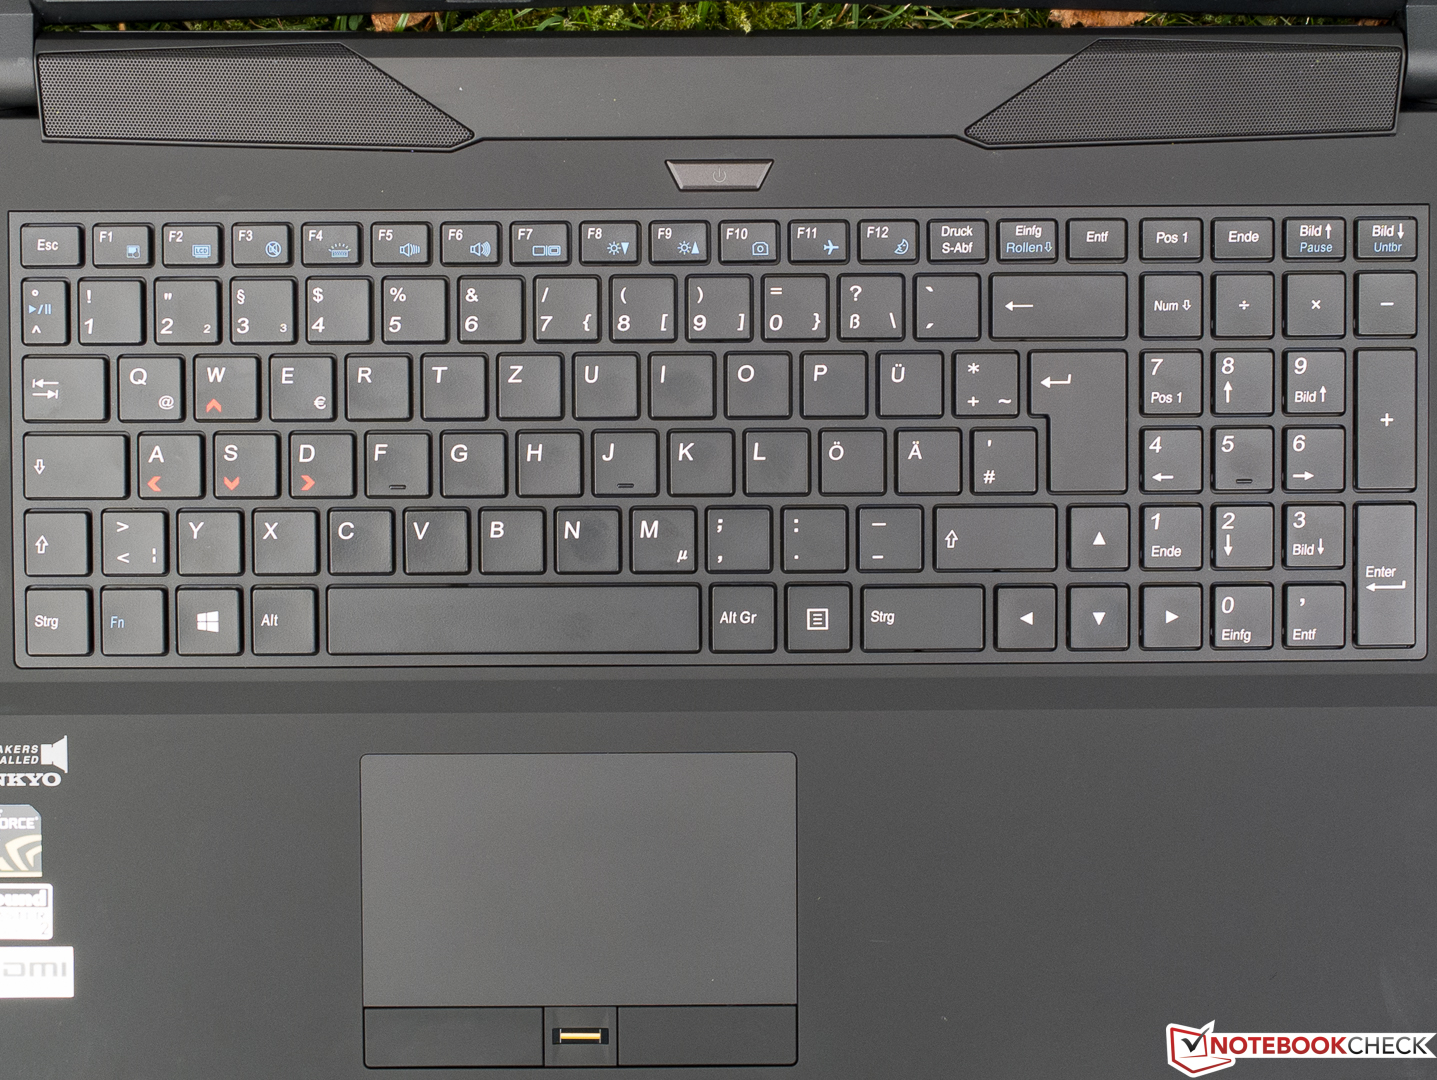
Because the notebook's case, connectivity features, input devices and speakers are all identical to that of the Schenker XMG A505, for more information on these subjects we direct readers to our review of the Schenker model.


Display
Nexoc chose an IPS display from LG Philips, whose mediocre mean brightness of 232 cd/m² leaves much to be desired, especially given the notebook's high price. The Acer V 15 Nitro's panel does a lot better here, measuring an excellent 322 cd/m². For an IPS panel, the black value of 0.3 cd/m² is low, which fortunately yields a good contrast of 773:1. The XMG A505 is brighter and still manages to render black even darker, resulting in a fantastic contrast of 1235:1. The brightness distribution is 82% similar across the screen and suffices for a good score in that discipline. Subjectively, when the display image was entirely black, we noticed a little screen bleeding in various places around the panel frame -- but this was not evident in normal use.
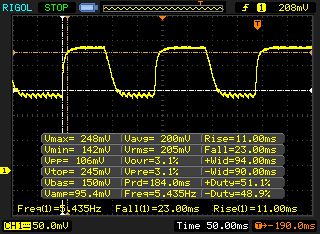
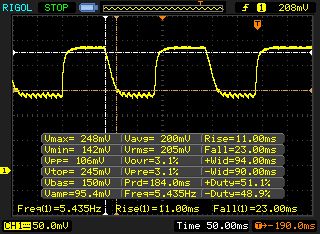
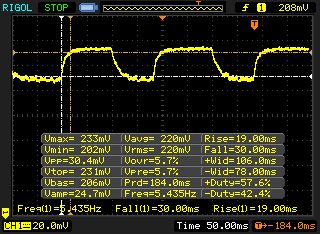
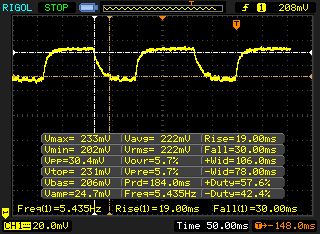
Distributed across the 15.6-inch screen, the 1920x1080 pixels are ideal for a gamer. The resultant resolution of 141 ppi generates a beautifully crisp image from the normal distance of about a half-meter (~1.6 feet). Eagle eyes observing the screen at a nearer range might notice a little text pixelation. A different screen would hardly be sensible, and Nexoc has chosen not to offer any alternatives. Out of the three competitors, the Acer machine is the modern marvel in terms of pixel density: Thanks to its 3840x2160 pixels on a 15-inch monitor, it reaches an almost excessive 282 ppi. Some users have expressed that brightness control via pulse width modulation (PWM) can cause the screen to flicker, but according to our measurements, this did not occur.
| |||||||||||||||||||||||||
Brightness Distribution: 82 %
Center on Battery: 232 cd/m²
Contrast: 773:1 (Black: 0.3 cd/m²)
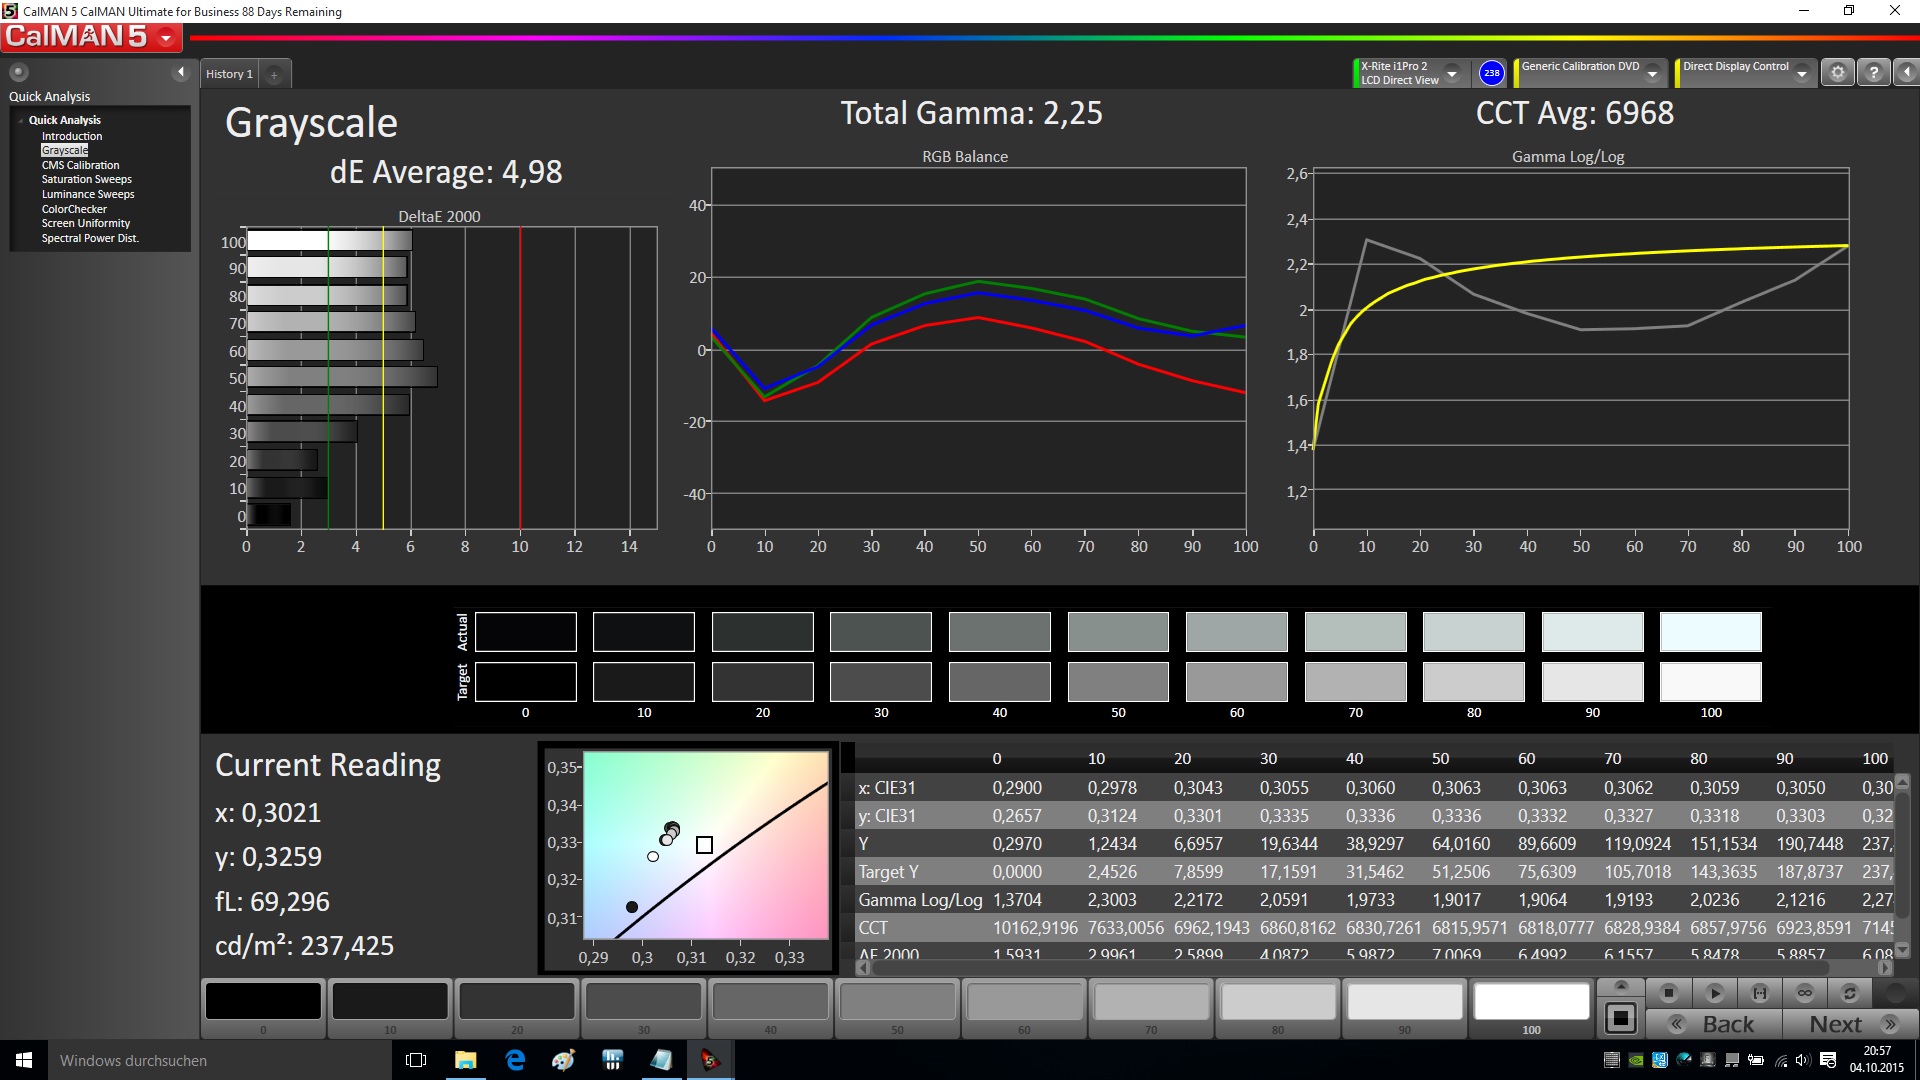
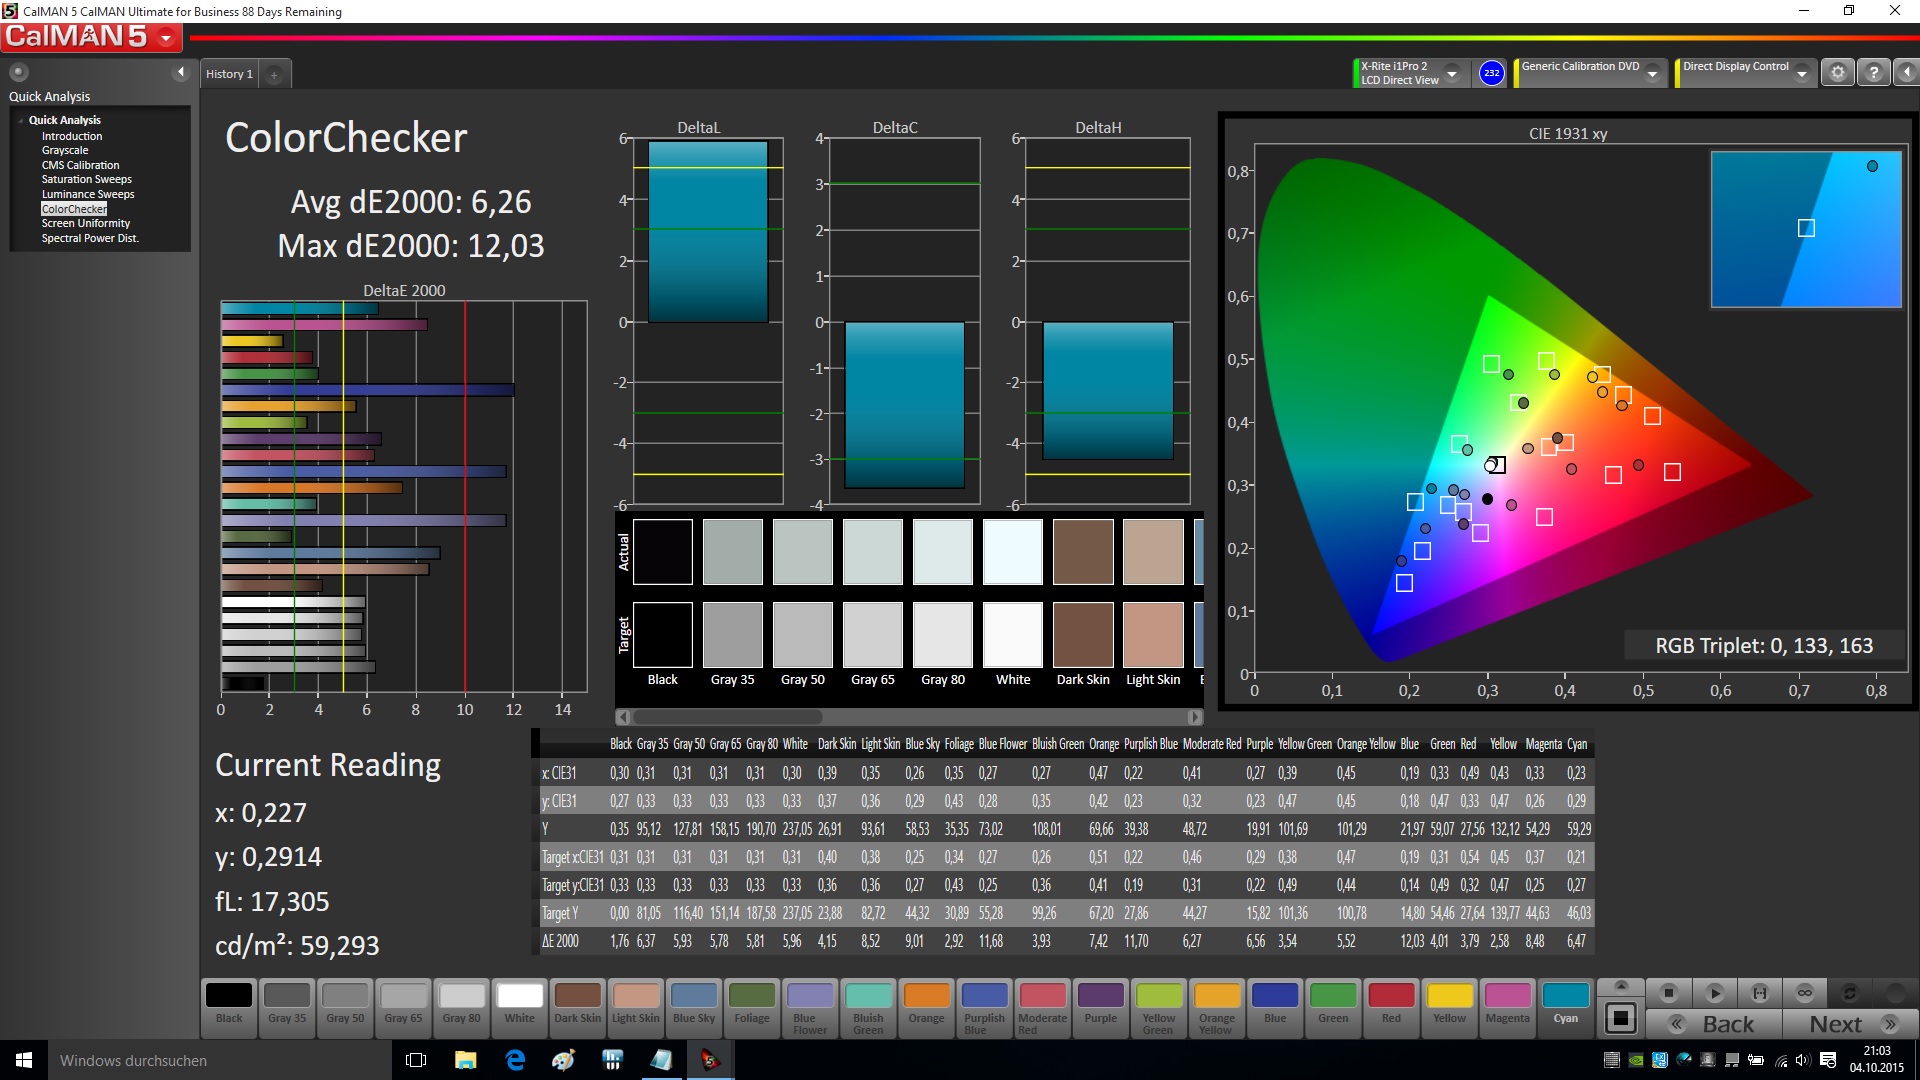
ΔE ColorChecker Calman: 6.26 | ∀{0.5-29.43 Ø4.78}
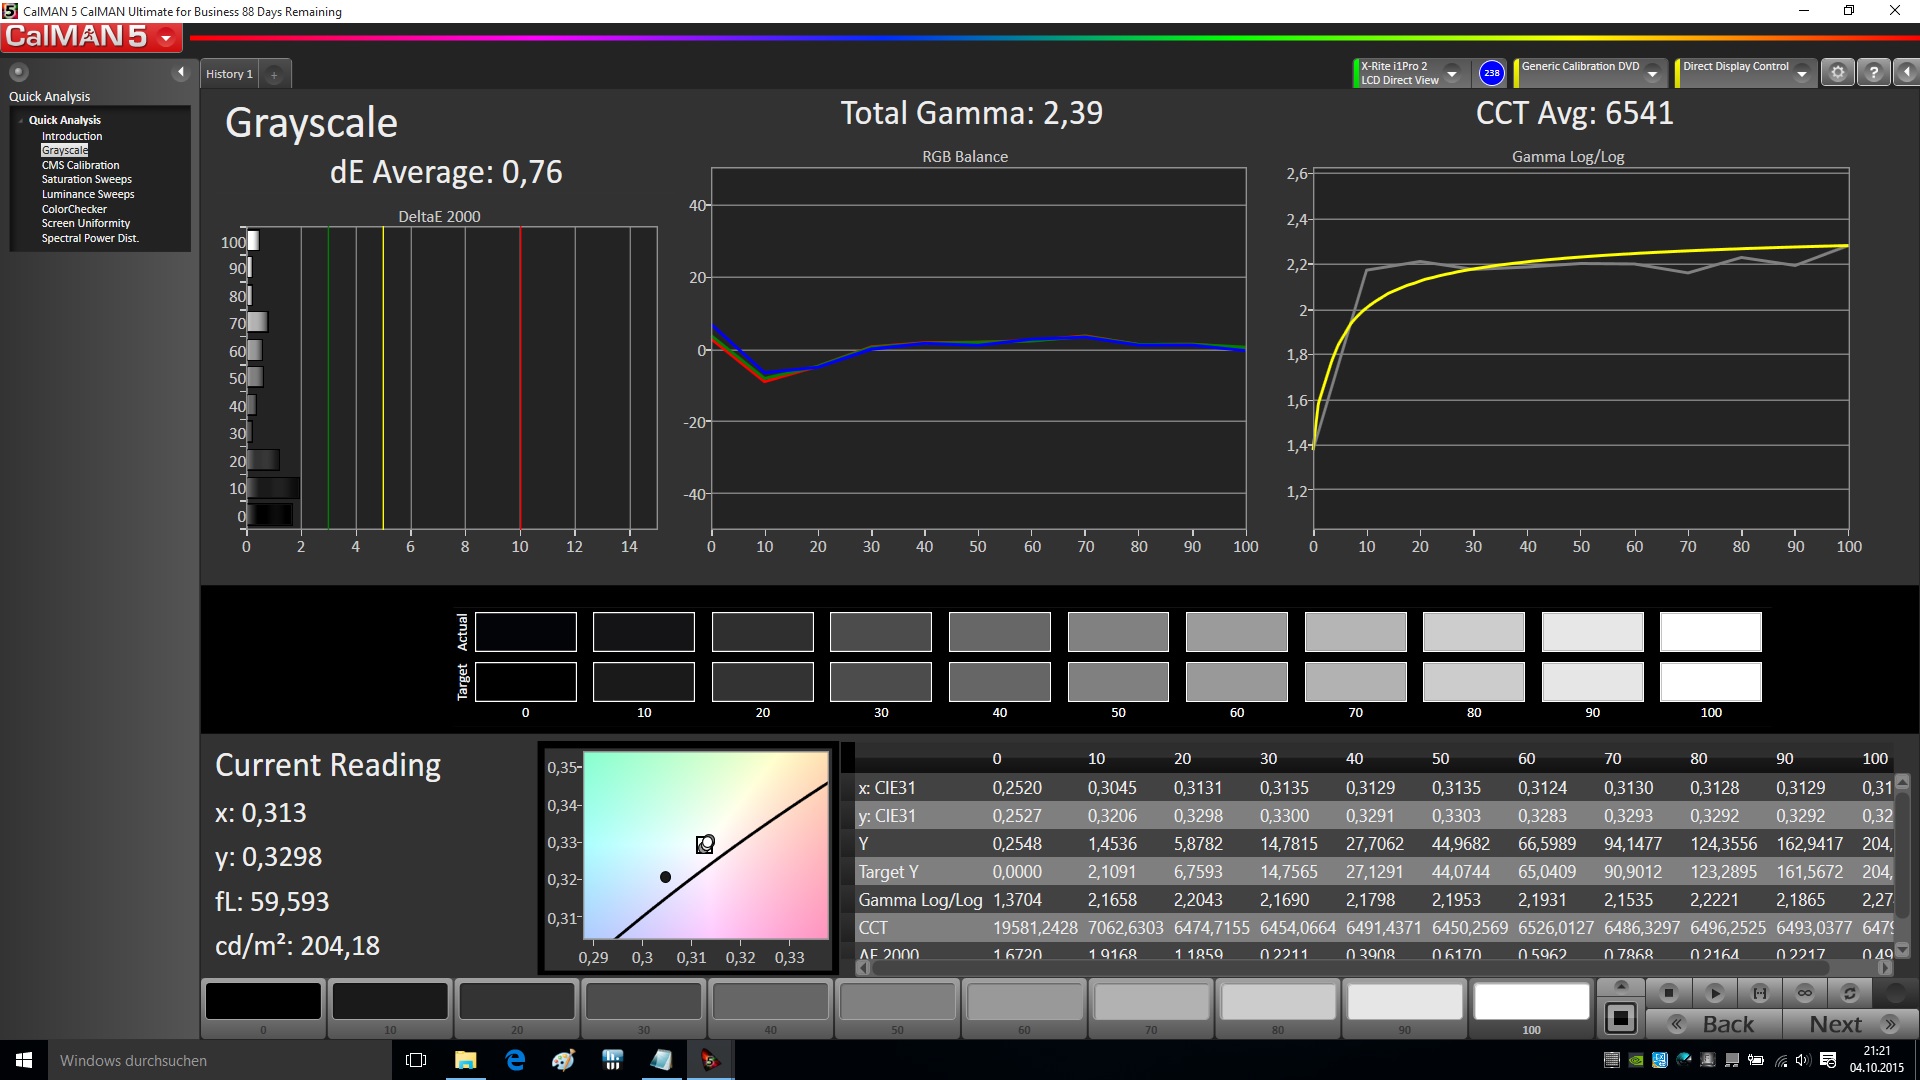
ΔE Greyscale Calman: 4.98 | ∀{0.09-98 Ø5}
58% sRGB (Argyll 1.6.3 3D)
37% AdobeRGB 1998 (Argyll 1.6.3 3D)
39.88% AdobeRGB 1998 (Argyll 3D)
57.8% sRGB (Argyll 3D)
38.59% Display P3 (Argyll 3D)
Gamma: 2.25
CCT: 6968 K
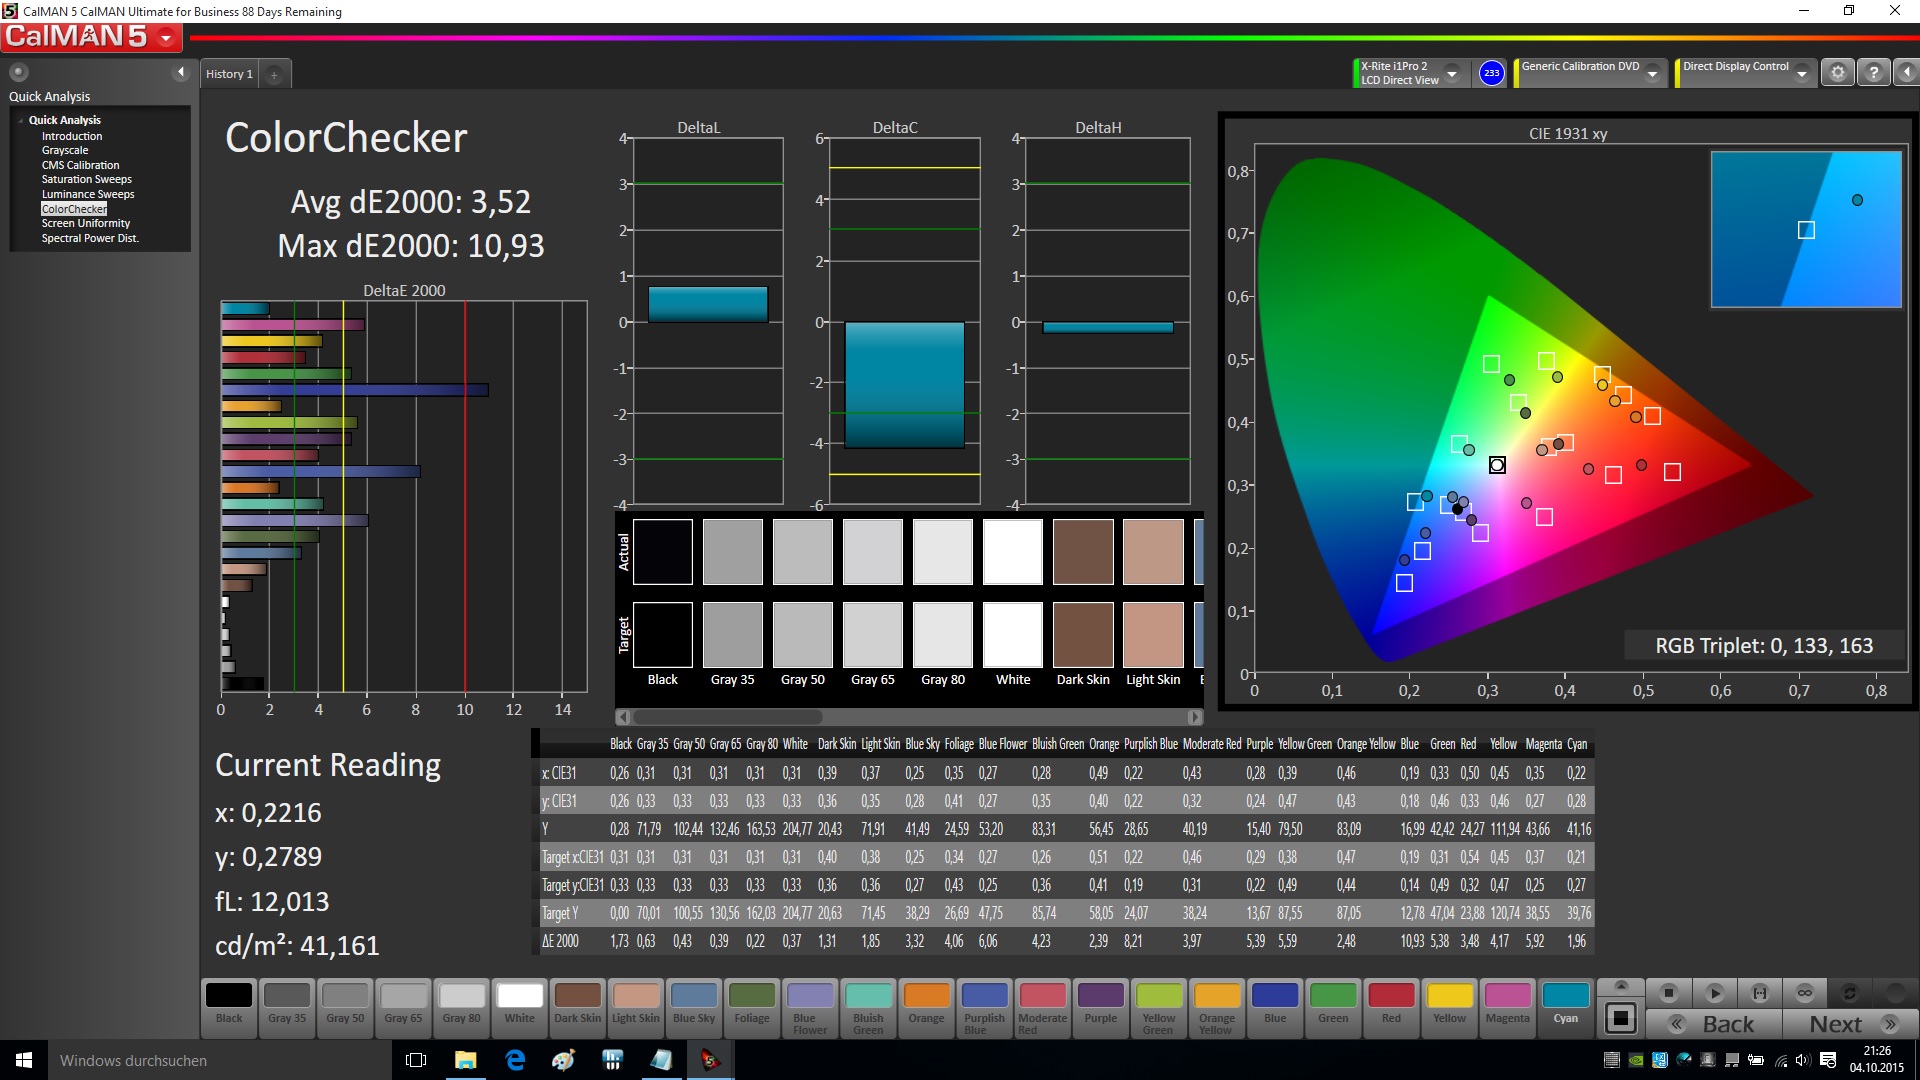
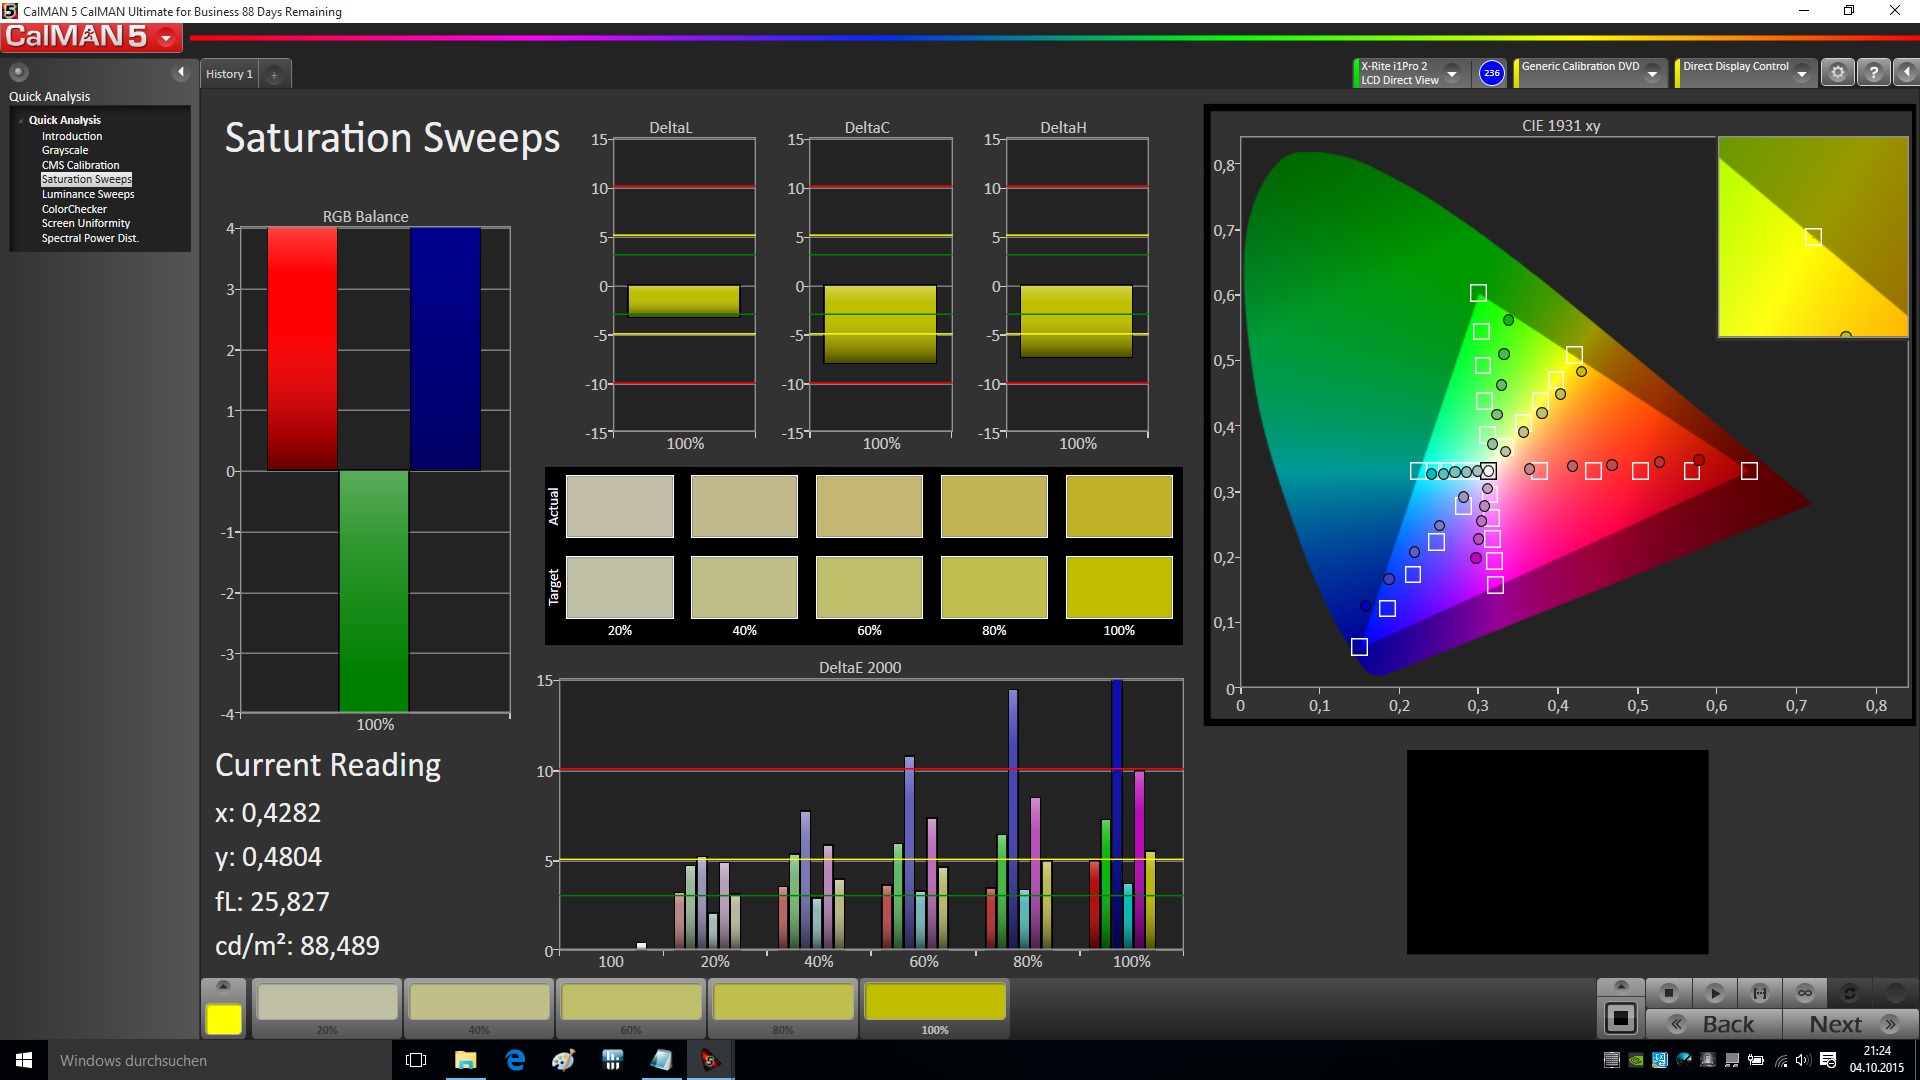
Straight out of the factory, our test device also comes in third in the discipline of color accuracy. DeltaE values of 6 and 5 are once again mediocre for an IPS display. The Schenker device dazzled us with a DeltaE of 2 -- a result good enough for professional use. The Acer machine comes in second here. After we calibrated the panel with the help of a color spectrometer, the deviations sank to nearly ideal DeltaE values of 1 (grayscale) and 4 (ColorChecker). As always, the ICC profile generated by the device is on display in the box below.
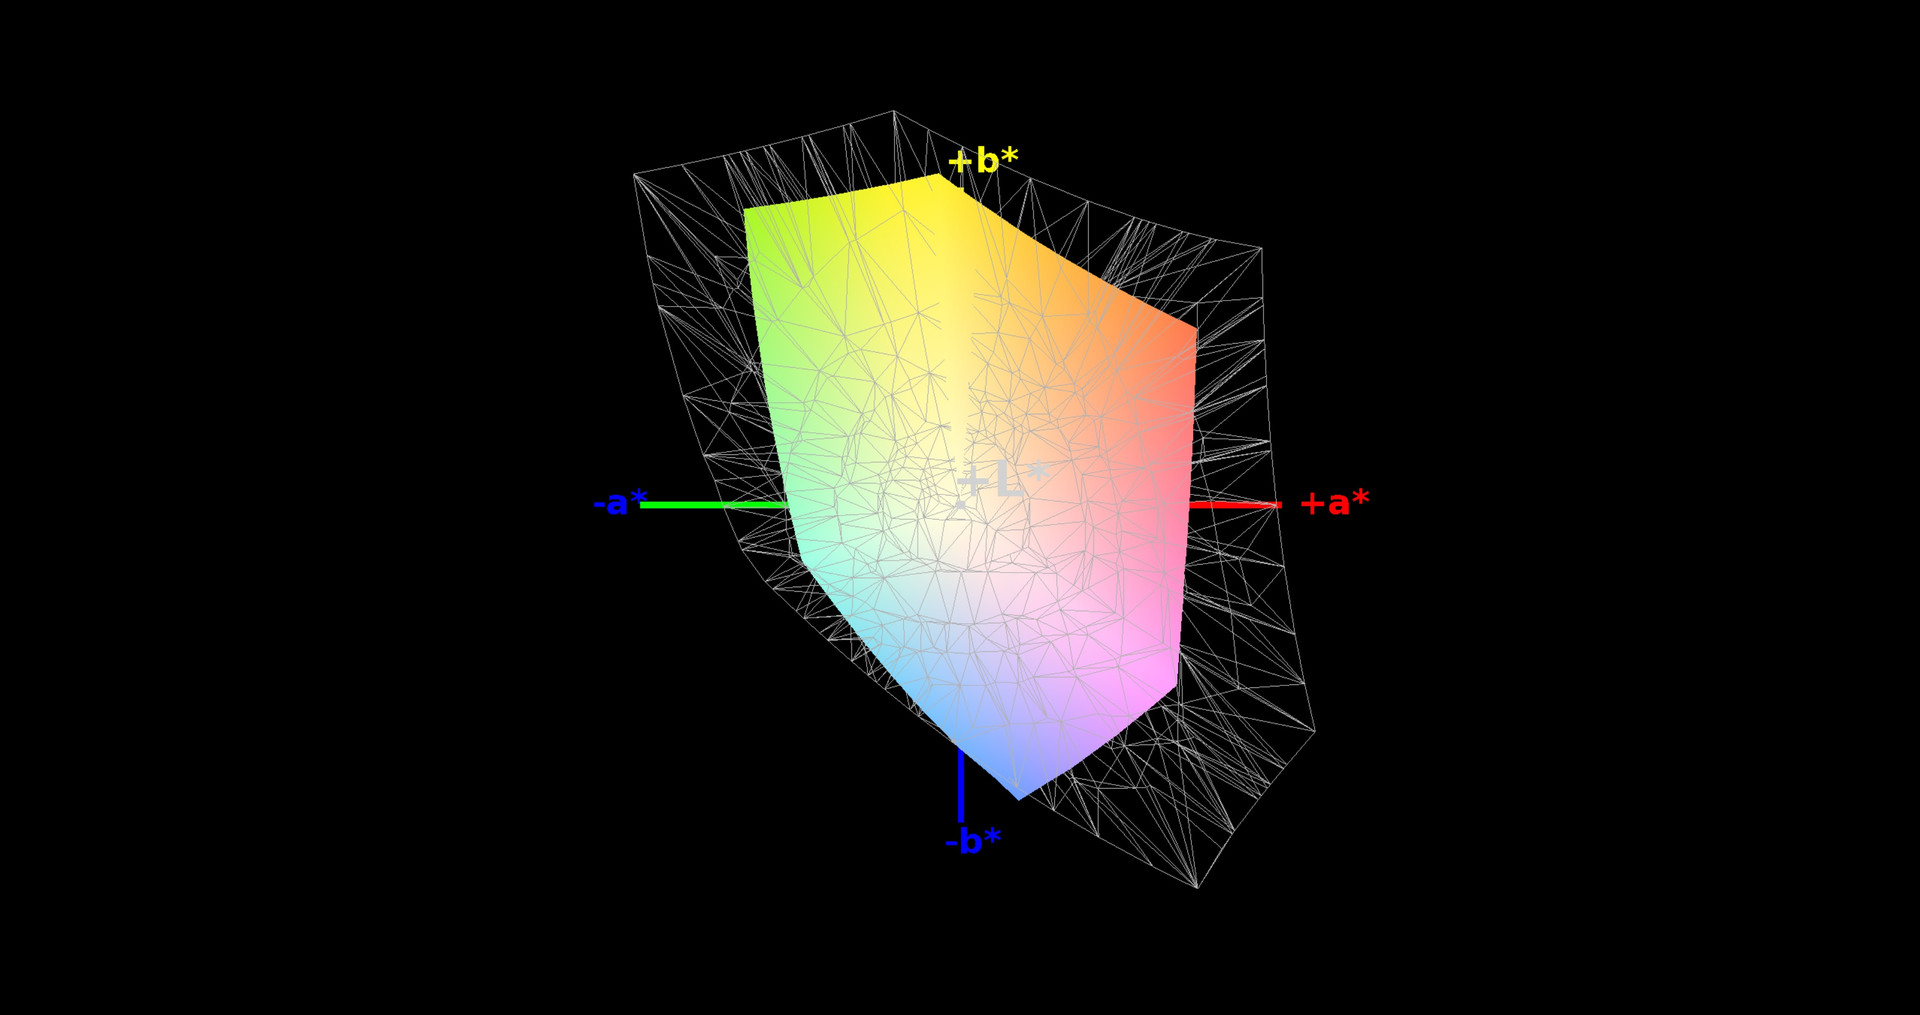
Now we turn to the question of AdobeRGB color space coverage, which is generally only important for professional image editors. Good IPS panels cover about 60-65% here, and often cover up to 95-100% of the much smaller sRGB color space (which approximates the color gamut of the most common computer displays). Our Schenker and Acer models come very close to those numbers; but at 37% (AdobeRGB), the Nexoc's color range is much more limited. In summary: This panel would be more at home in notebooks in the sub-1000 Euro price range (less than ~$1100).

| Nexoc G515 II | Schenker XMG A505 | Acer Aspire VN7-591G-727P | |
|---|---|---|---|
| Display | 66% | 51% | |
| Display P3 Coverage (%) | 38.59 | 66.1 71% | 64.9 68% |
| sRGB Coverage (%) | 57.8 | 92.1 59% | 66.9 16% |
| AdobeRGB 1998 Coverage (%) | 39.88 | 67 68% | 66.9 68% |
| Screen | 42% | 23% | |
| Brightness middle (cd/m²) | 232 | 284 22% | 322 39% |
| Brightness (cd/m²) | 216 | 275 27% | 325 50% |
| Brightness Distribution (%) | 82 | 87 6% | 90 10% |
| Black Level * (cd/m²) | 0.3 | 0.23 23% | 0.37 -23% |
| Contrast (:1) | 773 | 1235 60% | 870 13% |
| Colorchecker dE 2000 * | 6.26 | 2.46 61% | 3.77 40% |
| Greyscale dE 2000 * | 4.98 | 2.3 54% | 5.36 -8% |
| Gamma | 2.25 98% | 2.32 95% | 2.39 92% |
| CCT | 6968 93% | 6393 102% | 7163 91% |
| Color Space (Percent of AdobeRGB 1998) (%) | 37 | 60 62% | 61 65% |
| Color Space (Percent of sRGB) (%) | 58 | 92 59% | |
| Total Average (Program / Settings) | 54% /
48% | 37% /
31% |
* ... smaller is better
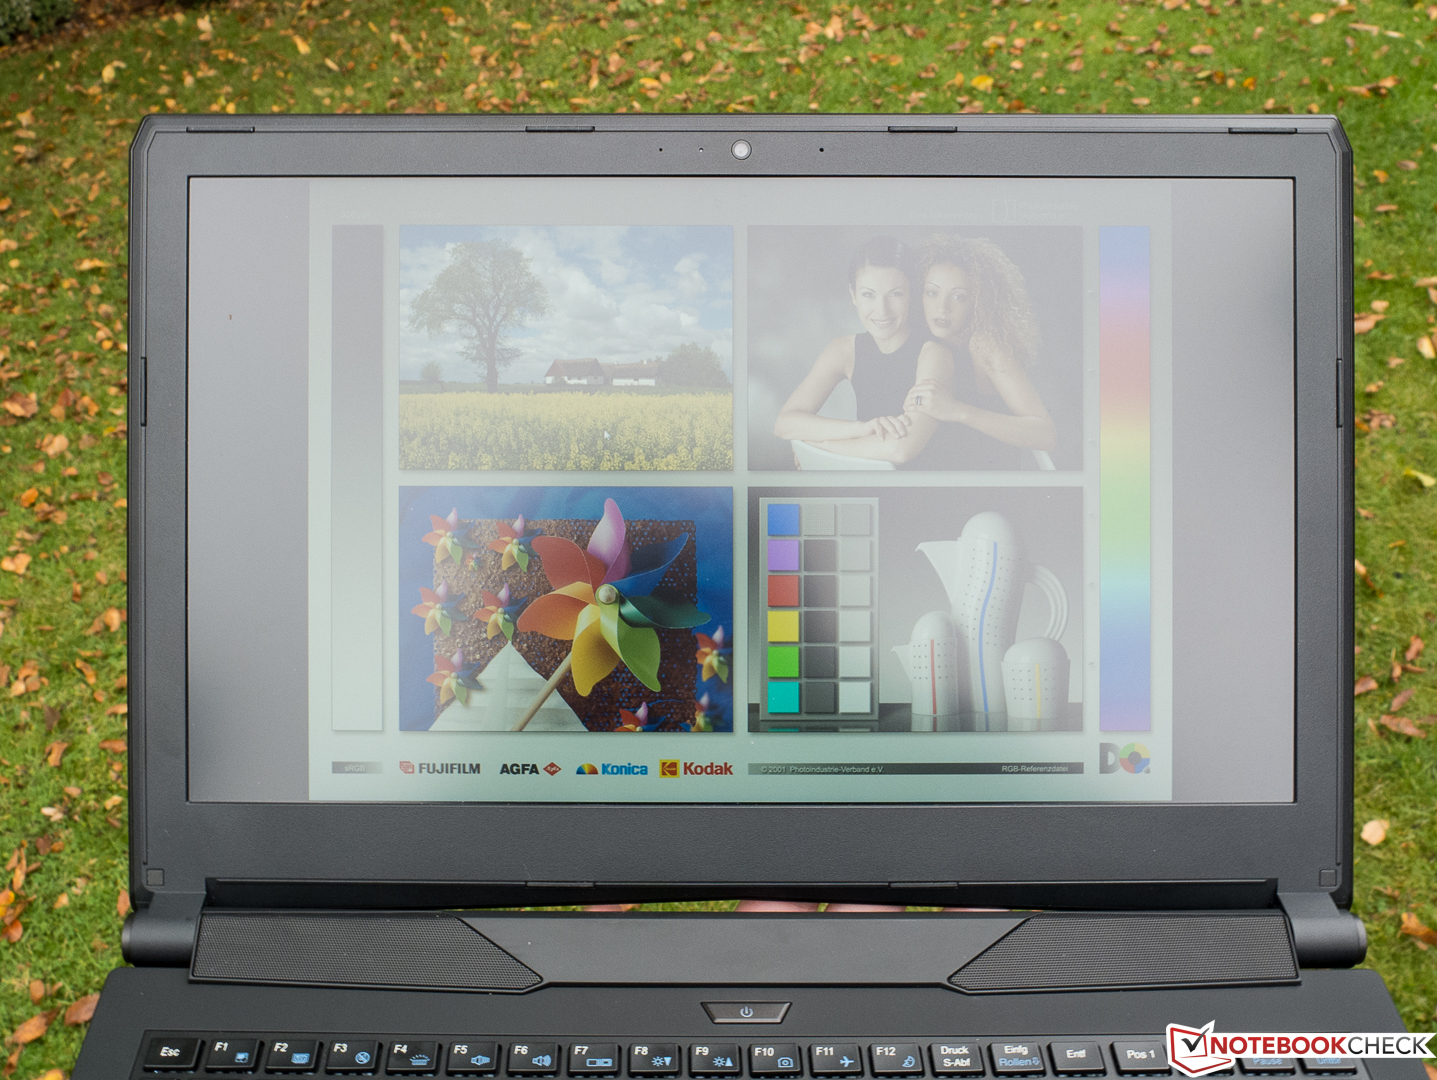
As a general rule, the screen's brightness coupled with its matte surface renders the computer usable outdoors. As always, much depends on the position of the display and the angle at which light strikes the screen. With a little effort, we were able to obscure the display image with reflections of sunlight even on a cloudy day. The first photo below shows the screen in a more favorable light -- that is, in a shadowy environment.

Even weak IPS panels are generally able to retain the integrity of the display image from many different angles, lending the user freedom of motion. As our viewing angle collage shows, the Nexoc G515 II is fairly strong in this discipline, just like the IPS panels installed in its two competitors. As is so often the case, viewing the display from different horizontal or vertical angles only causes a moderate loss of contrast and brightness. The display content is only seriously distorted from unrealistic angles, represented by the pictures in the corners.

Performance
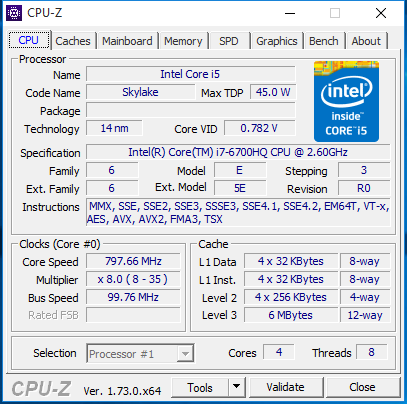
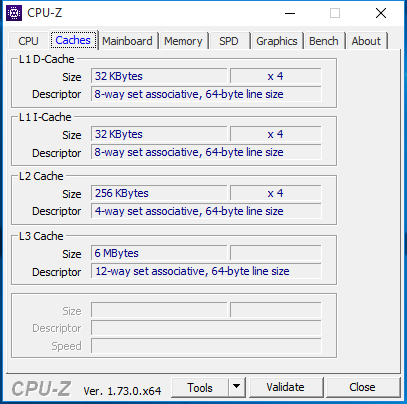
The Intel Core i7-6700HQ (4x 2.6-3.5 GHz, Hyperthreading) is a very powerful quad-core processor with Hyperthreading from Intel's cutting-edge Skylake generation. Like Broadwell processors, the chip is fabricated using the 14 nm manufacturing process, and thanks to a variety of architectural improvements, its per-MHz performance is 5 to 10 percent better than that of its grandfather's generation (Haswell). Skylake replaces these two generations, and especially compared to Haswell chips manufactured at 22 nm, the new CPUs excel in the area of energy efficiency. Because the Skylake processors have the potential to remain at lower temperatures, they are often able to better utilize their turbo during long periods under full load. Though in its standard configuration the chip is primarily suited for use in larger notebooks, thanks to its reducible TDP (45 to 35 watts), theoretically it could find a place in smaller devices (with some loss of performance).
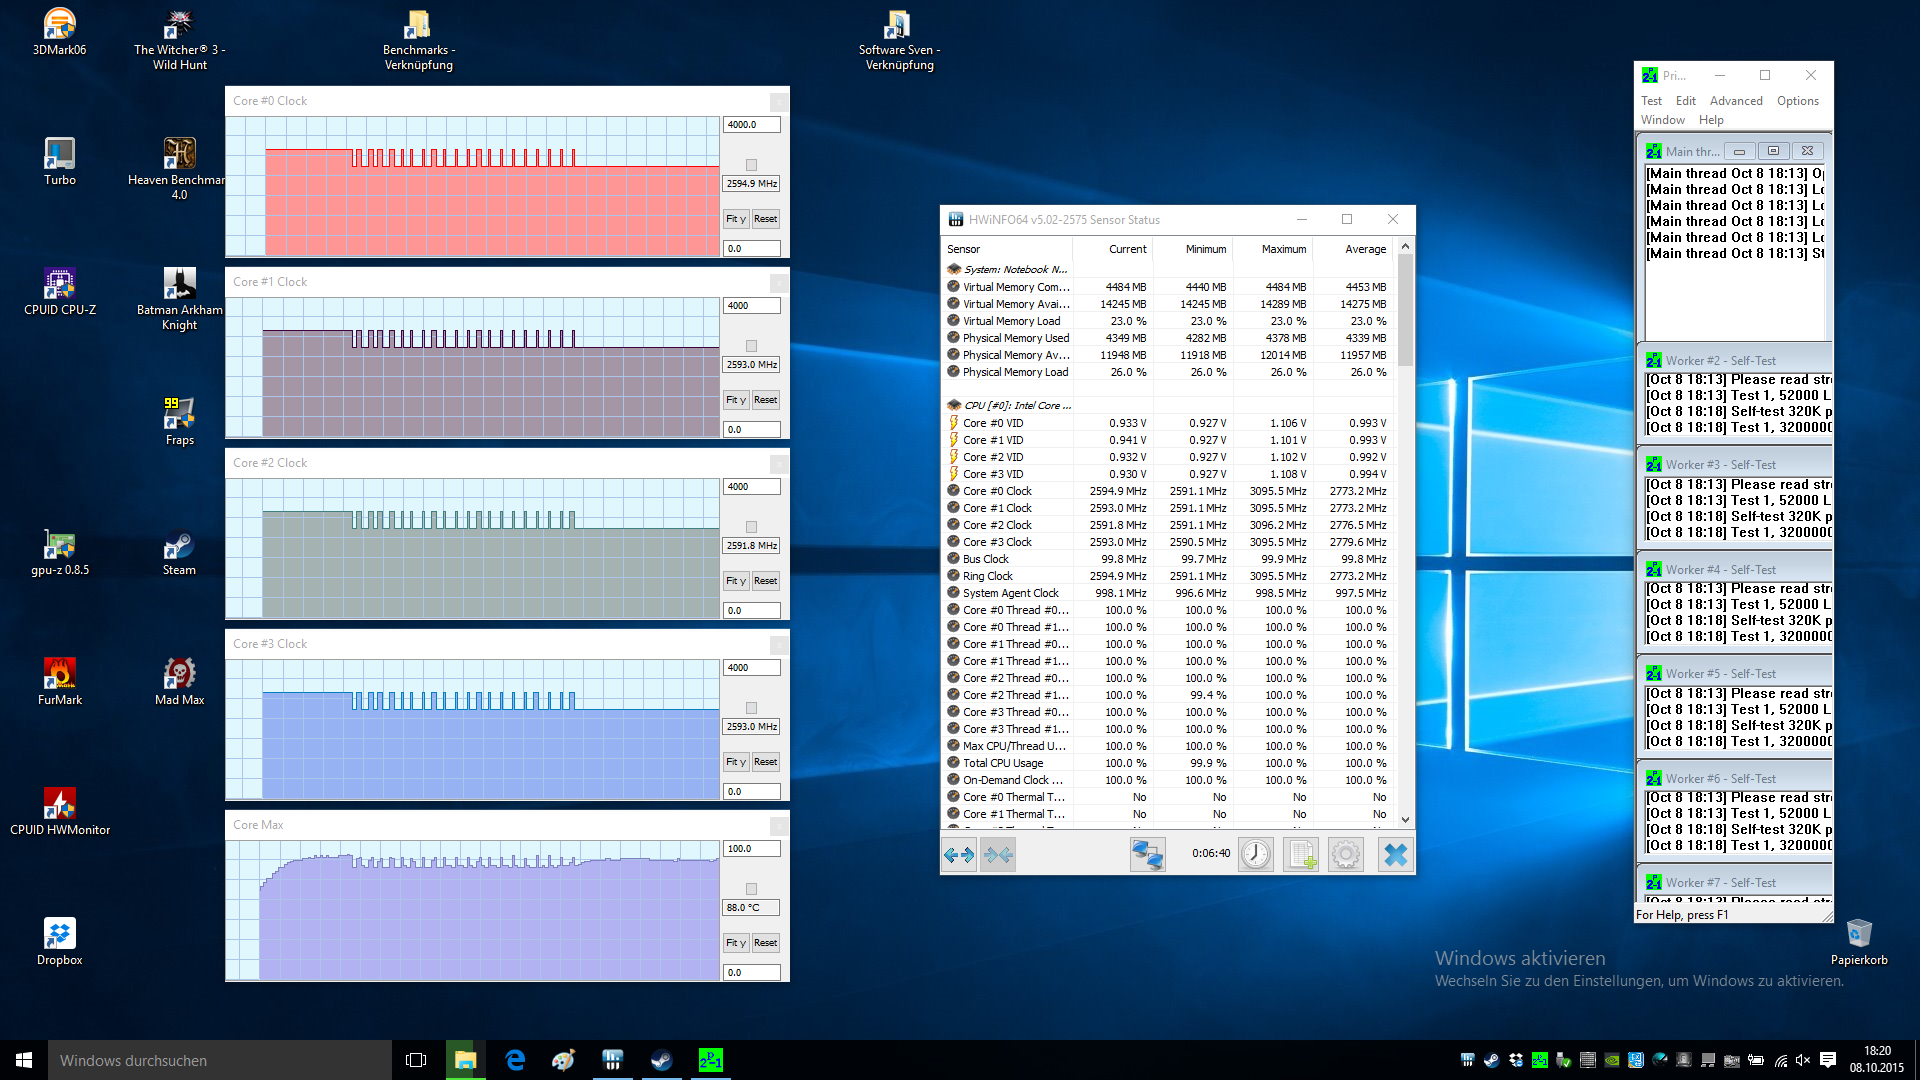
The base clock rate of 2.6 GHz can be increased to up to 3.1 GHz via turbo with all four cores under load. If it is a matter of only two threads, 3.3 GHz is the maximum possible frequency. The 47 watt i7-4720HQ (4x 2.6-3.6 GHz, Hyperthreading, Haswell, Clevo Barebone N150SD) with a slightly higher clock rate (also soldered) is comparable in terms of performance, though it requires more energy. If the Cinebench R15 multi-core benchmark is left running in a loop, the cores generally hold their 3.1 GHz clock rate, but sink to the base frequency time and again and reach temperatures of up to 90 °C (194 °F). The point is the processor is unable to take full advantage of its turbo. According to Cinebench R11.5 (multi-core), in other notebooks the Core i7-6700HQ computes 6 to 14 percent faster. The other Cinebench benchmarks show the CPU's performance precisely at the expected level.
| Cinebench R15 | |
| CPU Multi 64Bit (sort by value) | |
| Nexoc G515 II | |
| Schenker XMG A505 | |
| Acer Aspire VN7-591G-727P | |
| CPU Single 64Bit (sort by value) | |
| Nexoc G515 II | |
| Schenker XMG A505 | |
| Acer Aspire VN7-591G-727P | |
| Cinebench R11.5 | |
| CPU Multi 64Bit (sort by value) | |
| Nexoc G515 II | |
| Schenker XMG A505 | |
| Acer Aspire VN7-591G-727P | |
| CPU Single 64Bit (sort by value) | |
| Nexoc G515 II | |
| Schenker XMG A505 | |
| Acer Aspire VN7-591G-727P | |
| Cinebench R10 | |
| Rendering Multiple CPUs 32Bit (sort by value) | |
| Nexoc G515 II | |
| Acer Aspire VN7-591G-727P | |
| Rendering Single 32Bit (sort by value) | |
| Nexoc G515 II | |
| Acer Aspire VN7-591G-727P | |
System Performance
The Nexoc G515 II's specifications doubtlessly give the impression that everything runs smooth as butter -- and we agree. Thanks to its speedy processor and even speedier SSD, as is the case with similarly equipped notebooks, users can expect extremely fast program startups and faultlessly fluid operation. Even during our stress test, the Nexoc was perfectly responsive. The Schenker XMG P506 is equipped with an identical processor and SSD, but with a faster GTX 970M graphics card. Even with its stronger GPU, the Schenker machine was only able to reach a minimally higher overall score in PCMark 7, proving once again that a computer's graphics solution barely influences the results in system benchmarks.
| PCMark 8 | |
| Home Score Accelerated v2 (sort by value) | |
| Nexoc G515 II | |
| Schenker XMG A505 | |
| Acer Aspire VN7-591G-727P | |
| Work Score Accelerated v2 (sort by value) | |
| Nexoc G515 II | |
| Schenker XMG A505 | |
| Acer Aspire VN7-591G-727P | |
| PCMark 7 Score | 6161 points | |
| PCMark 8 Home Score Accelerated v2 | 3793 points | |
| PCMark 8 Work Score Accelerated v2 | 4964 points | |
Help | ||
Storage Devices
The Samsung SM951 achieves no less than three times the transfer speeds of most other single SSDs, primarily because the drive is connected over PCI Express and thus not limited by the SATA 3 interface. Whether this massive increase in transfer speed is dramatically noticeable in practice is admittedly questionable. The drive's 4K read performance has the potential to make a big difference, as this speed is important for program and OS startups. The system's result of 40 MB/s here is truly phenomenal.
| CrystalDiskMark 3.0 | |
| Read Seq (sort by value) | |
| Nexoc G515 II | |
| Schenker XMG A505 | |
| Acer Aspire VN7-591G-727P | |
| Read 4k (sort by value) | |
| Nexoc G515 II | |
| Schenker XMG A505 | |
| Acer Aspire VN7-591G-727P | |

Graphics Card
Because many are now sufficiently familiar with the high-end Nvidia GeForce GTX 960M graphics card, and the solution has been through our set of benchmark tests dozens of times, we humbly direct the reader to the linked article in our FAQ section for more information on this subject. The 3DMark 11 and 2013 GPU scores show that the model in our G515 II is one of the fastest we have tested to date; however, the differences between the various notebooks equipped with this card are not huge.
| 3DMark - 1920x1080 Fire Strike Graphics (sort by value) | |
| Nexoc G515 II | |
| Schenker XMG A505 | |
| Acer Aspire VN7-591G-727P | |
| Schenker XMG P506 | |
| 3DMark 11 - 1280x720 Performance GPU (sort by value) | |
| Nexoc G515 II | |
| Schenker XMG A505 | |
| Acer Aspire VN7-591G-727P | |
| Schenker XMG P506 | |
| 3DMark 11 Performance | 5797 points | |
| 3DMark Cloud Gate Standard Score | 17689 points | |
| 3DMark Fire Strike Score | 4123 points | |
Help | ||
Gaming Performance
Comprehensive commentary would not be profitable here either: We expressed our conclusion regarding the notebook's gaming performance at the beginning of this article, and once again refer the reader to our FAQ section for more details on this topic.
| low | med. | high | ultra | |
|---|---|---|---|---|
| Dragon Age: Inquisition (2014) | 93.7 | 33.4 | 22.3 | |
| Battlefield Hardline (2015) | 120 | 53 | 33 | |
| Dirt Rally (2015) | 74.8 | 33.9 | ||
| The Witcher 3 (2015) | 50.7 | 26.6 | 14.4 | |
| Batman: Arkham Knight (2015) | 64 | 30 | 0 | |
| Mad Max (2015) | 59.1 | 48.2 | 44.6 |
Emissions
System Noise
In idle mode, our test device could do without active cooling, leaving the machine almost silent (except for the barely audible hard drive). Under a low level of load, the CPU fan turned slowly enough that from a normal distance, the ambient noise covered the sound generated by the device. About 20 seconds after we started Prime95, the fan geared up to high speed and made itself clearly audible.
After we activated FurMark as well, the GPU fan joined the chorus, which increased the noise volume without raising the decibels significantly. Unfortunately, under heavy load the system also produced an additional buzzing noise. Clevo appears to have improved the fan control, as the Nexoc's fans are somewhat less jumpy than their counterparts in the Schenker notebook. The Schenker's fans are louder overall and their rotational speed is more erratic. We deducted points from the Nexoc to account for the whirring DVD drive.
| Nexoc G515 II 6700HQ, GeForce GTX 960M | Schenker XMG A505 4720HQ, GeForce GTX 960M | Acer Aspire VN7-591G-727P 4720HQ, GeForce GTX 960M | |
|---|---|---|---|
| Noise | -6% | -3% | |
| Idle Minimum * (dB) | 29.4 | 29.2 1% | 30 -2% |
| Idle Average * (dB) | 30.2 | 30.8 -2% | 32.2 -7% |
| Idle Maximum * (dB) | 35.6 | 42.6 -20% | 35 2% |
| Load Average * (dB) | 39.8 | 41.6 -5% | 41.7 -5% |
| Load Maximum * (dB) | 41.6 | 43.8 -5% | 42.6 -2% |
* ... smaller is better
Noise level
| Idle |
| 29.4 / 30.2 / 35.6 dB(A) |
| HDD |
| 30.4 dB(A) |
| DVD |
| 36 / dB(A) |
| Load |
| 39.8 / 41.6 dB(A) |
 | ||
30 dB silent 40 dB(A) audible 50 dB(A) loud |
||
min: | ||
Temperature
The Nexoc G515 II's surface temperatures are only harmless under load in the area of the palm rest. The user can safely work with the device on his or her lap, but gaming with the notebook in this position is not a good idea. The same goes for the XMG A505, but our Acer Aspire Nitro went about its work under load at temperatures up to 9 °C lower (16.2 °F).
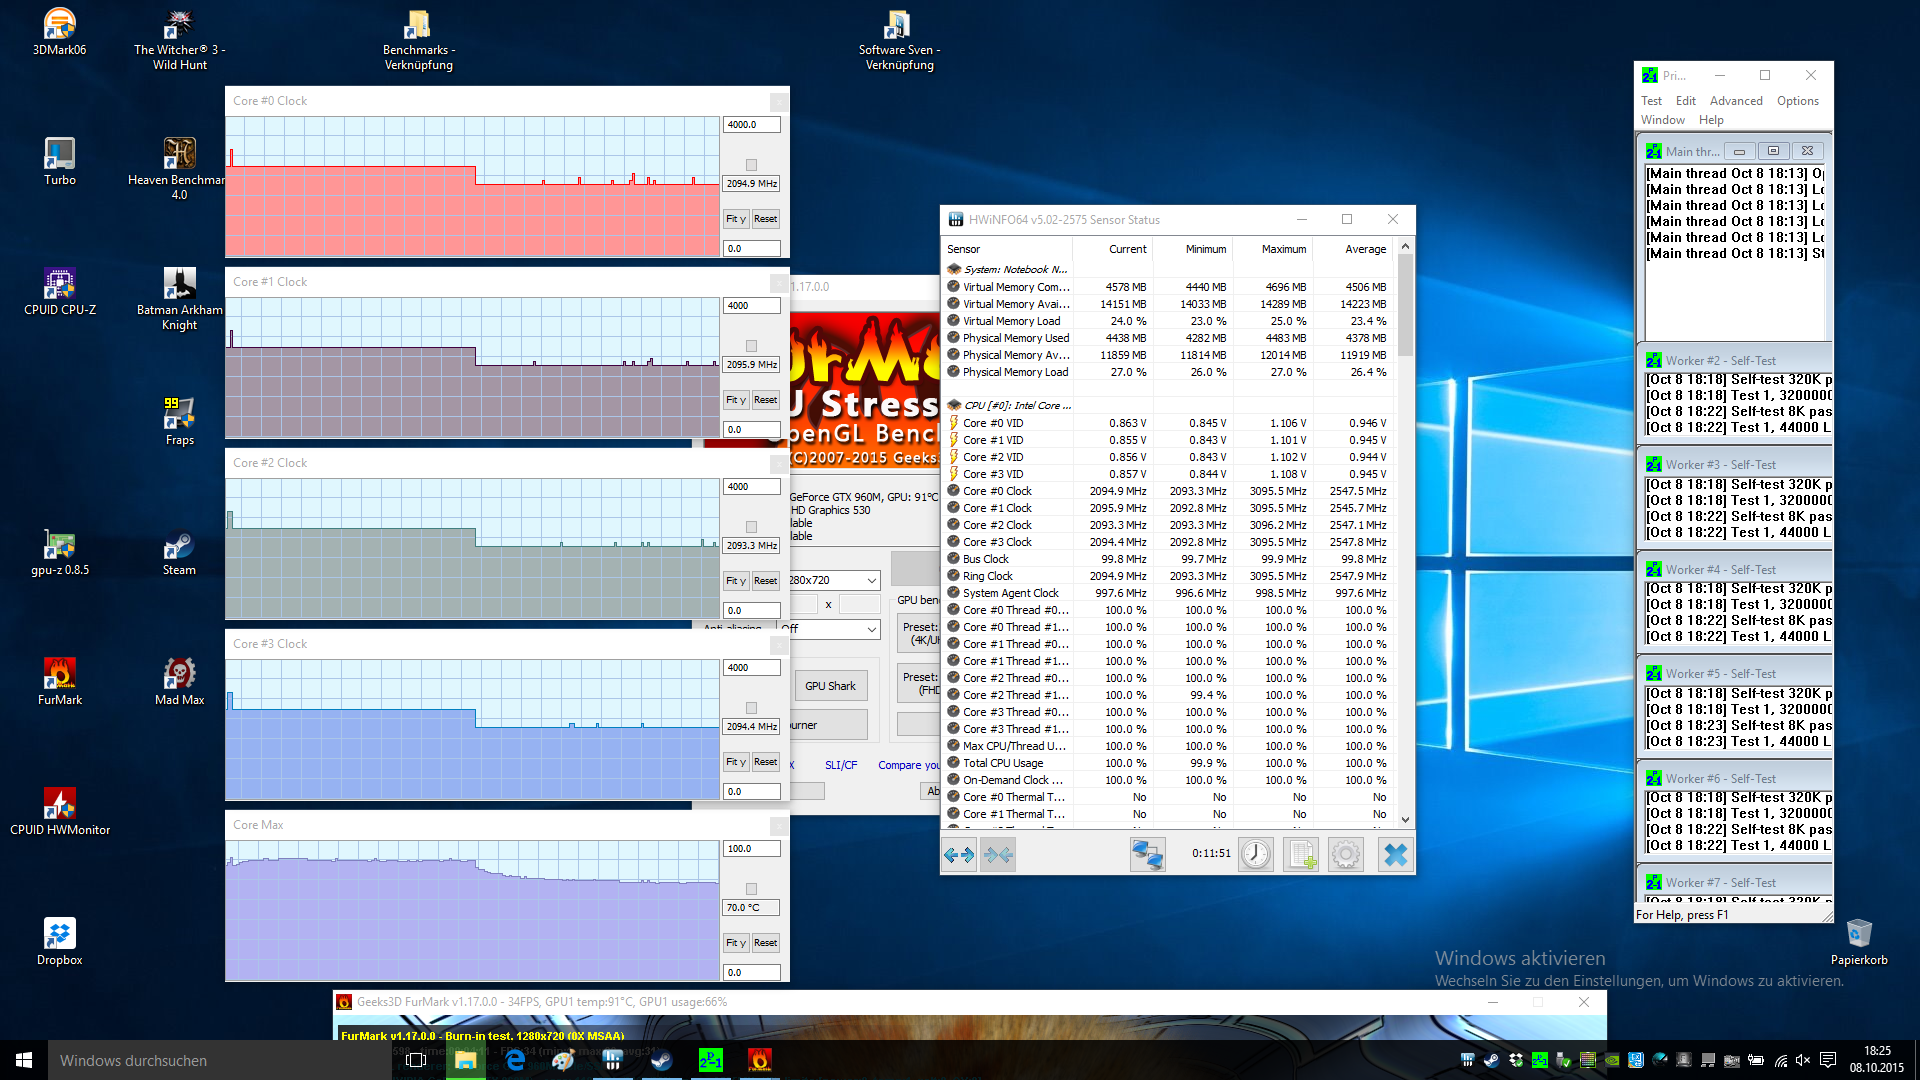
With the CPU under maximum load (via Prime95), the cores primarily run at 2.6 GHz. With a maximum temperature of 88 °C (190.4 °F), the cores only briefly reach the specified turbo frequency of 3.1 GHz. The speeds fell below the base clock rate (throttling) when we ran the GPU stress test (FurMark) on top of Prime95. In this scenario, the processor hardly managed 2.1 GHz. In practice, such a prolonged period with both the CPU and GPU under full load is exceedingly rare, thus these temperature-related limitations are very unlikely to have an effect on gaming performance.
| Nexoc G515 II 6700HQ, GeForce GTX 960M | Schenker XMG A505 4720HQ, GeForce GTX 960M | Acer Aspire VN7-591G-727P 4720HQ, GeForce GTX 960M | |
|---|---|---|---|
| Heat | -2% | 2% | |
| Maximum Upper Side * (°C) | 56.8 | 56.4 1% | 53 7% |
| Maximum Bottom * (°C) | 62 | 61.8 -0% | 53.2 14% |
| Idle Upper Side * (°C) | 39.6 | 41.3 -4% | 38.6 3% |
| Idle Bottom * (°C) | 39.1 | 40.2 -3% | 45.9 -17% |
* ... smaller is better
(-) The maximum temperature on the upper side is 56.8 °C / 134 F, compared to the average of 40.4 °C / 105 F, ranging from 21.2 to 68.8 °C for the class Gaming.
(-) The bottom heats up to a maximum of 62 °C / 144 F, compared to the average of 43.3 °C / 110 F
(±) In idle usage, the average temperature for the upper side is 32.8 °C / 91 F, compared to the device average of 33.9 °C / 93 F.
(+) The palmrests and touchpad are cooler than skin temperature with a maximum of 30.8 °C / 87.4 F and are therefore cool to the touch.
(±) The average temperature of the palmrest area of similar devices was 28.9 °C / 84 F (-1.9 °C / -3.4 F).
Energy Management
Power Consumption
Comparing the three competing notebooks, we see that in idle mode and under an average level of load, the G515 II uses up to 31% less energy than its two Haswell rivals. The new, more energy-efficient Skylake CPU certainly plays a major role here, and the difference is quite obvious. Under full load, the numbers lie closer together.
| Nexoc G515 II 6700HQ, GeForce GTX 960M | Schenker XMG A505 4720HQ, GeForce GTX 960M | Acer Aspire VN7-591G-727P 4720HQ, GeForce GTX 960M | |
|---|---|---|---|
| Power Consumption | -17% | -21% | |
| Idle Minimum * (Watt) | 11.2 | 11.2 -0% | 16.2 -45% |
| Idle Average * (Watt) | 14.6 | 18.6 -27% | 20.2 -38% |
| Idle Maximum * (Watt) | 21.8 | 26 -19% | 22.8 -5% |
| Load Average * (Watt) | 78.3 | 100.2 -28% | 96.4 -23% |
| Load Maximum * (Watt) | 132.6 | 147.6 -11% | 126.9 4% |
* ... smaller is better
| Off / Standby | |
| Idle | |
| Load |
|
Key:
min: | |
Battery Life
Both our test device and the Schenker XMG A505 are equipped with 62 Wh batteries, while the Acer Aspire Nitro has to get by with 10 Wh less. That fact alone partially explains why the Acer machine falls significantly behind its two competitors in our WLAN test (which is designed to simulate practical, everyday use). Because we measured the Schenker notebook's battery life using our old series of tests, the results are not directly comparable. However, the battery runtime test under load, the results of which are strongly influenced by the (identical) graphics card, shows that the i7-6700HQ is more frugal than the i7-4720HQ.
| Nexoc G515 II 6700HQ, GeForce GTX 960M | Schenker XMG A505 4720HQ, GeForce GTX 960M | Acer Aspire VN7-591G-727P 4720HQ, GeForce GTX 960M | |
|---|---|---|---|
| Battery runtime | -5% | -40% | |
| WiFi v1.3 (h) | 4.2 | 2.8 -33% | |
| Load (h) | 1.9 | 1.8 -5% | 1 -47% |
| WiFi (h) | 3.6 |
Pros
Cons
Verdict

Even though the Nexoc G515 II makes a good impression overall, its disappointing display (despite IPS technology) makes us hesitant to recommend it for purchase.
Those who are fans of the case, input devices and great connectivity options should take a look at the older Schenker XMG A505. The Schenker notebook is a little louder and uses more energy, but performance-wise it has no problem keeping up (at least in practice), and it offers an almost perfect display. The second main competitor, the Acer Aspire V 15 Nitro, has an especially thin case and is even outfitted with a 4K screen, but the notebook is difficult to service and its battery life is not very long.
Nexoc G515 II
- 02/23/2016 v5 (old)
Sven Kloevekorn
Price comparison
