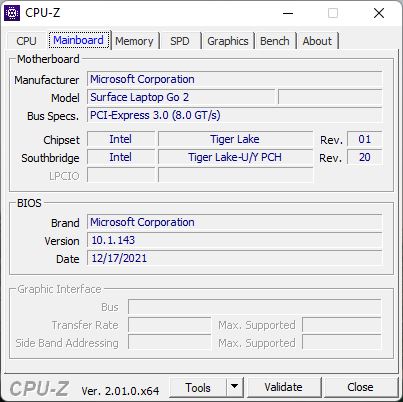
Microsoft Surface Laptop Go 2 review - Compact companion with old hardware
With the Surface Laptop Go, Microsoft offers a compact entry-level device from the world of Surface laptops, and the second generation receives a faster Core i5 processor of the Intel Tiger Lake generation. However, nothing has changed in the basic design of the laptop. The price of the new Surface Laptop Go 2 officially starts from about 600 Euros (~$602) with the Core i5-1135G7, 4 GB of RAM, and a 128-GB SSD, but this model is currently only available from Microsoft directly.
Our test unit is the most expensive model with an MSRP of 869 Euros (~$872), offering 8 GB of RAM and a 256-GB PCIe SSD. At this point, Microsoft has already lowered the prices, and our model is now available for 679 Euros (~$681) from Microsoft directly.
Possible Competitors in Comparison
Rating | Date | Model | Weight | Height | Size | Resolution | Price |
|---|---|---|---|---|---|---|---|
| 83.3 % v7 (old) | 08 / 2022 | Microsoft Surface Laptop Go 2 Core i5 i5-1135G7, Iris Xe G7 80EUs | 1.1 kg | 16 mm | 12.40" | 1536x1024 | |
| 87.7 % v7 (old) | 05 / 2021 | Dell XPS 13 9305 Core i5 FHD i5-1135G7, Iris Xe G7 80EUs | 1.2 kg | 16 mm | 13.30" | 1920x1080 | |
| 91.1 % v7 (old) | 12 / 2020 | Apple MacBook Air 2020 M1 Entry M1, M1 7-Core GPU | 1.3 kg | 16.1 mm | 13.30" | 2560x1600 | |
| 86.3 % v7 (old) | 04 / 2022 | VAIO SX12 VJS124X1011P i5-1155G7, Iris Xe G7 80EUs | 892 g | 17.8 mm | 12.50" | 1920x1080 | |
| 84.6 % v7 (old) | 10 / 2020 | Microsoft Surface Laptop Go Core i5 i5-1035G1, UHD Graphics G1 (Ice Lake 32 EU) | 1.1 kg | 15.69 mm | 12.40" | 1536x1024 |
Case and Equipment
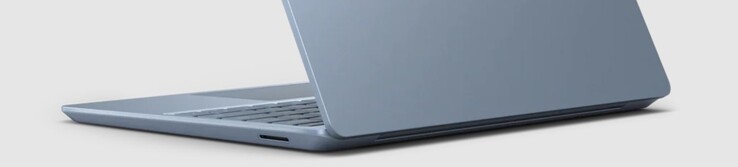
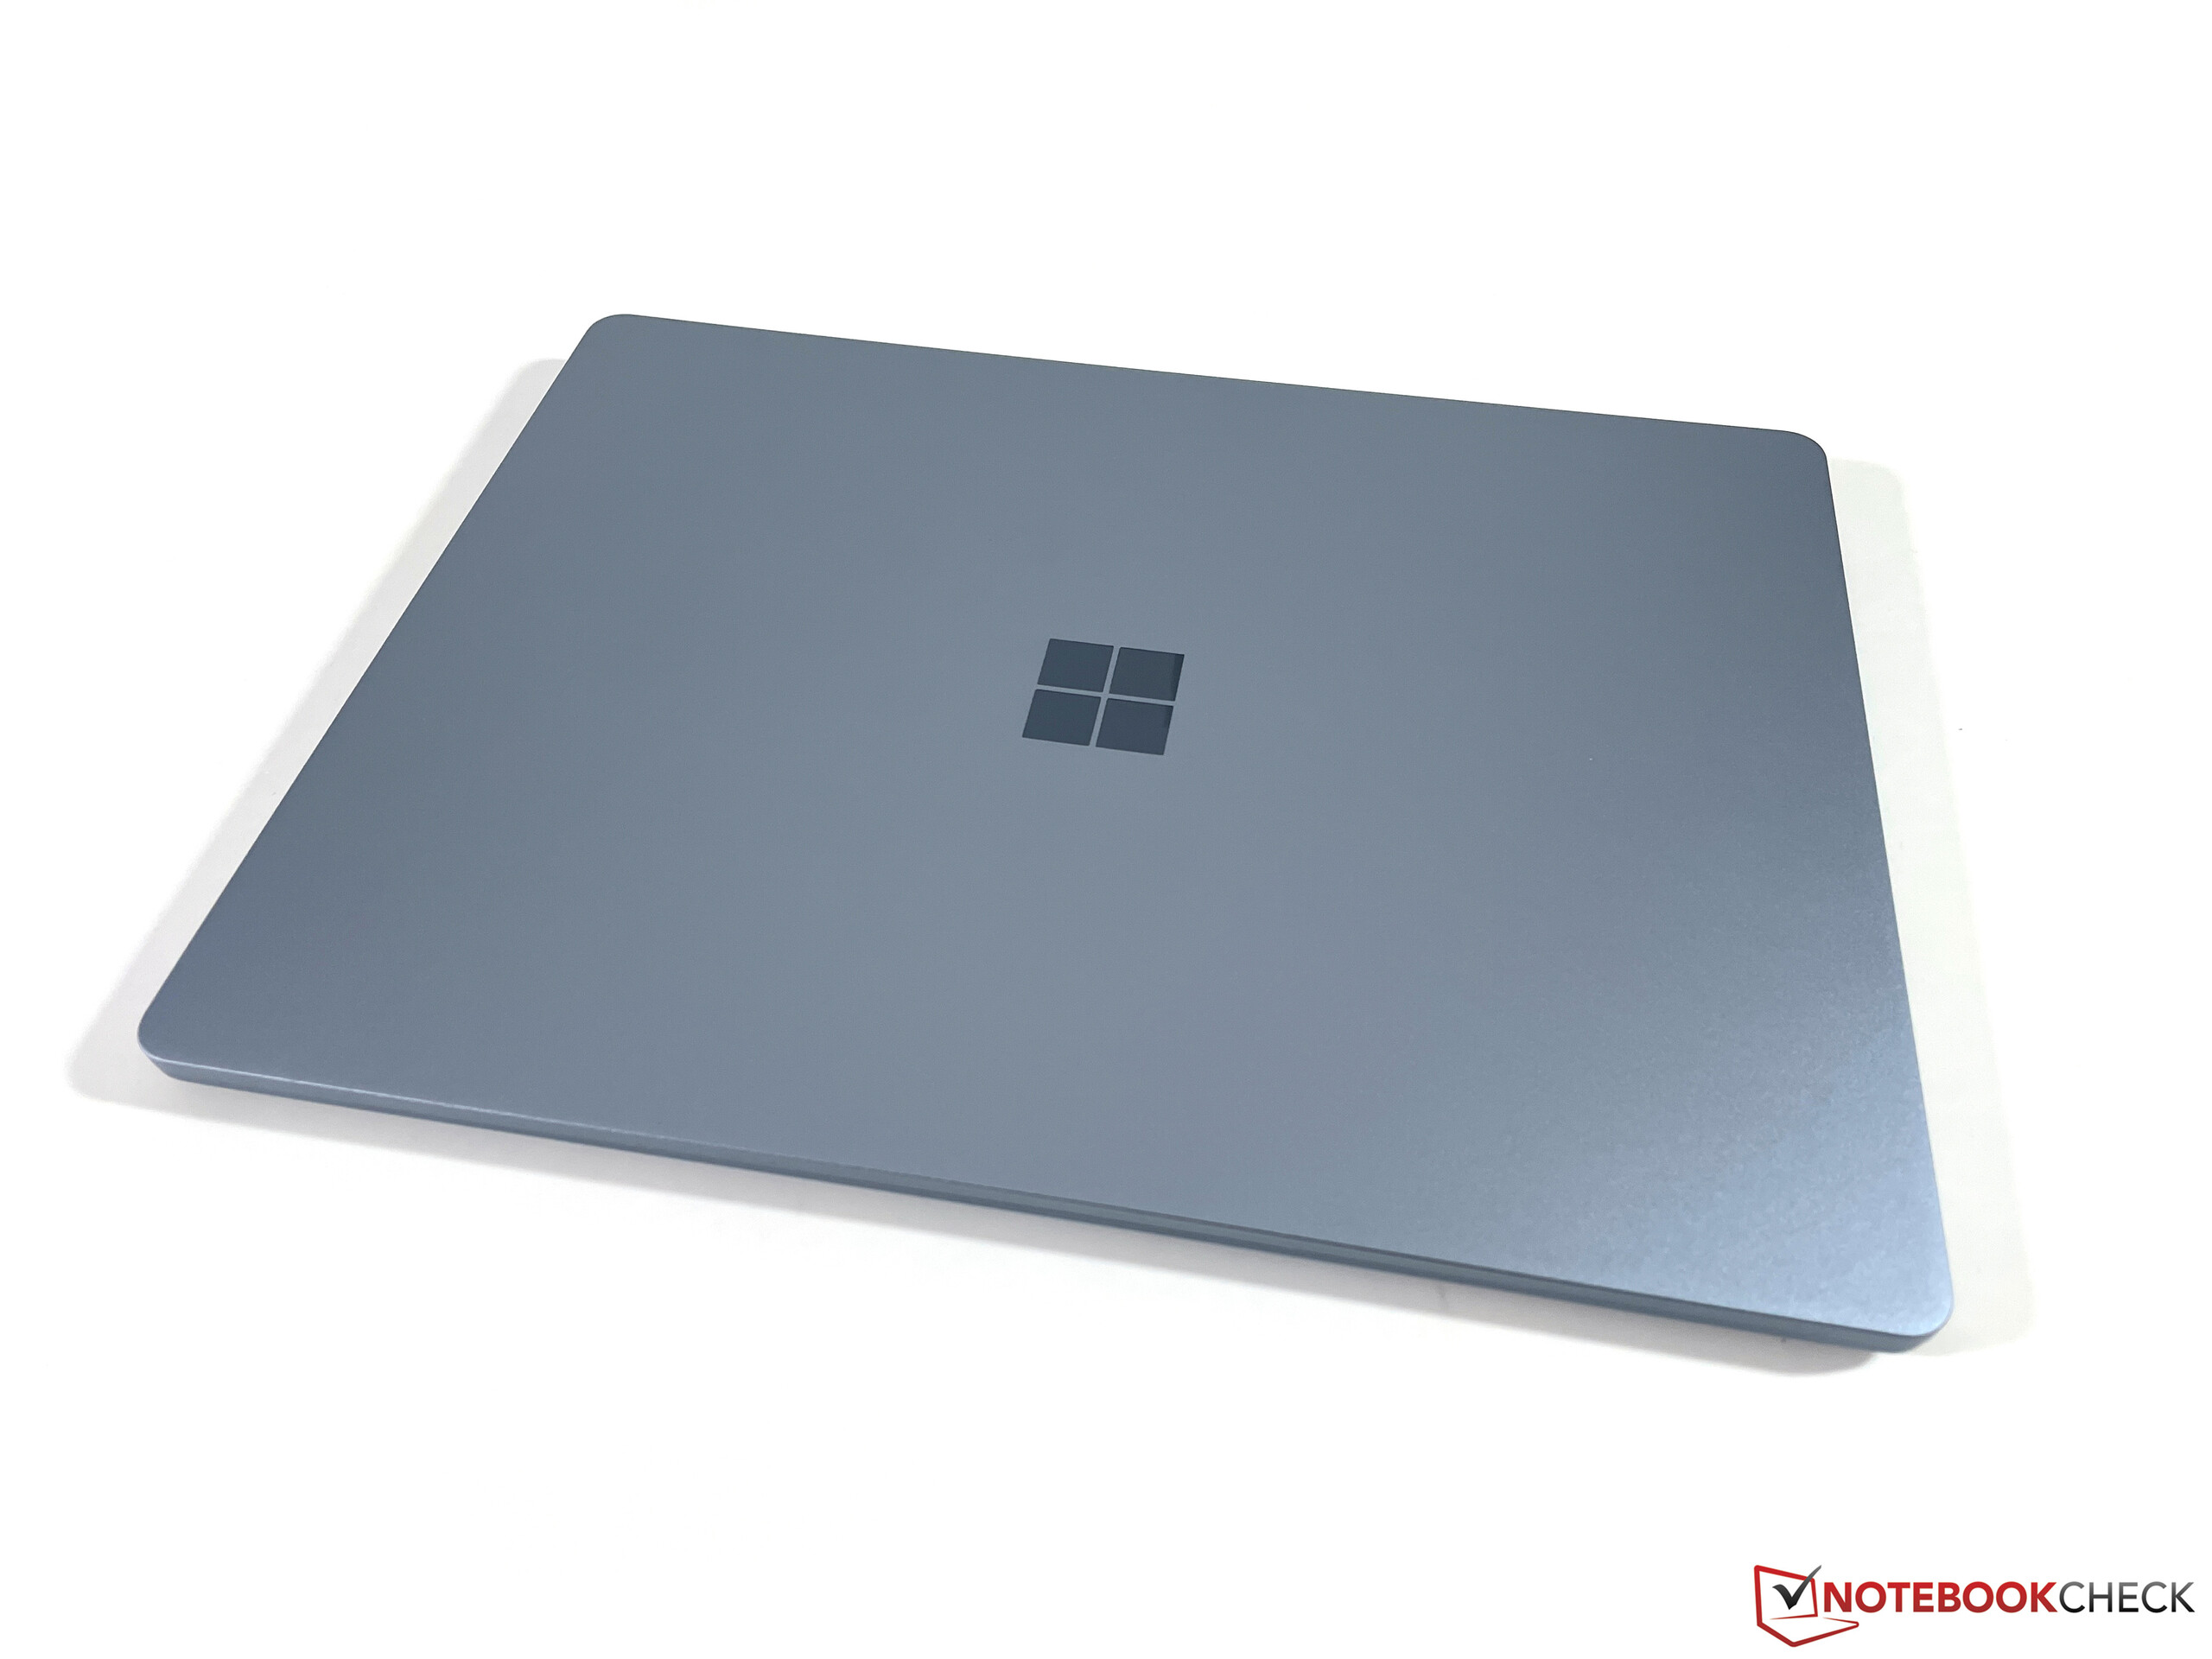
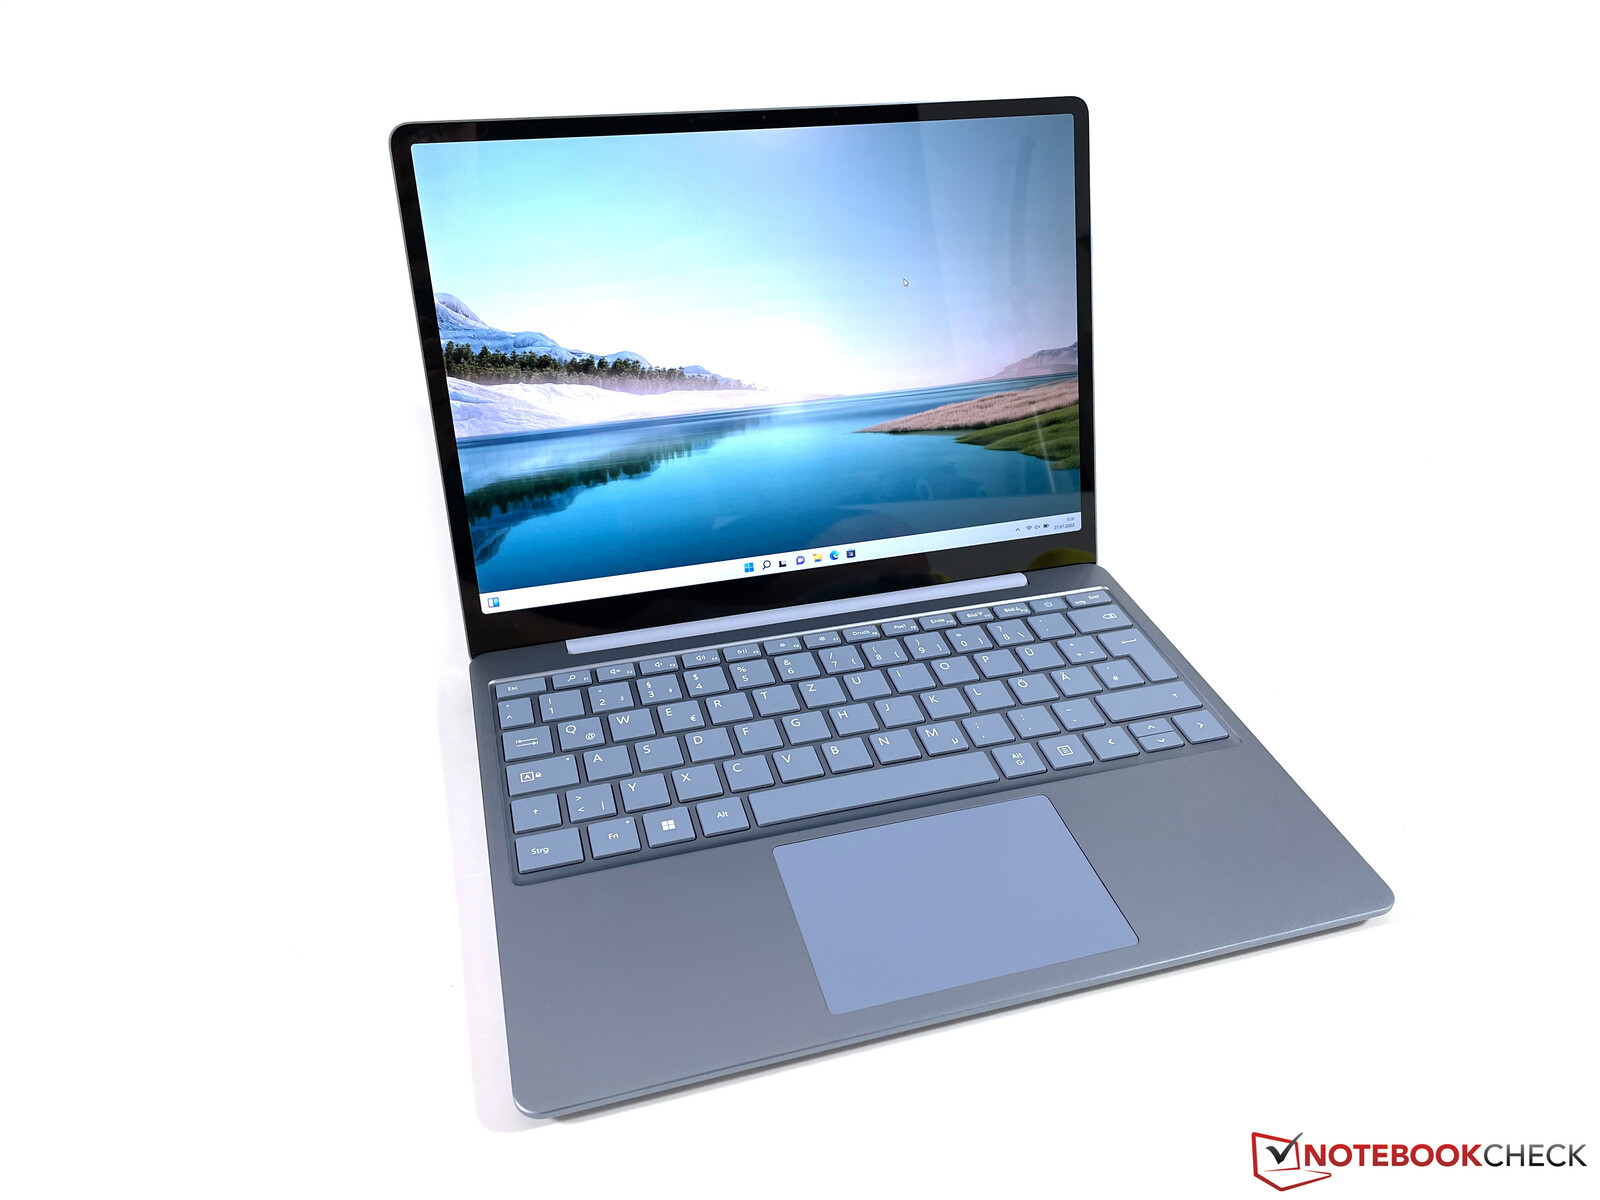
Microsoft kept the case design of the Surface Laptop Go without making any changes. It continues to be a high-quality product that can easily compete with significantly more expensive competitors. There are also no differences to the more expensive Surface models in this regard. The stability of the metal case (aluminum lid and base unit made of both aluminum and plastic) is very good, only the hinge could have turned out slightly stiffer, since it is unable to prevent some wobbling completely. The maximum opening angle is 135 degrees.
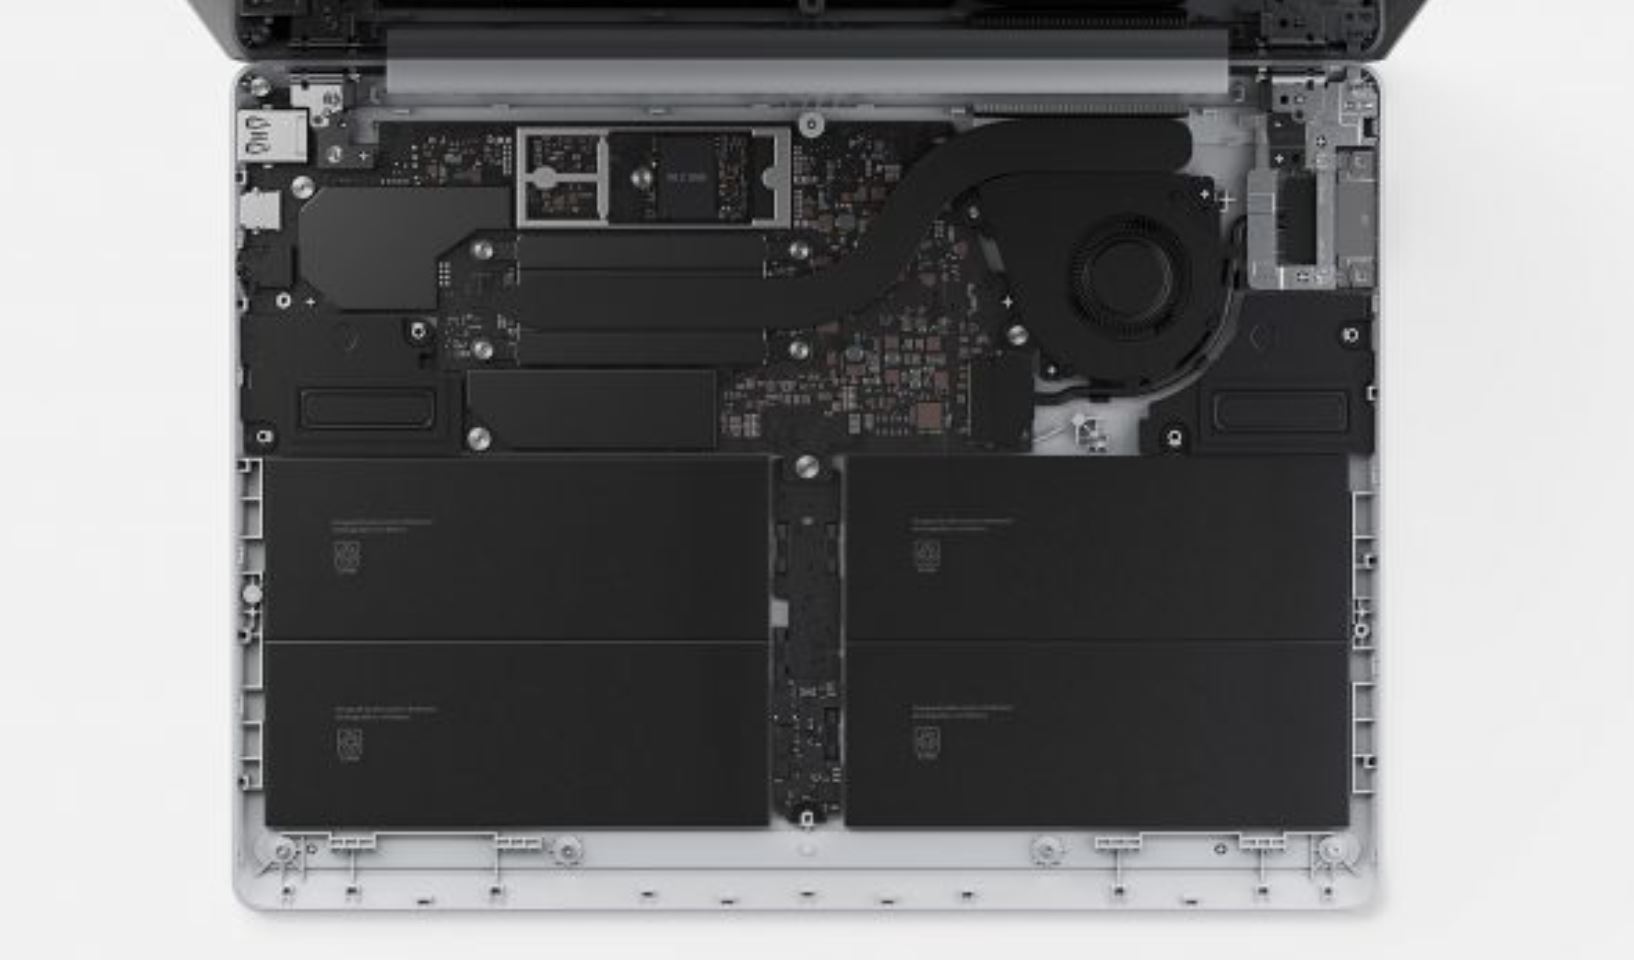
The color of our test unit is called Ice Blue and looks good. Alternatively, Platin, Sage, and Sandstone are also available. We like the visual impression of the compact device with its tapered base unit. Only the display bezels (particularly below the display) look a bit wide. But overall, the Surface Laptop Go 2 remains an attractive device. However, it continues to remain a large disadvantage that it is practically impossible (by design) for the end user to perform any maintenance at all.


There are also no changes in the connections, and Microsoft continues to use the impractical Surface Connector. On the other hand, this also allows you to use other accessories. You can also charge the Surface Laptop Go 2 via USB-C, and it is also possible to connect an external monitor that way. While you have to live without Thunderbolt or fast standards, you can benefit from the regular USB-A connection in everyday usage. The webcam is still a 720p sensor, whose quality is hardly convincing.


In terms of the WLAN module, Microsoft continues to use the AX201 card from Intel. It supports Wi-Fi-6 networks and reaches very high and stable transfer rates in the test with our Asus reference router. We did not encounter any problems with it in our testing period. Bluetooth 5.1 is also supported.


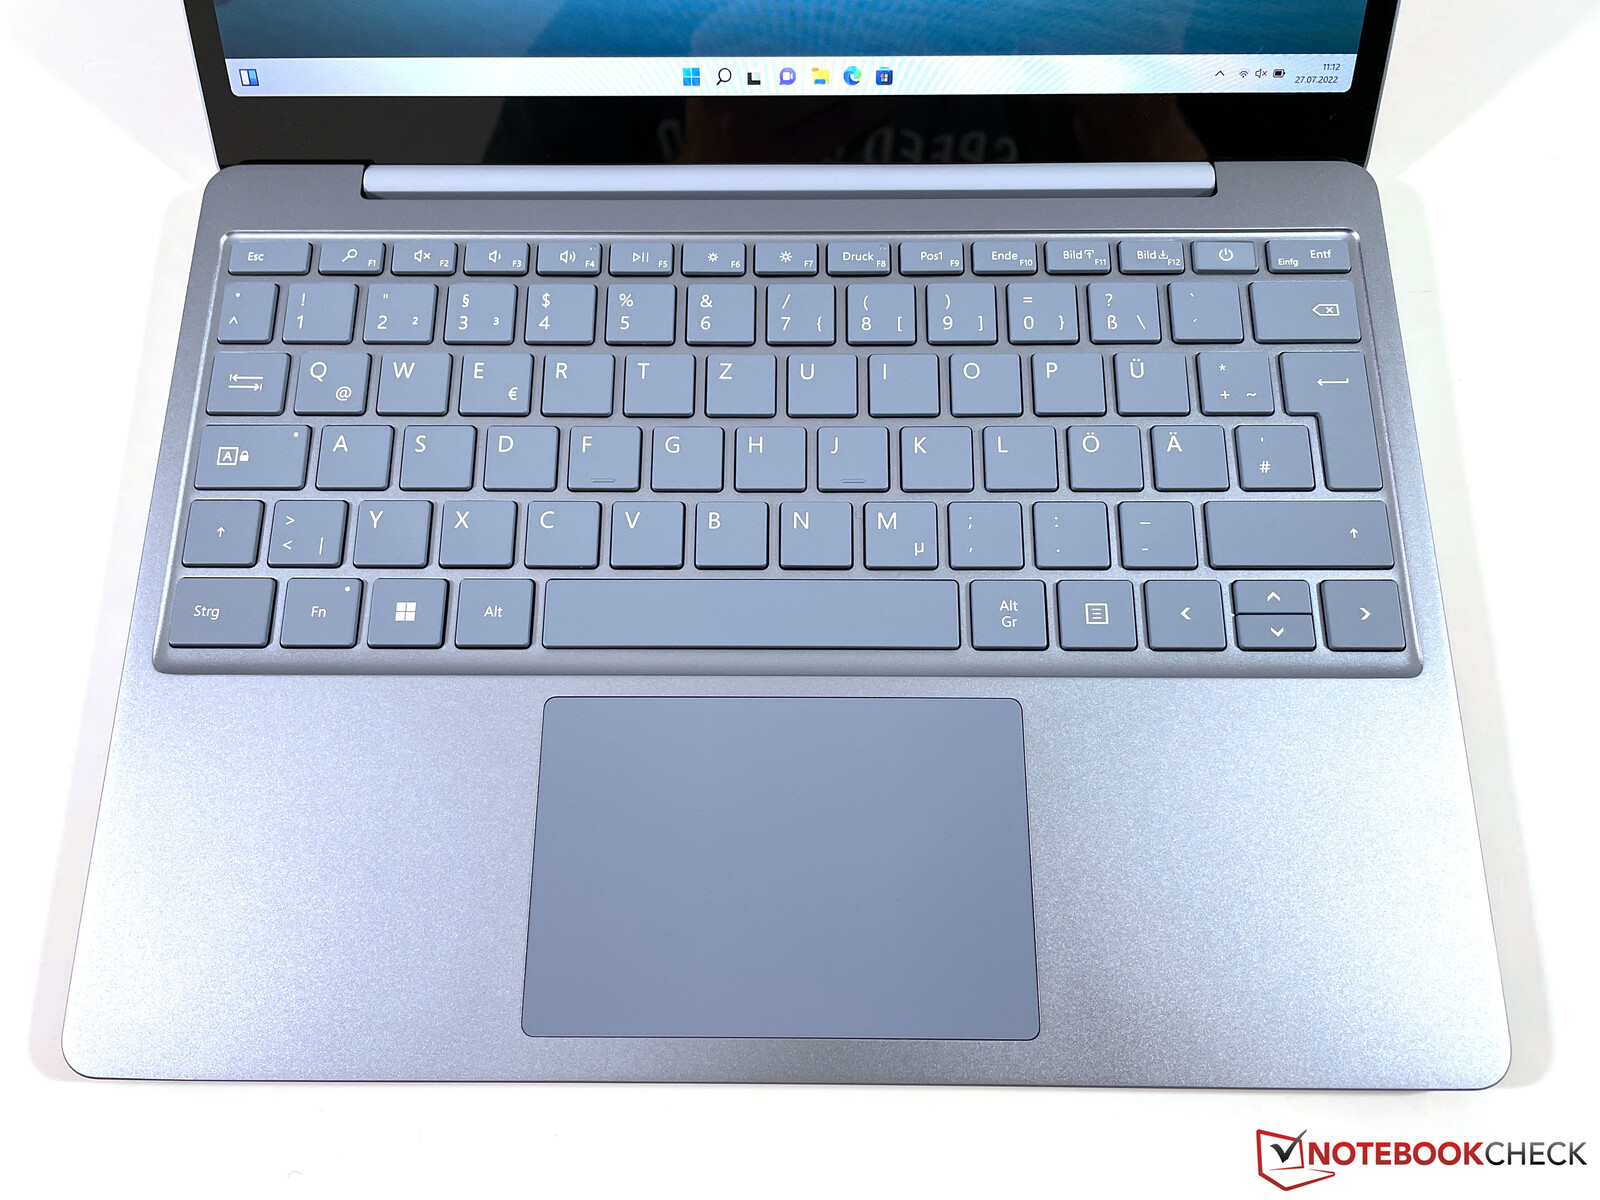
Input Devices - Microsoft does without a keyboard illumination
The keyboard of the Surface Laptop Go 2 delivers a good typing experience, also allowing you to type even longer texts without any problems. As already in the case, there are are no noticeable differences to the more expensive Surface laptops here. However, what you will notice is the lack of a keyboard illumination, which represents a clear negative point considering the original MSRP.
The ClickPad works flawlessly, and in contrast to many other laptops, the clicking sounds are also not too loud. Alternatively, you can also use the capacitive touchscreen for inputs, which also works without any problems.
Display - Surface Laptop Go with 3:2 IPS touchscreen
The 12.4-inch display with the 3:2 format offers some advantages in productivity, since you have more vertical space to work with. However, those who like to watch movies or series have to live with some larger black bars on top and bottom, compared to 16:9 or 16:10 displays. The resolution of the IPS panel continues to be a relatively low 1,536 x 1,024 pixels (148 DPI), but the subjective image impression is still okay in terms of the image sharpness. Thanks to a brightness sensor, the brightness of the panel can be adjusted automatically.
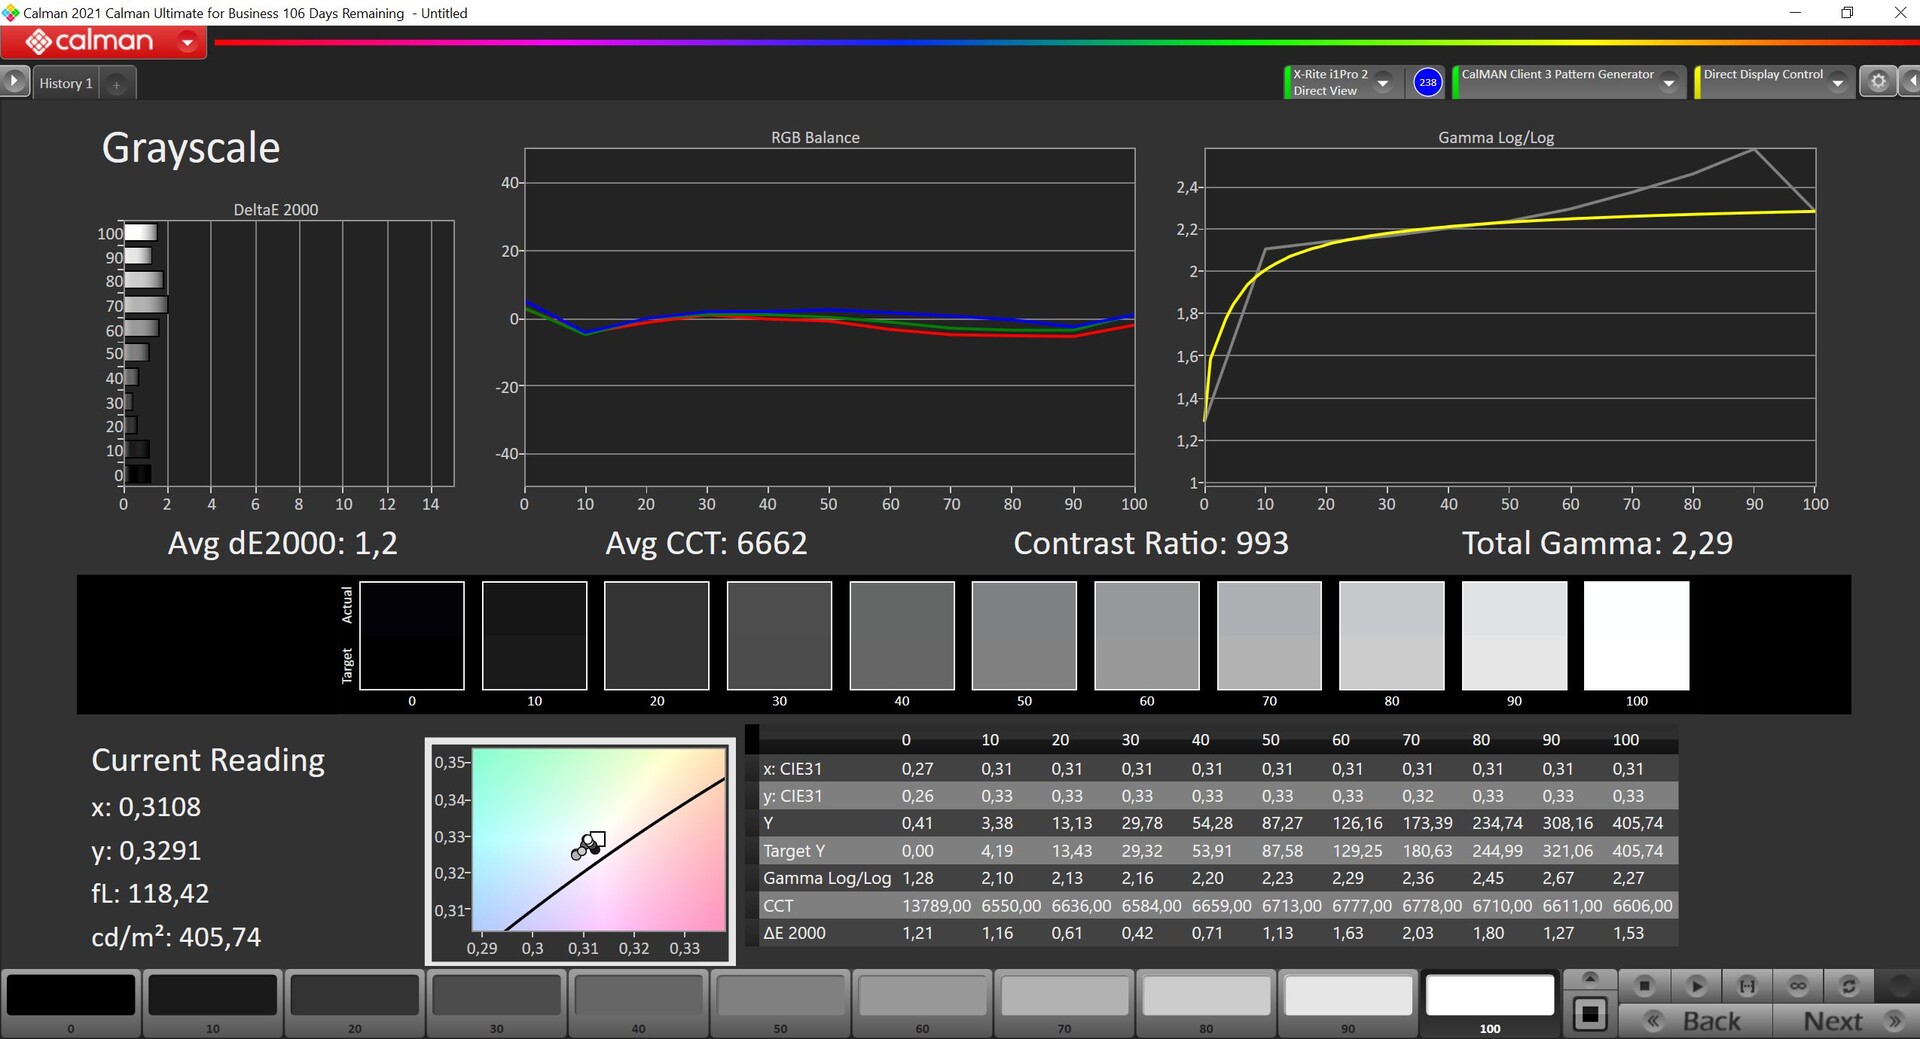
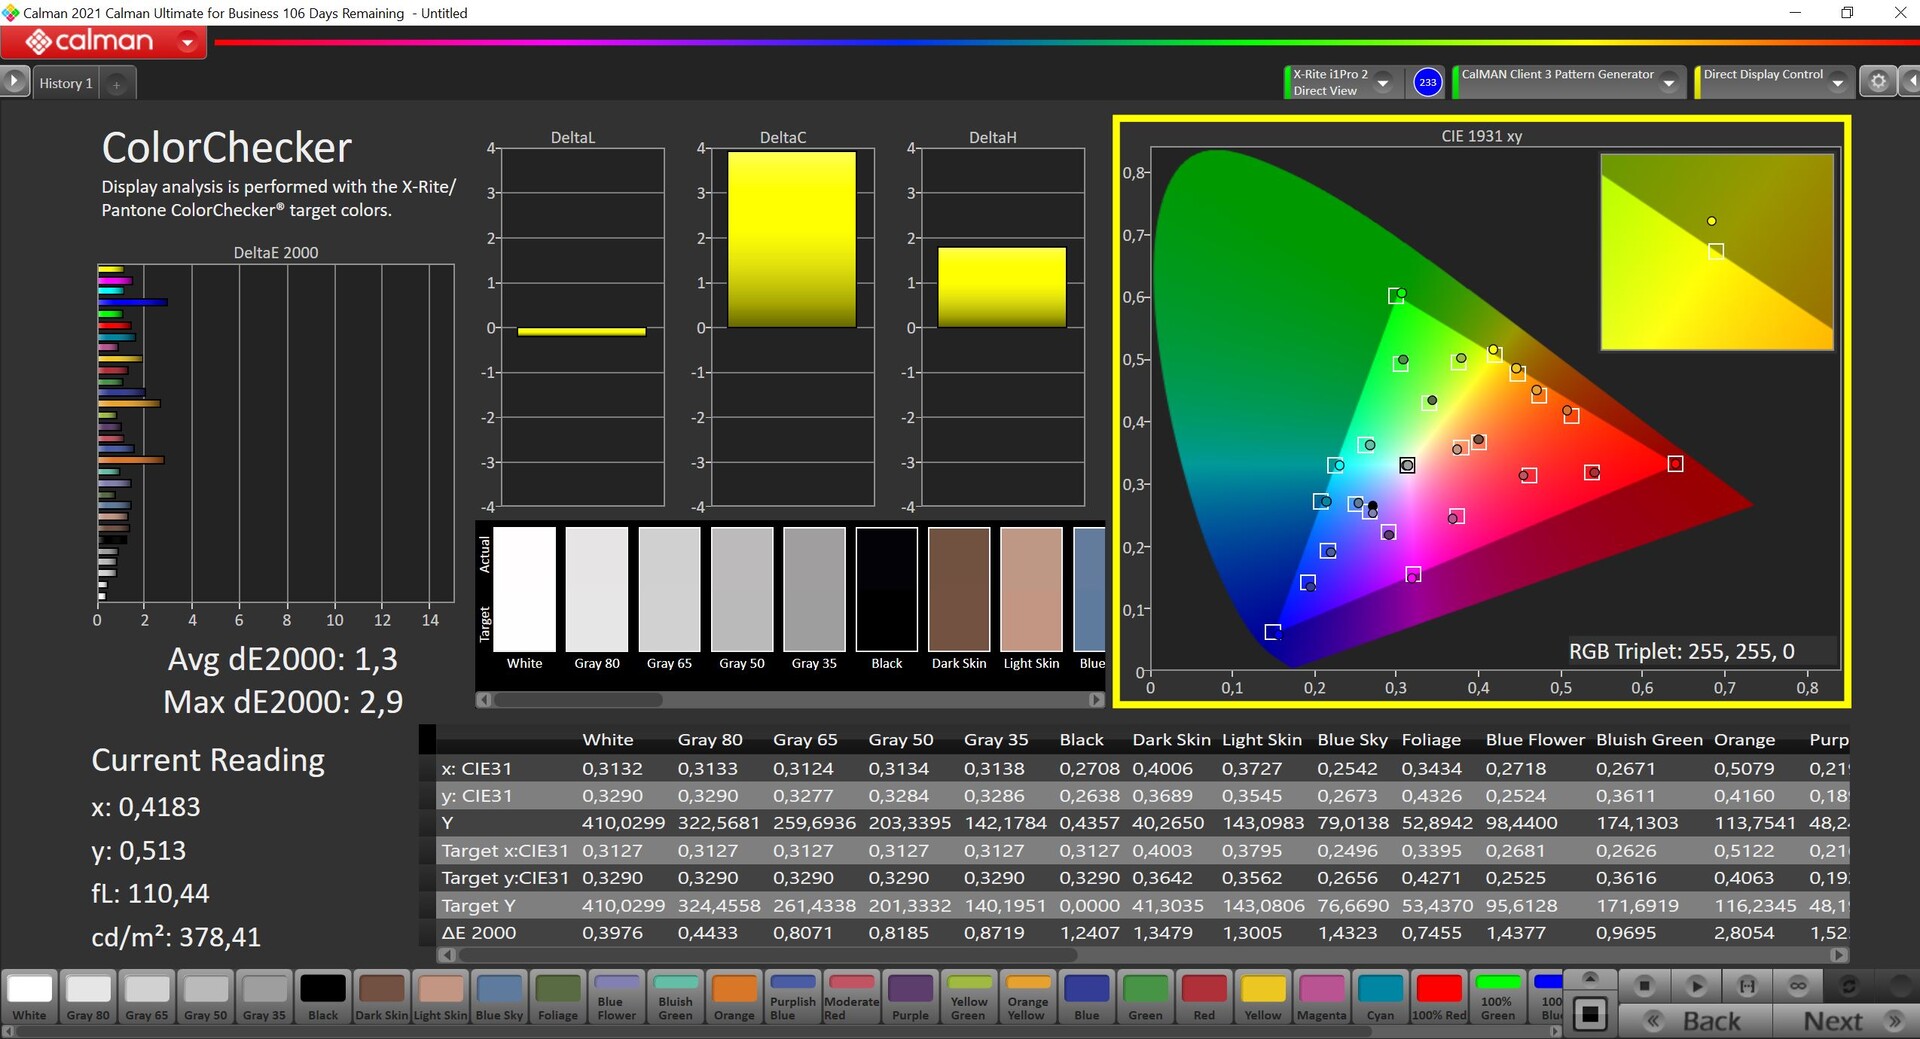
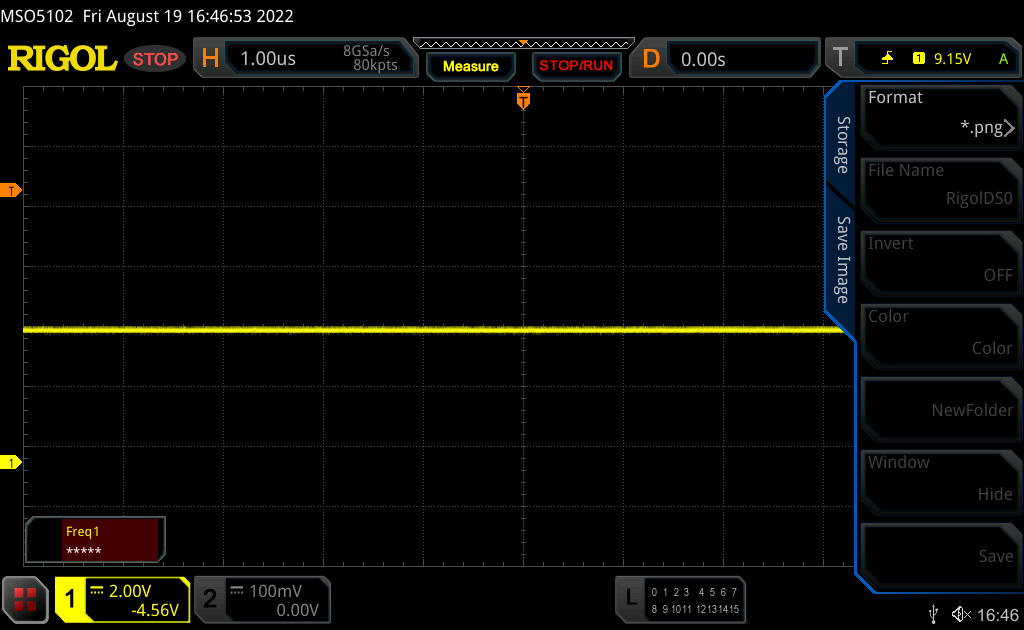
In our measurements with the professional CalMAN software (X-Rite i1 Pro 2), the average brightness is 400 cd/m², which is about 50 cd/m² brighter than the predecessor, even though the same panel is used. On the other hand, the black value and resulting contrast ratio turn out worse, and the new Surface Laptop Go 2 barely misses a contrast of 1000:1. At brightness levels of 50% or lower, we measure PWM flickering at a frequency of 9.7 kHz, but this should not lead to any problems. The response times are inconspicuous, and the viewing angles of the IPS panel are also good.


| |||||||||||||||||||||||||
Brightness Distribution: 95 %
Center on Battery: 406 cd/m²
Contrast: 990:1 (Black: 0.41 cd/m²)
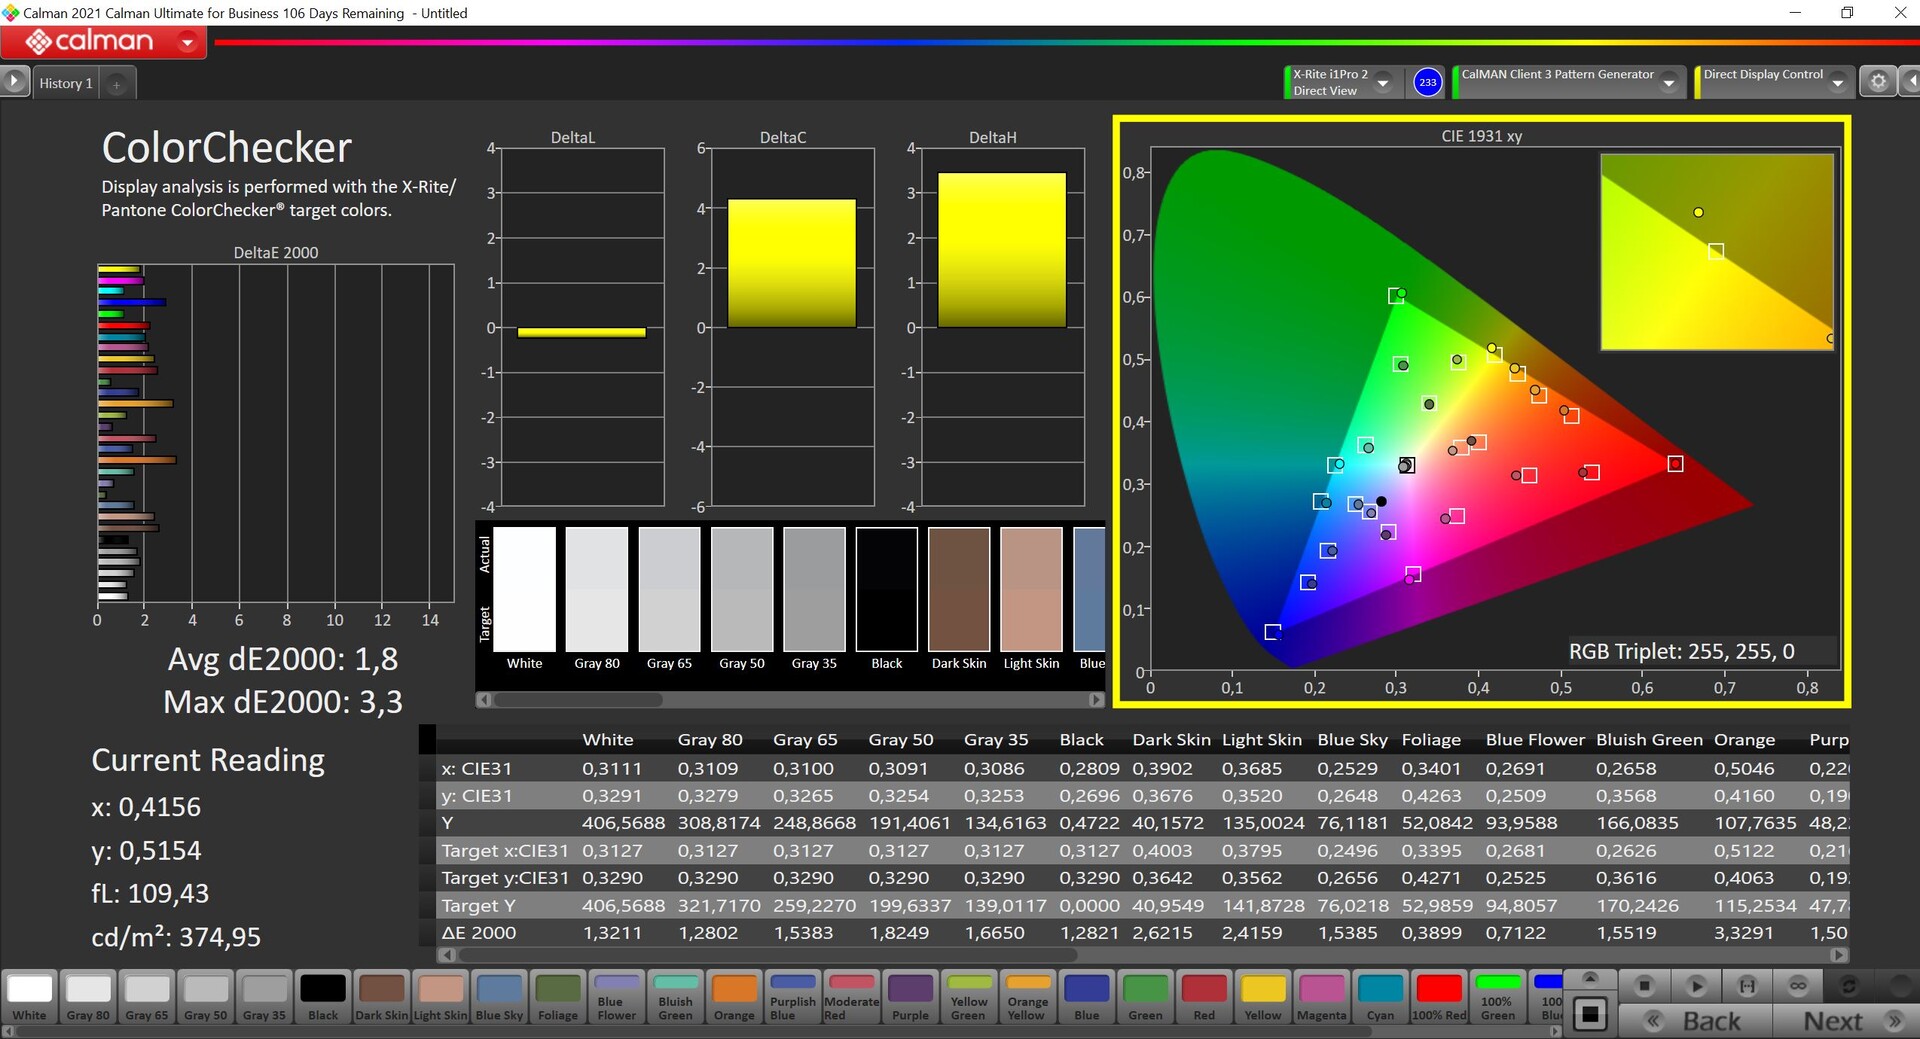
ΔE ColorChecker Calman: 1.8 | ∀{0.5-29.43 Ø4.75}
calibrated: 1.3
ΔE Greyscale Calman: 1.2 | ∀{0.09-98 Ø5}
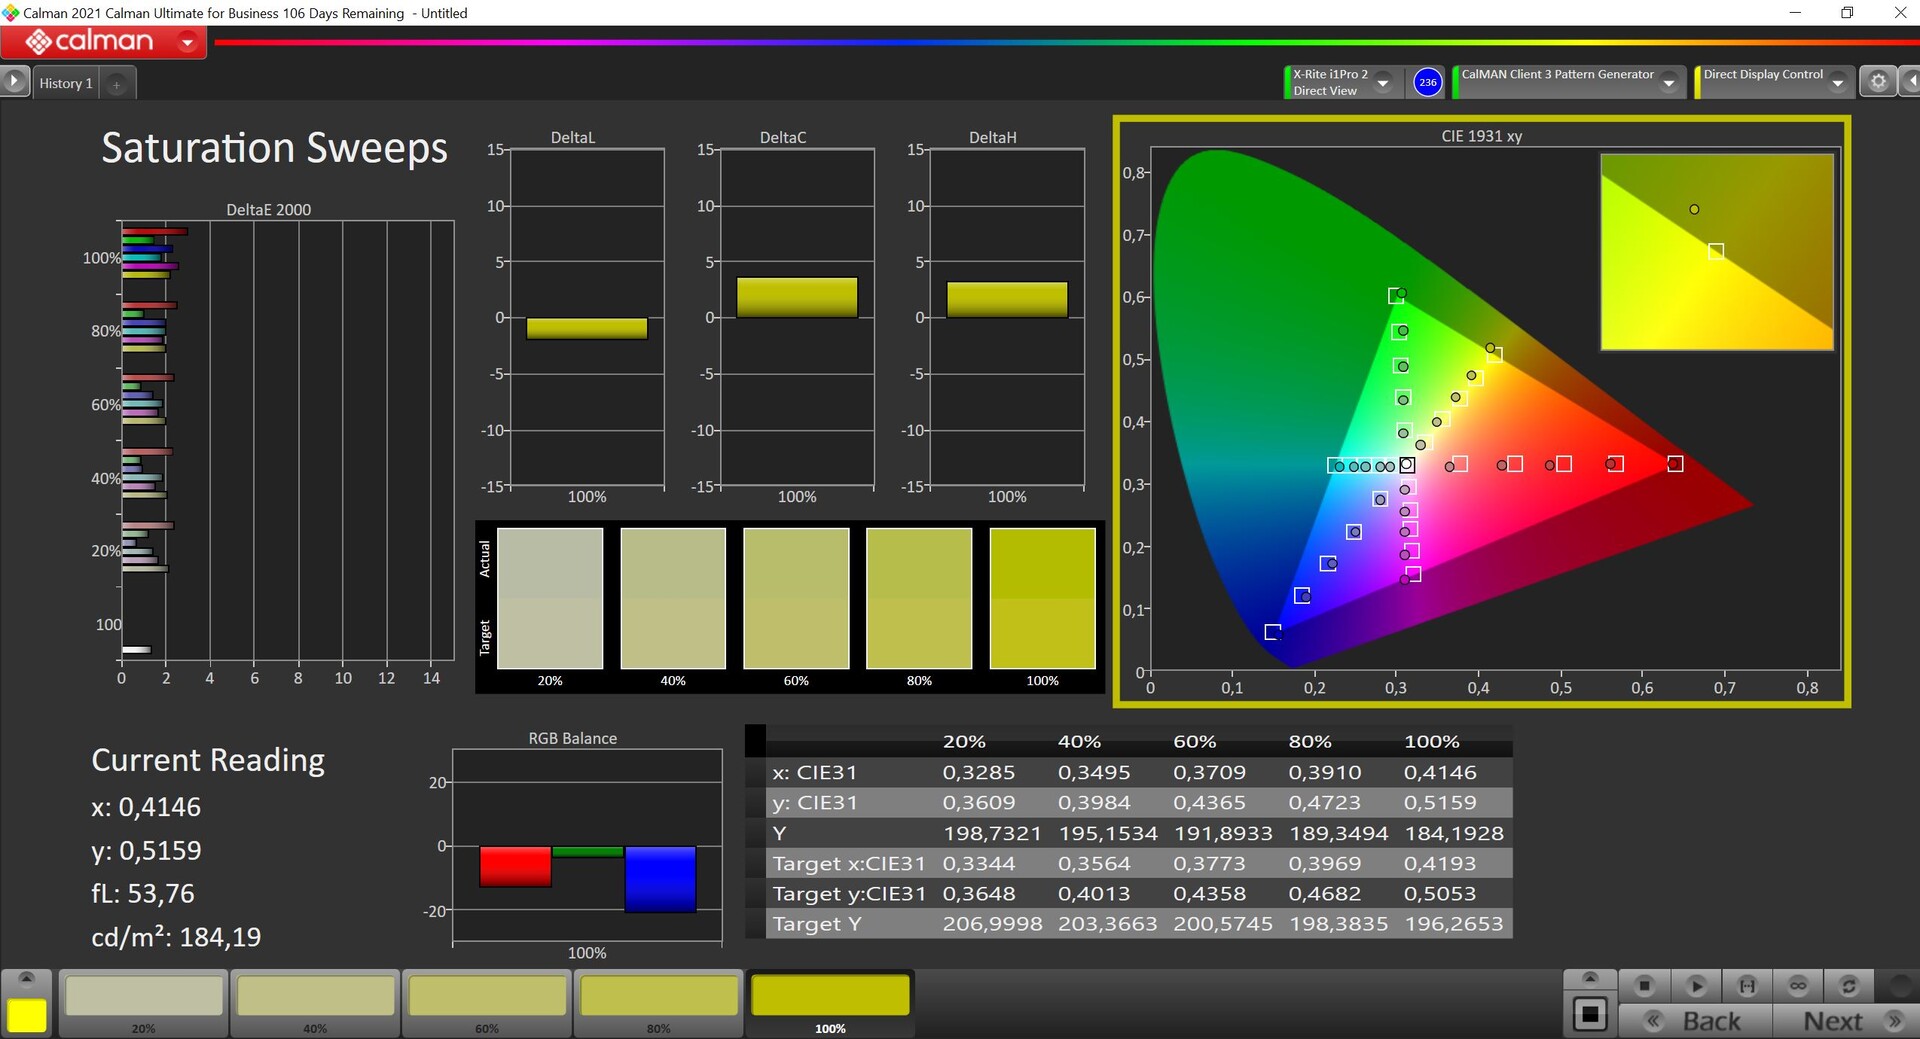
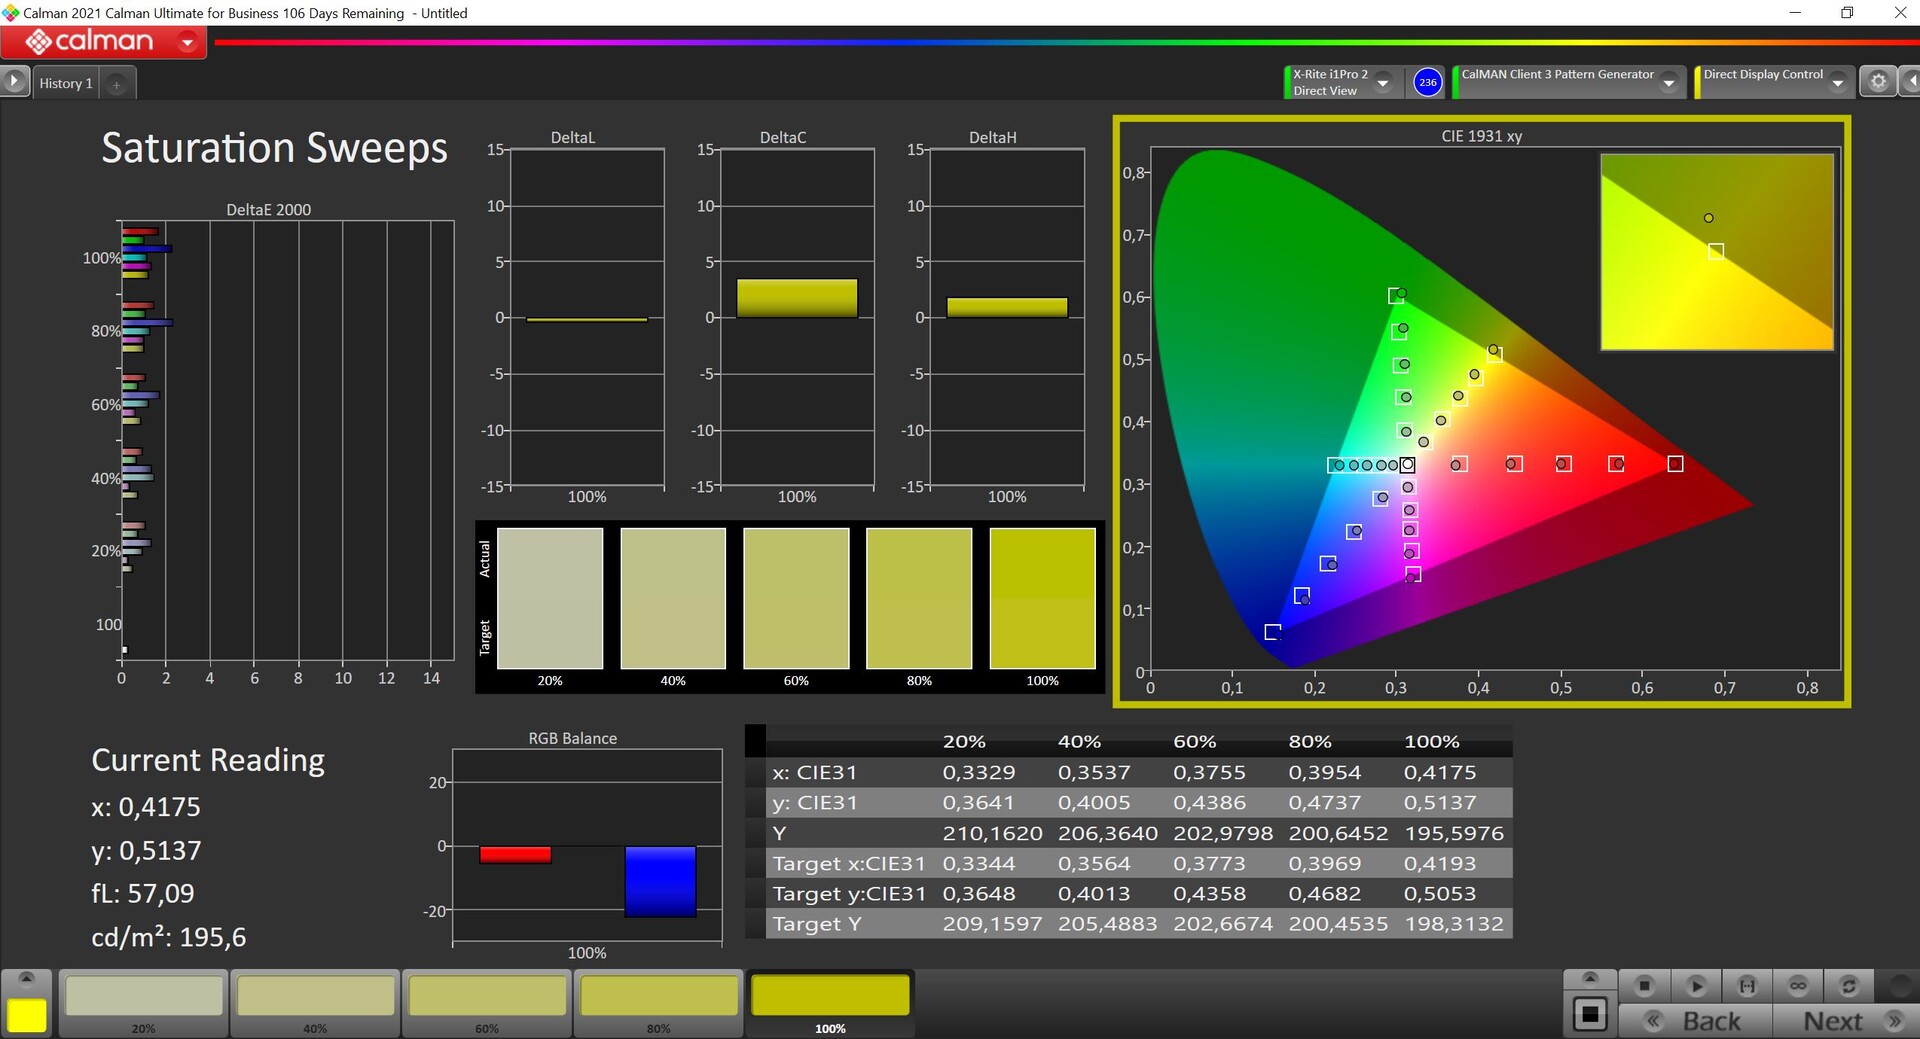
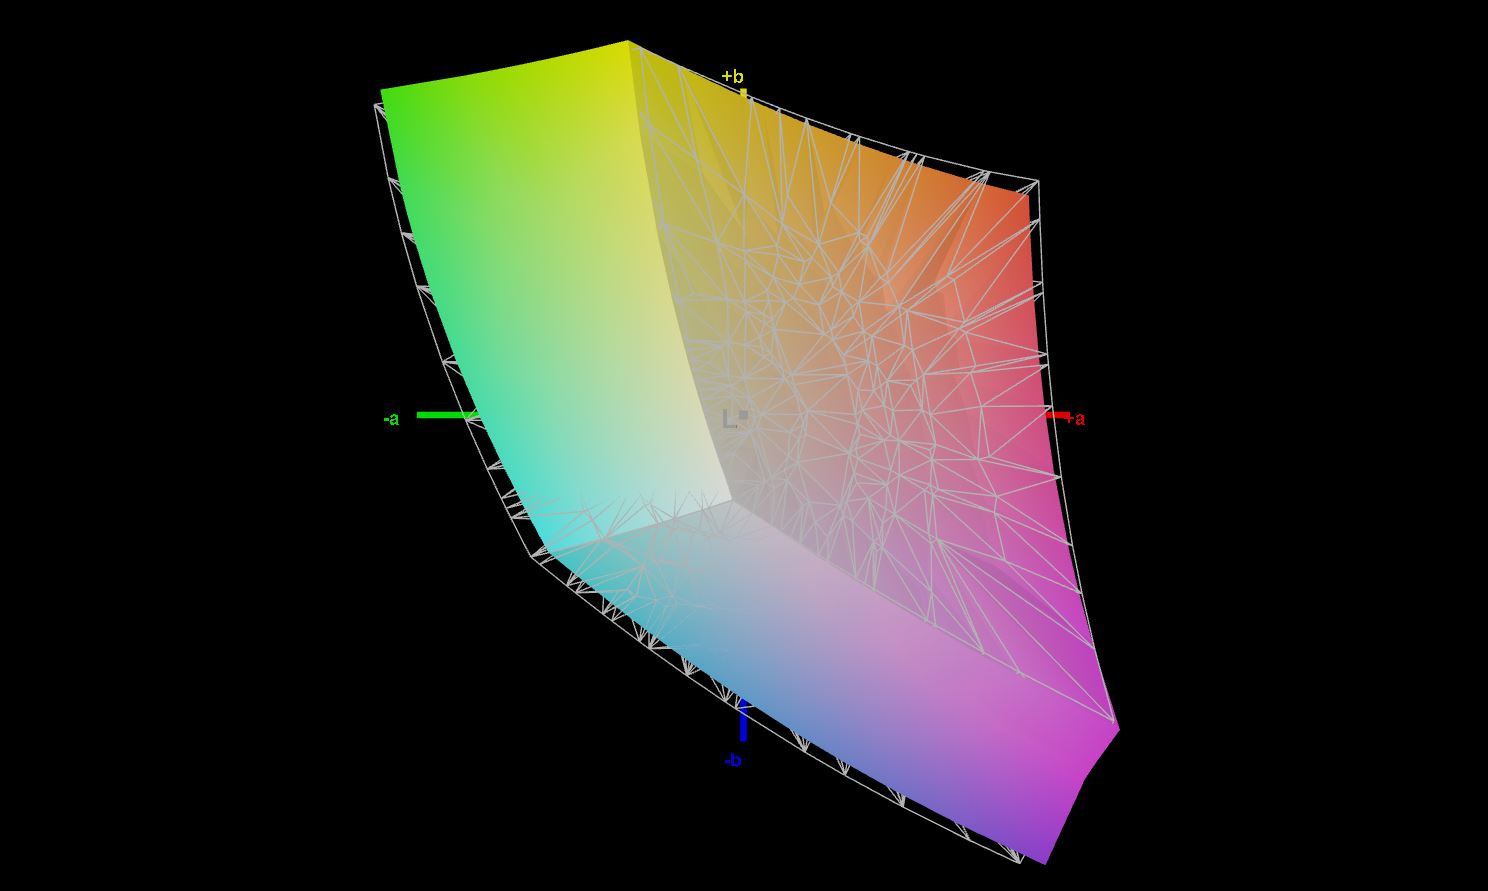
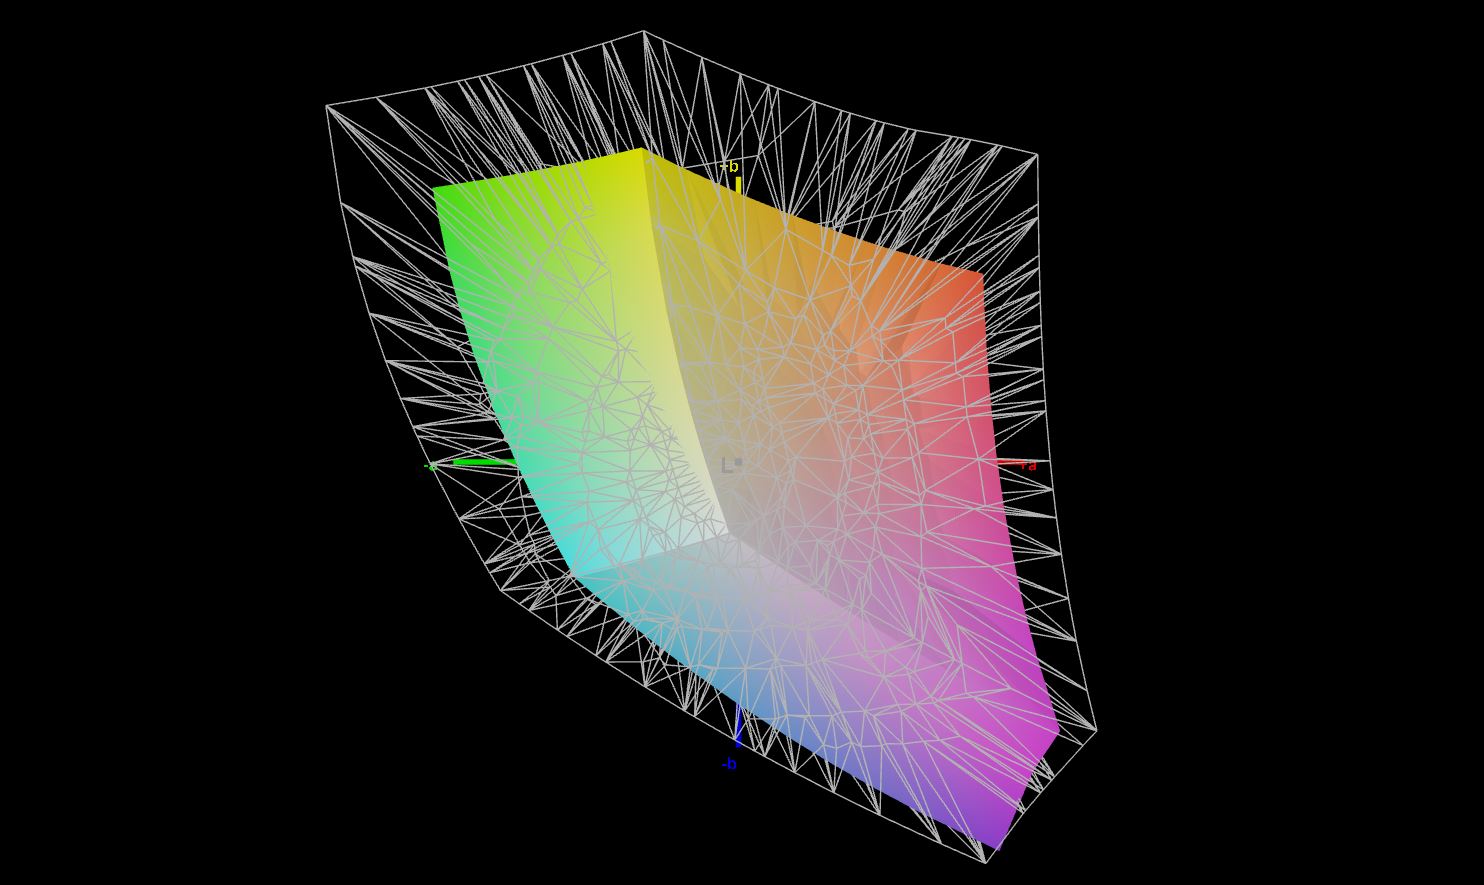
65% AdobeRGB 1998 (Argyll 3D)
93.8% sRGB (Argyll 3D)
63.6% Display P3 (Argyll 3D)
Gamma: 2.29
CCT: 6662 K
| Microsoft Surface Laptop Go 2 Core i5 LP125WX112403, IPS, 1536x1024, 12.4" | Dell XPS 13 9305 Core i5 FHD Sharp SHP14AE, IPS, 1920x1080, 13.3" | Apple MacBook Air 2020 M1 Entry IPS, 2560x1600, 13.3" | VAIO SX12 VJS124X1011P Chi Mei N125HCG-GQ1, IPS, 1920x1080, 12.5" | Microsoft Surface Laptop Go Core i5 LG Philips LP125WX112403, IPS, 1536x1024, 12.4" | |
|---|---|---|---|---|---|
| Display | 4% | 31% | 6% | 1% | |
| Display P3 Coverage (%) | 63.6 | 66.3 4% | 98.6 55% | 67.6 6% | 64.4 1% |
| sRGB Coverage (%) | 93.8 | 97.1 4% | 100 7% | 99.2 6% | 94.6 1% |
| AdobeRGB 1998 Coverage (%) | 65 | 67.1 3% | 85.9 32% | 69.4 7% | 65.7 1% |
| Response Times | -21% | 12% | -55% | 1% | |
| Response Time Grey 50% / Grey 80% * (ms) | 39 ? | 55 ? -41% | 31 ? 21% | 60 ? -54% | 34.8 ? 11% |
| Response Time Black / White * (ms) | 26.9 ? | 27 ? -0% | 26.1 ? 3% | 41.6 ? -55% | 29.2 ? -9% |
| PWM Frequency (Hz) | 9700 ? | 996 ? | 118000 ? | 21930 ? | |
| Screen | -12% | 7% | 23% | 5% | |
| Brightness middle (cd/m²) | 406 | 486 20% | 417 3% | 384.8 -5% | 354.3 -13% |
| Brightness (cd/m²) | 401 | 446 11% | 395 -1% | 361 -10% | 353 -12% |
| Brightness Distribution (%) | 95 | 77 -19% | 91 -4% | 90 -5% | 95 0% |
| Black Level * (cd/m²) | 0.41 | 0.4 2% | 0.39 5% | 0.18 56% | 0.29 29% |
| Contrast (:1) | 990 | 1215 23% | 1069 8% | 2138 116% | 1222 23% |
| Colorchecker dE 2000 * | 1.8 | 2.54 -41% | 1.12 38% | 1.54 14% | 1.41 22% |
| Colorchecker dE 2000 max. * | 3.3 | 4.34 -32% | 2.71 18% | 2.95 11% | 2.96 10% |
| Colorchecker dE 2000 calibrated * | 1.3 | 1.04 20% | 0.77 41% | 0.96 26% | 1.44 -11% |
| Greyscale dE 2000 * | 1.2 | 2.34 -95% | 1.7 -42% | 1.2 -0% | 1.2 -0% |
| Gamma | 2.29 96% | 2.28 96% | 2207 0% | 2.1 105% | 2.26 97% |
| CCT | 6662 98% | 6864 95% | 6870 95% | 6419 101% | 6600 98% |
| Color Space (Percent of AdobeRGB 1998) (%) | 62 | 60.2 | |||
| Color Space (Percent of sRGB) (%) | 97 | 94.4 | |||
| Total Average (Program / Settings) | -10% /
-10% | 17% /
13% | -9% /
8% | 2% /
4% |
* ... smaller is better
The color accuracy is already very good in the state of delivery, and the display also has no color tint. With our own calibration (profile available for your free download from the link above), the deviations can even be lowered slightly further, although this isn't really necessary. Unfortunately, the panel doesn't cover even the small sRGB color space completely.


Display Response Times
| ↔ Response Time Black to White | ||
|---|---|---|
| 26.9 ms ... rise ↗ and fall ↘ combined | ↗ 16 ms rise |  |
| ↘ 10.9 ms fall | ||
| The screen shows relatively slow response rates in our tests and may be too slow for gamers. In comparison, all tested devices range from 0.1 (minimum) to 240 (maximum) ms. » 67 % of all devices are better. This means that the measured response time is worse than the average of all tested devices (20.1 ms). | ||
| ↔ Response Time 50% Grey to 80% Grey | ||
| 39 ms ... rise ↗ and fall ↘ combined | ↗ 20.9 ms rise |  |
| ↘ 18.1 ms fall | ||
| The screen shows slow response rates in our tests and will be unsatisfactory for gamers. In comparison, all tested devices range from 0.165 (minimum) to 636 (maximum) ms. » 58 % of all devices are better. This means that the measured response time is worse than the average of all tested devices (31.4 ms). | ||
Screen Flickering / PWM (Pulse-Width Modulation)
| Screen flickering / PWM detected | 9700 Hz | ≤ 50 % brightness setting |  |
The display backlight flickers at 9700 Hz (worst case, e.g., utilizing PWM) Flickering detected at a brightness setting of 50 % and below. There should be no flickering or PWM above this brightness setting. The frequency of 9700 Hz is quite high, so most users sensitive to PWM should not notice any flickering. In comparison: 53 % of all tested devices do not use PWM to dim the display. If PWM was detected, an average of 7979 (minimum: 5 - maximum: 343500) Hz was measured. | |||


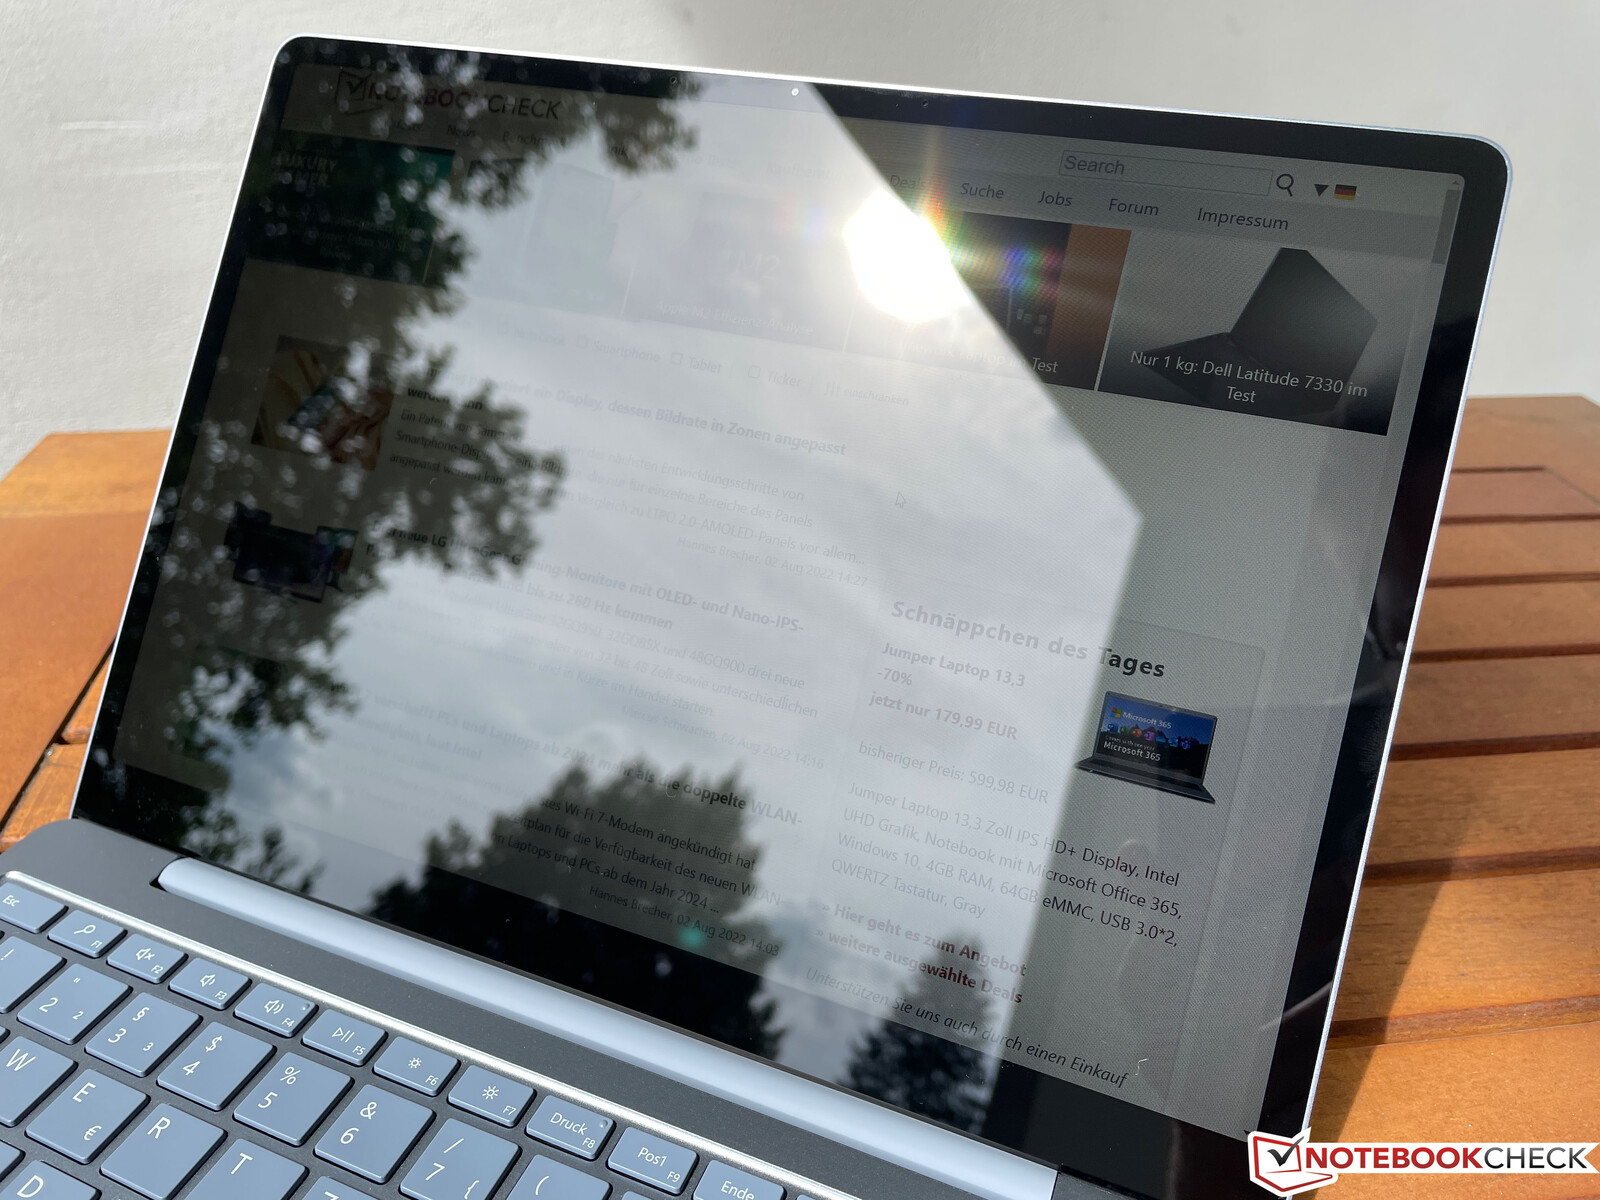
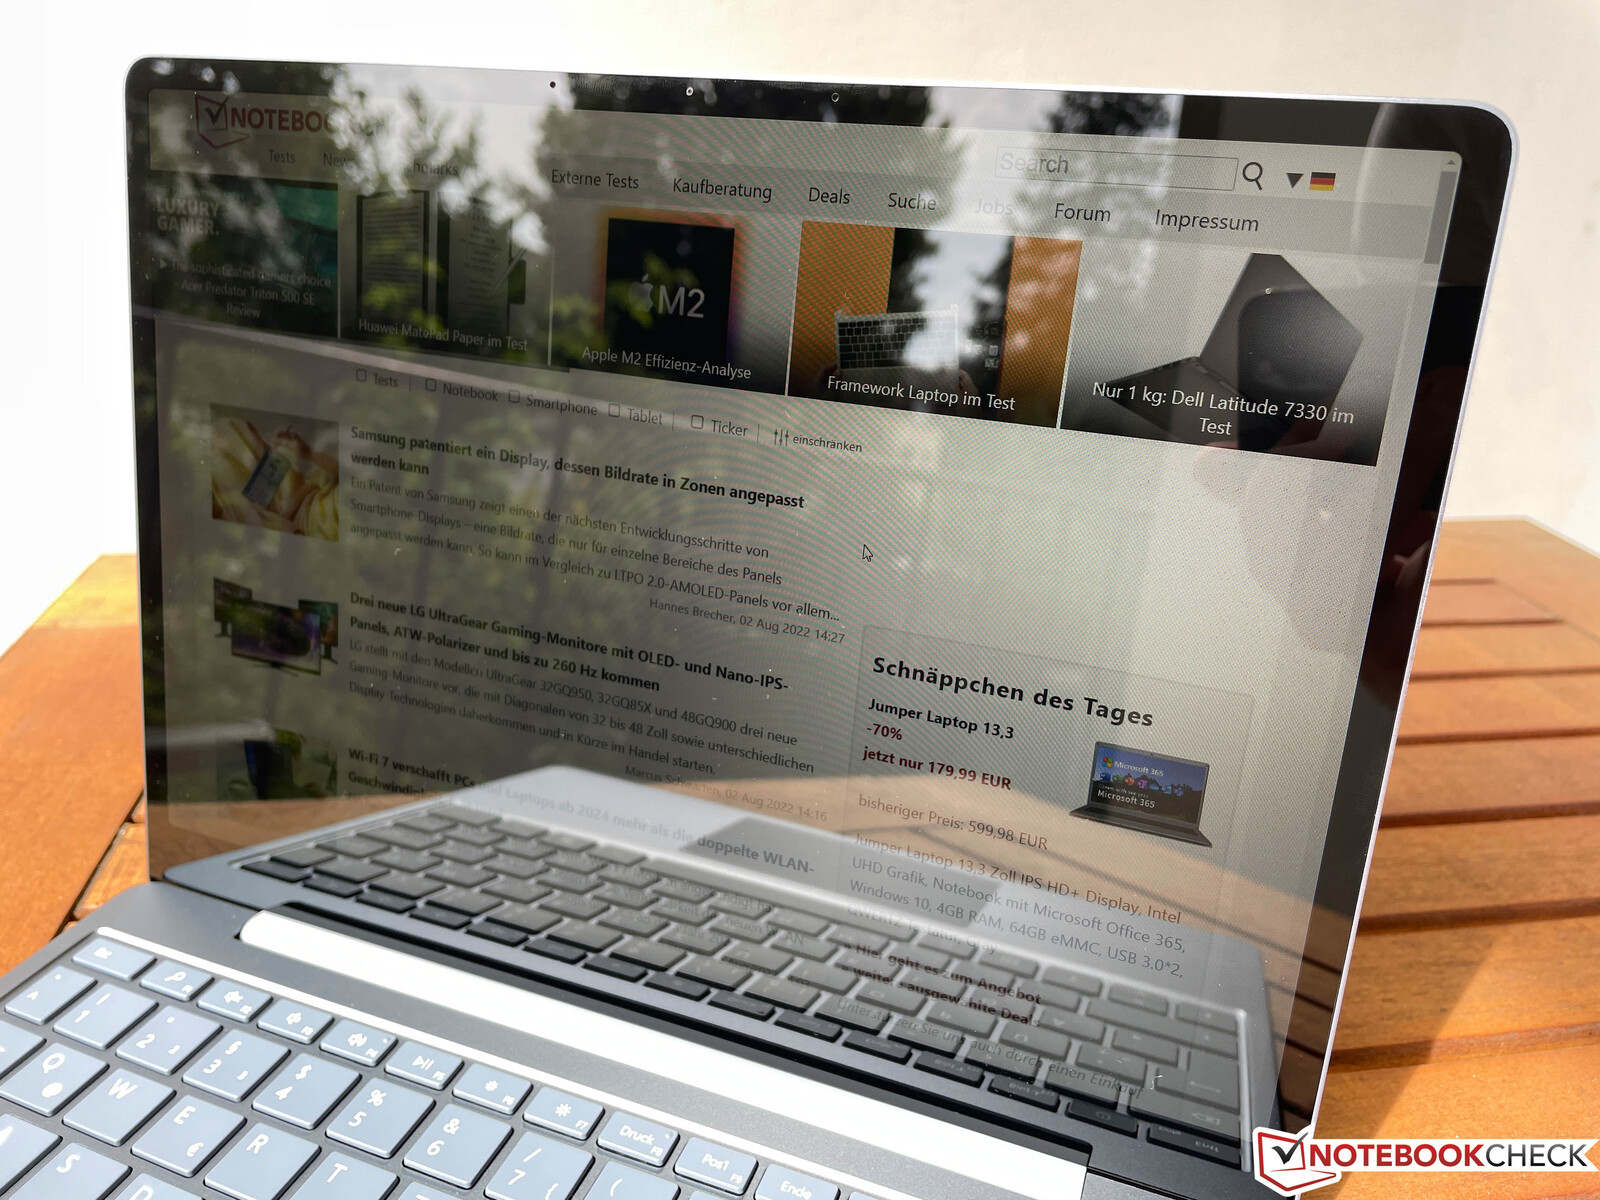
Outdoors, you will always struggle with the reflections from the touchscreen, and you should try to avoid having direct light sources behind you.

Performance - Intel Tiger Lake Core i5
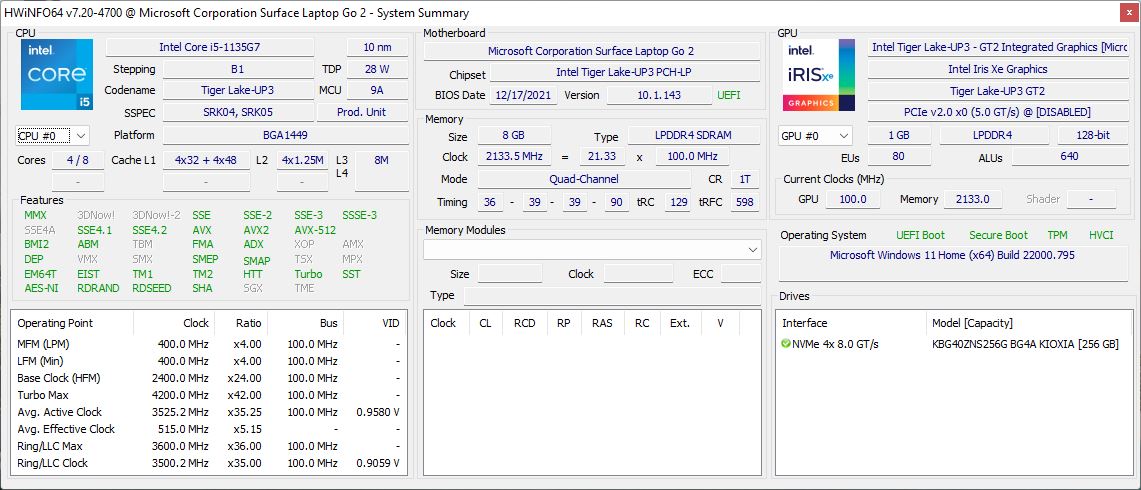
All models of the Surface Laptop Go 2 are equipped with the Intel Core i5-1135G7. The only differences are in the working memory and SSD capacity. Considering usability in future years, we wouldn't recommend the basic model with only 4 GB of RAM. The working memory is soldered in and cannot be upgraded.


Test Conditions
Microsoft does not implement any additional performance profiles. For the following benchmarks and measurements, we used the Best Performance Windows mode. However, particularly for simple tasks, you can also keep the Recommended preset without any concerns, since the performance is at a fairly low level overall and the fans will then remain slightly more quiet (but more on this later).
Processor - Core i5-1135G7
The Core i5-1135G7 is a quad-core chip from Intel's old Tiger Lake generation, so it isn't really current anymore. In addition, Microsoft is fairly conservative in terms of the TDP limits, since the chip is allowed to consume a maximum of 25 watts, before it quickly levels out at 15 watts. Correspondingly, the processor performance isn't particularly good either. Although there is an advantage of about 30% compared to the processor, the Surface Laptop Go 2 is still not suited for demanding tasks. But at least, the performance isn't further reduced in battery operation. For additional CPU benchmarks, we refer you to our technology section.
Cinebench R15 Multi Constant Load Test
Cinebench R23: Multi Core | Single Core
Cinebench R20: CPU (Multi Core) | CPU (Single Core)
Cinebench R15: CPU Multi 64Bit | CPU Single 64Bit
Blender: v2.79 BMW27 CPU
7-Zip 18.03: 7z b 4 | 7z b 4 -mmt1
Geekbench 5.5: Multi-Core | Single-Core
HWBOT x265 Benchmark v2.2: 4k Preset
LibreOffice : 20 Documents To PDF
R Benchmark 2.5: Overall mean
| CPU Performance rating | |
| Average of class Subnotebook | |
| Apple MacBook Air 2020 M1 Entry -1! | |
| VAIO SX12 VJS124X1011P | |
| Average Intel Core i5-1135G7 | |
| Dell XPS 13 9305 Core i5 FHD -2! | |
| Microsoft Surface Laptop Go 2 Core i5 | |
| Microsoft Surface Laptop Go Core i5 -2! | |
| Cinebench R23 / Multi Core | |
| Average of class Subnotebook (1555 - 21812, n=64, last 2 years) | |
| Apple MacBook Air 2020 M1 Entry | |
| VAIO SX12 VJS124X1011P | |
| Dell XPS 13 9305 Core i5 FHD | |
| Average Intel Core i5-1135G7 (2786 - 6136, n=55) | |
| Microsoft Surface Laptop Go 2 Core i5 | |
| Cinebench R23 / Single Core | |
| Average of class Subnotebook (358 - 2165, n=65, last 2 years) | |
| Apple MacBook Air 2020 M1 Entry | |
| VAIO SX12 VJS124X1011P | |
| Average Intel Core i5-1135G7 (1062 - 1373, n=53) | |
| Microsoft Surface Laptop Go 2 Core i5 | |
| Dell XPS 13 9305 Core i5 FHD | |
| Cinebench R20 / CPU (Multi Core) | |
| Average of class Subnotebook (579 - 8541, n=61, last 2 years) | |
| VAIO SX12 VJS124X1011P | |
| Apple MacBook Air 2020 M1 Entry | |
| Dell XPS 13 9305 Core i5 FHD | |
| Average Intel Core i5-1135G7 (979 - 2382, n=62) | |
| Microsoft Surface Laptop Go 2 Core i5 | |
| Microsoft Surface Laptop Go Core i5 | |
| Cinebench R20 / CPU (Single Core) | |
| Average of class Subnotebook (128 - 826, n=61, last 2 years) | |
| VAIO SX12 VJS124X1011P | |
| Average Intel Core i5-1135G7 (375 - 527, n=62) | |
| Microsoft Surface Laptop Go 2 Core i5 | |
| Dell XPS 13 9305 Core i5 FHD | |
| Microsoft Surface Laptop Go Core i5 | |
| Apple MacBook Air 2020 M1 Entry | |
| Cinebench R15 / CPU Multi 64Bit | |
| Average of class Subnotebook (327 - 3345, n=61, last 2 years) | |
| Apple MacBook Air 2020 M1 Entry | |
| VAIO SX12 VJS124X1011P | |
| Average Intel Core i5-1135G7 (431 - 941, n=65) | |
| Dell XPS 13 9305 Core i5 FHD | |
| Microsoft Surface Laptop Go 2 Core i5 | |
| Microsoft Surface Laptop Go Core i5 | |
| Cinebench R15 / CPU Single 64Bit | |
| Average of class Subnotebook (72.4 - 322, n=61, last 2 years) | |
| VAIO SX12 VJS124X1011P | |
| Apple MacBook Air 2020 M1 Entry | |
| Average Intel Core i5-1135G7 (141.4 - 205, n=61) | |
| Microsoft Surface Laptop Go 2 Core i5 | |
| Microsoft Surface Laptop Go Core i5 | |
| Blender / v2.79 BMW27 CPU | |
| Microsoft Surface Laptop Go Core i5 | |
| Microsoft Surface Laptop Go 2 Core i5 | |
| Apple MacBook Air 2020 M1 Entry | |
| Average Intel Core i5-1135G7 (499 - 1044, n=60) | |
| Dell XPS 13 9305 Core i5 FHD | |
| VAIO SX12 VJS124X1011P | |
| Average of class Subnotebook (159 - 2271, n=62, last 2 years) | |
| 7-Zip 18.03 / 7z b 4 | |
| Average of class Subnotebook (11668 - 77867, n=62, last 2 years) | |
| Apple MacBook Air 2020 M1 Entry | |
| VAIO SX12 VJS124X1011P | |
| Dell XPS 13 9305 Core i5 FHD | |
| Average Intel Core i5-1135G7 (14745 - 24873, n=62) | |
| Microsoft Surface Laptop Go 2 Core i5 | |
| Microsoft Surface Laptop Go Core i5 | |
| 7-Zip 18.03 / 7z b 4 -mmt1 | |
| Average of class Subnotebook (2643 - 6442, n=63, last 2 years) | |
| Apple MacBook Air 2020 M1 Entry | |
| VAIO SX12 VJS124X1011P | |
| Average Intel Core i5-1135G7 (3924 - 4921, n=62) | |
| Microsoft Surface Laptop Go 2 Core i5 | |
| Dell XPS 13 9305 Core i5 FHD | |
| Microsoft Surface Laptop Go Core i5 | |
| Geekbench 5.5 / Multi-Core | |
| Average of class Subnotebook (2557 - 17218, n=54, last 2 years) | |
| Apple MacBook Air 2020 M1 Entry | |
| VAIO SX12 VJS124X1011P | |
| Dell XPS 13 9305 Core i5 FHD | |
| Average Intel Core i5-1135G7 (3475 - 5472, n=58) | |
| Microsoft Surface Laptop Go 2 Core i5 | |
| Microsoft Surface Laptop Go Core i5 | |
| Geekbench 5.5 / Single-Core | |
| Average of class Subnotebook (726 - 2132, n=54, last 2 years) | |
| Apple MacBook Air 2020 M1 Entry | |
| VAIO SX12 VJS124X1011P | |
| Average Intel Core i5-1135G7 (1147 - 1428, n=58) | |
| Dell XPS 13 9305 Core i5 FHD | |
| Microsoft Surface Laptop Go 2 Core i5 | |
| Microsoft Surface Laptop Go Core i5 | |
| HWBOT x265 Benchmark v2.2 / 4k Preset | |
| Average of class Subnotebook (0.97 - 25.1, n=61, last 2 years) | |
| VAIO SX12 VJS124X1011P | |
| Average Intel Core i5-1135G7 (3.57 - 7.6, n=57) | |
| Microsoft Surface Laptop Go 2 Core i5 | |
| Microsoft Surface Laptop Go Core i5 | |
| LibreOffice / 20 Documents To PDF | |
| Microsoft Surface Laptop Go Core i5 | |
| Dell XPS 13 9305 Core i5 FHD | |
| Microsoft Surface Laptop Go 2 Core i5 | |
| Average of class Subnotebook (38.5 - 220, n=60, last 2 years) | |
| Average Intel Core i5-1135G7 (44.2 - 62.9, n=60) | |
| VAIO SX12 VJS124X1011P | |
| Apple MacBook Air 2020 M1 Entry | |
| R Benchmark 2.5 / Overall mean | |
| Microsoft Surface Laptop Go Core i5 | |
| Apple MacBook Air 2020 M1 Entry | |
| Microsoft Surface Laptop Go 2 Core i5 | |
| Dell XPS 13 9305 Core i5 FHD | |
| Average Intel Core i5-1135G7 (0.619 - 0.727, n=59) | |
| VAIO SX12 VJS124X1011P | |
| Average of class Subnotebook (0.403 - 1.456, n=62, last 2 years) | |
* ... smaller is better
AIDA64: FP32 Ray-Trace | FPU Julia | CPU SHA3 | CPU Queen | FPU SinJulia | FPU Mandel | CPU AES | CPU ZLib | FP64 Ray-Trace | CPU PhotoWorxx
| Performance rating | |
| Average of class Subnotebook | |
| VAIO SX12 VJS124X1011P | |
| Average Intel Core i5-1135G7 | |
| Microsoft Surface Laptop Go 2 Core i5 | |
| AIDA64 / FP32 Ray-Trace | |
| Average of class Subnotebook (1135 - 32888, n=62, last 2 years) | |
| VAIO SX12 VJS124X1011P | |
| Average Intel Core i5-1135G7 (4313 - 7952, n=45) | |
| Microsoft Surface Laptop Go 2 Core i5 | |
| AIDA64 / FPU Julia | |
| Average of class Subnotebook (5218 - 123315, n=62, last 2 years) | |
| VAIO SX12 VJS124X1011P | |
| Average Intel Core i5-1135G7 (19402 - 32283, n=45) | |
| Microsoft Surface Laptop Go 2 Core i5 | |
| AIDA64 / CPU SHA3 | |
| Average of class Subnotebook (444 - 5287, n=62, last 2 years) | |
| VAIO SX12 VJS124X1011P | |
| Average Intel Core i5-1135G7 (1316 - 2172, n=45) | |
| Microsoft Surface Laptop Go 2 Core i5 | |
| AIDA64 / CPU Queen | |
| Average of class Subnotebook (10579 - 115682, n=61, last 2 years) | |
| VAIO SX12 VJS124X1011P | |
| Average Intel Core i5-1135G7 (39000 - 46951, n=45) | |
| Microsoft Surface Laptop Go 2 Core i5 | |
| AIDA64 / FPU SinJulia | |
| Average of class Subnotebook (744 - 18418, n=62, last 2 years) | |
| VAIO SX12 VJS124X1011P | |
| Average Intel Core i5-1135G7 (3497 - 4445, n=45) | |
| Microsoft Surface Laptop Go 2 Core i5 | |
| AIDA64 / FPU Mandel | |
| Average of class Subnotebook (3341 - 65433, n=62, last 2 years) | |
| VAIO SX12 VJS124X1011P | |
| Average Intel Core i5-1135G7 (12569 - 19635, n=45) | |
| Microsoft Surface Laptop Go 2 Core i5 | |
| AIDA64 / CPU AES | |
| VAIO SX12 VJS124X1011P | |
| Average Intel Core i5-1135G7 (28988 - 67977, n=45) | |
| Average of class Subnotebook (638 - 124284, n=62, last 2 years) | |
| Microsoft Surface Laptop Go 2 Core i5 | |
| AIDA64 / CPU ZLib | |
| Average of class Subnotebook (164.9 - 1379, n=62, last 2 years) | |
| VAIO SX12 VJS124X1011P | |
| Average Intel Core i5-1135G7 (265 - 373, n=51) | |
| Microsoft Surface Laptop Go 2 Core i5 | |
| AIDA64 / FP64 Ray-Trace | |
| Average of class Subnotebook (610 - 17495, n=62, last 2 years) | |
| VAIO SX12 VJS124X1011P | |
| Average Intel Core i5-1135G7 (2226 - 4291, n=45) | |
| Microsoft Surface Laptop Go 2 Core i5 | |
| AIDA64 / CPU PhotoWorxx | |
| Average of class Subnotebook (6569 - 64588, n=62, last 2 years) | |
| VAIO SX12 VJS124X1011P | |
| Microsoft Surface Laptop Go 2 Core i5 | |
| Average Intel Core i5-1135G7 (9004 - 45366, n=45) | |
System Performance
In practice, the impression of the performance is decent, and thanks to the SSD, there are no problems with longer load times or stutters in everyday operation. However, our test unit is usually surpassed by the competitors in the benchmarks. But for regular tasks such as text input, surfing the Internet, and streaming videos, the performance is easily sufficient.
CrossMark: Overall | Productivity | Creativity | Responsiveness
| PCMark 10 / Score | |
| Average of class Subnotebook (4920 - 8424, n=49, last 2 years) | |
| VAIO SX12 VJS124X1011P | |
| Dell XPS 13 9305 Core i5 FHD | |
| Average Intel Core i5-1135G7, Intel Iris Xe Graphics G7 80EUs (4026 - 4952, n=53) | |
| Microsoft Surface Laptop Go 2 Core i5 | |
| Microsoft Surface Laptop Go Core i5 | |
| PCMark 10 / Essentials | |
| Average of class Subnotebook (8552 - 11406, n=49, last 2 years) | |
| VAIO SX12 VJS124X1011P | |
| Dell XPS 13 9305 Core i5 FHD | |
| Average Intel Core i5-1135G7, Intel Iris Xe Graphics G7 80EUs (8149 - 9917, n=53) | |
| Microsoft Surface Laptop Go 2 Core i5 | |
| Microsoft Surface Laptop Go Core i5 | |
| PCMark 10 / Productivity | |
| Average of class Subnotebook (5435 - 16132, n=49, last 2 years) | |
| VAIO SX12 VJS124X1011P | |
| Dell XPS 13 9305 Core i5 FHD | |
| Average Intel Core i5-1135G7, Intel Iris Xe Graphics G7 80EUs (5040 - 6619, n=53) | |
| Microsoft Surface Laptop Go 2 Core i5 | |
| Microsoft Surface Laptop Go Core i5 | |
| PCMark 10 / Digital Content Creation | |
| Average of class Subnotebook (5722 - 12442, n=49, last 2 years) | |
| VAIO SX12 VJS124X1011P | |
| Dell XPS 13 9305 Core i5 FHD | |
| Average Intel Core i5-1135G7, Intel Iris Xe Graphics G7 80EUs (3548 - 5255, n=53) | |
| Microsoft Surface Laptop Go 2 Core i5 | |
| Microsoft Surface Laptop Go Core i5 | |
| CrossMark / Overall | |
| Average of class Subnotebook (365 - 2356, n=64, last 2 years) | |
| Apple MacBook Air 2020 M1 Entry | |
| Average Intel Core i5-1135G7, Intel Iris Xe Graphics G7 80EUs (1058 - 1293, n=11) | |
| Microsoft Surface Laptop Go 2 Core i5 | |
| CrossMark / Productivity | |
| Average of class Subnotebook (364 - 2277, n=64, last 2 years) | |
| Apple MacBook Air 2020 M1 Entry | |
| Average Intel Core i5-1135G7, Intel Iris Xe Graphics G7 80EUs (1148 - 1332, n=11) | |
| Microsoft Surface Laptop Go 2 Core i5 | |
| CrossMark / Creativity | |
| Average of class Subnotebook (372 - 2743, n=64, last 2 years) | |
| Apple MacBook Air 2020 M1 Entry | |
| Microsoft Surface Laptop Go 2 Core i5 | |
| Average Intel Core i5-1135G7, Intel Iris Xe Graphics G7 80EUs (895 - 1263, n=11) | |
| CrossMark / Responsiveness | |
| Average of class Subnotebook (312 - 1889, n=64, last 2 years) | |
| Average Intel Core i5-1135G7, Intel Iris Xe Graphics G7 80EUs (923 - 1320, n=11) | |
| Microsoft Surface Laptop Go 2 Core i5 | |
| Apple MacBook Air 2020 M1 Entry | |
| PCMark 10 Score | 4384 points | |
Help | ||
| AIDA64 / Memory Copy | |
| Average of class Subnotebook (14554 - 109734, n=62, last 2 years) | |
| VAIO SX12 VJS124X1011P | |
| Microsoft Surface Laptop Go 2 Core i5 | |
| Average Intel Core i5-1135G7 (17443 - 63889, n=45) | |
| AIDA64 / Memory Read | |
| Average of class Subnotebook (15948 - 127174, n=62, last 2 years) | |
| VAIO SX12 VJS124X1011P | |
| Microsoft Surface Laptop Go 2 Core i5 | |
| Average Intel Core i5-1135G7 (19716 - 63705, n=45) | |
| AIDA64 / Memory Write | |
| Average of class Subnotebook (15709 - 117898, n=62, last 2 years) | |
| VAIO SX12 VJS124X1011P | |
| Microsoft Surface Laptop Go 2 Core i5 | |
| Average Intel Core i5-1135G7 (18722 - 66778, n=45) | |
| AIDA64 / Memory Latency | |
| Average of class Subnotebook (6.8 - 187.8, n=61, last 2 years) | |
| Microsoft Surface Laptop Go 2 Core i5 | |
| VAIO SX12 VJS124X1011P | |
| Average Intel Core i5-1135G7 (68.3 - 107, n=51) | |
* ... smaller is better
DPC Latencies
In our standardized latency test (surfing the Internet, playing YouTube 4K videos, CPU load), our test unit with its current BIOS version shows some slight limitations and is therefore not optimally suited for using real-time audio applications.
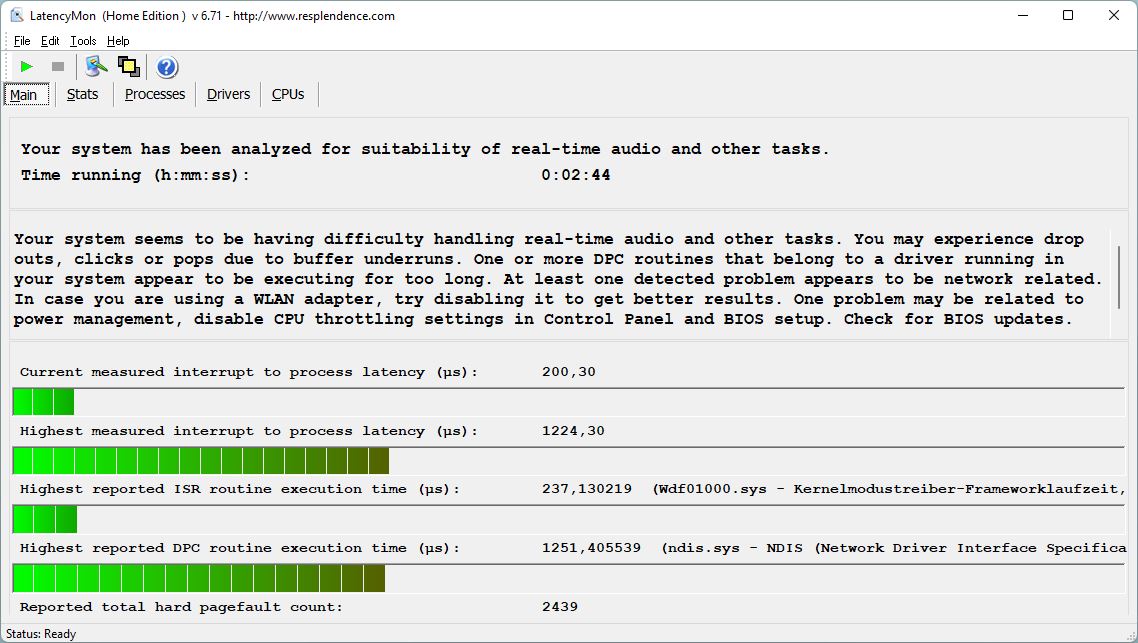

| DPC Latencies / LatencyMon - interrupt to process latency (max), Web, Youtube, Prime95 | |
| Microsoft Surface Laptop Go 2 Core i5 | |
| VAIO SX12 VJS124X1011P | |
| Microsoft Surface Laptop Go Core i5 | |
| Dell XPS 13 9305 Core i5 FHD | |
* ... smaller is better
Storage Solution
Microsoft uses a PCIe 3.0 x4 SSD from Toshiba with a storage capacity of 256 GB, of which only 198 GB are still available to the user after starting it for the first time. The transfer rates are sufficient. However, the user cannot replace the SSD, since the case cannot be opened. You can find additional SSD benchmarks here.

* ... smaller is better
Constant Performance Reading: DiskSpd Read Loop, Queue Depth 8
Graphics Card

The integrated graphics card is the well-known Iris Xe Graphics G7 with 80 EUs, which also continues to be used in the current Alder Lake processors. As long as you don't have any exaggerated expectations on the gaming performance, the iGPU also strikes a very good figure in everyday operation. It can even handle playing high-resolution videos without any problems, but due to the low display resolution, even 1080p videos cannot be played in their native resolution.
But if you still want to play some games, we recommend older titles, which will then also run acceptably in low resolutions and at lowered detail settings (for example, DOTA 2). In addition, the GPU will also remain stable, since the Surface Laptop Go 2 even passes the demanding Time Spy stress test at 99.7% without any trouble. There are also no performance limitations in battery operation. You can find additional GPU benchmarks in our technology section.
| 3DMark 11 Performance | 4589 points | |
| 3DMark Cloud Gate Standard Score | 15140 points | |
| 3DMark Fire Strike Score | 3226 points | |
| 3DMark Time Spy Score | 1131 points | |
Help | ||
| low | med. | high | ultra | |
|---|---|---|---|---|
| The Witcher 3 (2015) | 43 | 35 | ||
| Dota 2 Reborn (2015) | 77.1 | 70.4 | 41.1 | 36.1 |
| Final Fantasy XV Benchmark (2018) | 30.7 | 14 | 8.19 | |
| X-Plane 11.11 (2018) | 19.5 | 25.4 | 26.4 |
Emissions and Power Management
Noise Emissions
In everyday operation, the fan often remains very quiet, only turning on occasionally. However, under heavier load, the fan is definitely noticeable with its fairly high-frequency noise and its level of almost 42 dB(A) in the extreme case. Considering the low performance level, we find this noise level also too loud overall. Here, you should stick with the Recommended power mode, since we are then only able to measure a maximum noise level of almost 37 dB(A) even during the stress test. We do not notice any other electronic noises (such as coil whine) during our test.
Noise level
| Idle |
| 24.3 / 24.3 / 24.3 dB(A) |
| Load |
| 33.1 / 41.8 dB(A) |
 | ||
30 dB silent 40 dB(A) audible 50 dB(A) loud |
||
min: | ||
| Microsoft Surface Laptop Go 2 Core i5 Iris Xe G7 80EUs, i5-1135G7, Toshiba KBG40ZNS256G NVMe | Dell XPS 13 9305 Core i5 FHD Iris Xe G7 80EUs, i5-1135G7, Samsung PM9A1 MZVL2512HCJQ | VAIO SX12 VJS124X1011P Iris Xe G7 80EUs, i5-1155G7, Samsung PM9A1 MZVL2512HCJQ | Microsoft Surface Laptop Go Core i5 UHD Graphics G1 (Ice Lake 32 EU), i5-1035G1, SK hynix BC501 HFM256GDGTNG | |
|---|---|---|---|---|
| Noise | 0% | -24% | -9% | |
| off / environment * (dB) | 24.3 | 26 -7% | 23.2 5% | 26.4 -9% |
| Idle Minimum * (dB) | 24.3 | 26 -7% | 30.7 -26% | 26.4 -9% |
| Idle Average * (dB) | 24.3 | 26 -7% | 30.8 -27% | 26.4 -9% |
| Idle Maximum * (dB) | 24.3 | 26 -7% | 30.8 -27% | 26.4 -9% |
| Load Average * (dB) | 33.1 | 33.5 -1% | 48.3 -46% | 36.9 -11% |
| Witcher 3 ultra * (dB) | 36.7 | 33.5 9% | 46.4 -26% | |
| Load Maximum * (dB) | 41.8 | 33.5 20% | 50.3 -20% | 44.2 -6% |
* ... smaller is better
Temperatures
Already during idle operation, the compact Surface Laptop Go 2 gets slightly warmer than expected. But this does not lead to any limitations. This also goes for more demanding scenarios, where we measure a maximum of almost 47 °C (117 °F) at the bottom. However, since the hotspot is in the center of the device, you can still put the laptop on your lap even at that time.
During the stress test, the power consumption of the processor quickly levels out at 15 watts. After about one hour, even that value drops further to 14 watts. The strong variations of the GPU clock speed stand out at this time.

(±) The maximum temperature on the upper side is 41.4 °C / 107 F, compared to the average of 35.9 °C / 97 F, ranging from 21.4 to 59 °C for the class Subnotebook.
(-) The bottom heats up to a maximum of 46.7 °C / 116 F, compared to the average of 39.2 °C / 103 F
(+) In idle usage, the average temperature for the upper side is 27.4 °C / 81 F, compared to the device average of 30.8 °C / 87 F.
(+) The palmrests and touchpad are reaching skin temperature as a maximum (32.3 °C / 90.1 F) and are therefore not hot.
(-) The average temperature of the palmrest area of similar devices was 28.2 °C / 82.8 F (-4.1 °C / -7.3 F).


| Microsoft Surface Laptop Go 2 Core i5 Intel Core i5-1135G7, Intel Iris Xe Graphics G7 80EUs | Dell XPS 13 9305 Core i5 FHD Intel Core i5-1135G7, Intel Iris Xe Graphics G7 80EUs | Apple MacBook Air 2020 M1 Entry Apple M1, Apple M1 7-Core GPU | VAIO SX12 VJS124X1011P Intel Core i5-1155G7, Intel Iris Xe Graphics G7 80EUs | Microsoft Surface Laptop Go Core i5 Intel Core i5-1035G1, Intel UHD Graphics G1 (Ice Lake 32 EU) | |
|---|---|---|---|---|---|
| Heat | 6% | 5% | 17% | -6% | |
| Maximum Upper Side * (°C) | 41.4 | 43.5 -5% | 44 -6% | 30.4 27% | 42 -1% |
| Maximum Bottom * (°C) | 46.7 | 44.8 4% | 44 6% | 44.4 5% | 51 -9% |
| Idle Upper Side * (°C) | 28.5 | 26.2 8% | 27 5% | 21.8 24% | 30 -5% |
| Idle Bottom * (°C) | 31.5 | 26.4 16% | 27 14% | 28 11% | 34.6 -10% |
* ... smaller is better
Speakers
Subjectively, the speakers produce a decent sound, which lacks some sound pressure, though. However, the high frequencies are very balanced, which is beneficial for voice reproduction.
Microsoft Surface Laptop Go 2 Core i5 audio analysis
(±) | speaker loudness is average but good (77.5 dB)
Bass 100 - 315 Hz
(-) | nearly no bass - on average 15.6% lower than median
(±) | linearity of bass is average (8.9% delta to prev. frequency)
Mids 400 - 2000 Hz
(+) | balanced mids - only 4.9% away from median
(+) | mids are linear (4.2% delta to prev. frequency)
Highs 2 - 16 kHz
(+) | balanced highs - only 2.8% away from median
(+) | highs are linear (5.7% delta to prev. frequency)
Overall 100 - 16.000 Hz
(±) | linearity of overall sound is average (16.8% difference to median)
Compared to same class
» 43% of all tested devices in this class were better, 7% similar, 50% worse
» The best had a delta of 5%, average was 18%, worst was 53%
Compared to all devices tested
» 29% of all tested devices were better, 7% similar, 64% worse
» The best had a delta of 4%, average was 24%, worst was 134%
Apple MacBook Air 2020 M1 Entry audio analysis
(±) | speaker loudness is average but good (79.6 dB)
Bass 100 - 315 Hz
(±) | reduced bass - on average 7.1% lower than median
(±) | linearity of bass is average (9.5% delta to prev. frequency)
Mids 400 - 2000 Hz
(+) | balanced mids - only 2.2% away from median
(+) | mids are linear (5.3% delta to prev. frequency)
Highs 2 - 16 kHz
(+) | balanced highs - only 2.3% away from median
(+) | highs are linear (4% delta to prev. frequency)
Overall 100 - 16.000 Hz
(+) | overall sound is linear (8.7% difference to median)
Compared to same class
» 3% of all tested devices in this class were better, 1% similar, 96% worse
» The best had a delta of 5%, average was 18%, worst was 53%
Compared to all devices tested
» 2% of all tested devices were better, 1% similar, 97% worse
» The best had a delta of 4%, average was 24%, worst was 134%
Power Consumption
The power consumption during idle operation has increased slightly compared to the predecessor, which is due to the higher maximum brightness. Under load, we determine a maximum of around 40 watts, so the limits of the 39-Watt power supply are reached. However, since the consumption then drops continuously, the power supply is just barely large enough.
| Off / Standby | |
| Idle | |
| Load |
|
Key:
min: | |
Power Consumption The Witcher 3 / Stress Test
Power Consumption With External Monitor
Battery Life
In terms of the battery life, the new Surface Laptop Go 2 is surpassed by all the comparison devices and even its predecessor. In the WLAN test at 150 cd/m² of brightness, we determine a runtime of about 7.5 hours and at full brightness, of only 4.5 hours. Even though the battery capacity is fairly low at 41 Wh, the results are still a bit low considering the low display resolution.
| Microsoft Surface Laptop Go 2 Core i5 i5-1135G7, Iris Xe G7 80EUs, 41 Wh | Dell XPS 13 9305 Core i5 FHD i5-1135G7, Iris Xe G7 80EUs, 52 Wh | Apple MacBook Air 2020 M1 Entry M1, M1 7-Core GPU, 49.9 Wh | VAIO SX12 VJS124X1011P i5-1155G7, Iris Xe G7 80EUs, 53 Wh | Microsoft Surface Laptop Go Core i5 i5-1035G1, UHD Graphics G1 (Ice Lake 32 EU), 39 Wh | Average of class Subnotebook | |
|---|---|---|---|---|---|---|
| Battery runtime | ||||||
| WiFi v1.3 (h) | 7.6 | 9.2 21% | 16 111% | 13.4 76% | 8 5% | 13.7 ? 80% |
Pros
Cons
Verdict - The Surface Laptop Go 2 shows some weaknesses

Microsoft didn't really develop the second generation of the Surface Laptop Go 2 any further but has only equipped it with a slightly more powerful Core i5 processor. However, the performance still remains at a fairly low level overall, but for many users, it definitely should still be sufficient for everyday tasks. But the price is still problematic, since the original MSRP of almost 900 Euros (~$903) is just much too high and cannot even be justified by the high-quality case, which doesn't offer any maintenance options at all. On the other hand, the price has already dropped only a few weeks after its launch, and you now have to pay about 700 Euros (~$702) for the configuration with 8 GB of RAM and a 256-GB SSD. Considering the low display resolution and particularly the lack of a keyboard illumination, this price is still slightly too high for us.
Even with the more powerful Tiger Lake processor, the performance level of the Surface Laptop Go 2 still remains low. Considering the lack of features, Microsoft's MSRP is clearly set too high. In everyday operation, we particularly miss a keyboard illumination.
In addition to the high-quality case, we like the good typing experience and also the decent color reproduction in the state of delivery. The WLAN performance is good, and the connections are often sufficient in everyday operation, even if you have to live without current standards such as Thunderbolt. If the price still drops a bit further, you could start thinking about a purchase. The Surface Laptop Go 2 doesn't really have any competitors for 700 Euros (~$702). While the Dell XPS 13 9305 with the old 16:9 display offers more equipment features, it currently costs at least 800 Euros (~$803). Currently, you can hardly find the Apple MacBook Air M1 for less than 1,000 Euros (~$1004). However, both of these competitors offer some advantages and are also the better devices overall.
Price and Availability
The prices of the Surface Laptop Go 2 vary slightly, depending on the vendor. Starting from $570 from Microsoft directly, the device is most affordable, and you can also purchase it from Amazon starting from $600, for example.
Microsoft Surface Laptop Go 2 Core i5
- 08/18/2022 v7 (old)
Andreas Osthoff
Price comparison

