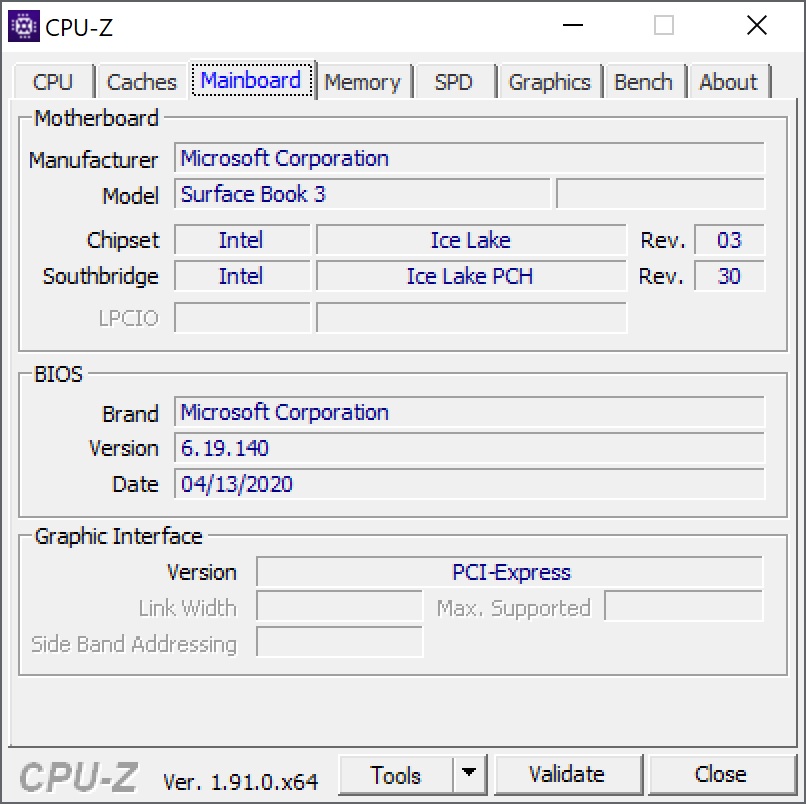
Microsoft Surface Book 3 15 Convertible Review: Still great, but is it better than its predecessor?

As with the preceding Surface Book generation from 2018, there is both a 13.5-inch and a 15-inch version of the Microsoft convertible. We have tested both models and the review of the smaller Surface Book will be available at a later date. The main difference between the current 15-inch version of the Surface Book 3 and its predecessor is the new Ice Lake processor. We are testing one of the highest-end configurations that comes with an Intel Core i7-1065G7 and Nvidia GeForce GTX 1660 Ti Max-Q. This combination should make the refresh even more powerful than the previous model, which we will verify in the following review.
When the Surface Book was released two years ago, it did not have any direct competitors and this has not changed. A convertible this powerful with a detachable tablet unit is exceedingly rare. Thus, we will use not only the Surface Book 2 but also the Apple MacBook Pro 15 2019, Asus ZenBook Flip 15 UX563FD and the Lenovo Yoga C940-14IIL for comparison purposes.
Rating | Date | Model | Weight | Height | Size | Resolution | Price |
|---|---|---|---|---|---|---|---|
| 88.3 % v7 (old) | 06 / 2020 | Microsoft Surface Book 3 15 i7-1065G7, GeForce GTX 1660 Ti Max-Q | 1.9 kg | 23 mm | 15.00" | 3240x2160 | |
v (old) | 02 / 2018 | Microsoft Surface Book 2 15 i7-8650U, GeForce GTX 1060 Mobile | 1.9 kg | 23 mm | 15.00" | 3240x2160 | |
| 89.4 % v7 (old) | 01 / 2020 | Apple MacBook Pro 15 2019 i9 Vega 20 i9-9980HK, Radeon Pro Vega 20 | 1.8 kg | 15.5 mm | 15.40" | 2880x1800 | |
| 86.5 % v7 (old) | 03 / 2020 | Asus ZenBook Flip 15 UX563FD-A1027T i7-10510U, GeForce GTX 1050 Max-Q | 1.9 kg | 19.9 mm | 15.60" | 3840x2160 | |
| 88.2 % v7 (old) | 10 / 2019 | Lenovo Yoga C940-14IIL i7-1065G7, Iris Plus Graphics G7 (Ice Lake 64 EU) | 1.4 kg | 14.95 mm | 14.00" | 1920x1080 |
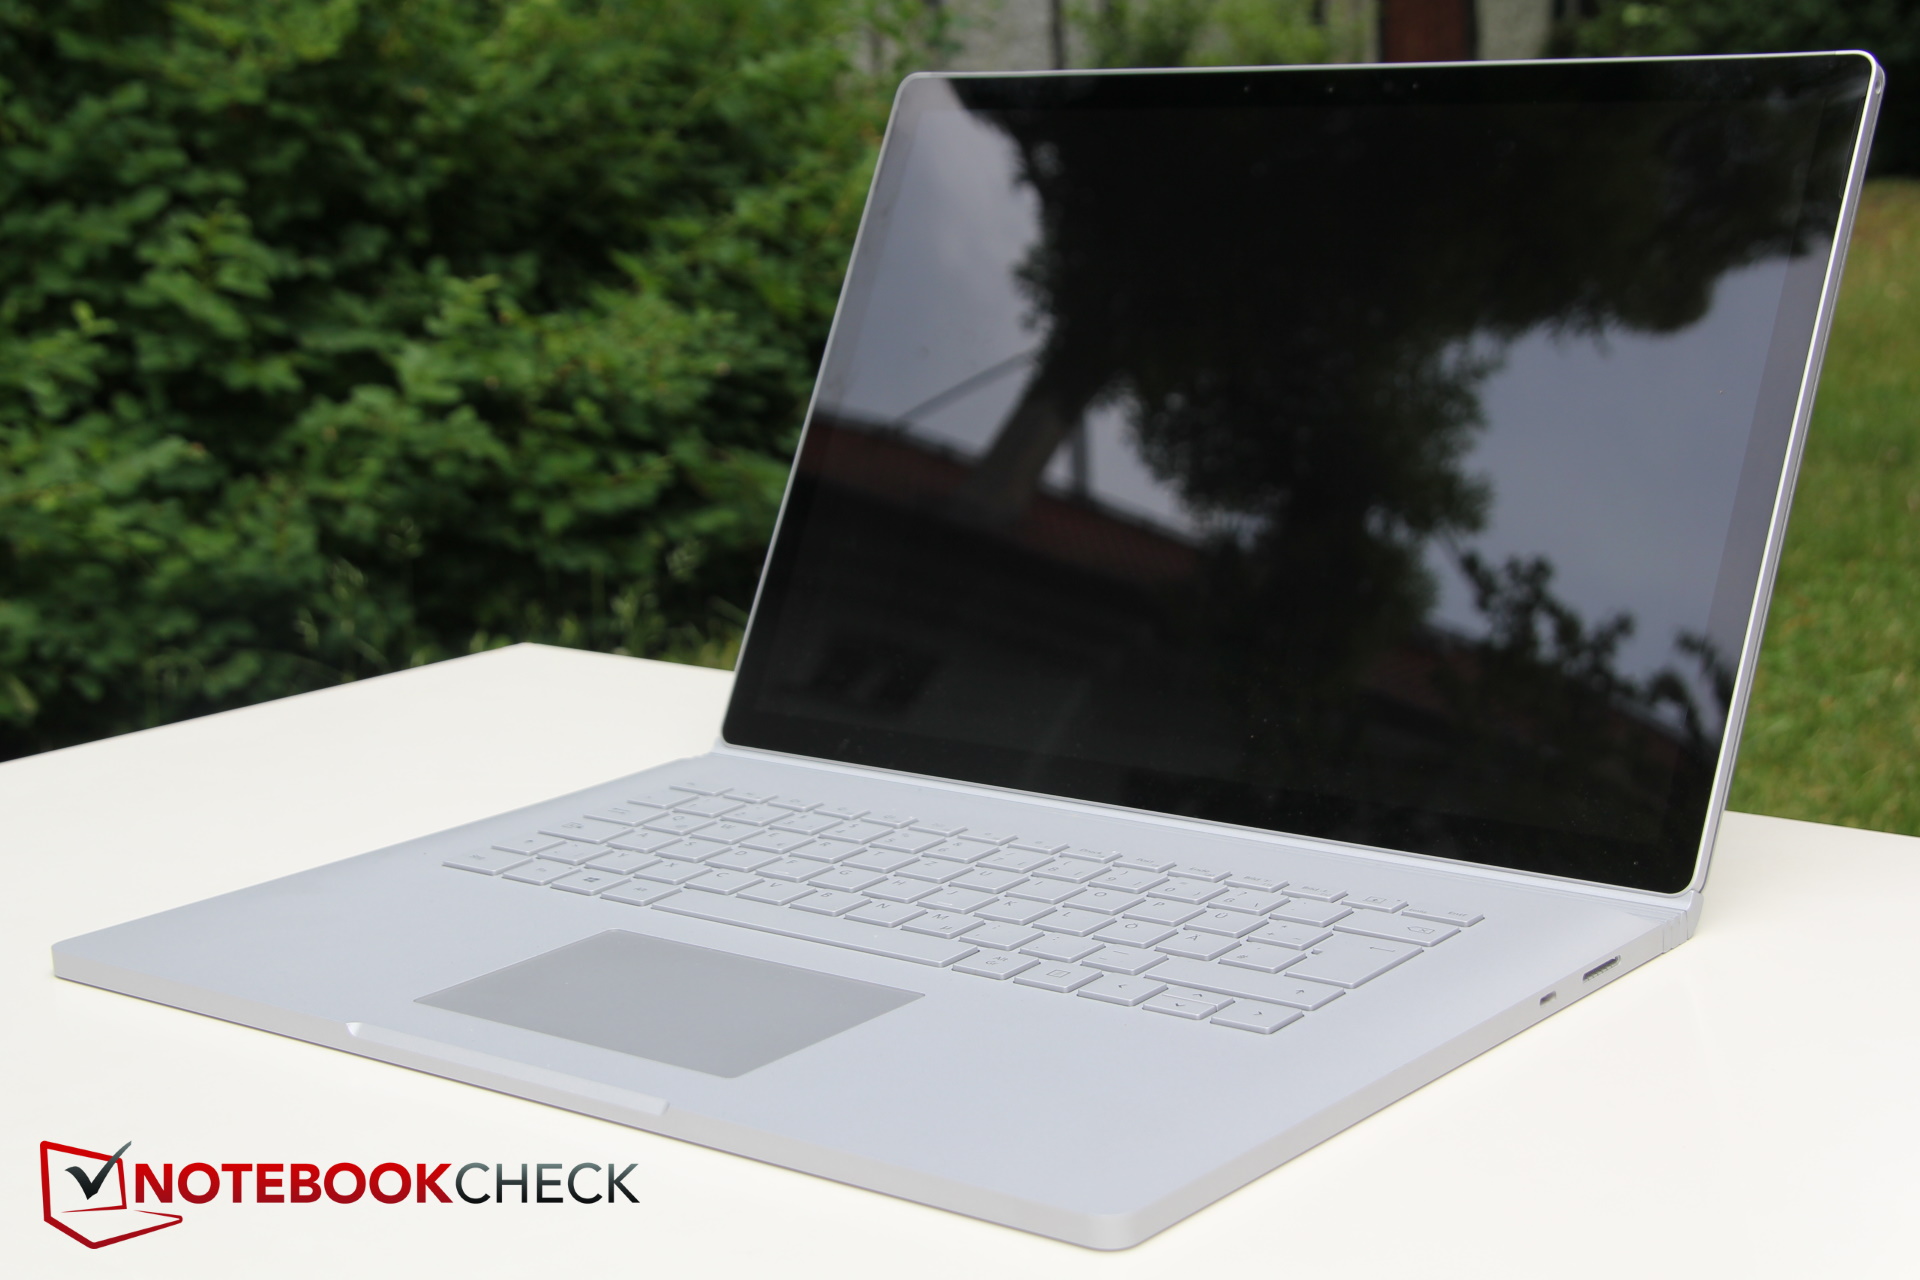
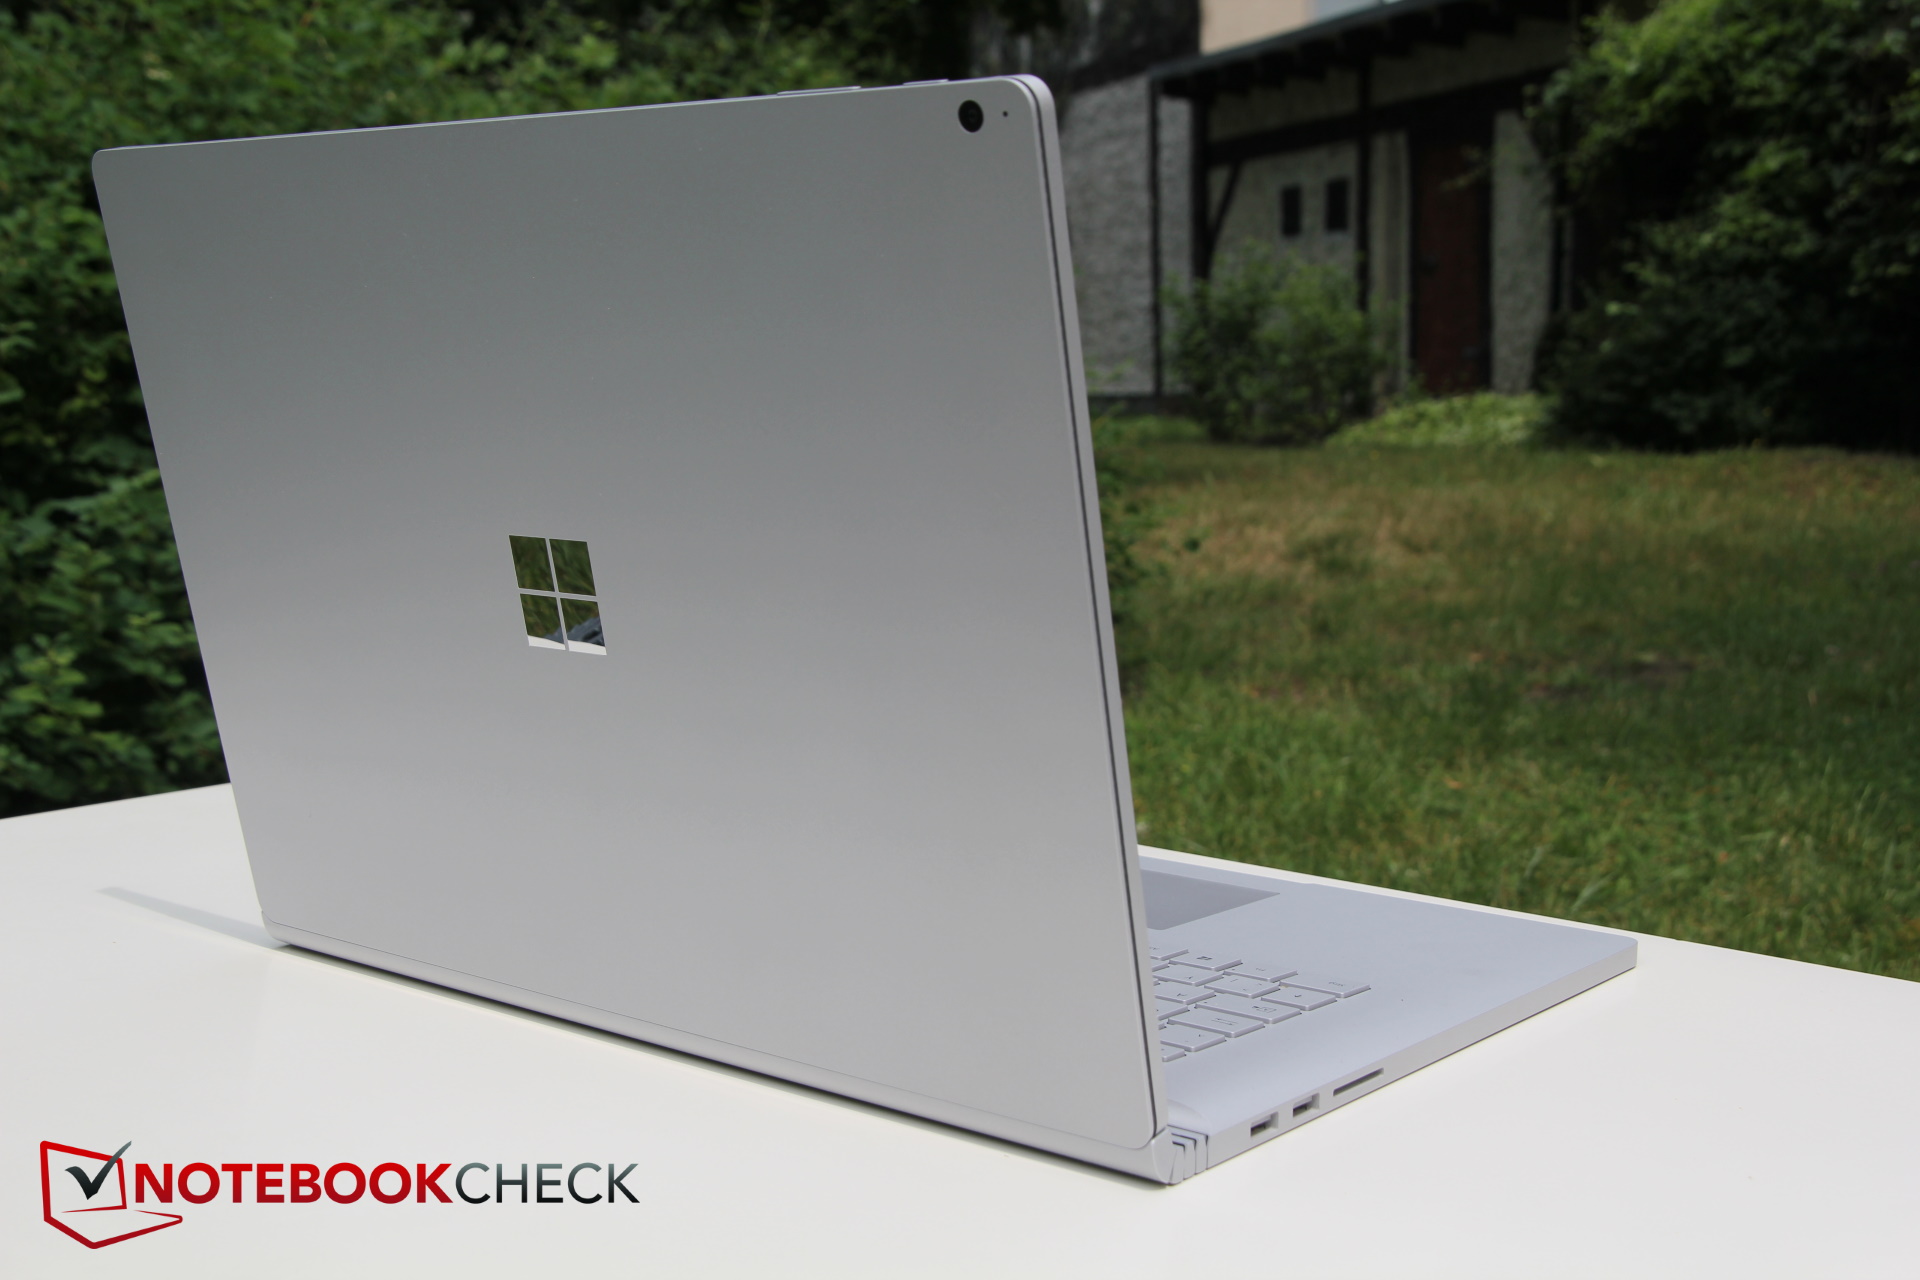
Case - Premium Microsoft Convertible
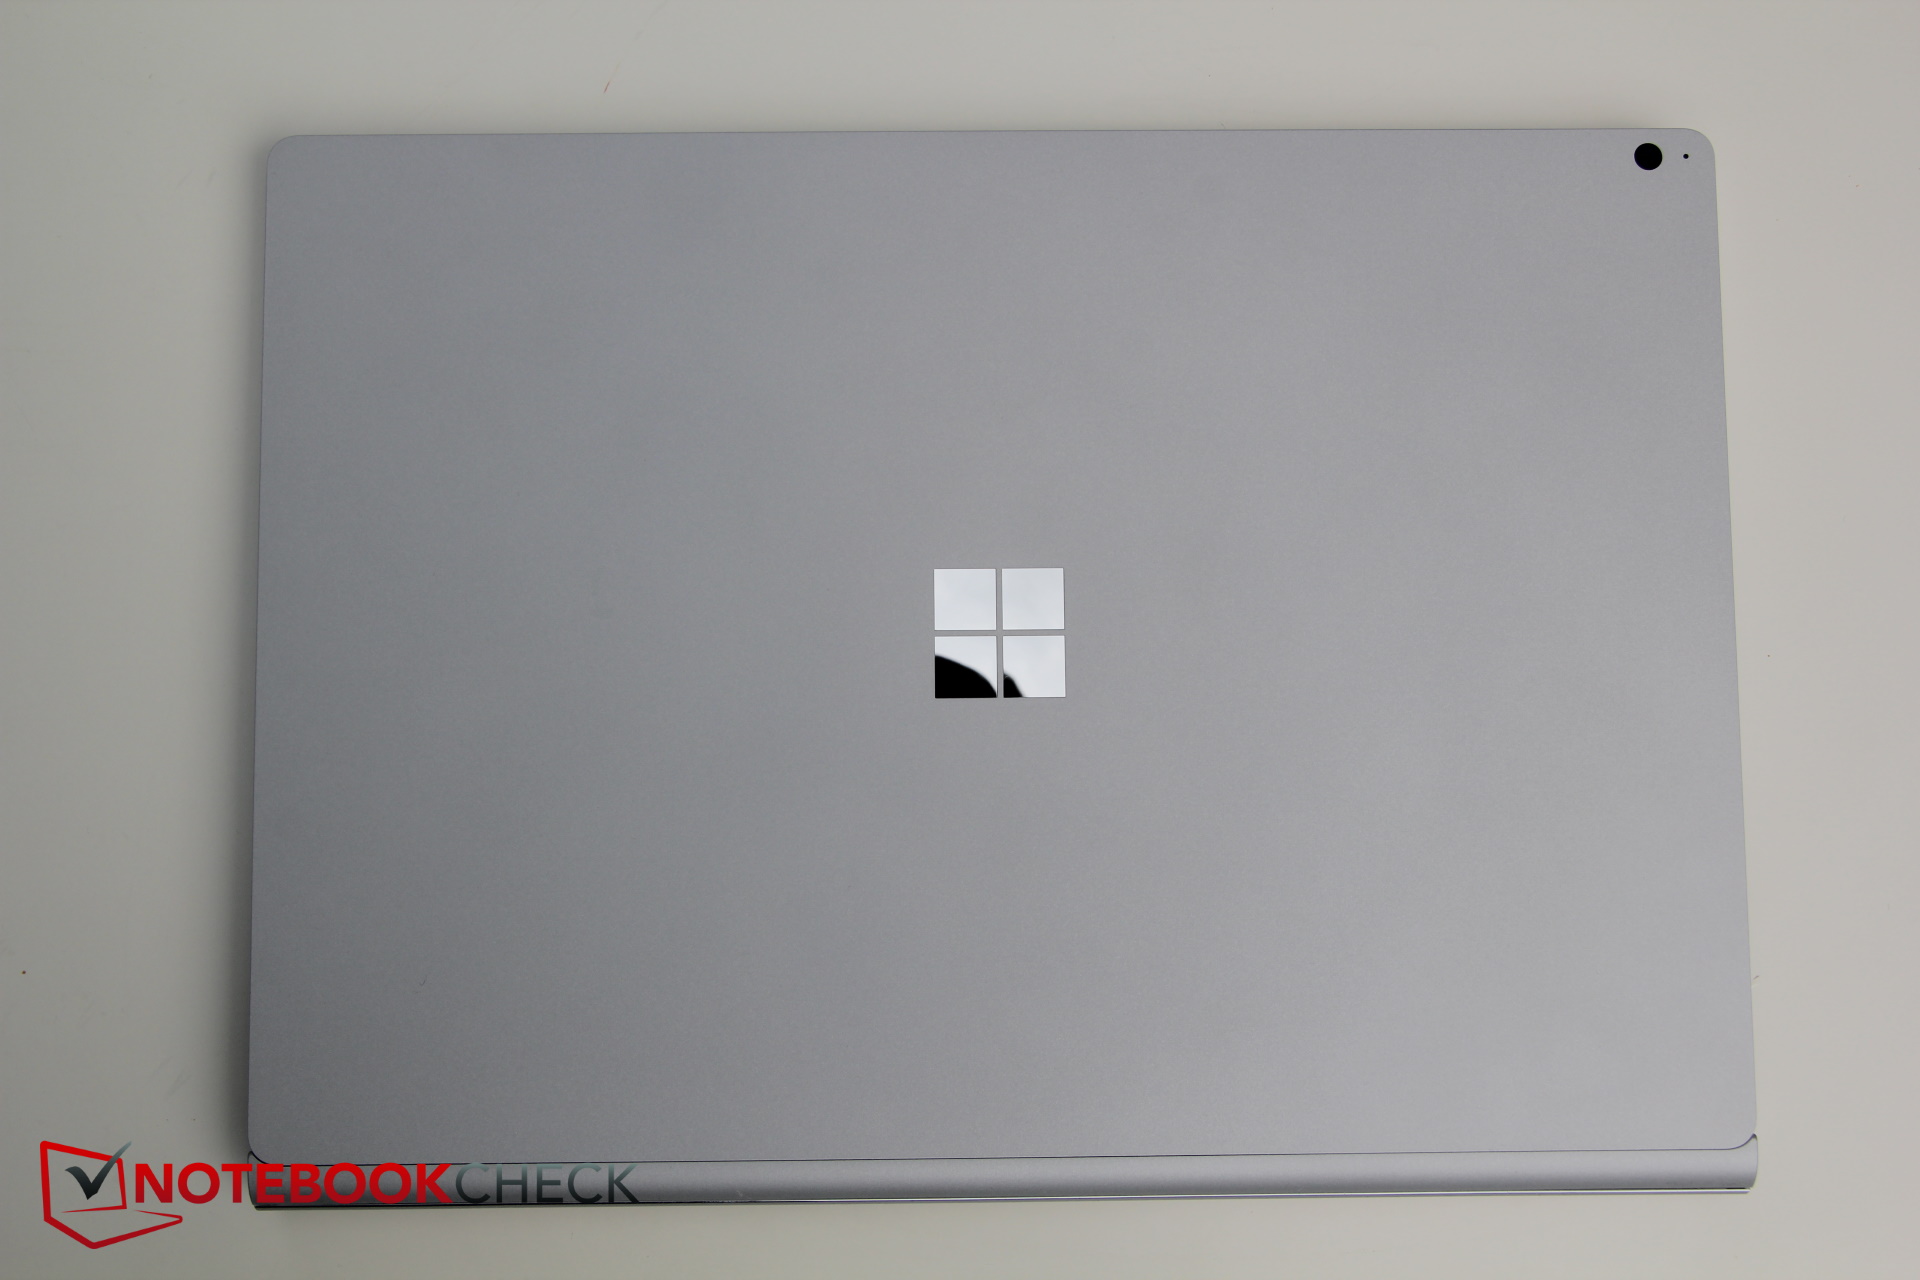
Compared to the first 2015 Surface Book from five years ago, the appearance of the case remains unchanged. It consists of magnesium alloy, while both the display and its edges are made of glass.

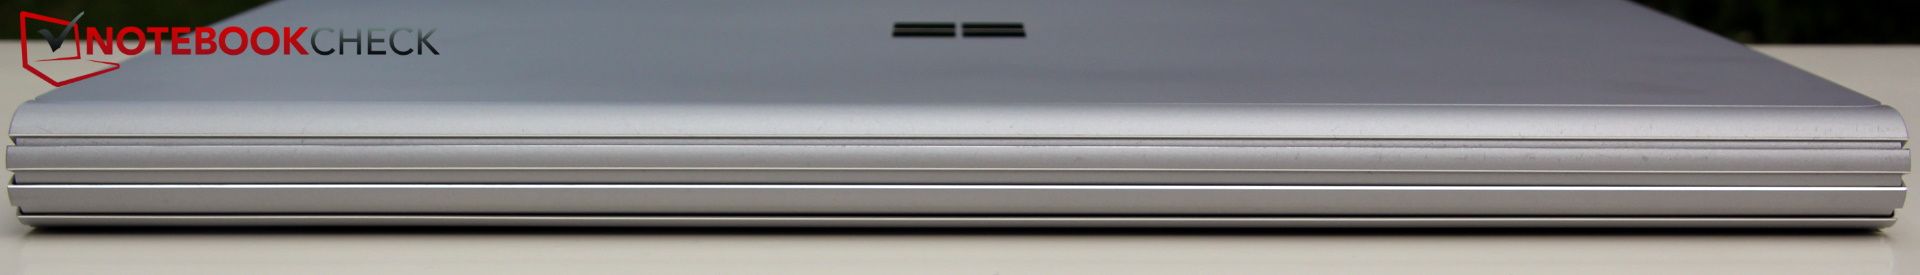
It is also noteworthy that there is still a fulcrum hinge that holds the display. Since unlike on a normal laptop, the 15-inch tablet unit is significantly heavier than a simple display, the tablet unit is susceptible to teetering despite the specialized hinge. While the display of the convertible can only be opened to a maximum angle of around 130 degrees, the tablet unit can be removed from the base with the push of a button and reattached upside down. Since the hinge makes the back of the device fairly thick and prevents the tablet from being fully closed-off, it is a possible entry point for dirt, crumbs and dust, which is why users would be wise to use a case when transporting the Surface Book 3 inside a backpack or bag.
That being said, the chassis is very robust overall, the top-heavy device is never in danger of tipping over, and both the base unit and the tablet appear to be fairly resistant to twisting attempts.
There is no maintenance hatch on the Surface Book and a look at the bottom does not even reveal any screws, which suggests that it is nearly impossible for an average user to perform maintenance on the device.
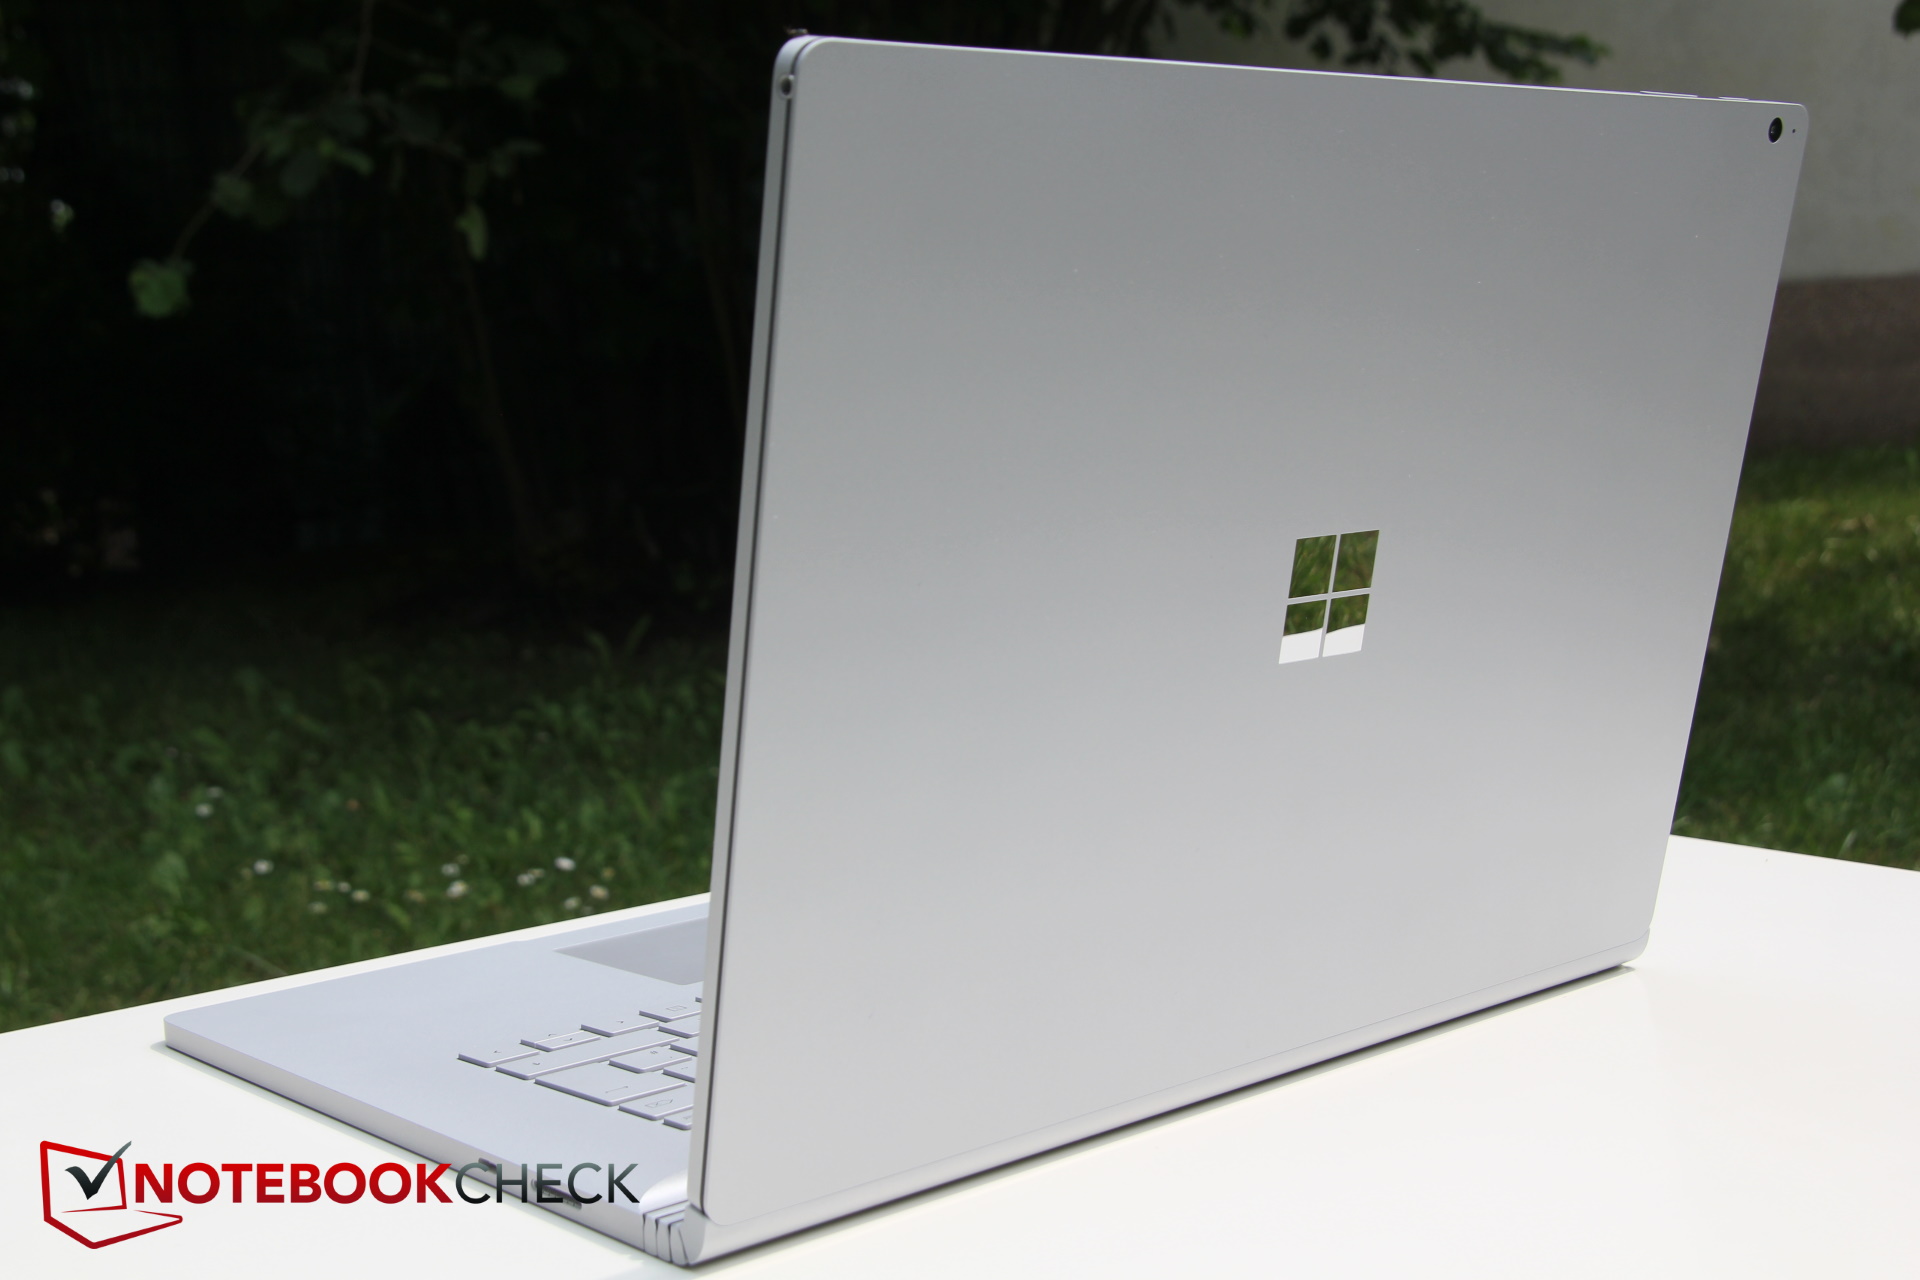
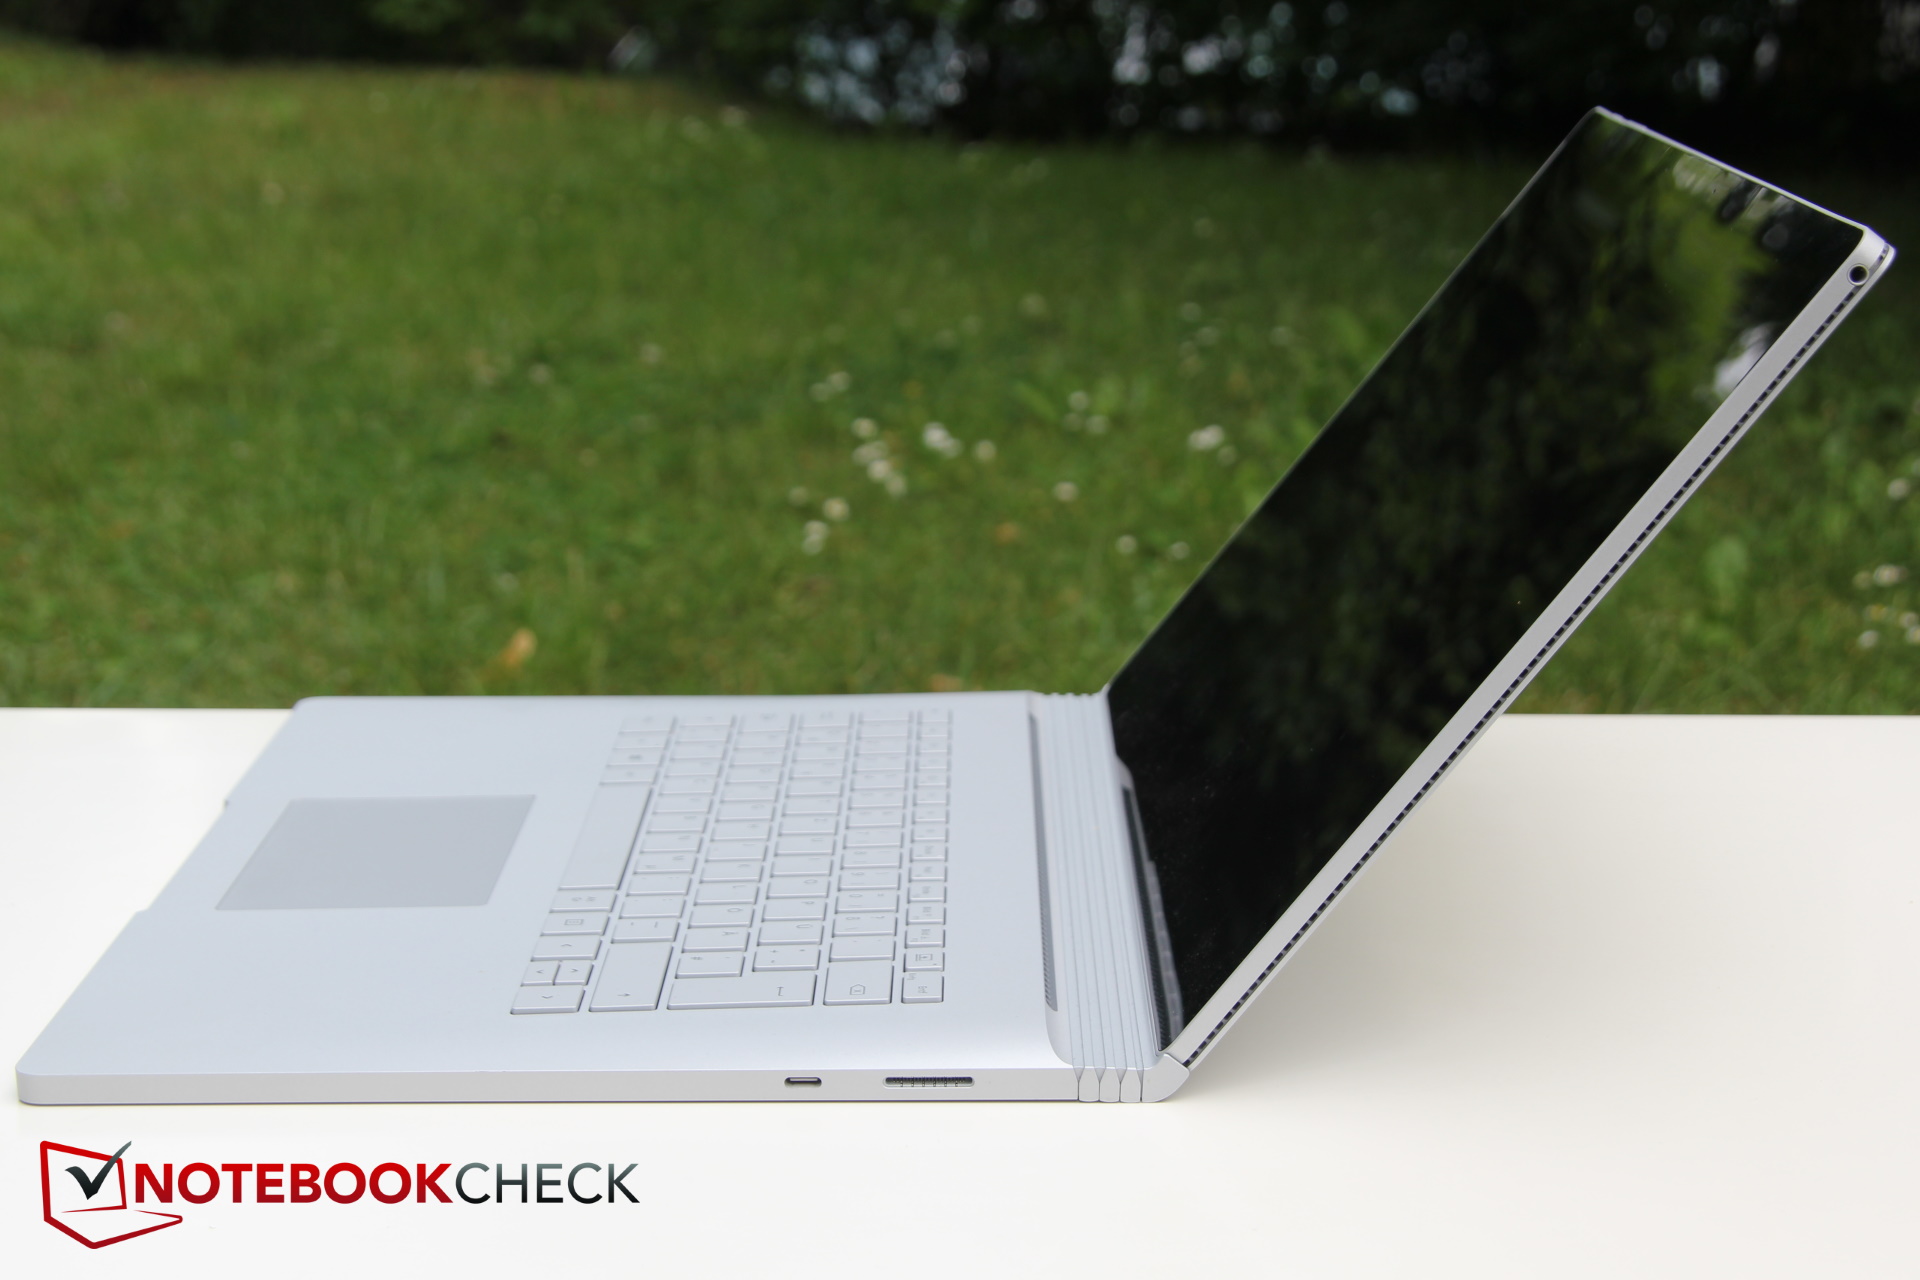

The measurements are identical to the previous model. Due to the somewhat bulky hinge, the entire device expands towards the back, where it exceeds its comfortably thin competition by a large margin. However, it only has a z-height of 15 mm near the front edge, which would make the Microsoft convertible thinner than many of its competitors.
Other than that, the Surface Book 3 is slightly narrower than competing 15-inch devices from Apple and Asus, although at the same time, it has a significantly larger height that can once again be attributed to the big hinge for an overall larger and thicker appearance than its direct competitors.
Features - Surface Book 3 without Thunderbolt...Again
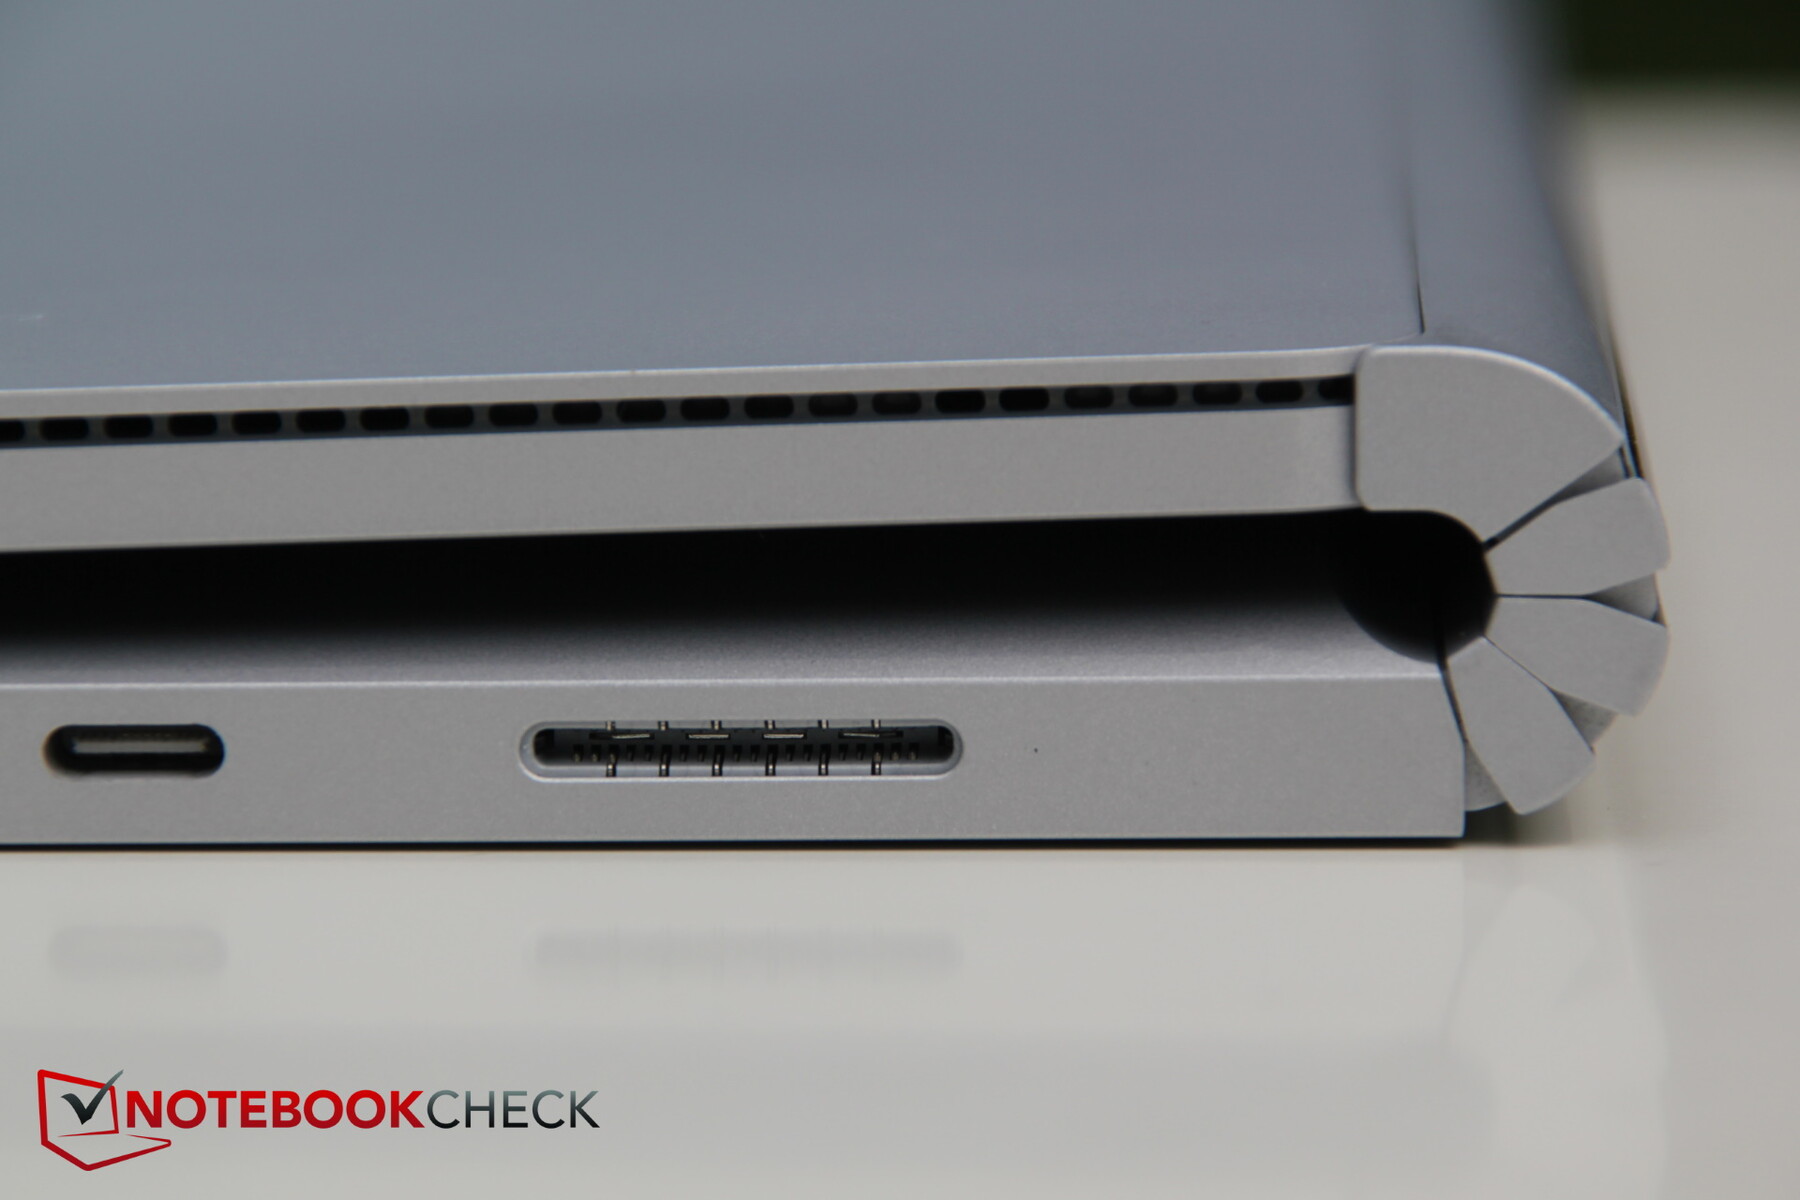
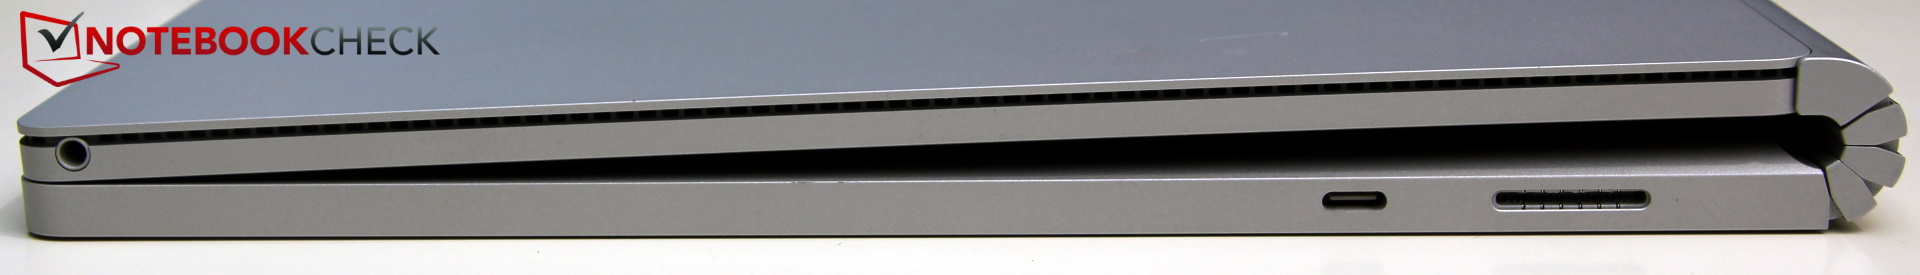
Microsoft still has not implemented Thunderbolt 3, citing safety reasons for the decision. However, the optionally available Surface Dock does offer Thunderbolt, which leaves us wondering whether this was a measure to increase sales for the expensive accessory. There are three USB ports, all of which support USB 3.1 Gen. 2 and one of which is a Power Delivery-enabled Type-C port. Additionally, there is a full-size SD card reader and the Surface Connector, which is used as the default power connection or alternatively for the optional Surface Dock. Unfortunately, the proprietary power port prevents the use of popular third-party AC adapters.
While the port layout is good, the low number of total ports hardly makes this impressive. Only the USB Type-C connector and the narrow power connector occupy the right side, while the remaining ports can be found on the left.
Even though at least one USB Type-C port could have come in handy, the tablet unit only comes with an audio jack.

SD Card Reader
The transfer rates of the SD card reader in conjunction with our reference card Toshiba Exceria Pro SDXC 64 GB UHS-II only marginally deviate from those of the previous model, suggesting that our test model uses the same SD card reader as its predecessor. The results exceed the device class average by a significant margin. On top of that, many convertibles do not even offer a full-size SD card reader in the first place (Apple, Lenovo).
| SD Card Reader | |
| average JPG Copy Test (av. of 3 runs) | |
| Microsoft Surface Book 2 15 (Toshiba Exceria Pro SDXC 64 GB UHS-II) | |
| Microsoft Surface Book 3 15 (Toshiba Exceria Pro M501 microSDXC 64GB) | |
| Asus ZenBook Flip 15 UX563FD-A1027T (Toshiba Exceria Pro SDXC 64 GB UHS-II) | |
| Average of class Convertible (29.4 - 186, n=21, last 2 years) | |
| maximum AS SSD Seq Read Test (1GB) | |
| Microsoft Surface Book 2 15 (Toshiba Exceria Pro SDXC 64 GB UHS-II) | |
| Microsoft Surface Book 3 15 (Toshiba Exceria Pro M501 microSDXC 64GB) | |
| Average of class Convertible (67.5 - 254, n=20, last 2 years) | |
Communication
Since the Surface Book now comes with Wi-Fi 6, it shines in our comparison due to its measurably higher download speeds. The potential of the Wi-Fi module is still not fully exhausted, and it could theoretically achieve 25% to 50% faster performance. Its competitors are currently still slower, although this will likely change soon. While there are fluctuations in terms of the transfer rates, they are not noticeable during daily use. Furthermore, Bluetooth version 5.0 is supported.
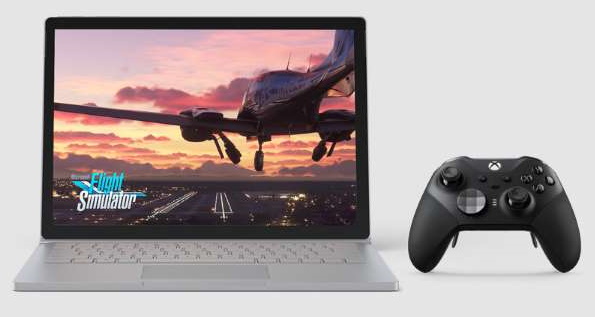
Gamers will be glad to know that Microsoft has integrated a wireless Xbox controller adapter, allowing users to wirelessly connect an Xbox controller with an additional adapter. Note: Unlike the 15-inch model, the 13.5-inch model comes without the adapter.
Webcam
The Surface Book 3 is equipped with two cameras: An 8-MP main camera and a 5-MP front camera for video calls & more. Two far-field studio microphones complement the latter for improved clarity and better speech quality.
While the cameras are above-average compared to normal laptops, they cannot quite compete with higher-end smartphone cameras. Pictures taken with the main camera in particular tend to look "milky" and the exposure constantly readjusts back and forth. However, the cameras are still a noticeable improvement for video calls.


Security
TPM 2.0 comes with the Intel chip and users may use facial recognition via Windows Hello to log in. A Kensington lock, fingerprint sensor or other security features are not available, however.
Accessories
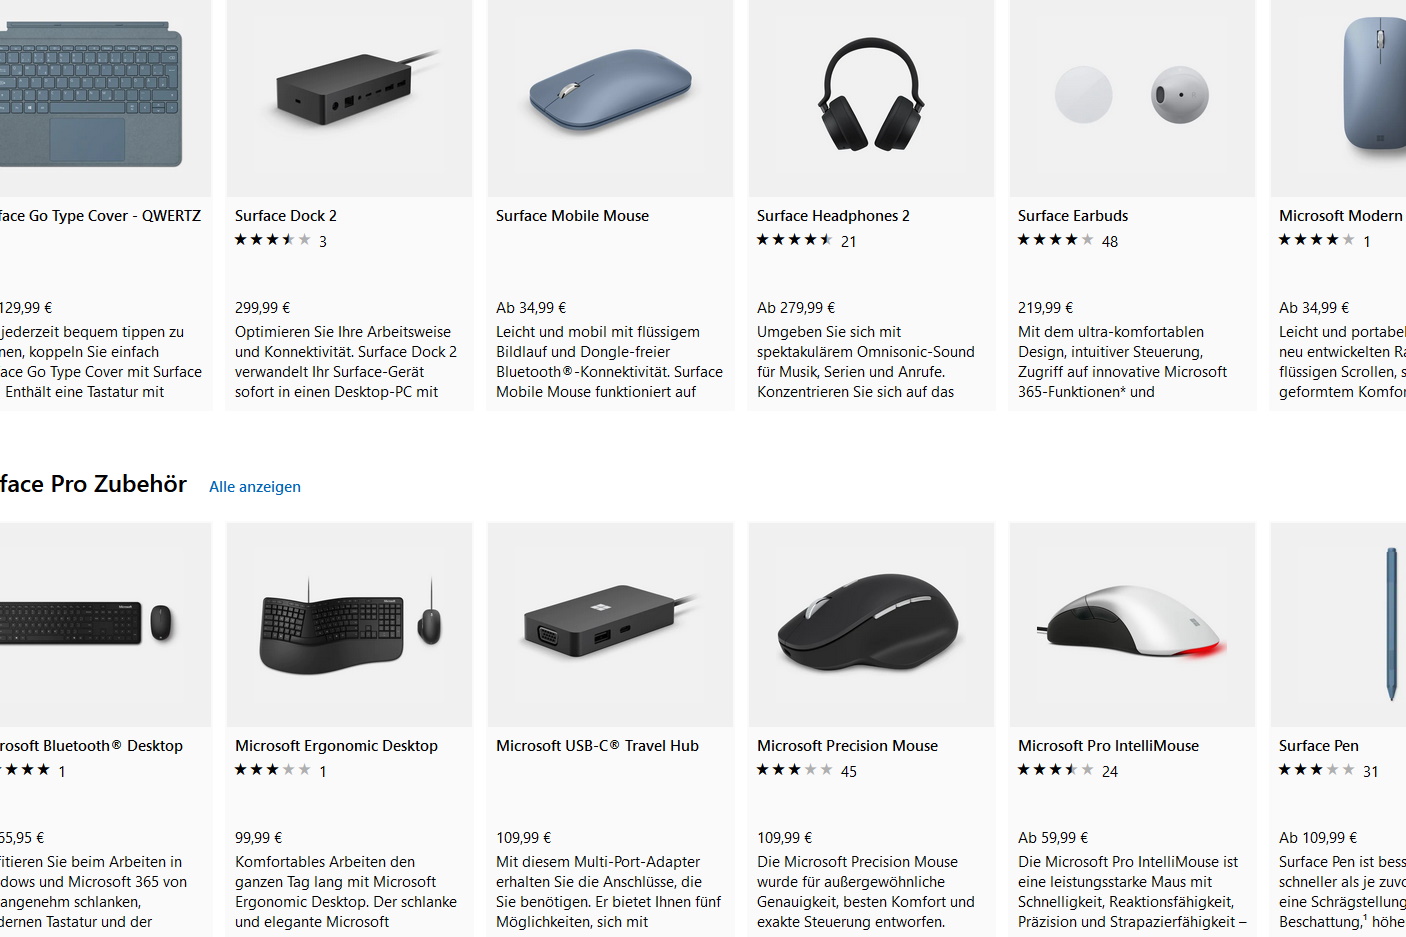
The scope of delivery includes no free extras, and instead, users can purchase (expensive) optional accessories from the Microsoft store. For example, the Surface Dock 2 is available for a hefty 299.99 Euros or $259.99 in the US (Dock 1 around 230 Euros or $199.99), while the Surface Pen costs around 110 Euros ($99.99). Meanwhile, the package of the first Surface Book still included the input pen at no additional cost.
Maintenance
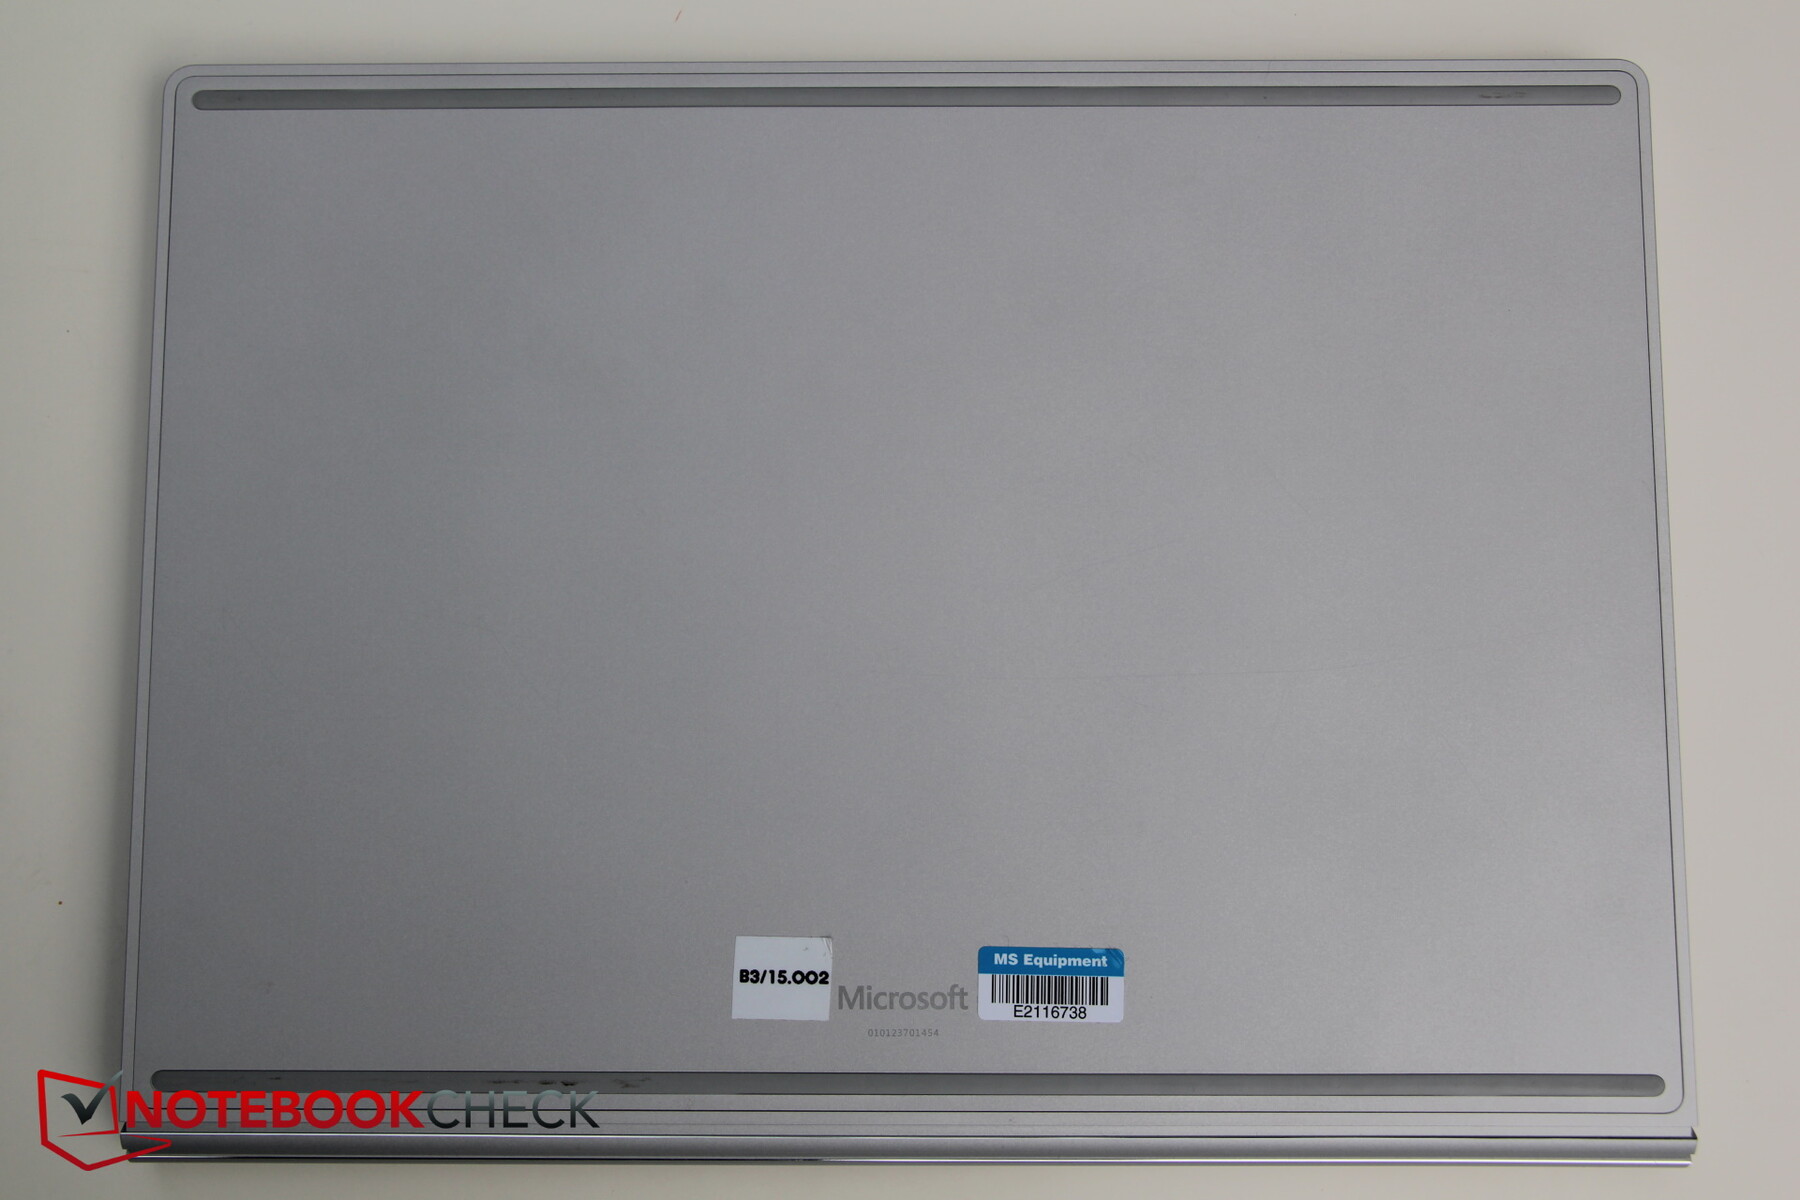
Apparently, Microsoft does not want users to do any tinkering by themselves, since there are no screws on the bottom plate or the tablet. Thus, users who wish to perform maintenance are dependent on a professional. The maintenance options for the Surface Book are extremely poor.
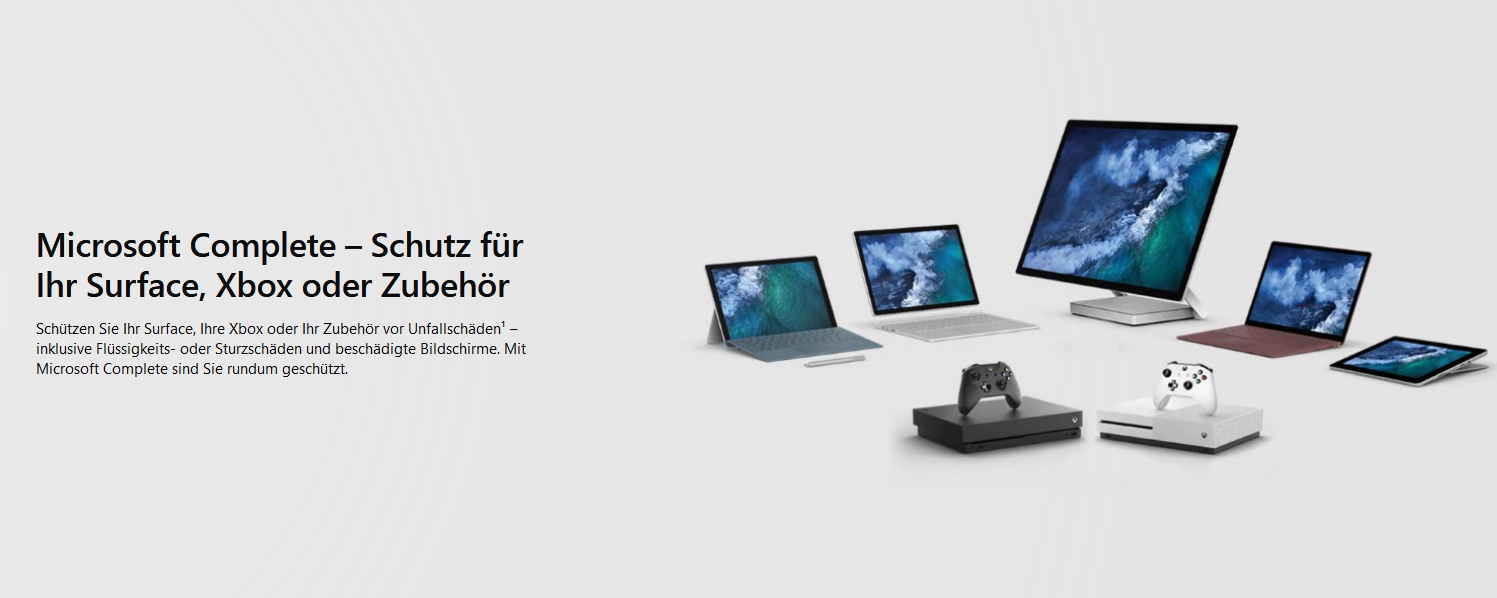
Warranty
Microsoft limits the hardware warranty to just one year. For an additional fee, the device can be insured against various accidental damages and the warranty extended to two years with the optional service Microsoft Complete. There are significantly more warranty options for corporations.
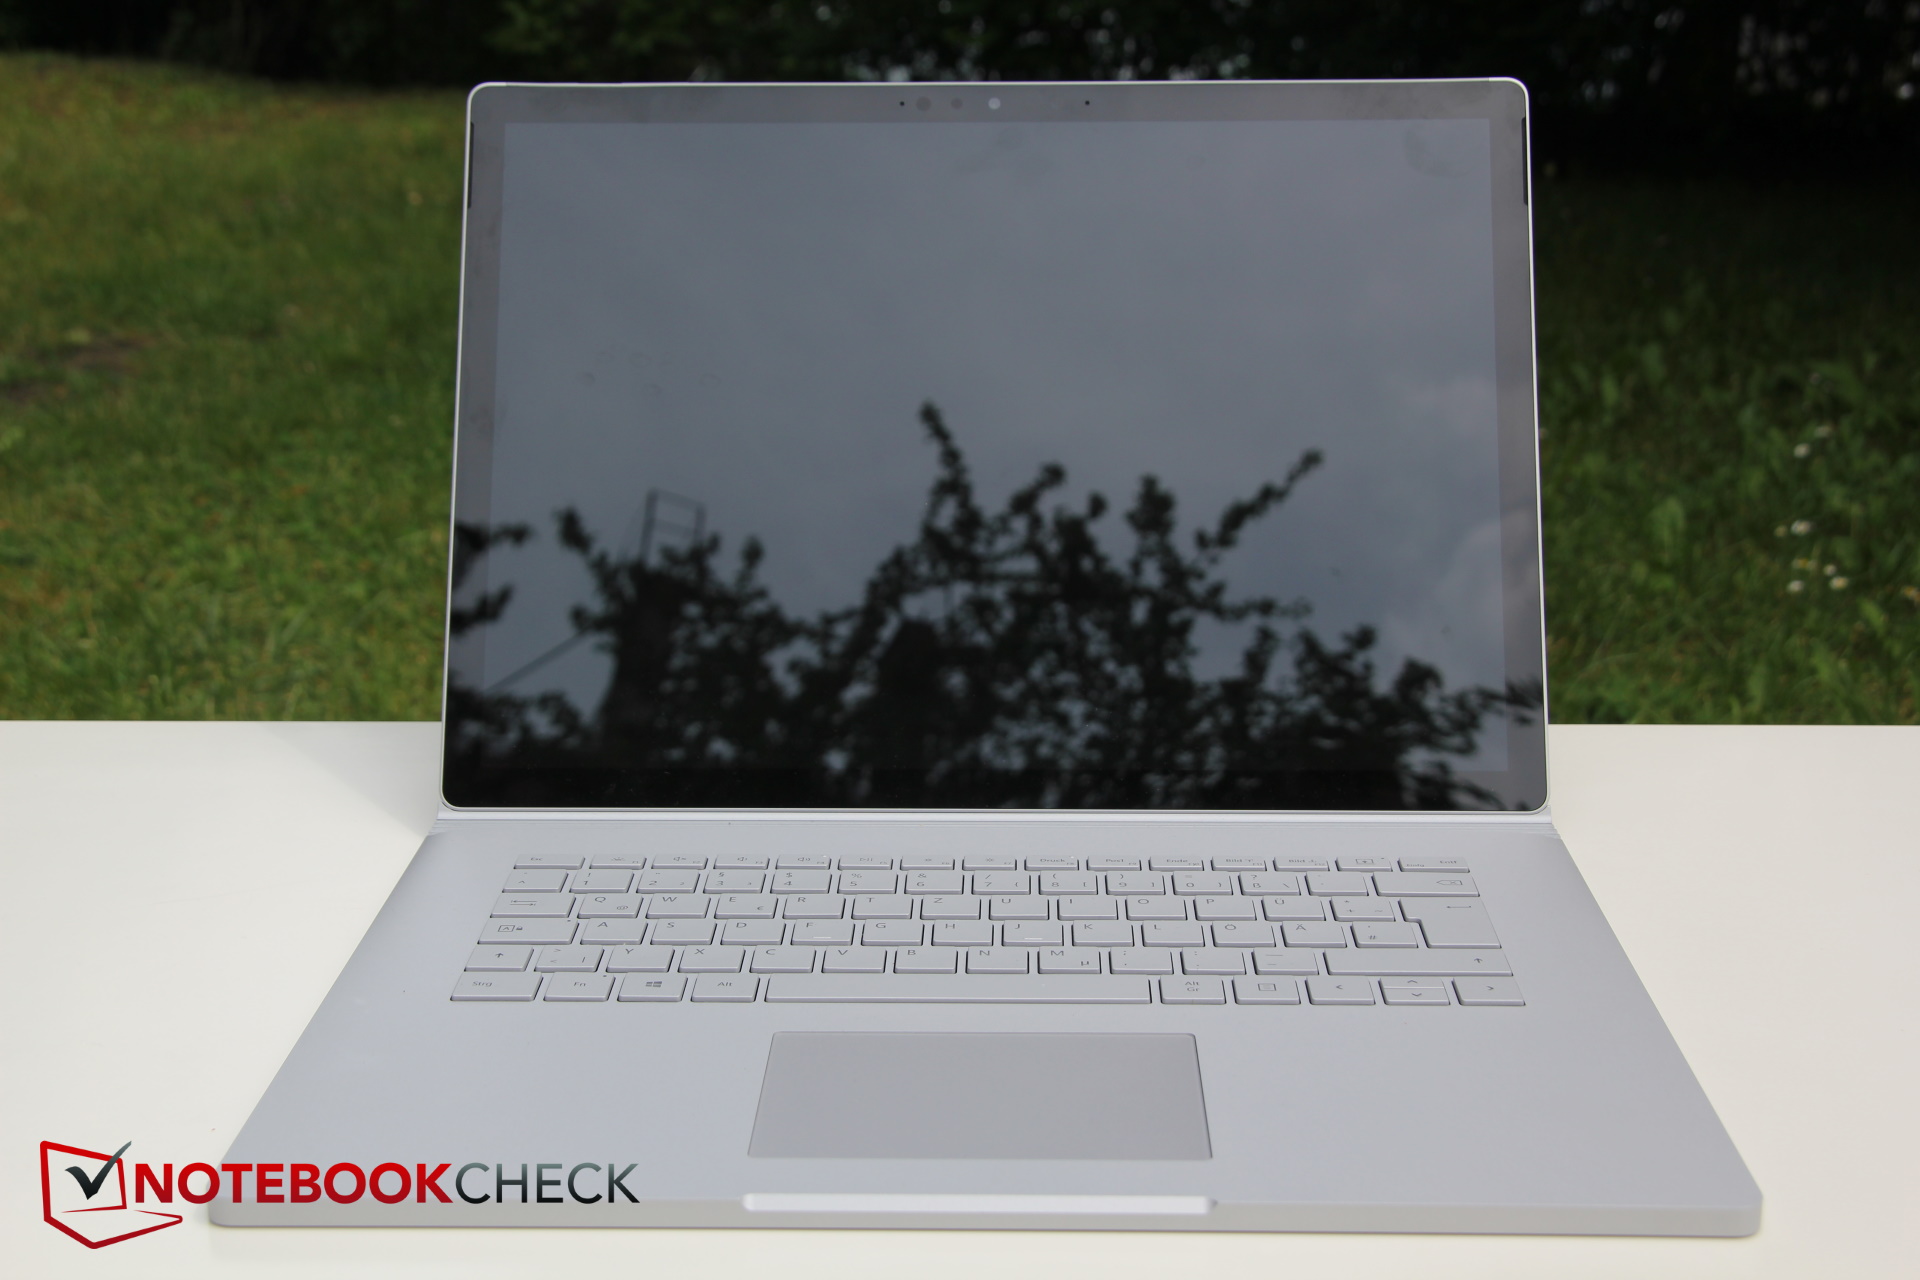
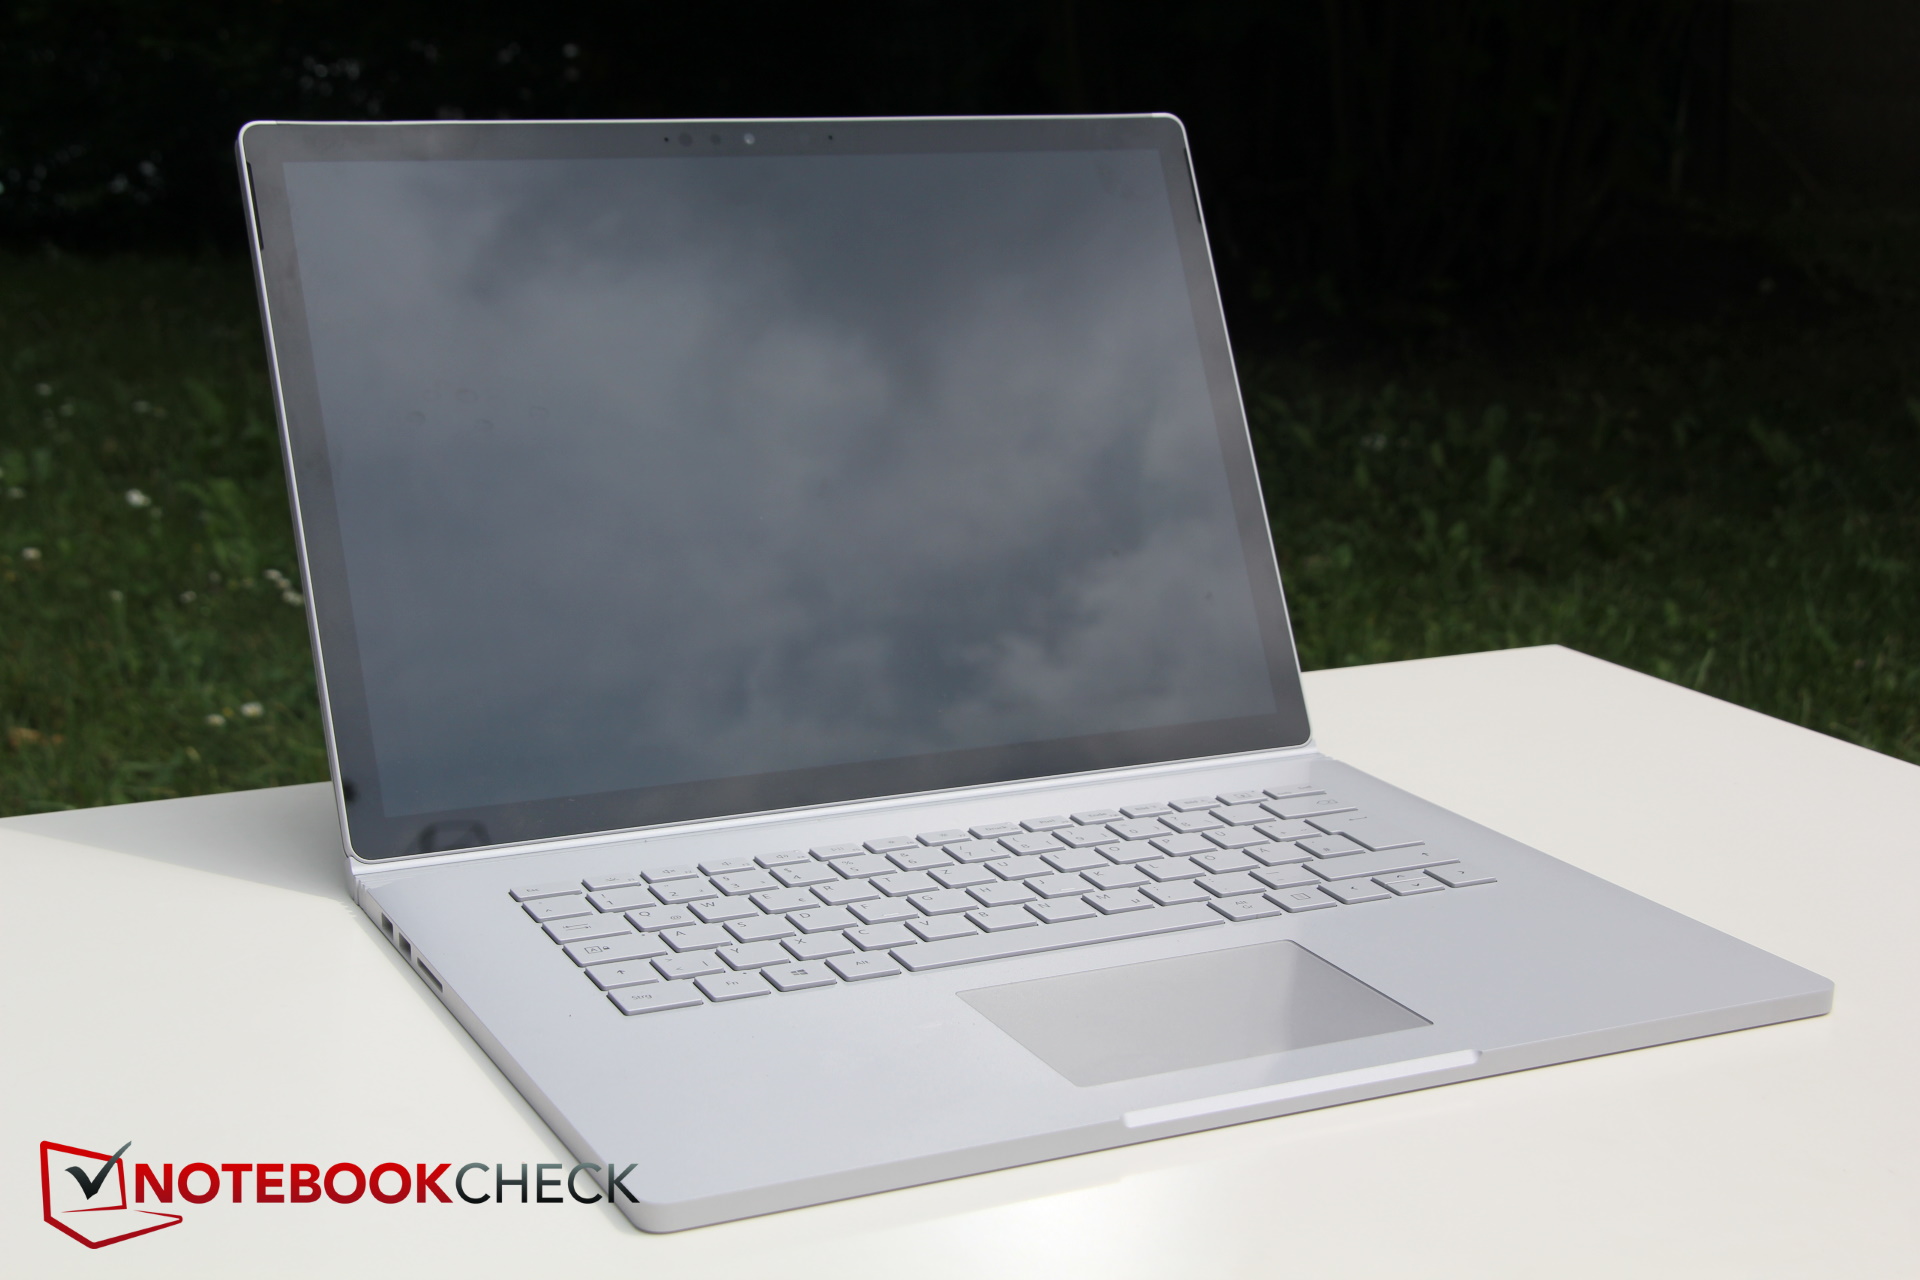
Input Devices - Surface Laptop without Any Flaws
Keyboard
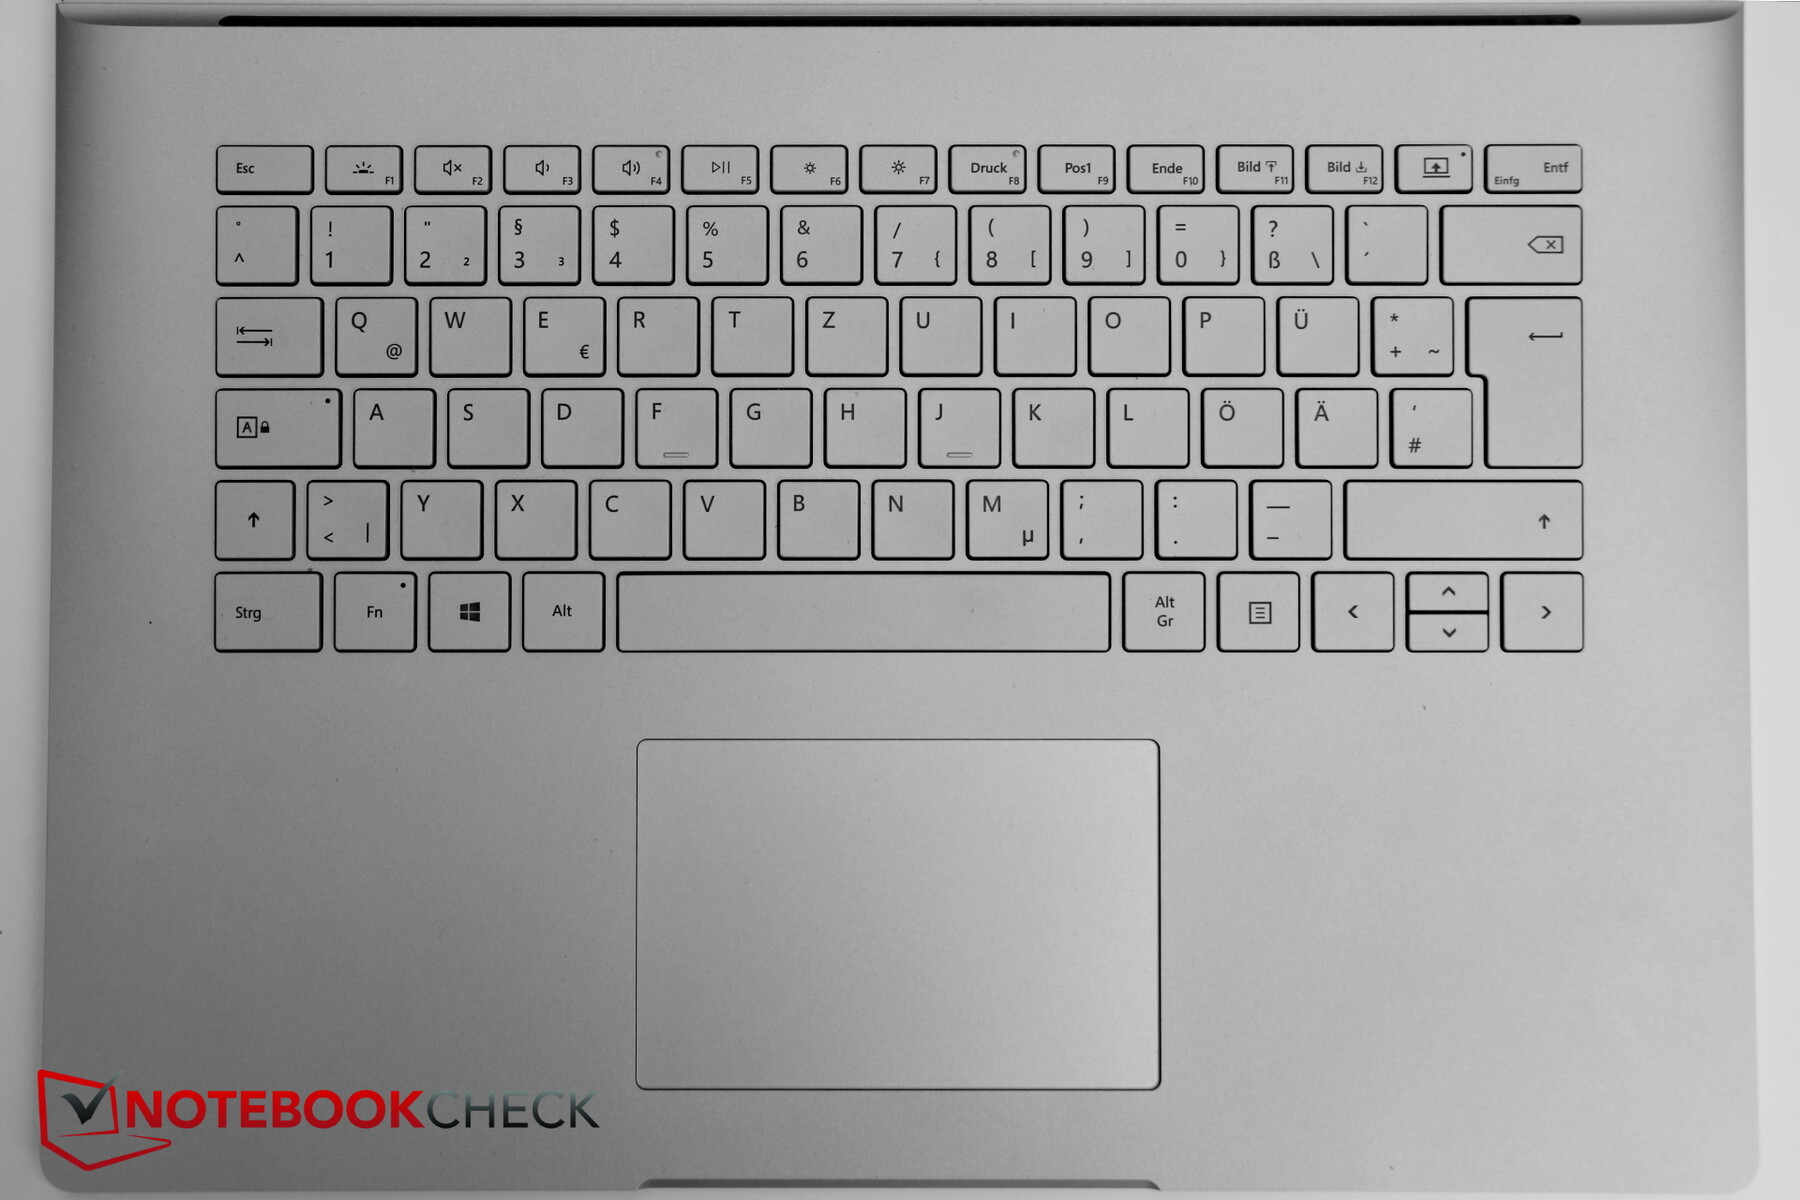
The size of each of our German model's QWERTZ keys is 16x16 mm and there is enough space between them (about 2.5 mm). While they offer fairly shallow travel, they possess a distinct actuation point, resulting in a good feedback. There is no rattling while typing, the keyboard surface does not yield and the key clatter is acceptable. Typing on the Surface Book is swift and a very pleasant experience. The layout is decent aside from the half-height up/down arrow keys, although there is no numpad.
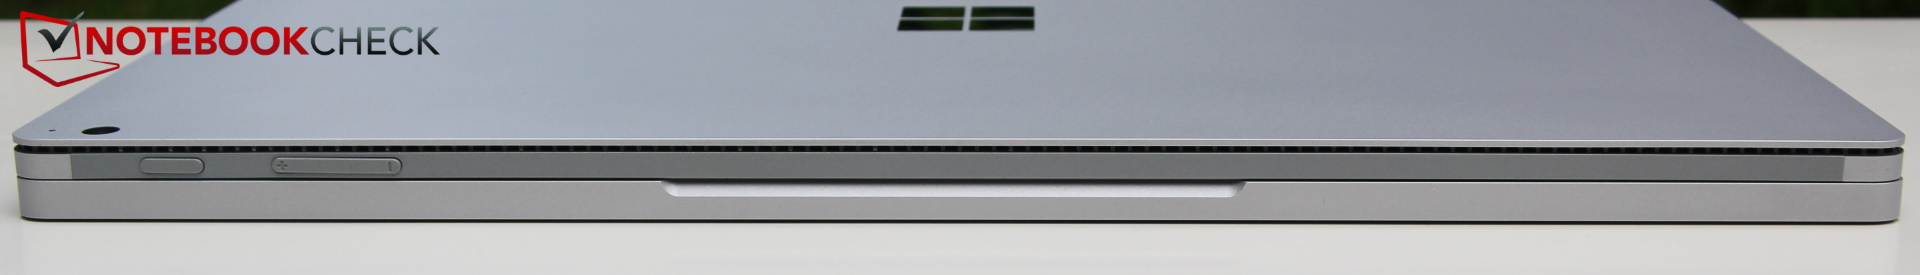
The keyboard is backlit and users can switch between three brightness levels or disable it via the F1 key. The release button for the tablet unit, which is now more reliable than the one on the first model, is located in the top right near the delete key. The power button and volume rocker are part of the tablet unit.
Touchpad
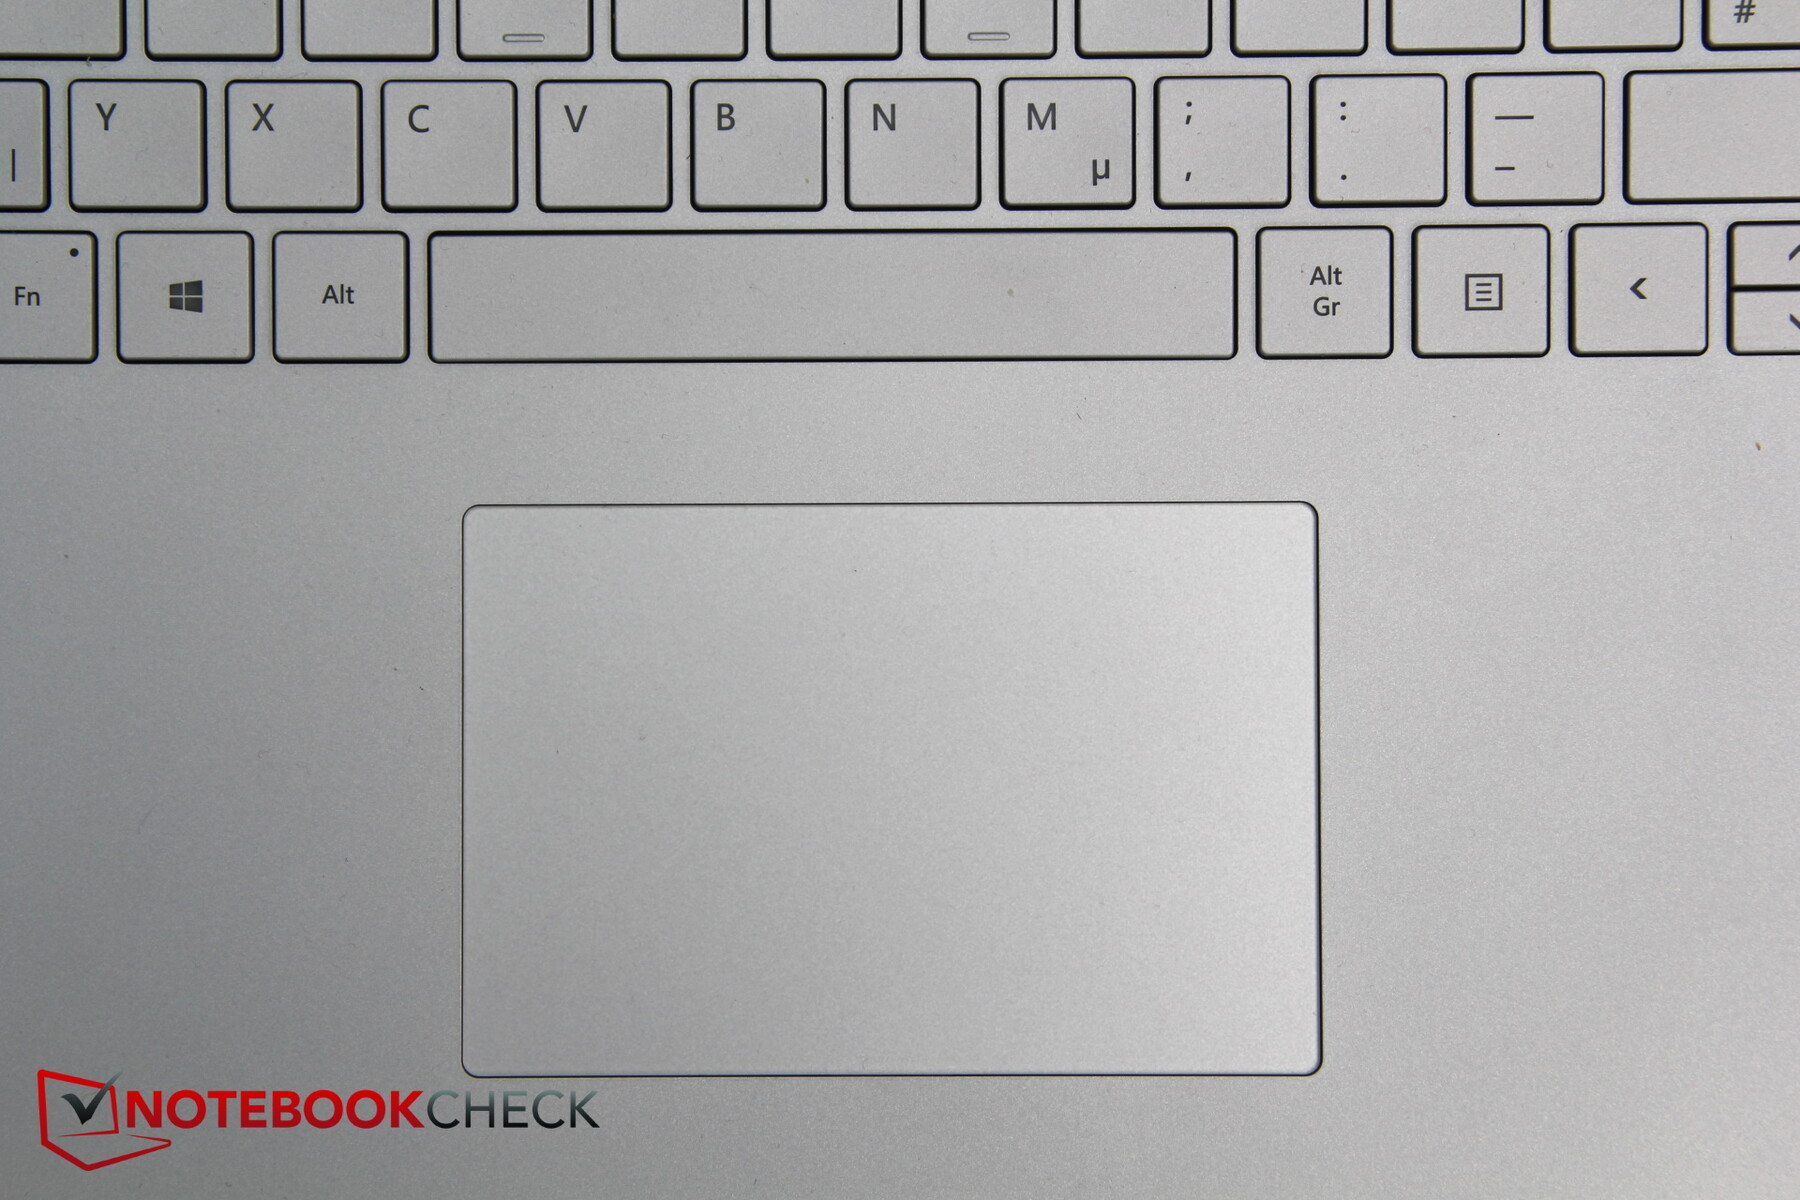
The touchpad has a surface area of 10.5 x 7 cm, making it sufficiently large. It offers good gliding properties and reliably recognizes four-finger gestures. There are no dedicated mouse buttons and although the integrated buttons offer a decent feedback, they are not particularly quiet.
Touchscreen
Navigating the Surface Book via the screen is no problem either, since the touchscreen works reliably. Since the Surface Pen is no longer included and Microsoft did not provide us with one, we were unable to test the Surface Pen as an input method.
Display - Microsoft Convertible with a Great Screen


Two years after the Surface Book 2, Microsoft once again relies on the same reflective LG Philips PixelSense display, although a few of its properties have been tweaked. Most notably, the black value and contrast ratio have been further improved. In turn, the brightness has decreased slightly (413 vs. 444 nits) and the good illumination has not changed (89%). The panel has a resolution of 3240x2160 pixels.
The adaptive brightness has proven to be an annoyance. The ambient light sensor measures the ambient brightness and automatically adjusts the display's brightness accordingly. The screen's brightness seems to constantly readjust itself, even if the lighting conditions barely change. Thankfully, this feature can be disabled via the settings, whereas the adaptive contrast can only be deactivated via the Intel graphics driver.
While we did notice some minor backlight bleeding around the edges of the panel (particularly near the top edge), they are only noticeable in very dark scenes and thus barely an issue.
| |||||||||||||||||||||||||
Brightness Distribution: 89 %
Center on Battery: 429 cd/m²
Contrast: 1861:1 (Black: 0.23 cd/m²)
ΔE ColorChecker Calman: 2.65 | ∀{0.5-29.43 Ø4.71}
calibrated: 0.92
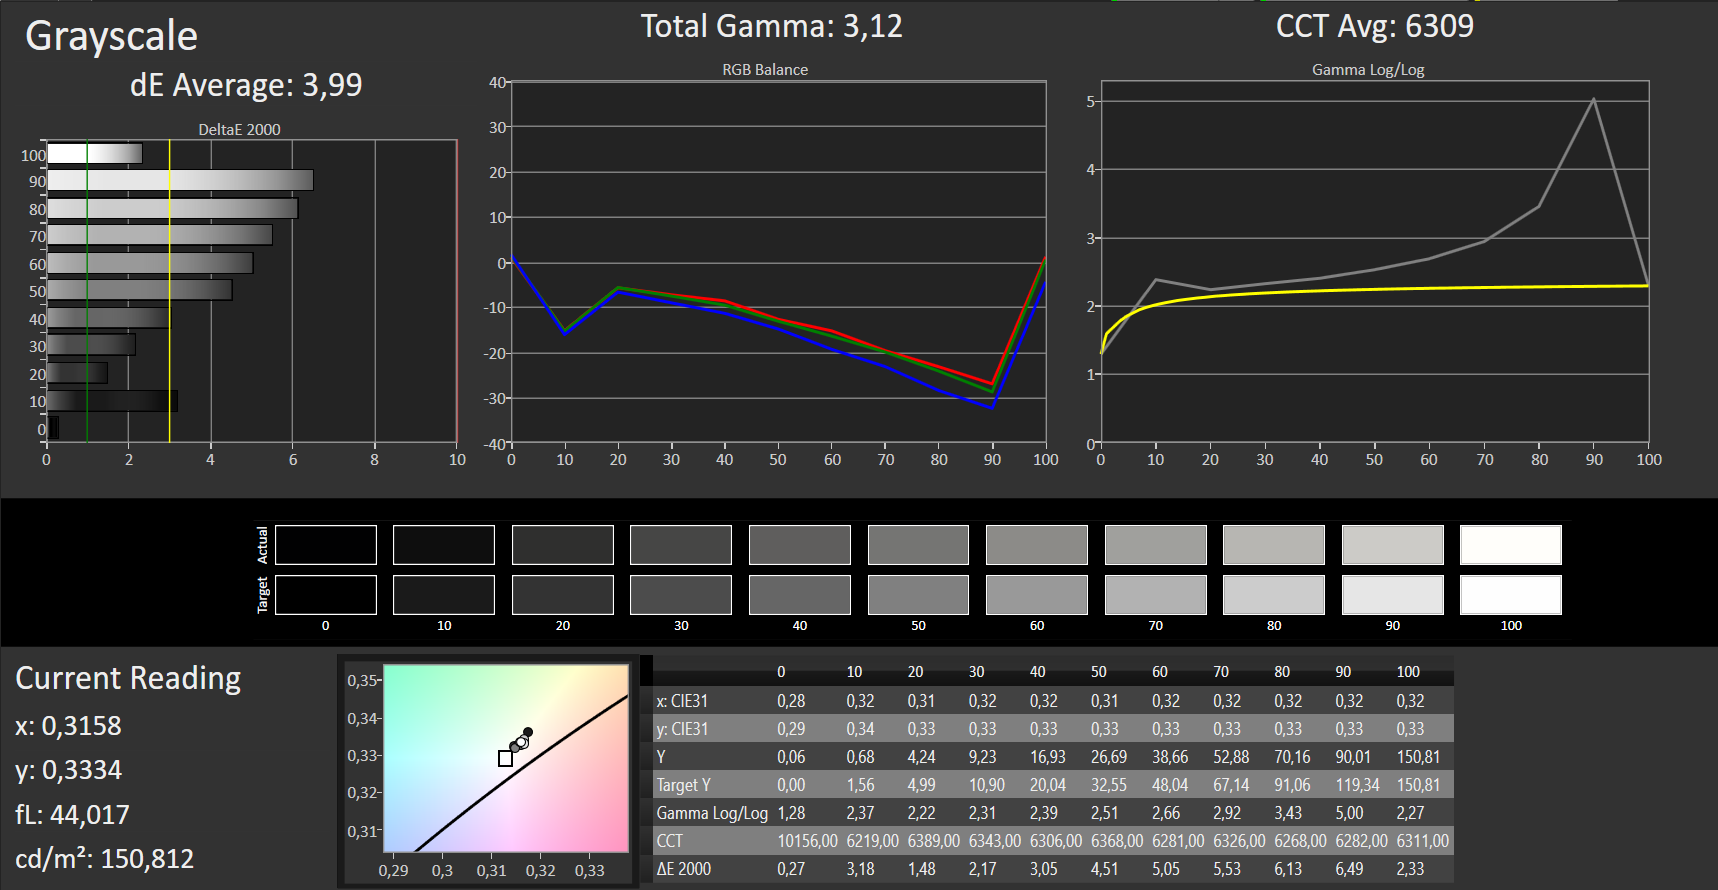
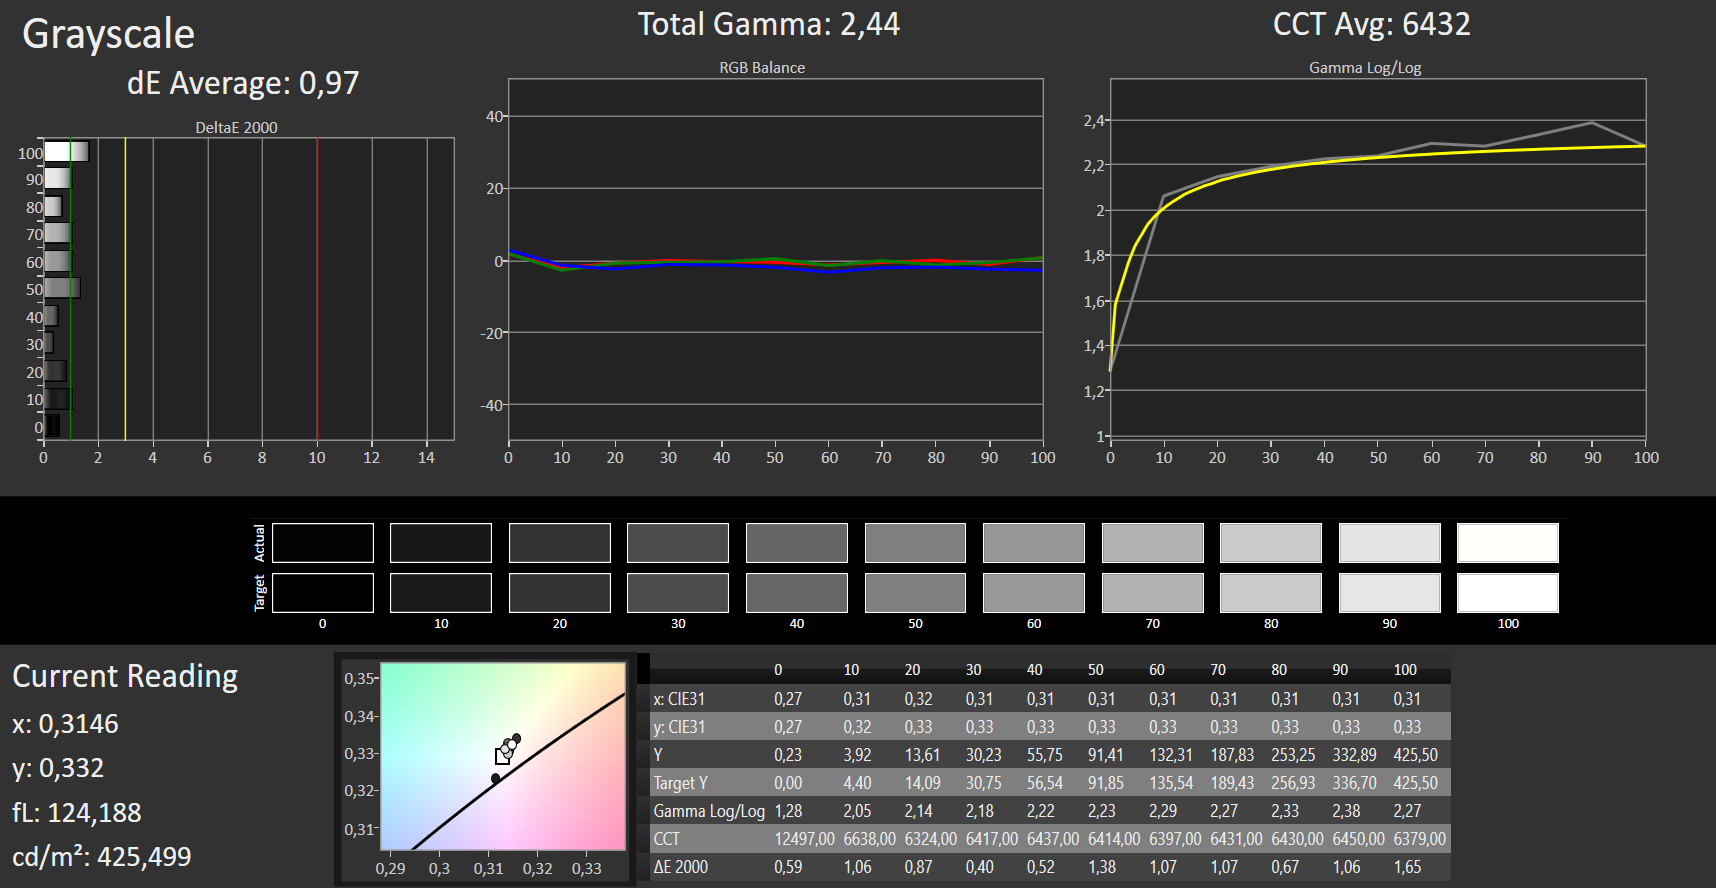
ΔE Greyscale Calman: 3.99 | ∀{0.09-98 Ø4.96}
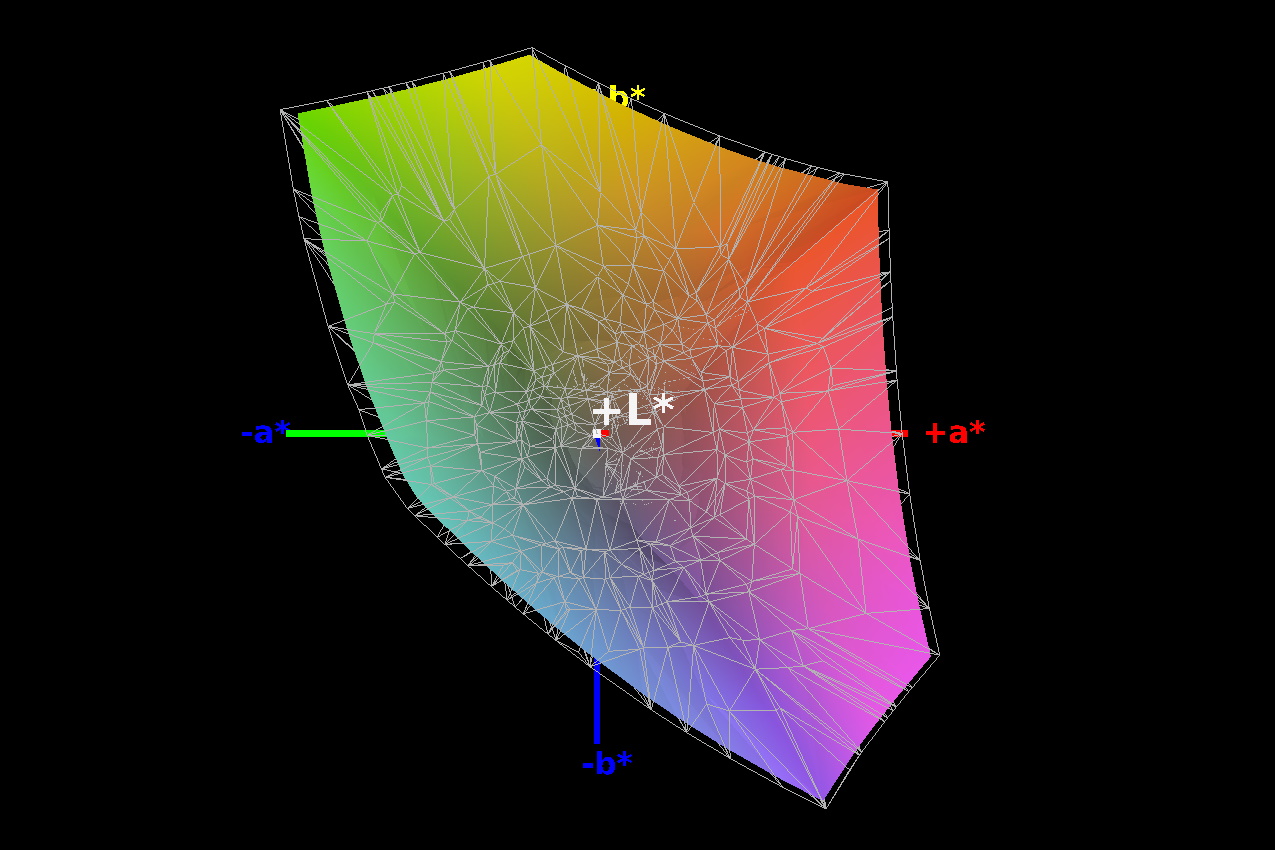
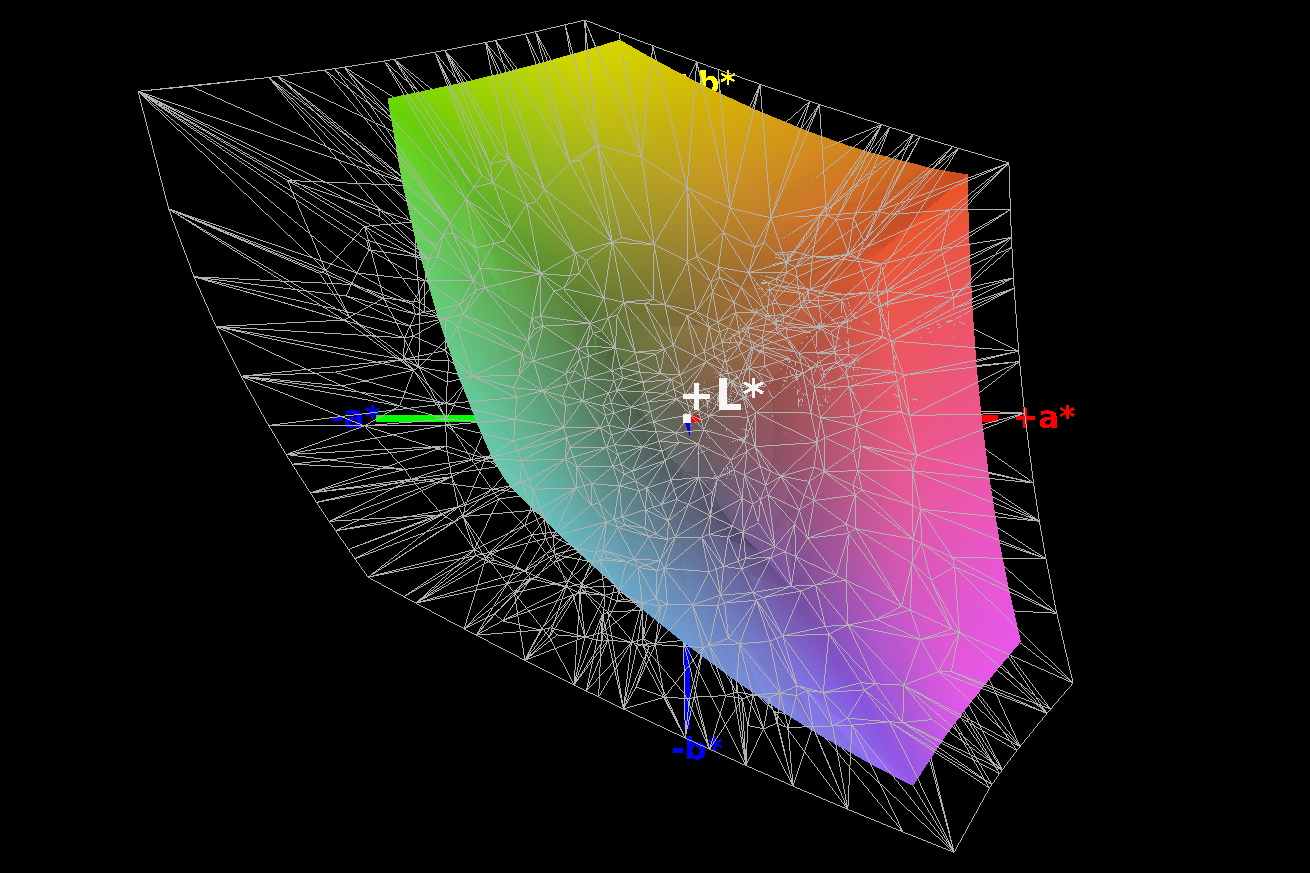
93% sRGB (Argyll 1.6.3 3D)
58% AdobeRGB 1998 (Argyll 1.6.3 3D)
63.6% AdobeRGB 1998 (Argyll 3D)
92.7% sRGB (Argyll 3D)
61.5% Display P3 (Argyll 3D)
Gamma: 3.12
CCT: 6309 K
| Microsoft Surface Book 3 15 LG Philips LGD0554, IPS, 3240x2160, 15" | Microsoft Surface Book 2 15 LG Philips LGD0554, IPS, 3240x2160, 15" | Asus ZenBook Flip 15 UX563FD-A1027T BOE HF NE156QUM-N64, IPS, 3840x2160, 15.6" | Lenovo Yoga C940-14IIL LP140WF9-SPE2, IPS LED, 1920x1080, 14" | |
|---|---|---|---|---|
| Display | 7% | 6% | ||
| Display P3 Coverage (%) | 61.5 | 66.2 8% | 66 7% | |
| sRGB Coverage (%) | 92.7 | 97.2 5% | 97.9 6% | |
| AdobeRGB 1998 Coverage (%) | 63.6 | 68.3 7% | 67.3 6% | |
| Response Times | 6% | -49% | -26% | |
| Response Time Grey 50% / Grey 80% * (ms) | 38 ? | 37.6 ? 1% | 60 ? -58% | 49.6 ? -31% |
| Response Time Black / White * (ms) | 25 ? | 22.4 ? 10% | 35 ? -40% | 30 ? -20% |
| PWM Frequency (Hz) | 250 ? | 21930 ? | ||
| Screen | 16% | 4% | 1% | |
| Brightness middle (cd/m²) | 428 | 446 4% | 351 -18% | 384 -10% |
| Brightness (cd/m²) | 413 | 444 8% | 335 -19% | 363 -12% |
| Brightness Distribution (%) | 89 | 89 0% | 87 -2% | 90 1% |
| Black Level * (cd/m²) | 0.23 | 0.25 -9% | 0.31 -35% | 0.17 26% |
| Contrast (:1) | 1861 | 1784 -4% | 1132 -39% | 2259 21% |
| Colorchecker dE 2000 * | 2.65 | 1.7 36% | 1.74 34% | 3.5 -32% |
| Colorchecker dE 2000 max. * | 8.12 | 2.7 67% | 2.76 66% | 5.5 32% |
| Colorchecker dE 2000 calibrated * | 0.92 | 1 -9% | ||
| Greyscale dE 2000 * | 3.99 | 1.7 57% | 2.22 44% | 4.6 -15% |
| Gamma | 3.12 71% | 2.11 104% | 2.35 94% | 2.32 95% |
| CCT | 6309 103% | 6384 102% | 6667 97% | 6884 94% |
| Color Space (Percent of AdobeRGB 1998) (%) | 58 | 58.6 1% | 62 7% | 62 7% |
| Color Space (Percent of sRGB) (%) | 93 | 92.9 0% | 97 4% | 97.7 5% |
| Total Average (Program / Settings) | 11% /
14% | -13% /
-2% | -6% /
-1% |
* ... smaller is better
Furthermore, we observed significantly larger color deviations, which combined with the excellent color accuracy after our calibration attempt, suggests that Microsoft may no longer individually calibrate each panel.
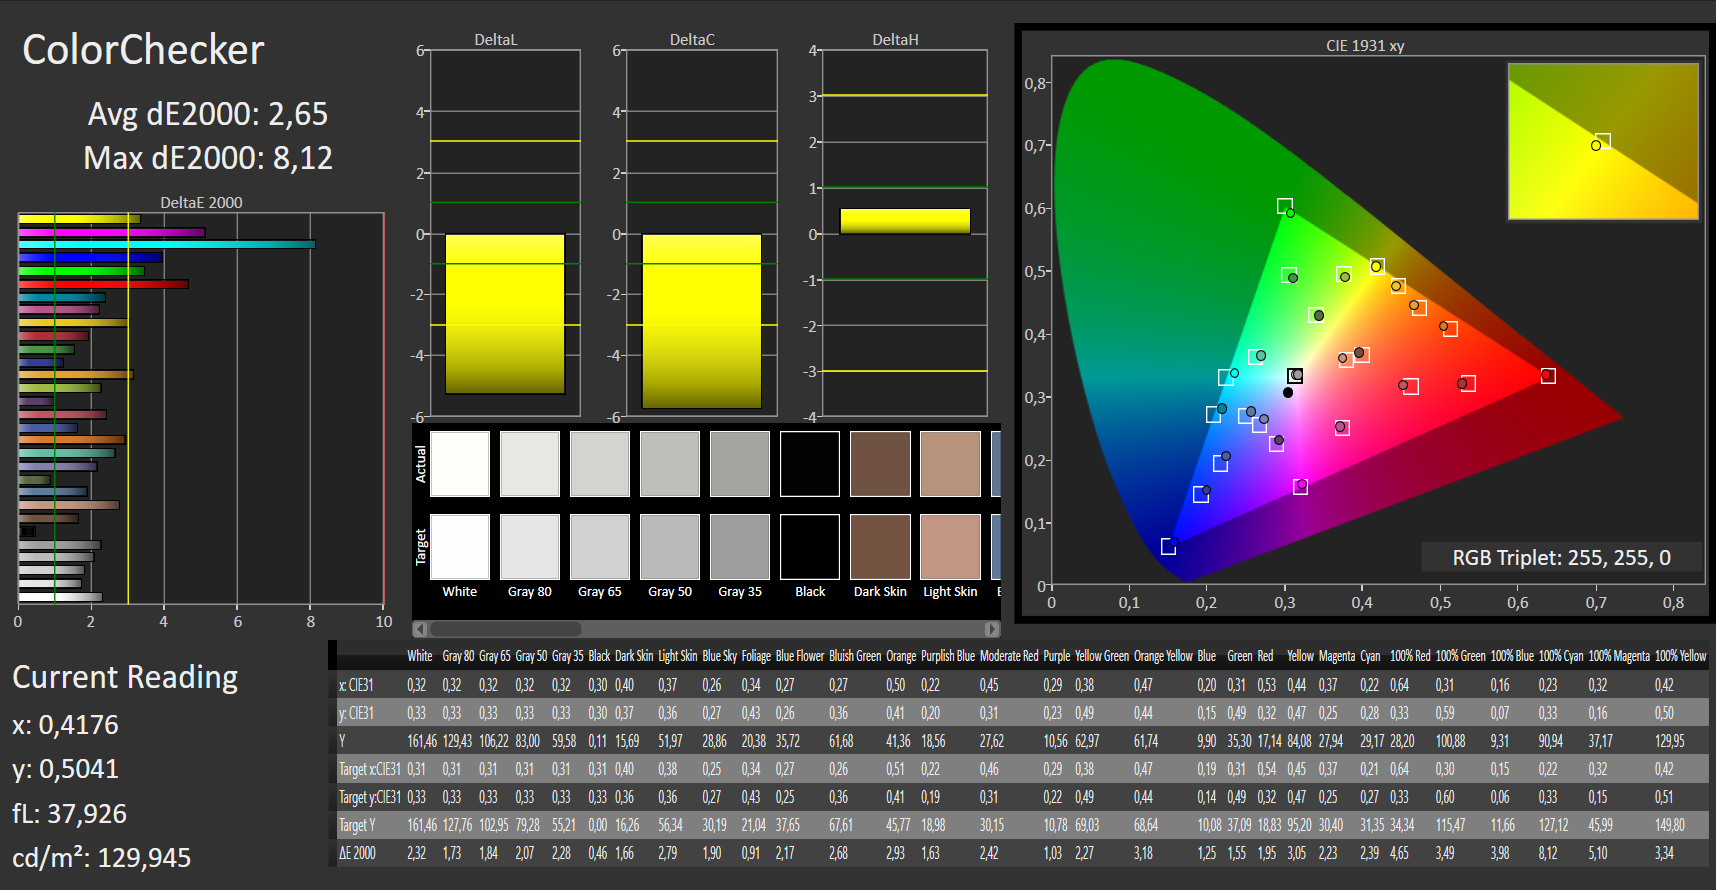
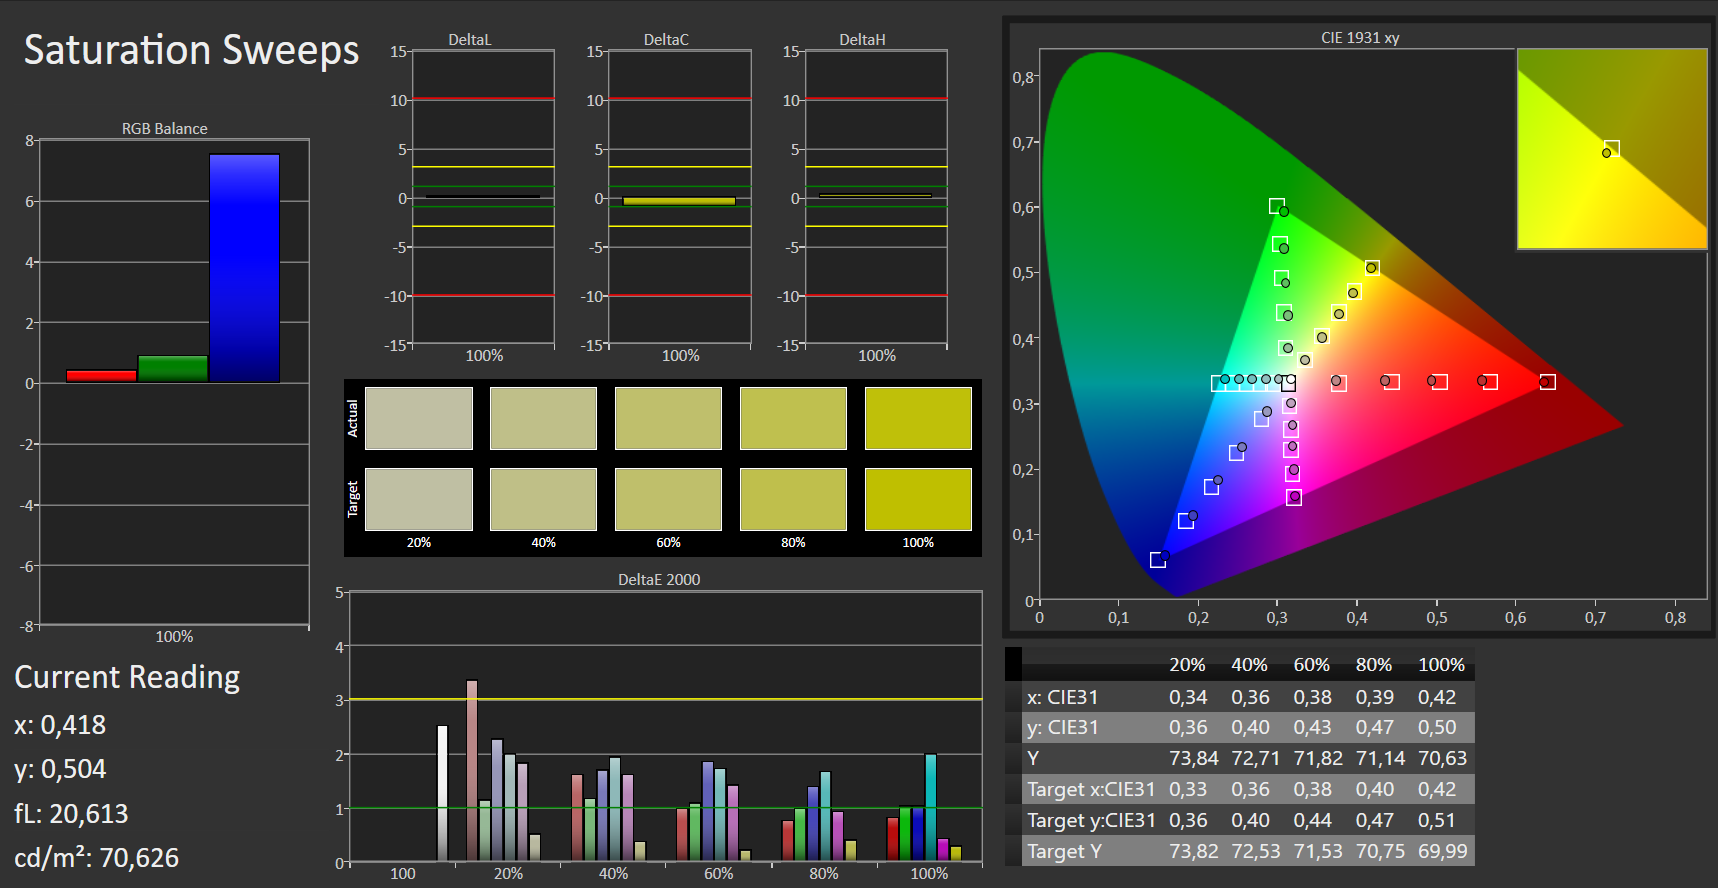
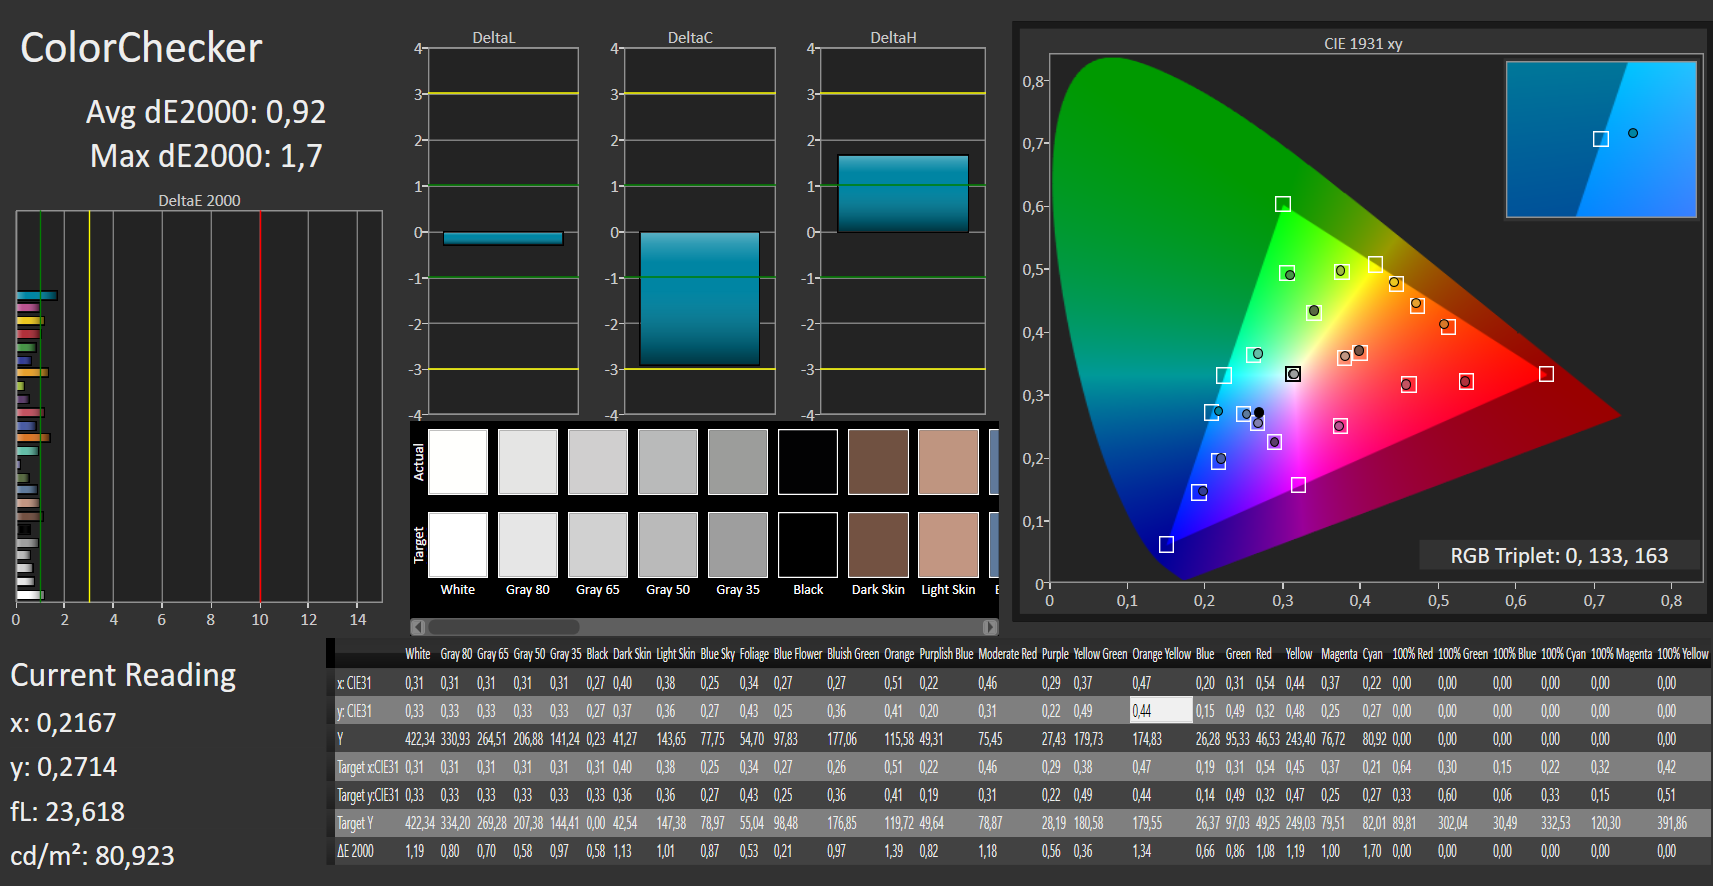
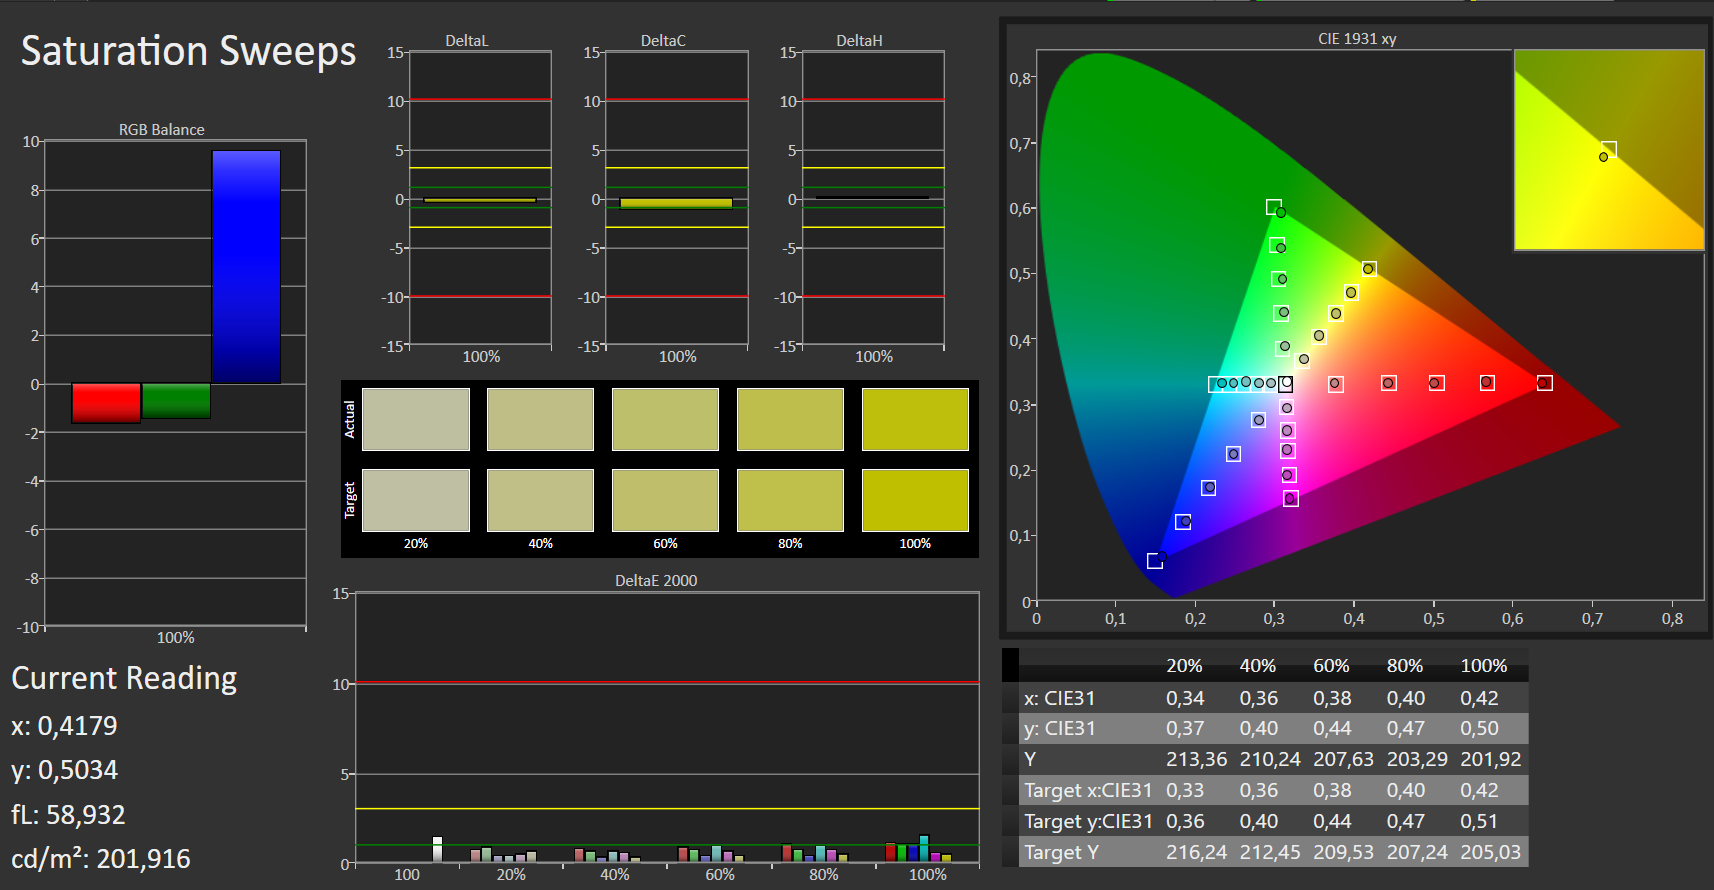
The color gamut has remained almost identical at a near-full sRGB coverage (93%) and a 58% AdobeRGB coverage. Here, both the Asus ZenBook Flip and the Lenovo Yoga manage to beat our test device by a slim margin. That being said, they cannot match the Surface's brightness, black value or contrast ratio.
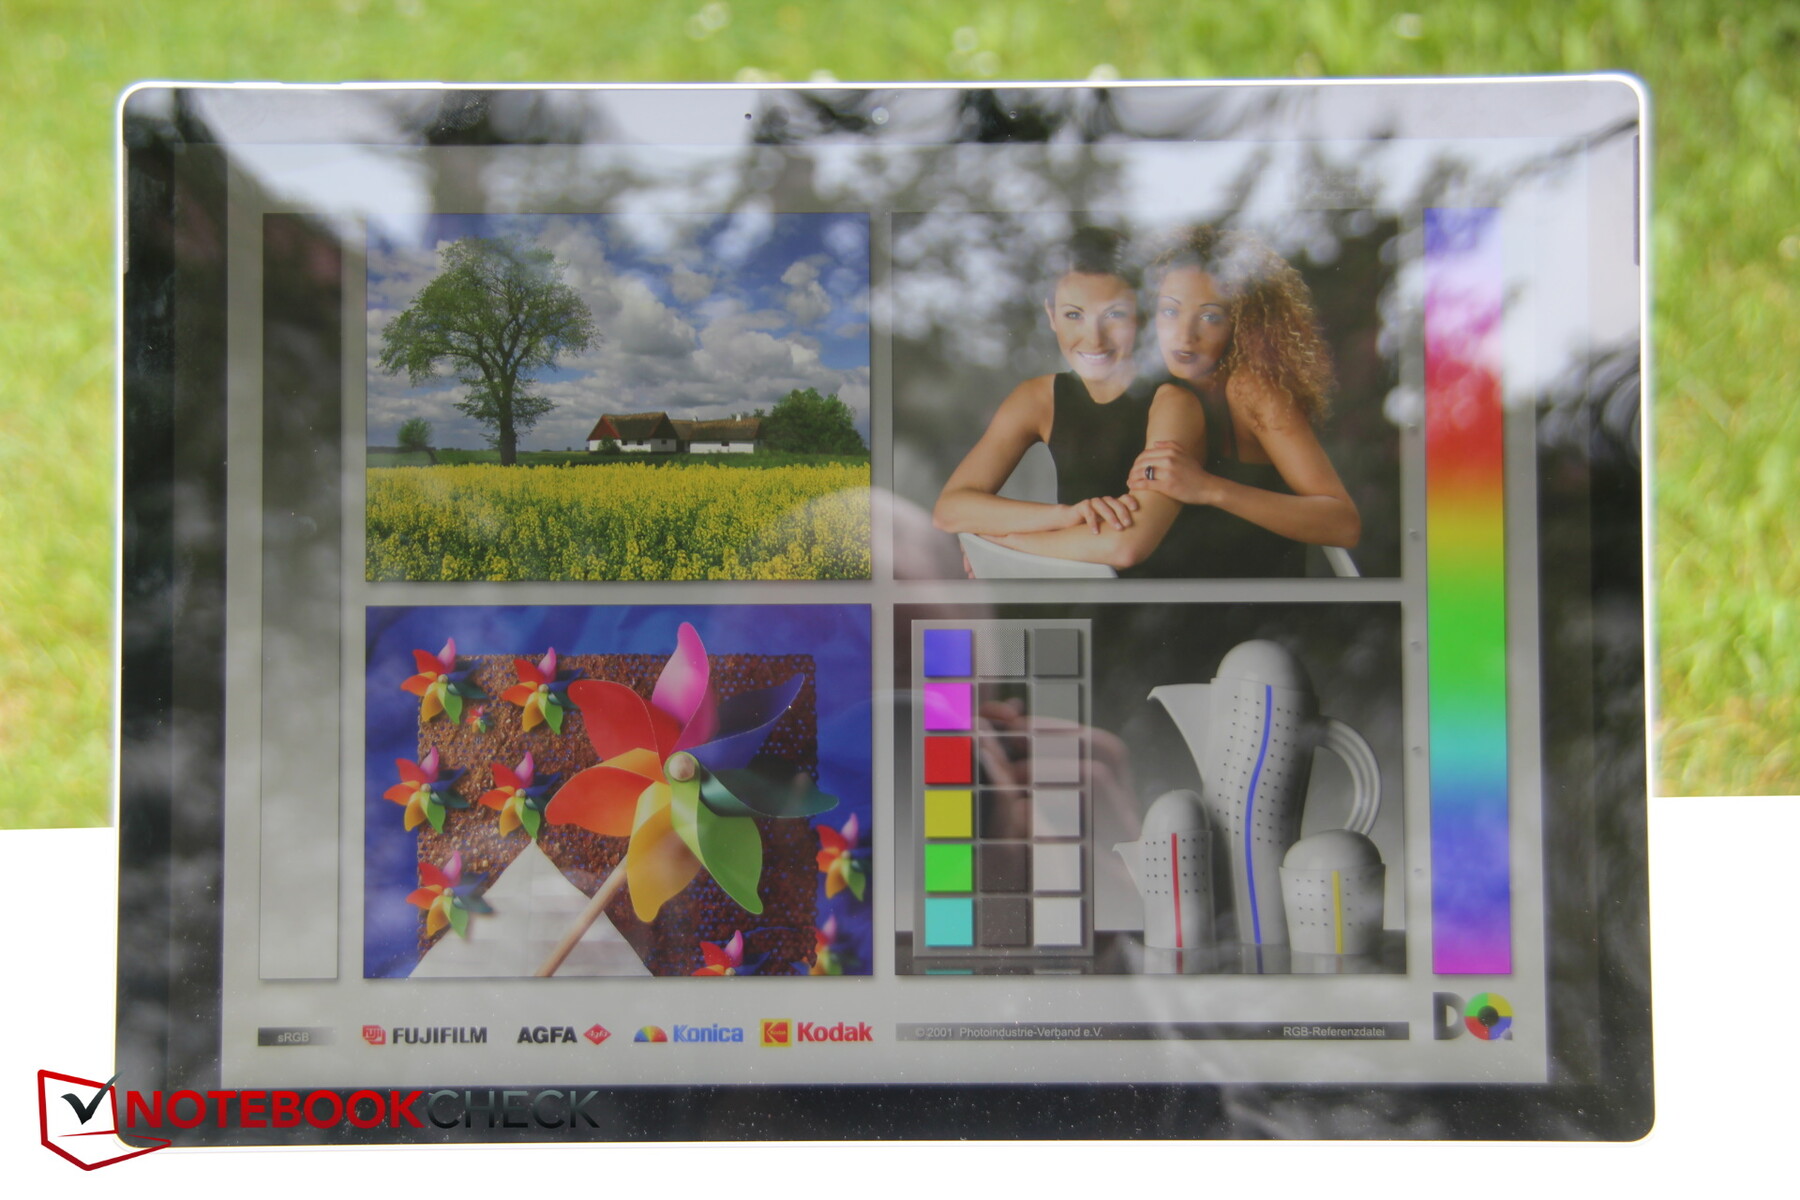
The reflective surface is the only limiting factor for outdoor use. Thankfully, the good brightness and contrast ratio of the screen partially make up for it for a decent outdoor usability. However, the reflections can be distracting.
Display Response Times
| ↔ Response Time Black to White | ||
|---|---|---|
| 25 ms ... rise ↗ and fall ↘ combined | ↗ 15 ms rise | 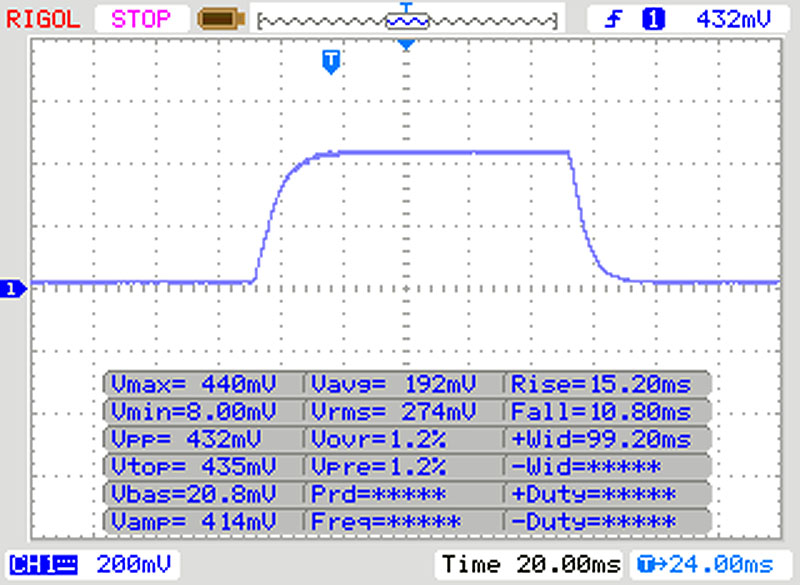 |
| ↘ 10 ms fall | ||
| The screen shows relatively slow response rates in our tests and may be too slow for gamers. In comparison, all tested devices range from 0.1 (minimum) to 240 (maximum) ms. » 59 % of all devices are better. This means that the measured response time is worse than the average of all tested devices (19.8 ms). | ||
| ↔ Response Time 50% Grey to 80% Grey | ||
| 38 ms ... rise ↗ and fall ↘ combined | ↗ 18 ms rise | 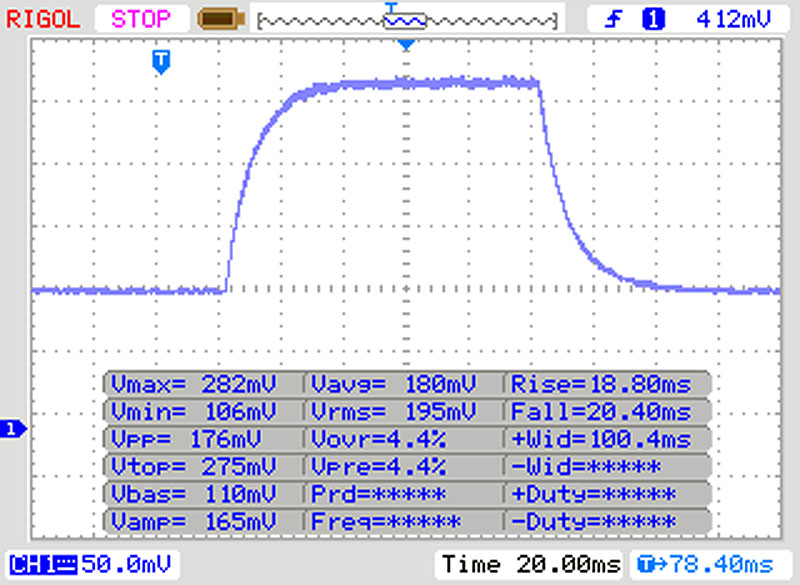 |
| ↘ 20 ms fall | ||
| The screen shows slow response rates in our tests and will be unsatisfactory for gamers. In comparison, all tested devices range from 0.165 (minimum) to 636 (maximum) ms. » 55 % of all devices are better. This means that the measured response time is worse than the average of all tested devices (31 ms). | ||
Screen Flickering / PWM (Pulse-Width Modulation)
| Screen flickering / PWM detected | 250 Hz | ≤ 50 % brightness setting | 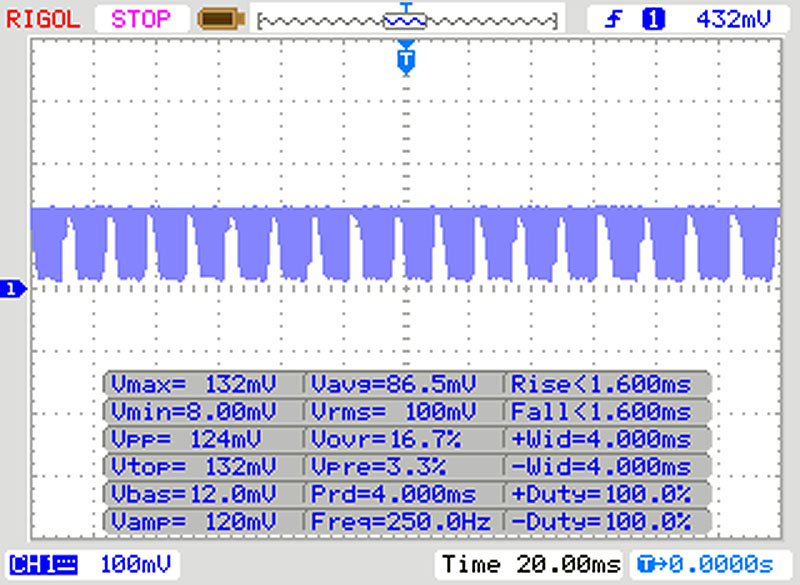 |
The display backlight flickers at 250 Hz (worst case, e.g., utilizing PWM) Flickering detected at a brightness setting of 50 % and below. There should be no flickering or PWM above this brightness setting. The frequency of 250 Hz is relatively low, so sensitive users will likely notice flickering and experience eyestrain at the stated brightness setting and below. In comparison: 52 % of all tested devices do not use PWM to dim the display. If PWM was detected, an average of 7751 (minimum: 5 - maximum: 343500) Hz was measured. | |||
The 4K IPS panel of the Surface Book 3 offers excellent viewing angles. Even when viewing the display from an angle, the vast majority of details remain visible.

Performance - Better than the Surface Book 2?
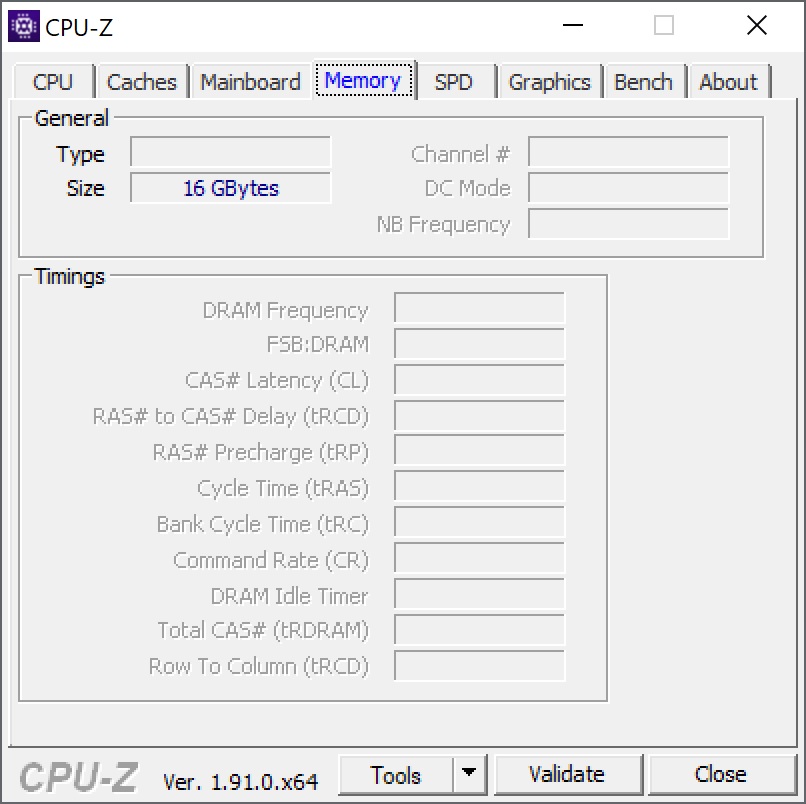
On paper, the Surface Book 3 is very well equipped and should achieve an even higher performance level than its predecessor. Theoretically, the Ice Lake processor, GeForce GTX 1660 Ti Max-Q and 16 GB of RAM should even satisfy gamers. Or as the official Microsoft web page puts it: "Tackle intensive tasks, edit large video files, and enjoy the best gaming experience on a Surface laptop."
While the 15-inch model is limited to the Intel Core i7, the 13.5-inch model can also be configured with a cheaper Core i5. With just 256 GB, the storage capacity of our test model is rather small. However, there are models with 512 GB or even 1 TB of storage space and there is a 32 GB RAM option. The premiums are substantial. The manufacturer demands an additional 450 Euros ($500) for doubling the RAM and storage space to 32/512 GB!
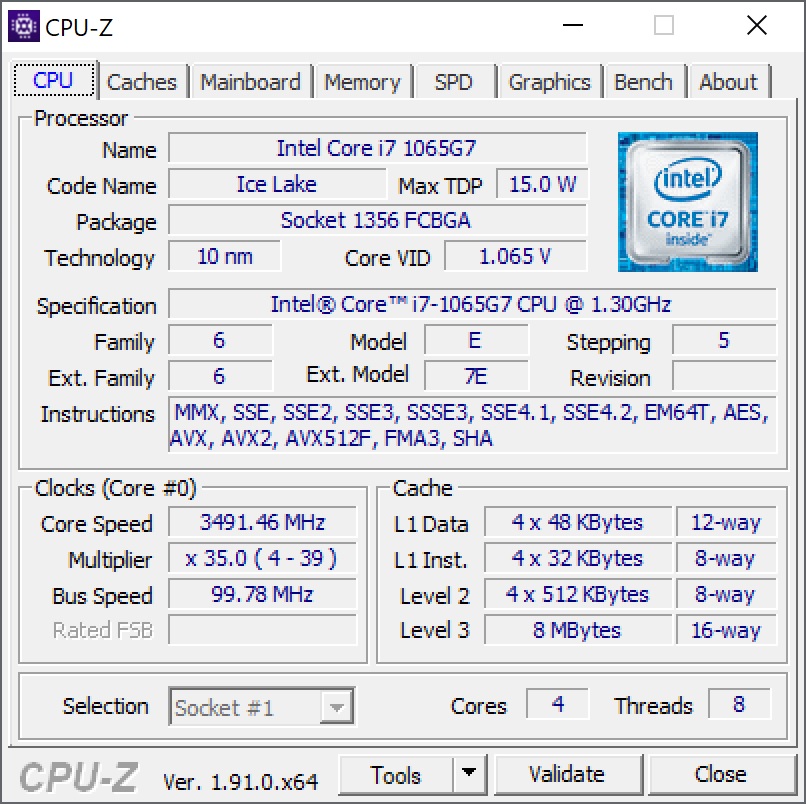
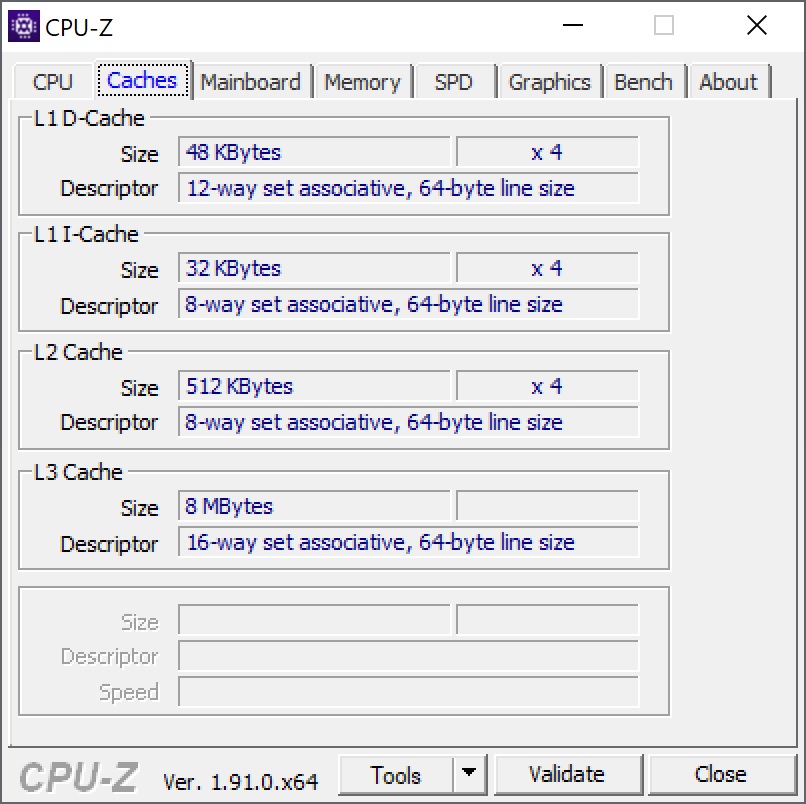
Processor
Our test device features the Ice Lake CPU Intel Core i7-1065G7 with integrated Intel Iris Plus Graphics G7. In spite of its efficiency, this CPU is quite powerful, which makes it a common choice for subnotebooks and convertibles. The clock speeds are very flexible and while the guaranteed base clock speed is only 1.3 GHz, individual cores can boost to up to 3.9 GHz.
To quickly summarize in advance: The current Surface Book generation makes no big strides in terms of the CPU performance and its Core i7-8650U-based predecessor tends to achieve similar or even greater results. Similarly, the Surface Book 2 also offers faster short-term performance. Even the Lenovo Yoga, which is equipped with the same processor, performs better in the Cinebench loop, demonstrating the inability of our test device to fully exploit the CPU's potential. However, this only applies to the Cinebench R15 multi-core test. By contrast, the processor's results in the single-core and the Cinebench R20 multi-core benchmarks match our expectations. The overall performance level across all tests is very similar to our reference Core i7-1065G7 device.
In battery mode, the laptop's Cinebench R15 score only drops by about 5%.
Cinebench R15: CPU Single 64Bit | CPU Multi 64Bit
Blender: v2.79 BMW27 CPU
7-Zip 18.03: 7z b 4 -mmt1 | 7z b 4
Geekbench 5.5: Single-Core | Multi-Core
HWBOT x265 Benchmark v2.2: 4k Preset
LibreOffice : 20 Documents To PDF
R Benchmark 2.5: Overall mean
| Cinebench R20 / CPU (Single Core) | |
| Average of class Convertible (273 - 834, n=49, last 2 years) | |
| Asus ZenBook Flip 15 UX563FD-A1027T | |
| Apple MacBook Pro 15 2019 i9 Vega 20 | |
| Microsoft Surface Book 3 15 | |
| Average Intel Core i7-1065G7 (358 - 474, n=31) | |
| Cinebench R20 / CPU (Multi Core) | |
| Average of class Convertible (595 - 12102, n=49, last 2 years) | |
| Apple MacBook Pro 15 2019 i9 Vega 20 | |
| Asus ZenBook Flip 15 UX563FD-A1027T | |
| Average Intel Core i7-1065G7 (1081 - 2024, n=31) | |
| Microsoft Surface Book 3 15 | |
| Cinebench R15 / CPU Single 64Bit | |
| Average of class Convertible (149.8 - 317, n=48, last 2 years) | |
| Asus ZenBook Flip 15 UX563FD-A1027T | |
| Apple MacBook Pro 15 2019 i9 Vega 20 | |
| Microsoft Surface Book 3 15 | |
| Lenovo Yoga C940-14IIL | |
| Microsoft Surface Book 2 15 | |
| Average Intel Core i7-1065G7 (141 - 190, n=35) | |
| Cinebench R15 / CPU Multi 64Bit | |
| Average of class Convertible (478 - 4940, n=48, last 2 years) | |
| Apple MacBook Pro 15 2019 i9 Vega 20 | |
| Asus ZenBook Flip 15 UX563FD-A1027T | |
| Lenovo Yoga C940-14IIL | |
| Lenovo Yoga C940-14IIL | |
| Microsoft Surface Book 2 15 | |
| Microsoft Surface Book 2 15 | |
| Microsoft Surface Book 2 15 | |
| Average Intel Core i7-1065G7 (288 - 836, n=36) | |
| Microsoft Surface Book 3 15 | |
| Blender / v2.79 BMW27 CPU | |
| Average Intel Core i7-1065G7 (675 - 1650, n=23) | |
| Microsoft Surface Book 3 15 | |
| Lenovo Yoga C940-14IIL | |
| Average of class Convertible (105 - 1051, n=48, last 2 years) | |
| 7-Zip 18.03 / 7z b 4 -mmt1 | |
| Average of class Convertible (3672 - 6655, n=48, last 2 years) | |
| Lenovo Yoga C940-14IIL | |
| Microsoft Surface Book 3 15 | |
| Average Intel Core i7-1065G7 (3289 - 4589, n=24) | |
| 7-Zip 18.03 / 7z b 4 | |
| Average of class Convertible (12977 - 121368, n=48, last 2 years) | |
| Lenovo Yoga C940-14IIL | |
| Microsoft Surface Book 3 15 | |
| Average Intel Core i7-1065G7 (10406 - 22898, n=24) | |
| Geekbench 5.5 / Single-Core | |
| Average of class Convertible (806 - 2275, n=48, last 2 years) | |
| Microsoft Surface Book 3 15 | |
| Asus ZenBook Flip 15 UX563FD-A1027T | |
| Average Intel Core i7-1065G7 (948 - 1348, n=18) | |
| Geekbench 5.5 / Multi-Core | |
| Average of class Convertible (1608 - 22023, n=48, last 2 years) | |
| Microsoft Surface Book 3 15 | |
| Asus ZenBook Flip 15 UX563FD-A1027T | |
| Average Intel Core i7-1065G7 (2464 - 4855, n=18) | |
| HWBOT x265 Benchmark v2.2 / 4k Preset | |
| Average of class Convertible (3.43 - 36.2, n=48, last 2 years) | |
| Lenovo Yoga C940-14IIL | |
| Average Intel Core i7-1065G7 (2.2 - 6.38, n=22) | |
| Microsoft Surface Book 3 15 | |
| LibreOffice / 20 Documents To PDF | |
| Microsoft Surface Book 3 15 | |
| Average Intel Core i7-1065G7 (46.9 - 85.3, n=19) | |
| Average of class Convertible (42.5 - 84.3, n=48, last 2 years) | |
| R Benchmark 2.5 / Overall mean | |
| Average Intel Core i7-1065G7 (0.661 - 0.798, n=18) | |
| Microsoft Surface Book 3 15 | |
| Average of class Convertible (0.3915 - 0.84, n=48, last 2 years) | |
* ... smaller is better
System Performance
Although the system performance is good, it is by no means better than that of the previous model. While the performance varies during the individual tests of the devices in our comparison, the performances of the Surface Book 2 and 3 are comparable with slight advantages for the former (PCMark 8). The Lenovo Yoga is equipped with the same processor and achieves about 15% faster performance.
| PCMark 8 Home Score Accelerated v2 | 3382 points | |
| PCMark 8 Work Score Accelerated v2 | 4415 points | |
| PCMark 10 Score | 4317 points | |
Help | ||
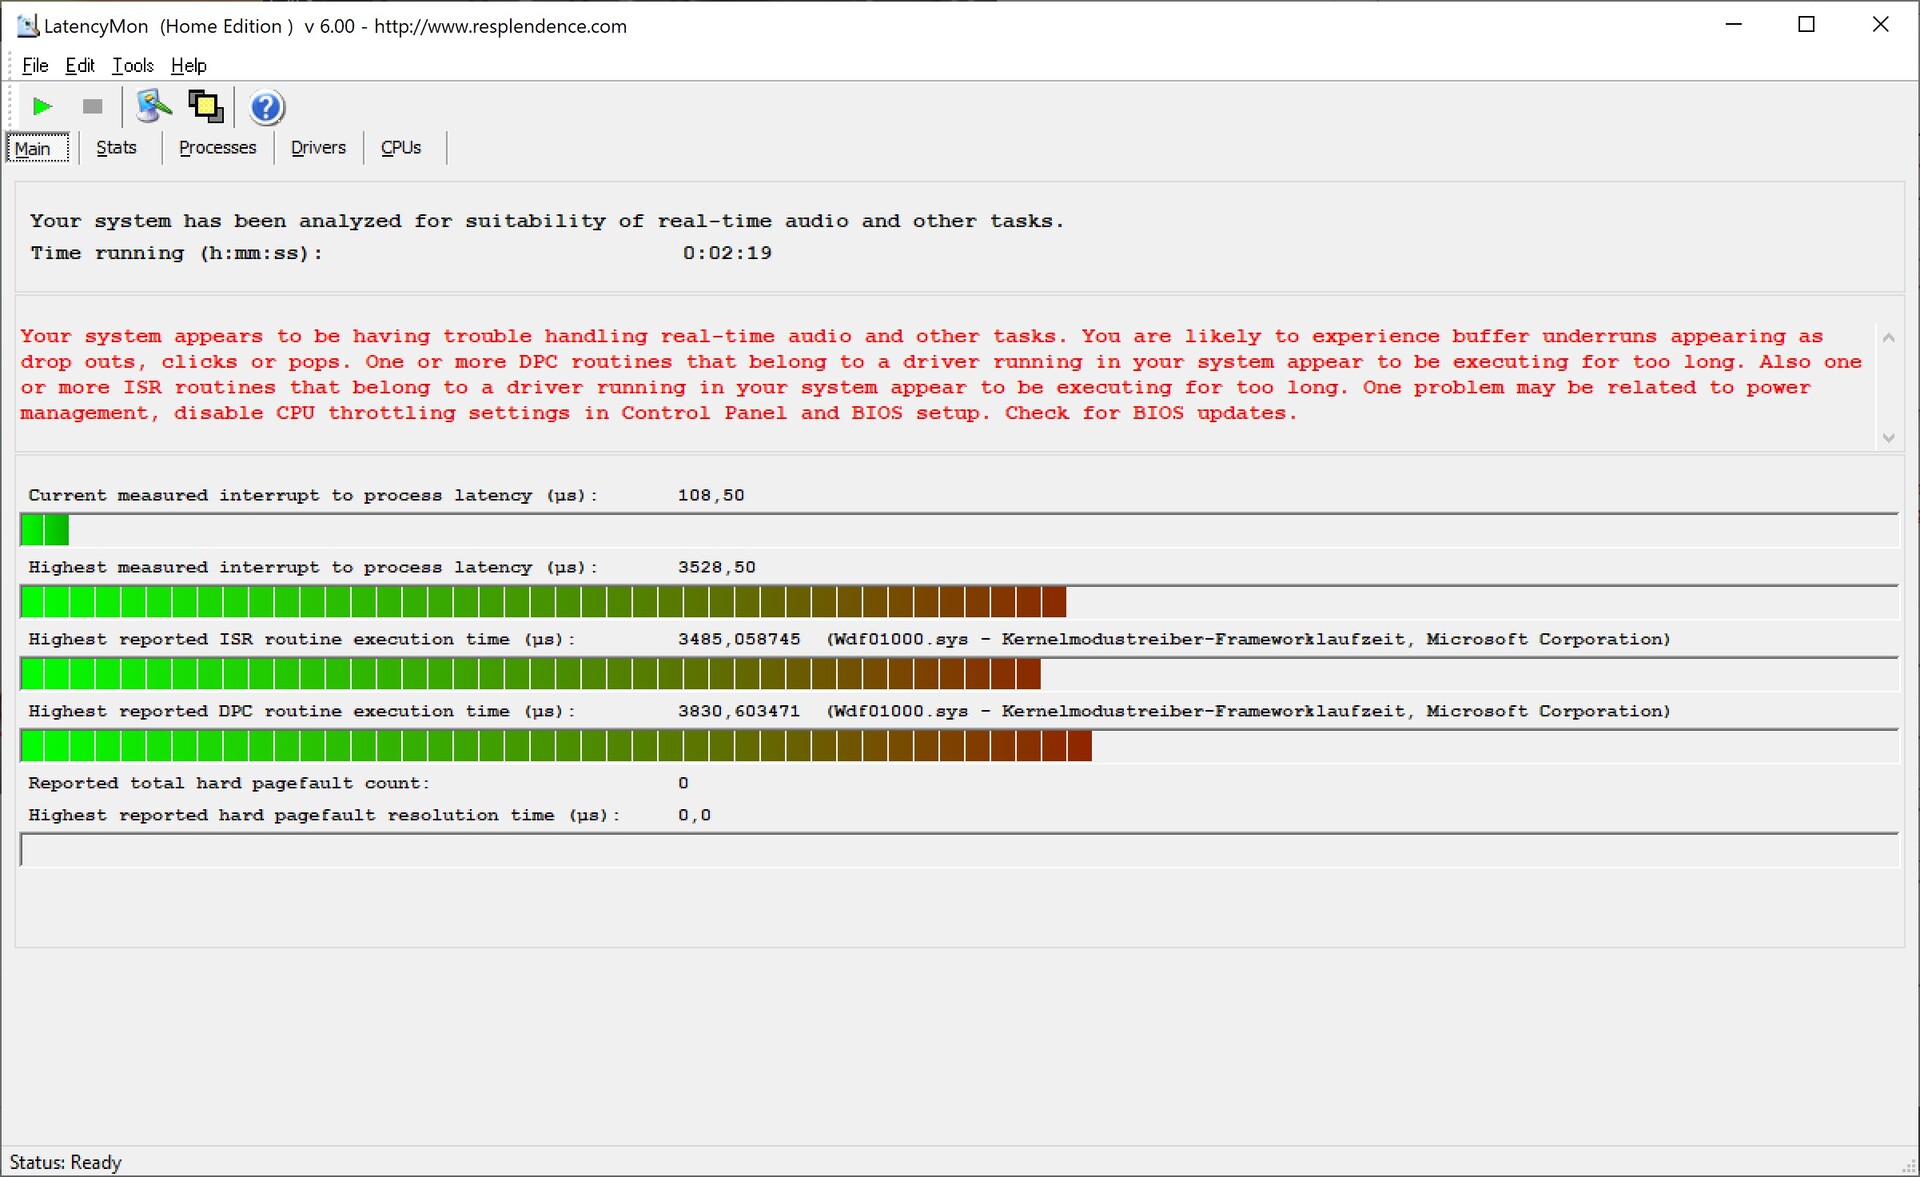
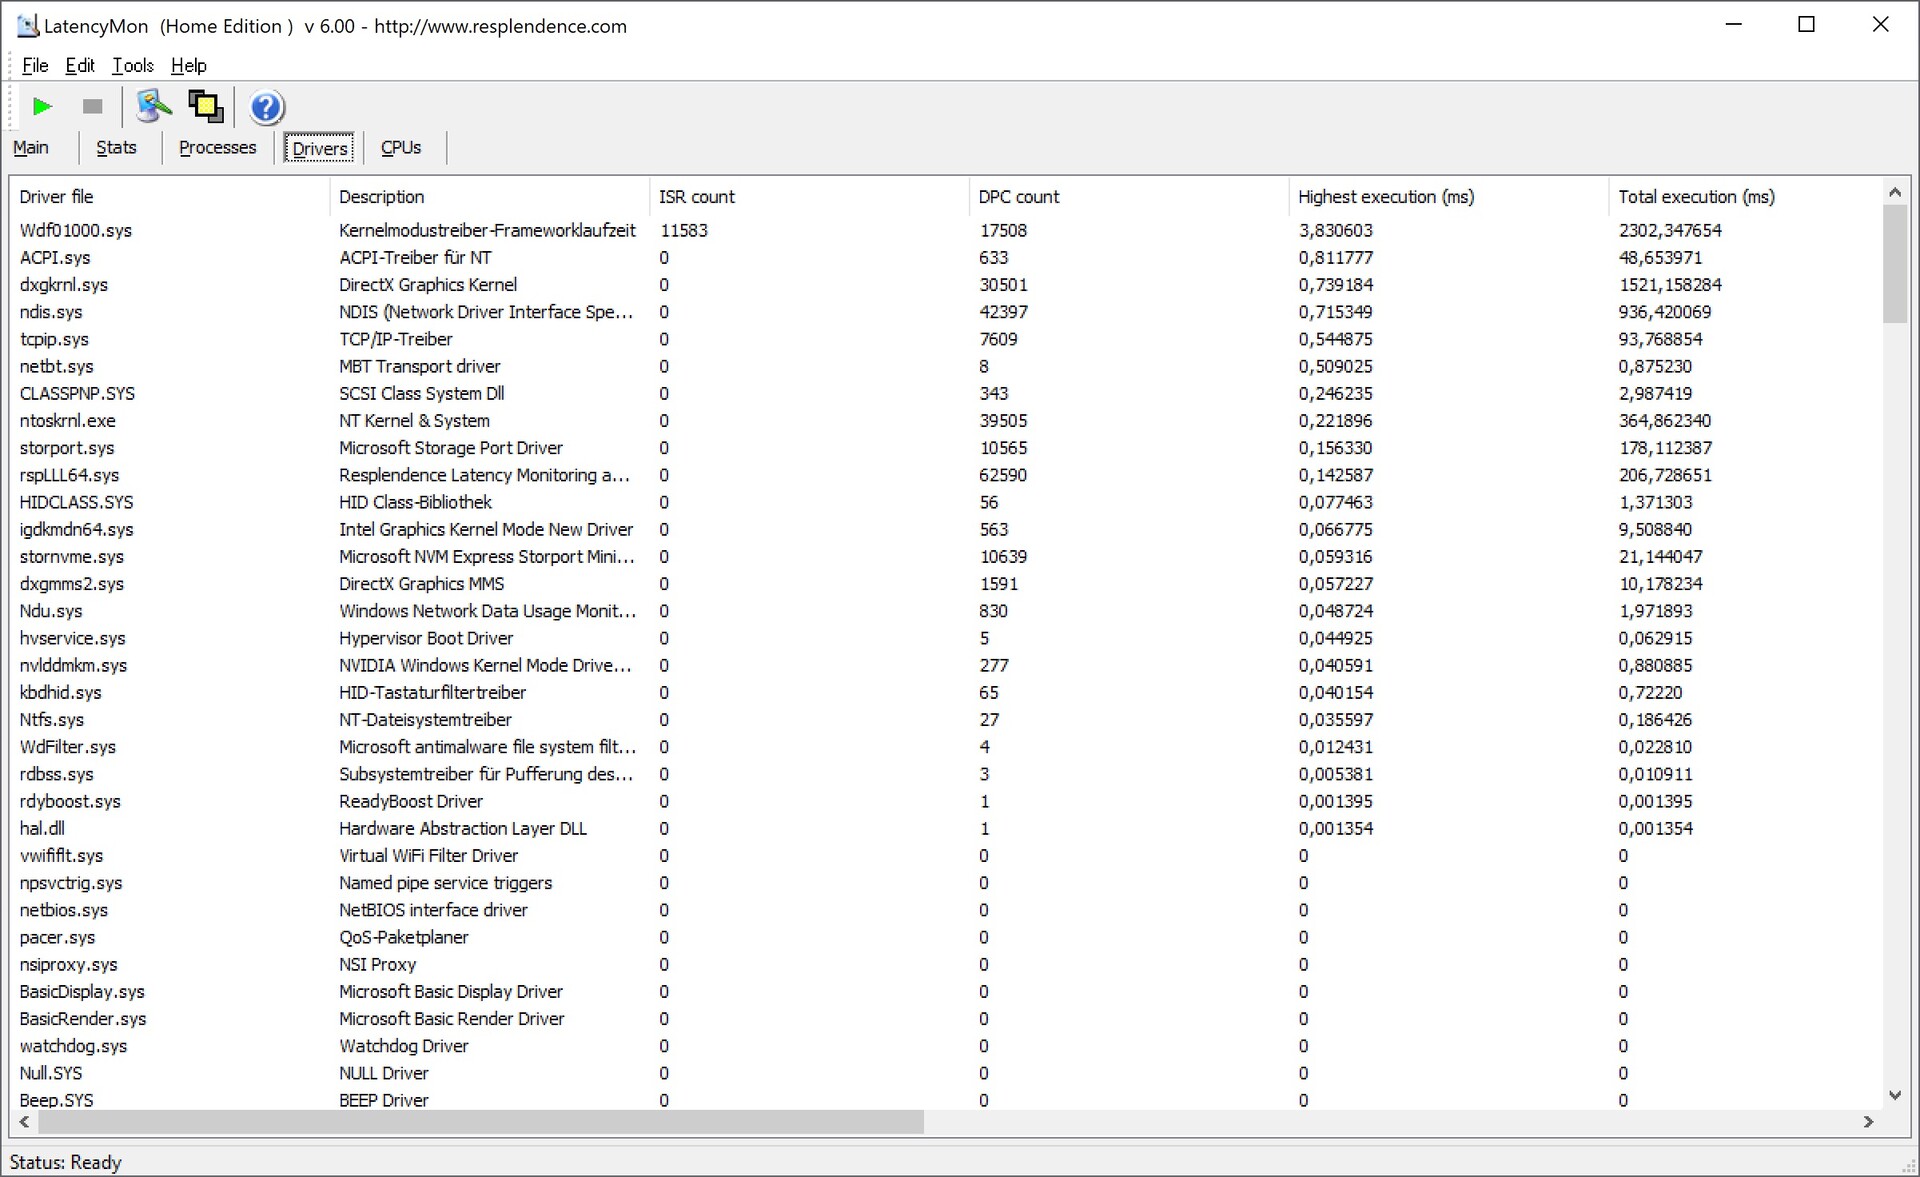
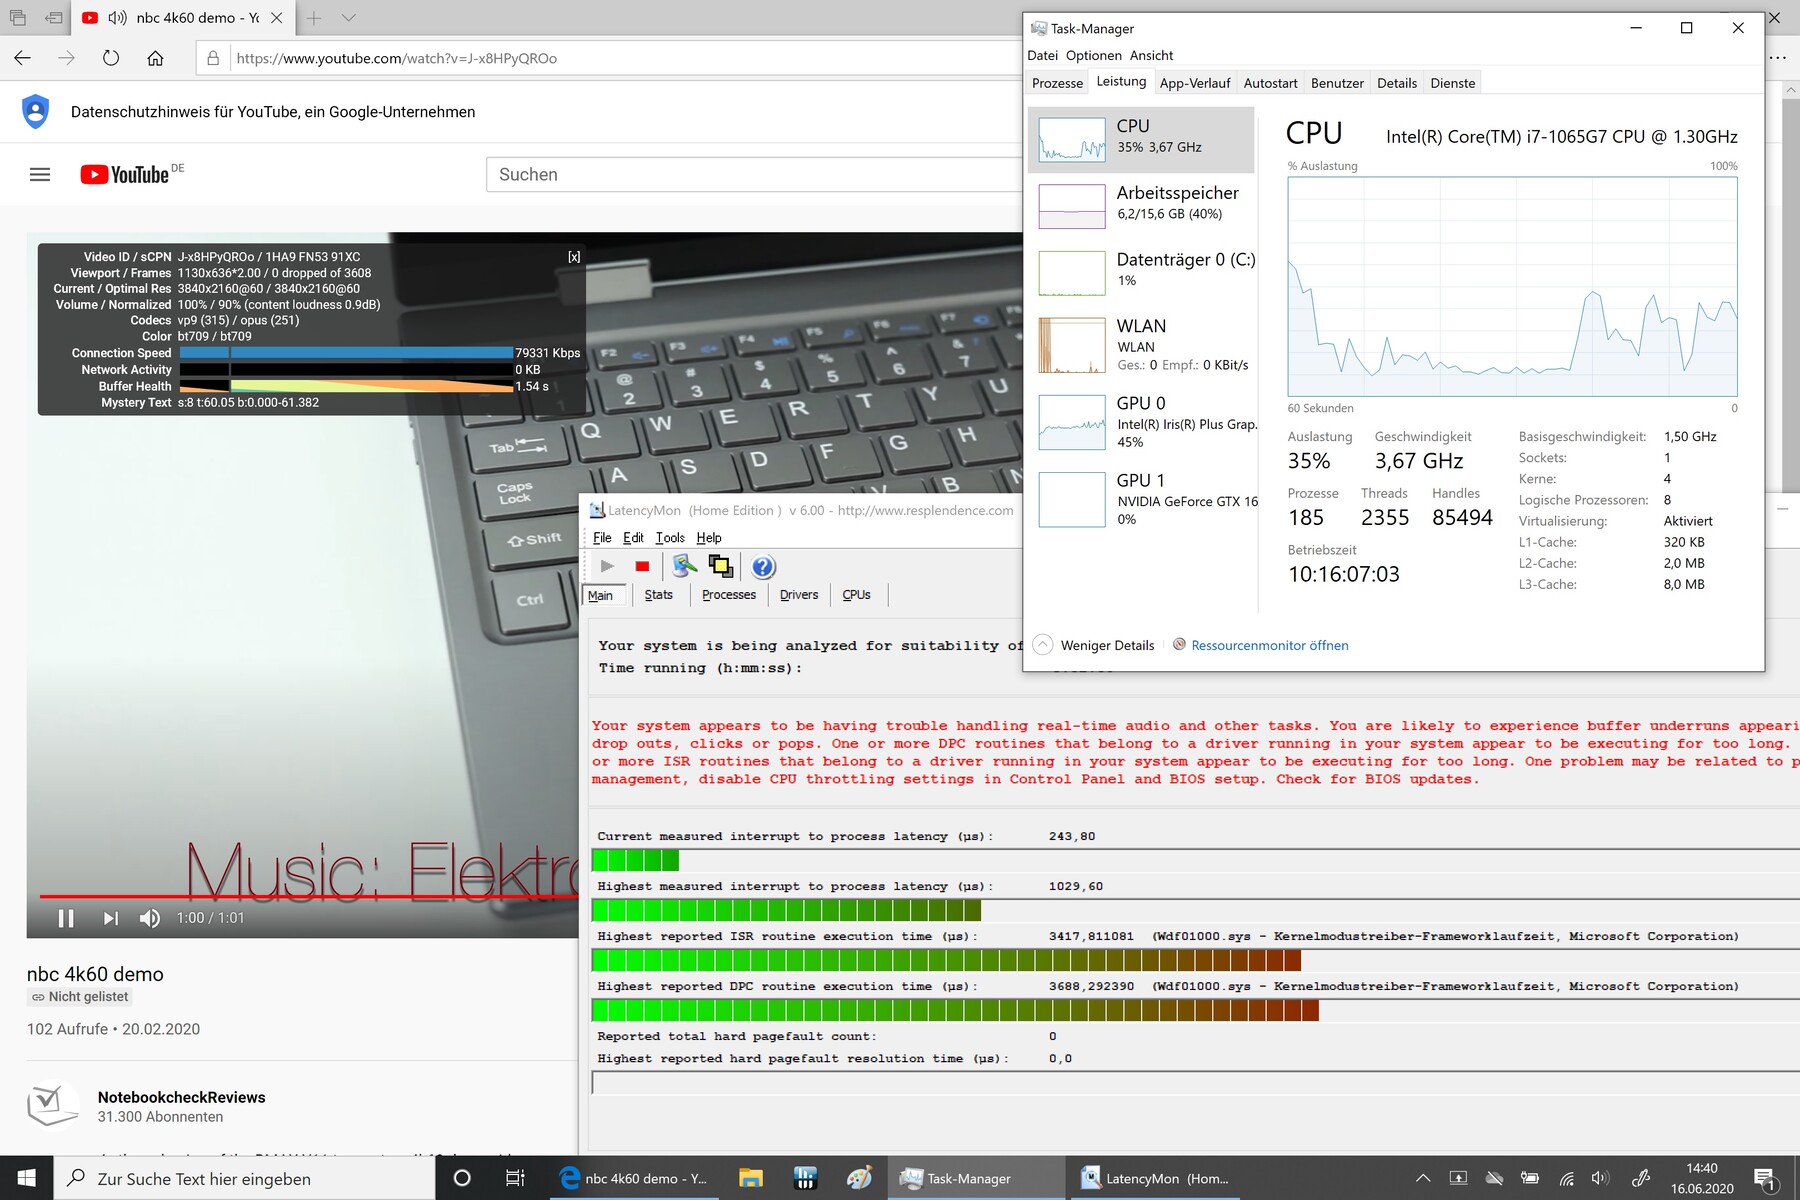
DPC Latencies
We encountered driver issues during our tests with the LatencyMon tool. Microsoft's kernel mode driver framework runtime appears to cause issues that may result in disruptive latencies during use.
| DPC Latencies / LatencyMon - interrupt to process latency (max), Web, Youtube, Prime95 | |
| Microsoft Surface Book 3 15 | |
* ... smaller is better
Storage Solution
Microsoft has replaced the fast Samsung PM961 with a 256-GB SK Hynix BC501. Our SSD/HDD benchmark table contains detailed measurements of both storage drives for comparison. While the SK Hynix SSD occupies the 218th spot, the Samsung model comes in at the 28th spot for a noticeable performance difference. Compared to the SSD within the Surface Book 2, the new OS drive is significantly slower and the Surface Book 3's competition tends to implement significantly faster solutions as well. Microsoft's decision to use a cheaper SSD strikes us as odd.
Although variants with 512 GB or even 1 TB are also available, the price gaps are very big and it is unclear whether Microsoft uses models from other manufacturers in these higher-end configurations.
| Microsoft Surface Book 3 15 SK hynix BC501 HFM256GDGTNG | Microsoft Surface Book 2 Samsung PM961 MZVLW256HEHP | Asus ZenBook Flip 15 UX563FD-A1027T Samsung SSD PM981 MZVLB1T0HALR | Lenovo Yoga C940-14IIL Samsung SSD PM981 MZVLB512HAJQ | Average SK hynix BC501 HFM256GDGTNG | |
|---|---|---|---|---|---|
| CrystalDiskMark 5.2 / 6 | 19% | 98% | 101% | 5% | |
| Write 4K (MB/s) | 87.4 | 140.6 61% | 137.8 58% | 128.4 47% | 96.6 ? 11% |
| Read 4K (MB/s) | 38.14 | 43.62 14% | 44.15 16% | 46.37 22% | 39.1 ? 3% |
| Write Seq (MB/s) | 610 | 343.3 -44% | 2073 240% | 1863 205% | 637 ? 4% |
| Read Seq (MB/s) | 1029 | 1452 41% | 2165 110% | 2340 127% | 1032 ? 0% |
| Write 4K Q32T1 (MB/s) | 280.3 | 344.4 23% | 431.9 54% | 451.1 61% | 303 ? 8% |
| Read 4K Q32T1 (MB/s) | 259.6 | 457.2 76% | 427.7 65% | 415.3 60% | 298 ? 15% |
| Write Seq Q32T1 (MB/s) | 829 | 344.3 -58% | 2253 172% | 2985 260% | 822 ? -1% |
| Read Seq Q32T1 (MB/s) | 2037 | 2885 42% | 3480 71% | 2565 26% | 2030 ? 0% |
| Write 4K Q8T8 (MB/s) | 451.4 | ||||
| Read 4K Q8T8 (MB/s) | 1004 | ||||
| AS SSD | 113% | 123% | -11% | ||
| Seq Read (MB/s) | 1625 | 2739 69% | 2525 55% | 1370 ? -16% | |
| Seq Write (MB/s) | 461.3 | 1307 183% | 1253 172% | 493 ? 7% | |
| 4K Read (MB/s) | 37.2 | 47.43 27% | 59.1 59% | 38.2 ? 3% | |
| 4K Write (MB/s) | 100.9 | 126 25% | 134.1 33% | 104 ? 3% | |
| 4K-64 Read (MB/s) | 501 | 1013 102% | 1010 102% | 493 ? -2% | |
| 4K-64 Write (MB/s) | 311.7 | 1371 340% | 1461 369% | 339 ? 9% | |
| Access Time Read * (ms) | 0.072 | 0.082 -14% | 0.052 28% | 0.06 ? 17% | |
| Access Time Write * (ms) | 0.036 | 0.029 19% | 0.029 19% | 0.086 ? -139% | |
| Score Read (Points) | 701 | 1335 90% | 1322 89% | 669 ? -5% | |
| Score Write (Points) | 459 | 1628 255% | 1721 275% | 493 ? 7% | |
| Score Total (Points) | 1470 | 3582 144% | 3670 150% | 1471 ? 0% | |
| Copy ISO MB/s (MB/s) | 1931 | 2016 | 786 ? | ||
| Copy Program MB/s (MB/s) | 457.9 | 542 | 252 ? | ||
| Copy Game MB/s (MB/s) | 1242 | 1278 | 376 ? | ||
| Total Average (Program / Settings) | 19% /
19% | 106% /
107% | 112% /
114% | -3% /
-4% |
* ... smaller is better

Dauerleistung Lesen: DiskSpd Read Loop, Queue Depth 8
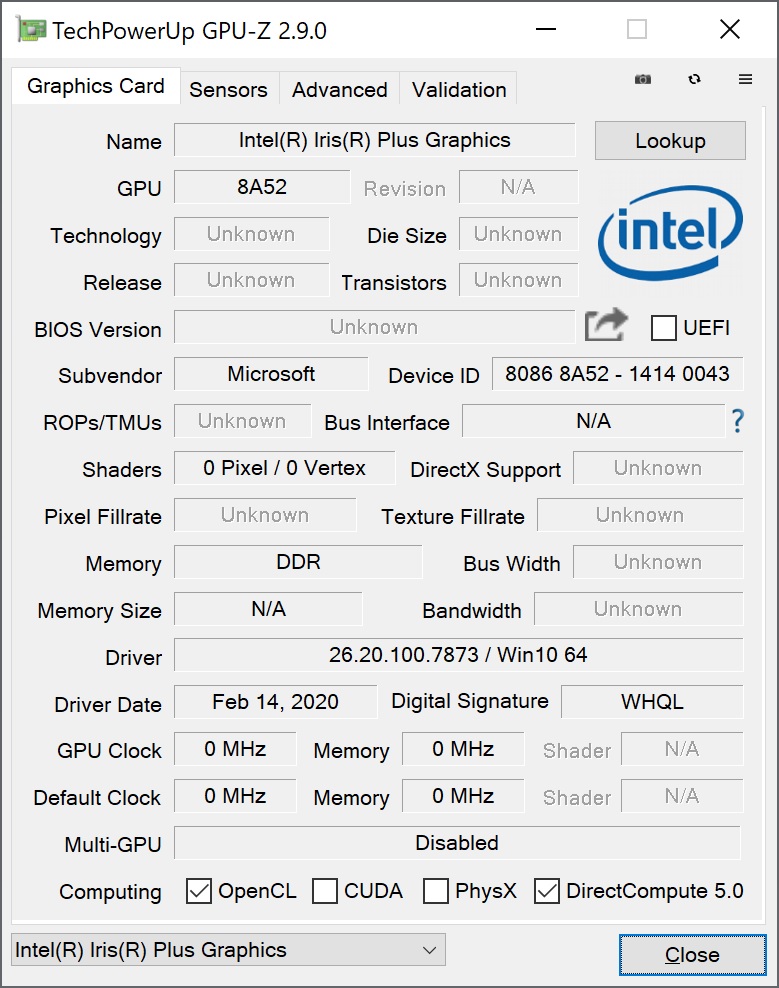
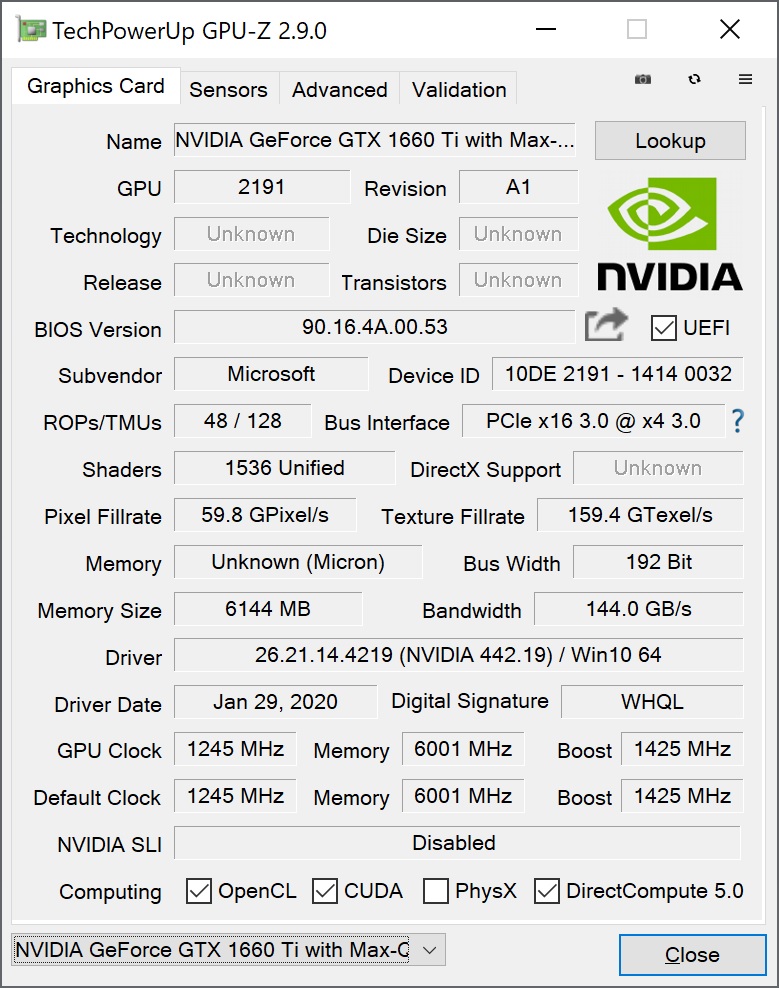
GPU Performance
Despite being equipped with the strongest integrated Intel graphics card Iris Plus Graphics G7, the Surface also comes with a dedicated GPU, the Nvidia GeForce GTX 1660 Ti Max-Q. It is hidden within the base unit of the Surface Book. While its slightly lower clock speeds make it more economical, they also result in ~15% slower performance compared to a normal GeForce GTX 1660 Ti.
The results of the synthetic 3DMark tests match our expectations for a GTX 1660 Ti fairly precisely and only the Fire Strike benchmark produces a severe outlier. Relative to the previous model, which is equipped with the GTX 1060, it offers around 20-30% faster performance.
With a deficit of about 17%, the GPU performance decreases even further in battery mode.
| 3DMark 11 Performance | 14387 points | |
| 3DMark Cloud Gate Standard Score | 16807 points | |
| 3DMark Fire Strike Score | 10103 points | |
| 3DMark Time Spy Score | 4820 points | |
Help | ||
Gaming Performance
While the performance results in the synthetic tests match our expectations, the results of our gaming tests unfortunately do not. In The Witcher 3, the Surface Book 3 performs about 10% to 25% worse than an average GTX 1660 Ti Max-Q. At least, the gap becomes smaller at higher resolutions and quality settings. At Full HD resolution, The Witcher 3 can even be played at maximum settings. At the Surface's native 4K resolution however, it tends to struggle when it comes to more-demanding titles (The Witcher 3, Far Cry 5) and the limited performance then also becomes apparent. Although the average frame rate in Battlefield V promises smooth 4K gaming, micro stutters adversely affect the gameplay.
Even though 4K gaming may be out of reach, the Surface is still well suited to gaming overall. Due to the slower SSD, users may experience longer loading times.
Detaching the tablet unit incurs a two-fold performance decrease: On the one hand, the tablet then permanently operates in battery mode, since it can only be charged through the base unit, and on the other hand, it loses access to the dedicated GPU and the integrated Intel G7 graphics becomes active, which is significantly weaker. For example: In Far Cry 5, the tablet only reaches 19 FPS at the lowest settings compared to 68 FPS and particularly the lack of dedicated VRAM becomes apparent.
| Battlefield V | |
| 1280x720 Low Preset | |
| Average NVIDIA GeForce GTX 1660 Ti Max-Q (94.3 - 152, n=3) | |
| Microsoft Surface Book 3 15 | |
| Lenovo Yoga C940-14IIL | |
| 1920x1080 Medium Preset | |
| Average NVIDIA GeForce GTX 1660 Ti Max-Q (74.6 - 102.6, n=3) | |
| Microsoft Surface Book 3 15 | |
| Lenovo Yoga C940-14IIL | |
| 1920x1080 High Preset | |
| Average NVIDIA GeForce GTX 1660 Ti Max-Q (65.9 - 92.2, n=3) | |
| Microsoft Surface Book 3 15 | |
| Lenovo Yoga C940-14IIL | |
| 1920x1080 Ultra Preset | |
| Microsoft Surface Book 3 15 | |
| Average NVIDIA GeForce GTX 1660 Ti Max-Q (61 - 85, n=3) | |
| 3840x2160 Ultra Preset | |
| Microsoft Surface Book 3 15 | |
| Average NVIDIA GeForce GTX 1660 Ti Max-Q (n=1) | |
The performance in our The Witcher 3 loop is mostly consistent and the graphics performance of the convertible only marginally drops over time.
| low | med. | high | ultra | 4K | |
|---|---|---|---|---|---|
| The Witcher 3 (2015) | 144.5 | 111.4 | 64.4 | 44.8 | 30.9 |
| Dota 2 Reborn (2015) | 113 | 102.1 | 93.8 | 86.3 | |
| X-Plane 11.11 (2018) | 68.8 | 62.9 | 55.4 | ||
| Far Cry 5 (2018) | 68 | 54 | 53 | 50 | 30 |
| Battlefield V (2018) | 94.3 | 82.9 | 77.5 | 73 | 37.9 |
Emissions - Quieter, but Warmer than its Predecessor
System Noise
Microsoft has managed to reduce the fan noise further. While idling, the fans tend to stand still and the fan noise of the convertible barely exceeds the ambient noise level even under medium load for a total improvement of 16% compared to the previous model. Under maximum load, the fan noise drops from 45 dB (Surface Book 2) to just 34 dB - incredible! The only device that is able to achieve similar results is the Lenovo Yoga, although it has no dedicated graphics card.
Noise level
| Idle |
| 30.2 / 30.2 / 30.2 dB(A) |
| Load |
| 30.9 / 34.3 dB(A) |
 | ||
30 dB silent 40 dB(A) audible 50 dB(A) loud |
||
min: | ||
| Microsoft Surface Book 3 15 GeForce GTX 1660 Ti Max-Q, i7-1065G7, SK hynix BC501 HFM256GDGTNG | Microsoft Surface Book 2 15 GeForce GTX 1060 Mobile, i7-8650U, Samsung PM961 MZVLW256HEHP | Asus ZenBook Flip 15 UX563FD-A1027T GeForce GTX 1050 Max-Q, i7-10510U, Samsung SSD PM981 MZVLB1T0HALR | Lenovo Yoga C940-14IIL Iris Plus Graphics G7 (Ice Lake 64 EU), i7-1065G7, Samsung SSD PM981 MZVLB512HAJQ | |
|---|---|---|---|---|
| Noise | -5% | -1% | 1% | |
| off / environment * (dB) | 30.2 | 29.1 4% | 30.3 -0% | 29.3 3% |
| Idle Minimum * (dB) | 30.2 | 29.1 4% | 30.3 -0% | 29.3 3% |
| Idle Average * (dB) | 30.2 | 29.1 4% | 30.3 -0% | 29.3 3% |
| Idle Maximum * (dB) | 30.2 | 29.1 4% | 30.3 -0% | 29.3 3% |
| Load Average * (dB) | 30.9 | 35.7 -16% | 33.7 -9% | 33.3 -8% |
| Witcher 3 ultra * (dB) | 45.1 | 37.4 17% | ||
| Load Maximum * (dB) | 34.3 | 45.3 -32% | 38.9 -13% | 33.3 3% |
* ... smaller is better
Temperature
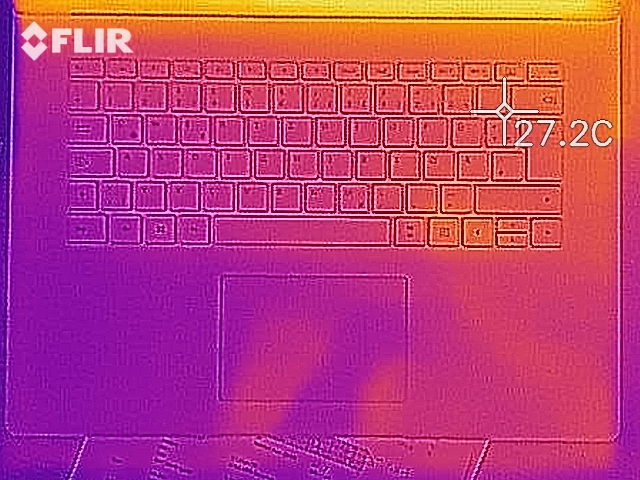
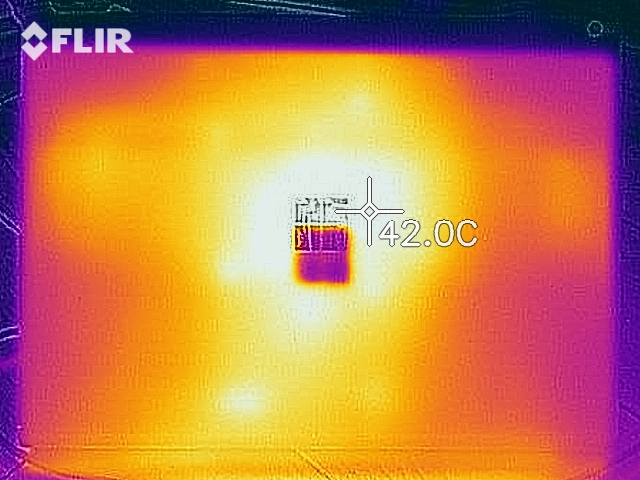
The results of our temperature measurements are mixed. While the heat development under load has slightly decreased, the idle temperatures have increased significantly. The tablet unit in particular becomes warm to the touch even during fairly undemanding workloads.
| Microsoft Surface Book 3 15 GeForce GTX 1660 Ti Max-Q, i7-1065G7, SK hynix BC501 HFM256GDGTNG | Microsoft Surface Book 2 15 GeForce GTX 1060 Mobile, i7-8650U, Samsung PM961 MZVLW256HEHP | Asus ZenBook Flip 15 UX563FD-A1027T GeForce GTX 1050 Max-Q, i7-10510U, Samsung SSD PM981 MZVLB1T0HALR | Lenovo Yoga C940-14IIL Iris Plus Graphics G7 (Ice Lake 64 EU), i7-1065G7, Samsung SSD PM981 MZVLB512HAJQ | |
|---|---|---|---|---|
| Heat | 7% | 7% | 9% | |
| Maximum Upper Side * (°C) | 41.4 | 43.5 -5% | 42.6 -3% | 41 1% |
| Maximum Bottom * (°C) | 39.7 | 42.7 -8% | 41.5 -5% | 44.6 -12% |
| Idle Upper Side * (°C) | 34.6 | 28.4 18% | 26.4 24% | 24.4 29% |
| Idle Bottom * (°C) | 30.3 | 23.7 22% | 26.3 13% | 25 17% |
* ... smaller is better
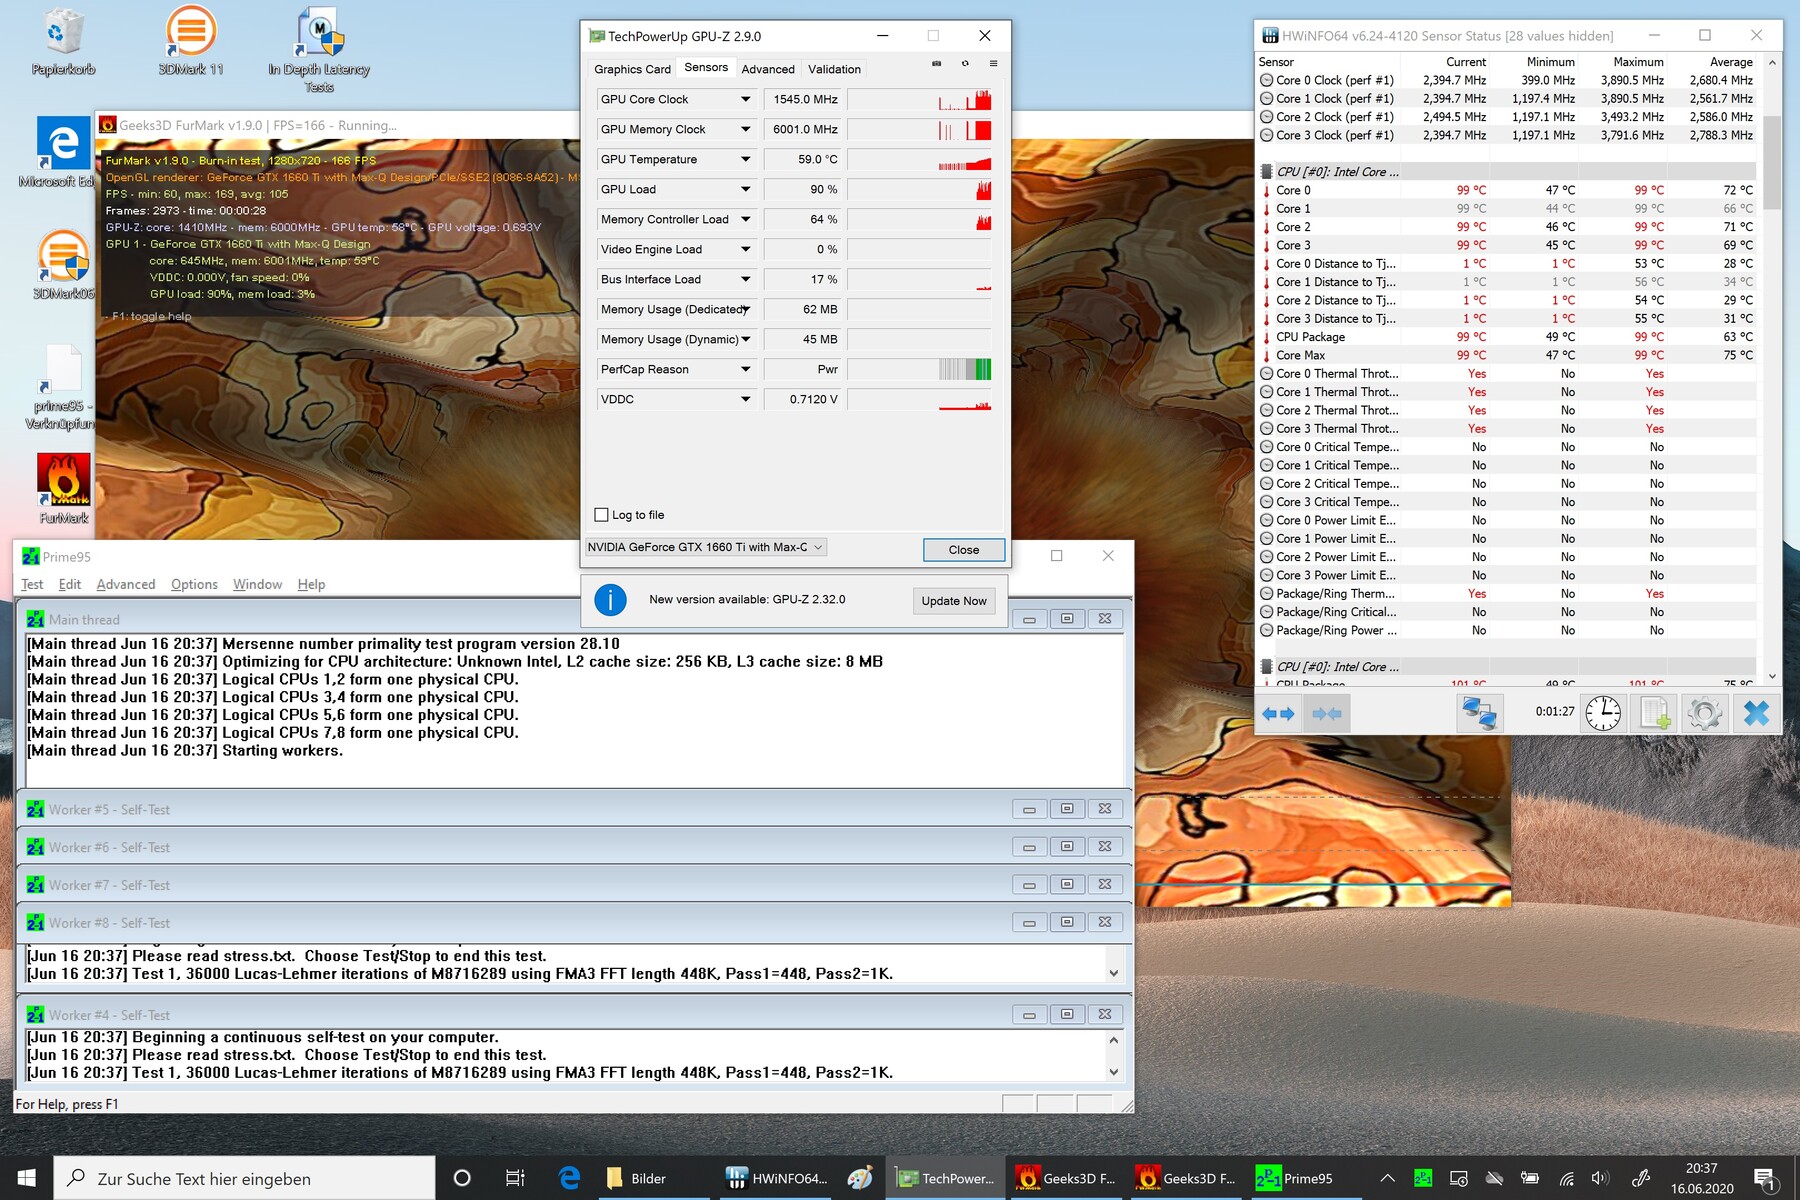
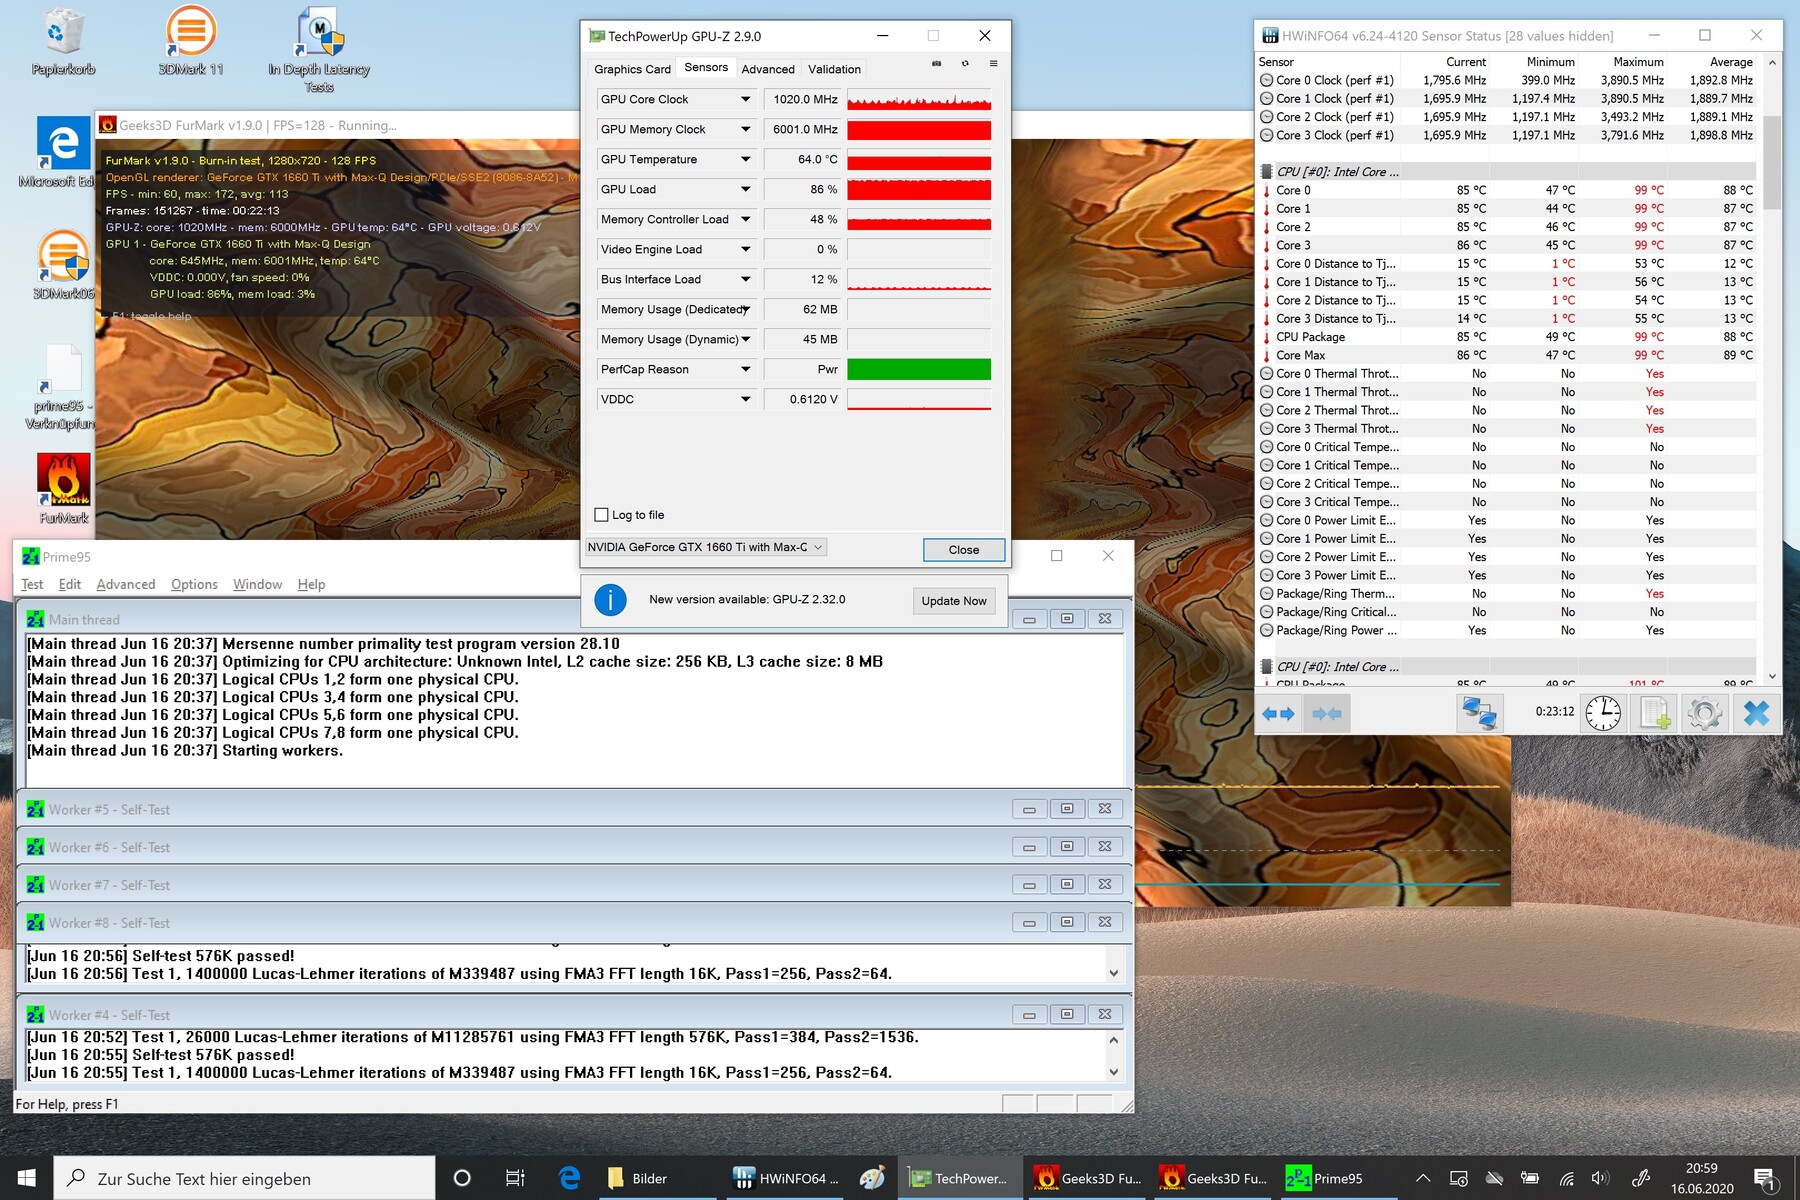
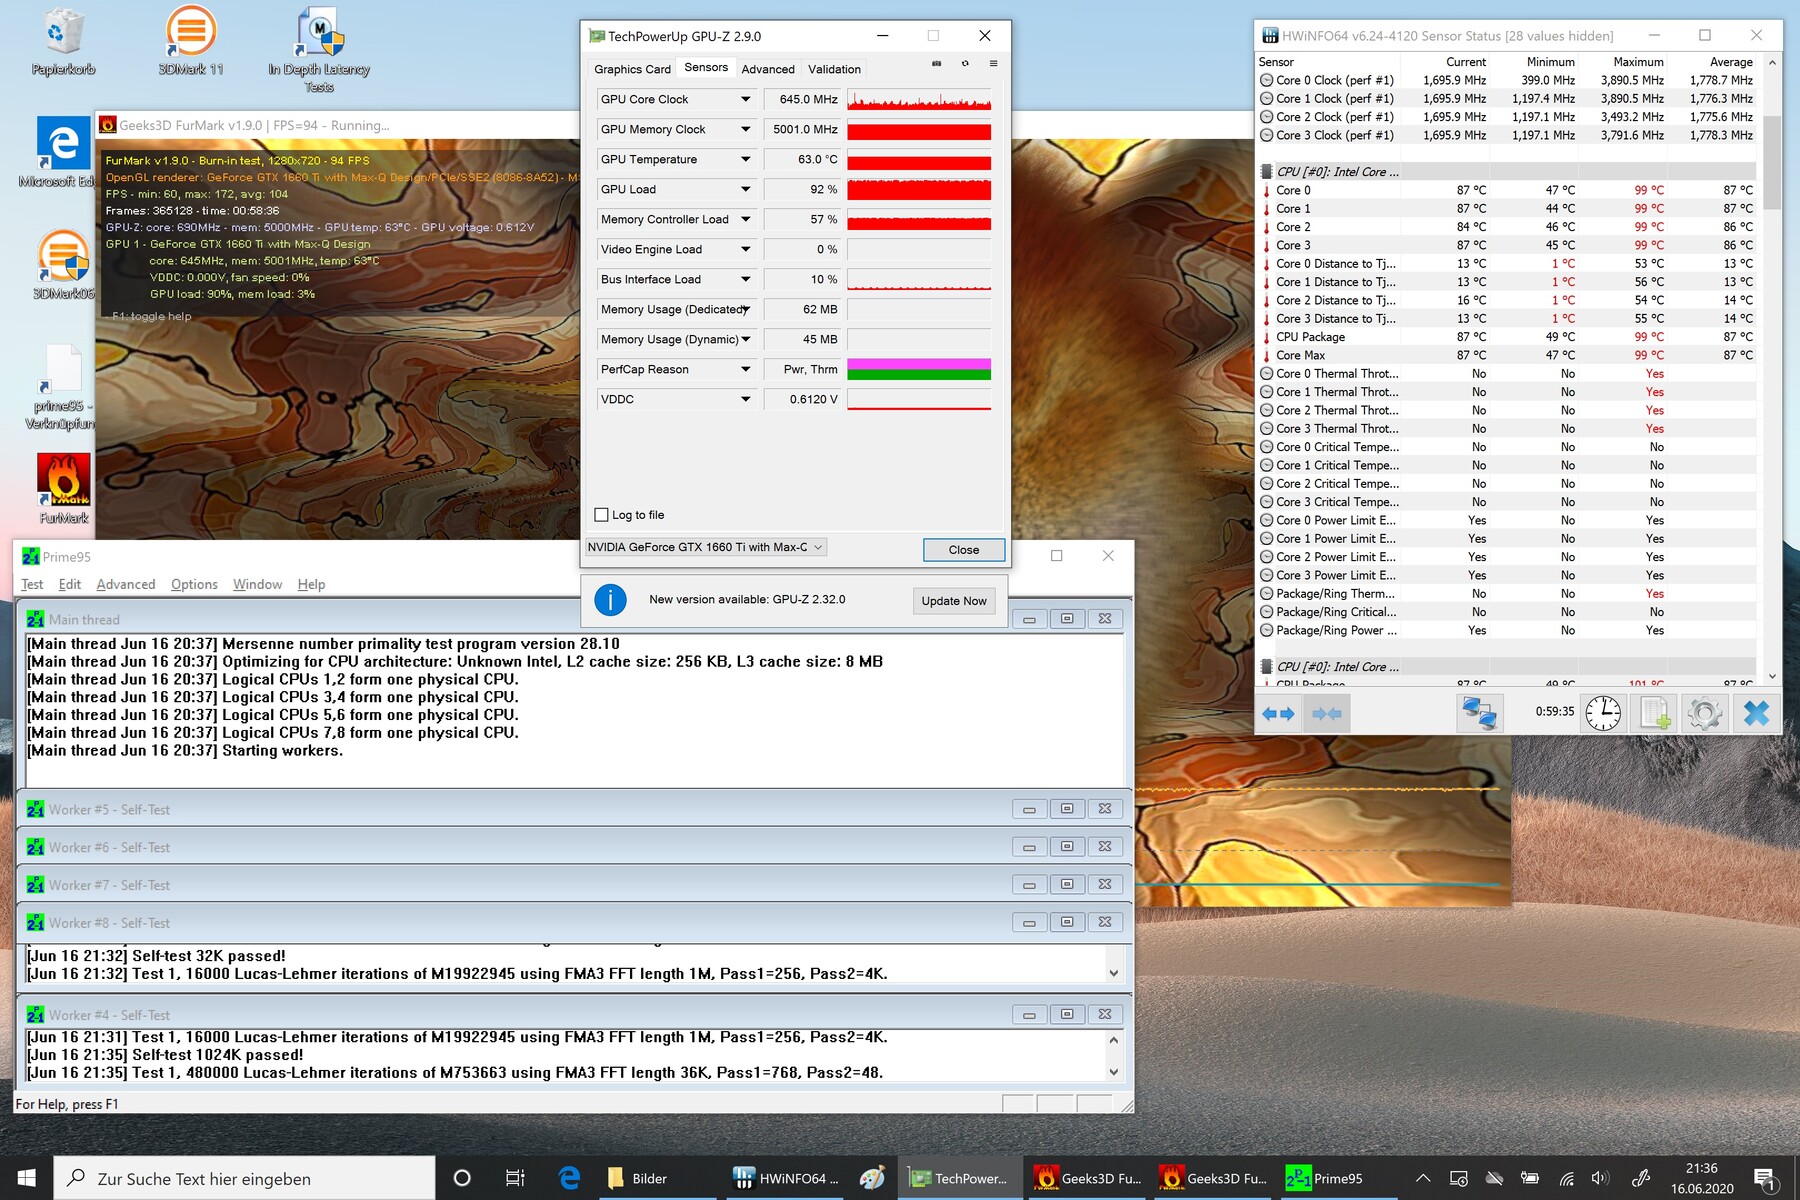
Our stress test consists of running Prime95 and FurMark simultaneously for one hour. After an initial spike to around 2.4 GHz, the CPU clock rates stabilize at around 1.7 GHz after 10 to 20 minutes. The GPU performance drops slower with the inital clock speed of 1.5 GHz dropping to 1 GHz after 20 minutes and to just 645 MHz at the end of the test.
While the temperatures of the GPU hit a maximum of just 64 °C, the reported CPU core temperatures are surprising and likely a visual bug. Our test starts while the convertible is idling and the temperature of all CPU cores immediately jumps to 99 °C. According to the application, they later stabilize at around 85-87 °C. This shows that there are temperature trade-offs for powerful hardware in a thin tablet chassis with quiet fans.
A second run of 3DMark 11 immediately after the stress test showed no performance disadvantages.
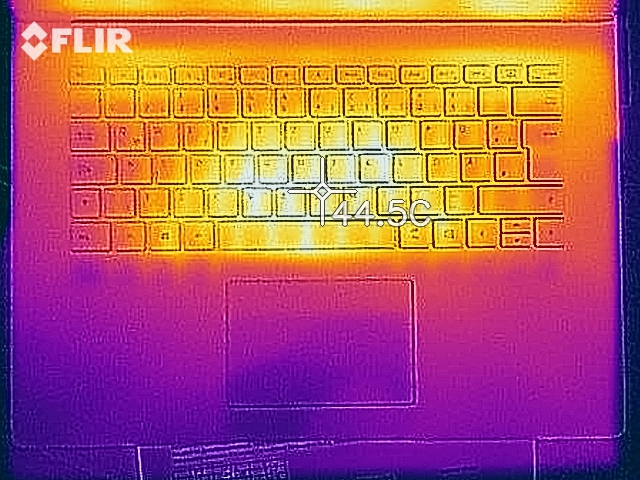
(±) The maximum temperature on the upper side is 41.4 °C / 107 F, compared to the average of 35.4 °C / 96 F, ranging from 19.6 to 60 °C for the class Convertible.
(+) The bottom heats up to a maximum of 39.7 °C / 103 F, compared to the average of 36.9 °C / 98 F
(+) In idle usage, the average temperature for the upper side is 30.3 °C / 87 F, compared to the device average of 30.3 °C / 87 F.
(±) Playing The Witcher 3, the average temperature for the upper side is 34.6 °C / 94 F, compared to the device average of 30.3 °C / 87 F.
(±) The palmrests and touchpad can get very hot to the touch with a maximum of 38.8 °C / 101.8 F.
(-) The average temperature of the palmrest area of similar devices was 28 °C / 82.4 F (-10.8 °C / -19.4 F).


Speakers
Considering the thin chassis which houses them, the Dolby Atmos stereo speakers are respectable. While they could be slightly louder, they offer more present bass than many cheaper models. Overall, they are still not a replacement for high-quality, external speakers or headphones. External audio devices can be connected via a headphone jack or Bluetooth 5.
Microsoft Surface Book 3 15 audio analysis
(-) | not very loud speakers (65.8 dB)
Bass 100 - 315 Hz
(±) | reduced bass - on average 9.8% lower than median
(±) | linearity of bass is average (8.9% delta to prev. frequency)
Mids 400 - 2000 Hz
(±) | higher mids - on average 5.2% higher than median
(±) | linearity of mids is average (9.4% delta to prev. frequency)
Highs 2 - 16 kHz
(+) | balanced highs - only 3.1% away from median
(±) | linearity of highs is average (7.1% delta to prev. frequency)
Overall 100 - 16.000 Hz
(±) | linearity of overall sound is average (17.3% difference to median)
Compared to same class
» 33% of all tested devices in this class were better, 8% similar, 59% worse
» The best had a delta of 6%, average was 20%, worst was 57%
Compared to all devices tested
» 33% of all tested devices were better, 8% similar, 59% worse
» The best had a delta of 4%, average was 23%, worst was 134%
Apple MacBook 12 (Early 2016) 1.1 GHz audio analysis
(+) | speakers can play relatively loud (83.6 dB)
Bass 100 - 315 Hz
(±) | reduced bass - on average 11.3% lower than median
(±) | linearity of bass is average (14.2% delta to prev. frequency)
Mids 400 - 2000 Hz
(+) | balanced mids - only 2.4% away from median
(+) | mids are linear (5.5% delta to prev. frequency)
Highs 2 - 16 kHz
(+) | balanced highs - only 2% away from median
(+) | highs are linear (4.5% delta to prev. frequency)
Overall 100 - 16.000 Hz
(+) | overall sound is linear (10.2% difference to median)
Compared to same class
» 7% of all tested devices in this class were better, 2% similar, 90% worse
» The best had a delta of 5%, average was 18%, worst was 53%
Compared to all devices tested
» 5% of all tested devices were better, 1% similar, 94% worse
» The best had a delta of 4%, average was 23%, worst was 134%
Energy Management - Economical Surface
Energy Consumption
The energy consumption is fairly low considering the powerful hardware. While idling, only the more efficient integrated graphics card is active, which conserves power. The GTX 1660 Ti becomes active when processing more-demanding workloads and the consumption reflects this. At least under maximum load, the consumption of the GPU still falls below the average of a GTX 1660 Ti.
The included charger is now rated for 127 watts, which makes it very well-dimensioned even for temporary peaks (108 watts).
| Off / Standby | |
| Idle | |
| Load |
|
Key:
min: | |
| Microsoft Surface Book 3 15 i7-1065G7, GeForce GTX 1660 Ti Max-Q, SK hynix BC501 HFM256GDGTNG, IPS, 3240x2160, 15" | Asus ZenBook Flip 15 UX563FD-A1027T i7-10510U, GeForce GTX 1050 Max-Q, Samsung SSD PM981 MZVLB1T0HALR, IPS, 3840x2160, 15.6" | Lenovo Yoga C940-14IIL i7-1065G7, Iris Plus Graphics G7 (Ice Lake 64 EU), Samsung SSD PM981 MZVLB512HAJQ, IPS LED, 1920x1080, 14" | Apple MacBook Pro 15 2019 i9 Vega 20 i9-9980HK, Radeon Pro Vega 20, Apple SSD AP1024, IPS, 2880x1800, 15.4" | Average NVIDIA GeForce GTX 1660 Ti Max-Q | Average of class Convertible | |
|---|---|---|---|---|---|---|
| Power Consumption | 1% | 22% | -28% | 17% | ||
| Idle Minimum * (Watt) | 4.2 | 2.3 45% | 3.2 24% | 5.16 ? -23% | 4.28 ? -2% | |
| Idle Average * (Watt) | 7.4 | 10.3 -39% | 7 5% | 8.51 ? -15% | 6.96 ? 6% | |
| Idle Maximum * (Watt) | 9 | 11 -22% | 8.9 1% | 14.6 ? -62% | 8.67 ? 4% | |
| Load Average * (Watt) | 78 | 77 1% | 47.6 39% | 76.4 ? 2% | 45.1 ? 42% | |
| Witcher 3 ultra * (Watt) | 94.2 | 68 28% | ||||
| Load Maximum * (Watt) | 108 | 118 -9% | 63.1 42% | 151.4 ? -40% | 67.7 ? 37% |
* ... smaller is better
Battery Life
The Surface Book is equipped with two batteries, one of them is integrated into the tablet itself and the other can be found inside the base unit. They have a combined capacity of 82 Wh (60 + 22 Wh).
With all energy savers enabled, the convertible lasts over 16 hours while idling.
However, our Wi-Fi test is far more relevant for real-world scenarios. For this test, we reduce the brightness level and use a script to simulate a web-browsing load and occasionally play a YouTube video. In this test, the Surface Book 3 lasts 8.5 hours. Its predecessor was able to outlast our test device by two hours!
The results of our video test paint a similar picture. In flight mode and while using the slowest power profile, it achieves a respectable runtime of almost 13 hours. However, the previous model's runtime is once again 2 hours longer.
Things are different in the maximum load scenario, during which everything that draws power is active: Here, the current-generation Surface Book lasts almost 3 hours and thus 20% longer than the Surface Book 2 (2 h 25 m).
Since the new CPU and its more flexible clock speeds promises a lower energy consumption, the Surface Book 2's significantly longer battery life in tests that more closely reflect real-world conditions is somewhat surprising. However, the results of the Surface Book 3 are still good overall.
When only the tablet is used, the battery life decreases due to the disconnected battery within the base unit. For example, the tablet only lasts 73 minutes in our Wi-Fi test. Here, the drawbacks of the tiny 22-Wh battery become apparent - evidently, the Surface Book is not meant for prolonged use without the base unit.
| Microsoft Surface Book 3 15 i7-1065G7, GeForce GTX 1660 Ti Max-Q, 82 Wh | Microsoft Surface Book 2 15 i7-8650U, GeForce GTX 1060 Mobile, 86 Wh | Apple MacBook Pro 15 2019 i9 Vega 20 i9-9980HK, Radeon Pro Vega 20, 83 Wh | Asus ZenBook Flip 15 UX563FD-A1027T i7-10510U, GeForce GTX 1050 Max-Q, 71 Wh | Lenovo Yoga C940-14IIL i7-1065G7, Iris Plus Graphics G7 (Ice Lake 64 EU), 60 Wh | Average of class Convertible | |
|---|---|---|---|---|---|---|
| Battery runtime | 8% | 35% | 0% | -12% | 20% | |
| Reader / Idle (h) | 16.2 | 19.5 20% | 26.7 ? 65% | |||
| H.264 (h) | 12.9 | 15.3 19% | 11.2 -13% | 13.2 2% | 15 ? 16% | |
| WiFi v1.3 (h) | 8.5 | 10.6 25% | 11.5 35% | 9.4 11% | 10.6 25% | 12 ? 41% |
| Load (h) | 3 | 2.4 -20% | 2.5 -17% | 1.1 -63% | 1.713 ? -43% |
Pros
Cons
Verdict - Great Convertible with One Drawback
Microsoft's Surface Book 3 15 is a premium device which, thanks to its unique design, has almost no competition. Where else can you get a tablet this powerful that can also transform into a laptop with even better (GPU) hardware? Even the tablet itself is faster than many basic laptops.
Microsoft has further optimized its device family with substantial improvements in various areas such as raising the volume level, for example. The excellent 4K display, powerful CPU/GPU combination and the build quality as well as its solid docking mechanism continue to amaze. Similarly, the input devices are solid.
However, this is not a strict upgrade: A significant SSD downgrade in this price class is baffling. There is still no Thunderbolt and Microsoft is trying to push the very expensive dock to its customers. Furthermore, we would have liked to see a USB Type-C port directly on the tablet unit and its battery could have been larger as well.
With the latest Surface Book 15, Microsoft has done most things right. However, there is no real reason to upgrade from the previous model, which even has a few advantages compared to the newer model.
This leaves us with the question of whether the newer model is even better than the previous Surface Book 15. The USB interface has been upgraded from Gen. 1 to Gen. 2, the noise level under load has dropped significantly and there were 3D performance improvements as well. Meanwhile, the CPU performance remains unchanged at best and as mentioned before, the SSD is slower. While the Surface Book 3 does have a slight advantage, there are very few good reasons to upgrade from a Surface Book 2. For those who can afford it, the Surface Book 3 15 is still a good purchase, though.
Microsoft Surface Book 3 15
- 06/29/2020 v7 (old)
Christian Hintze
Price comparison

