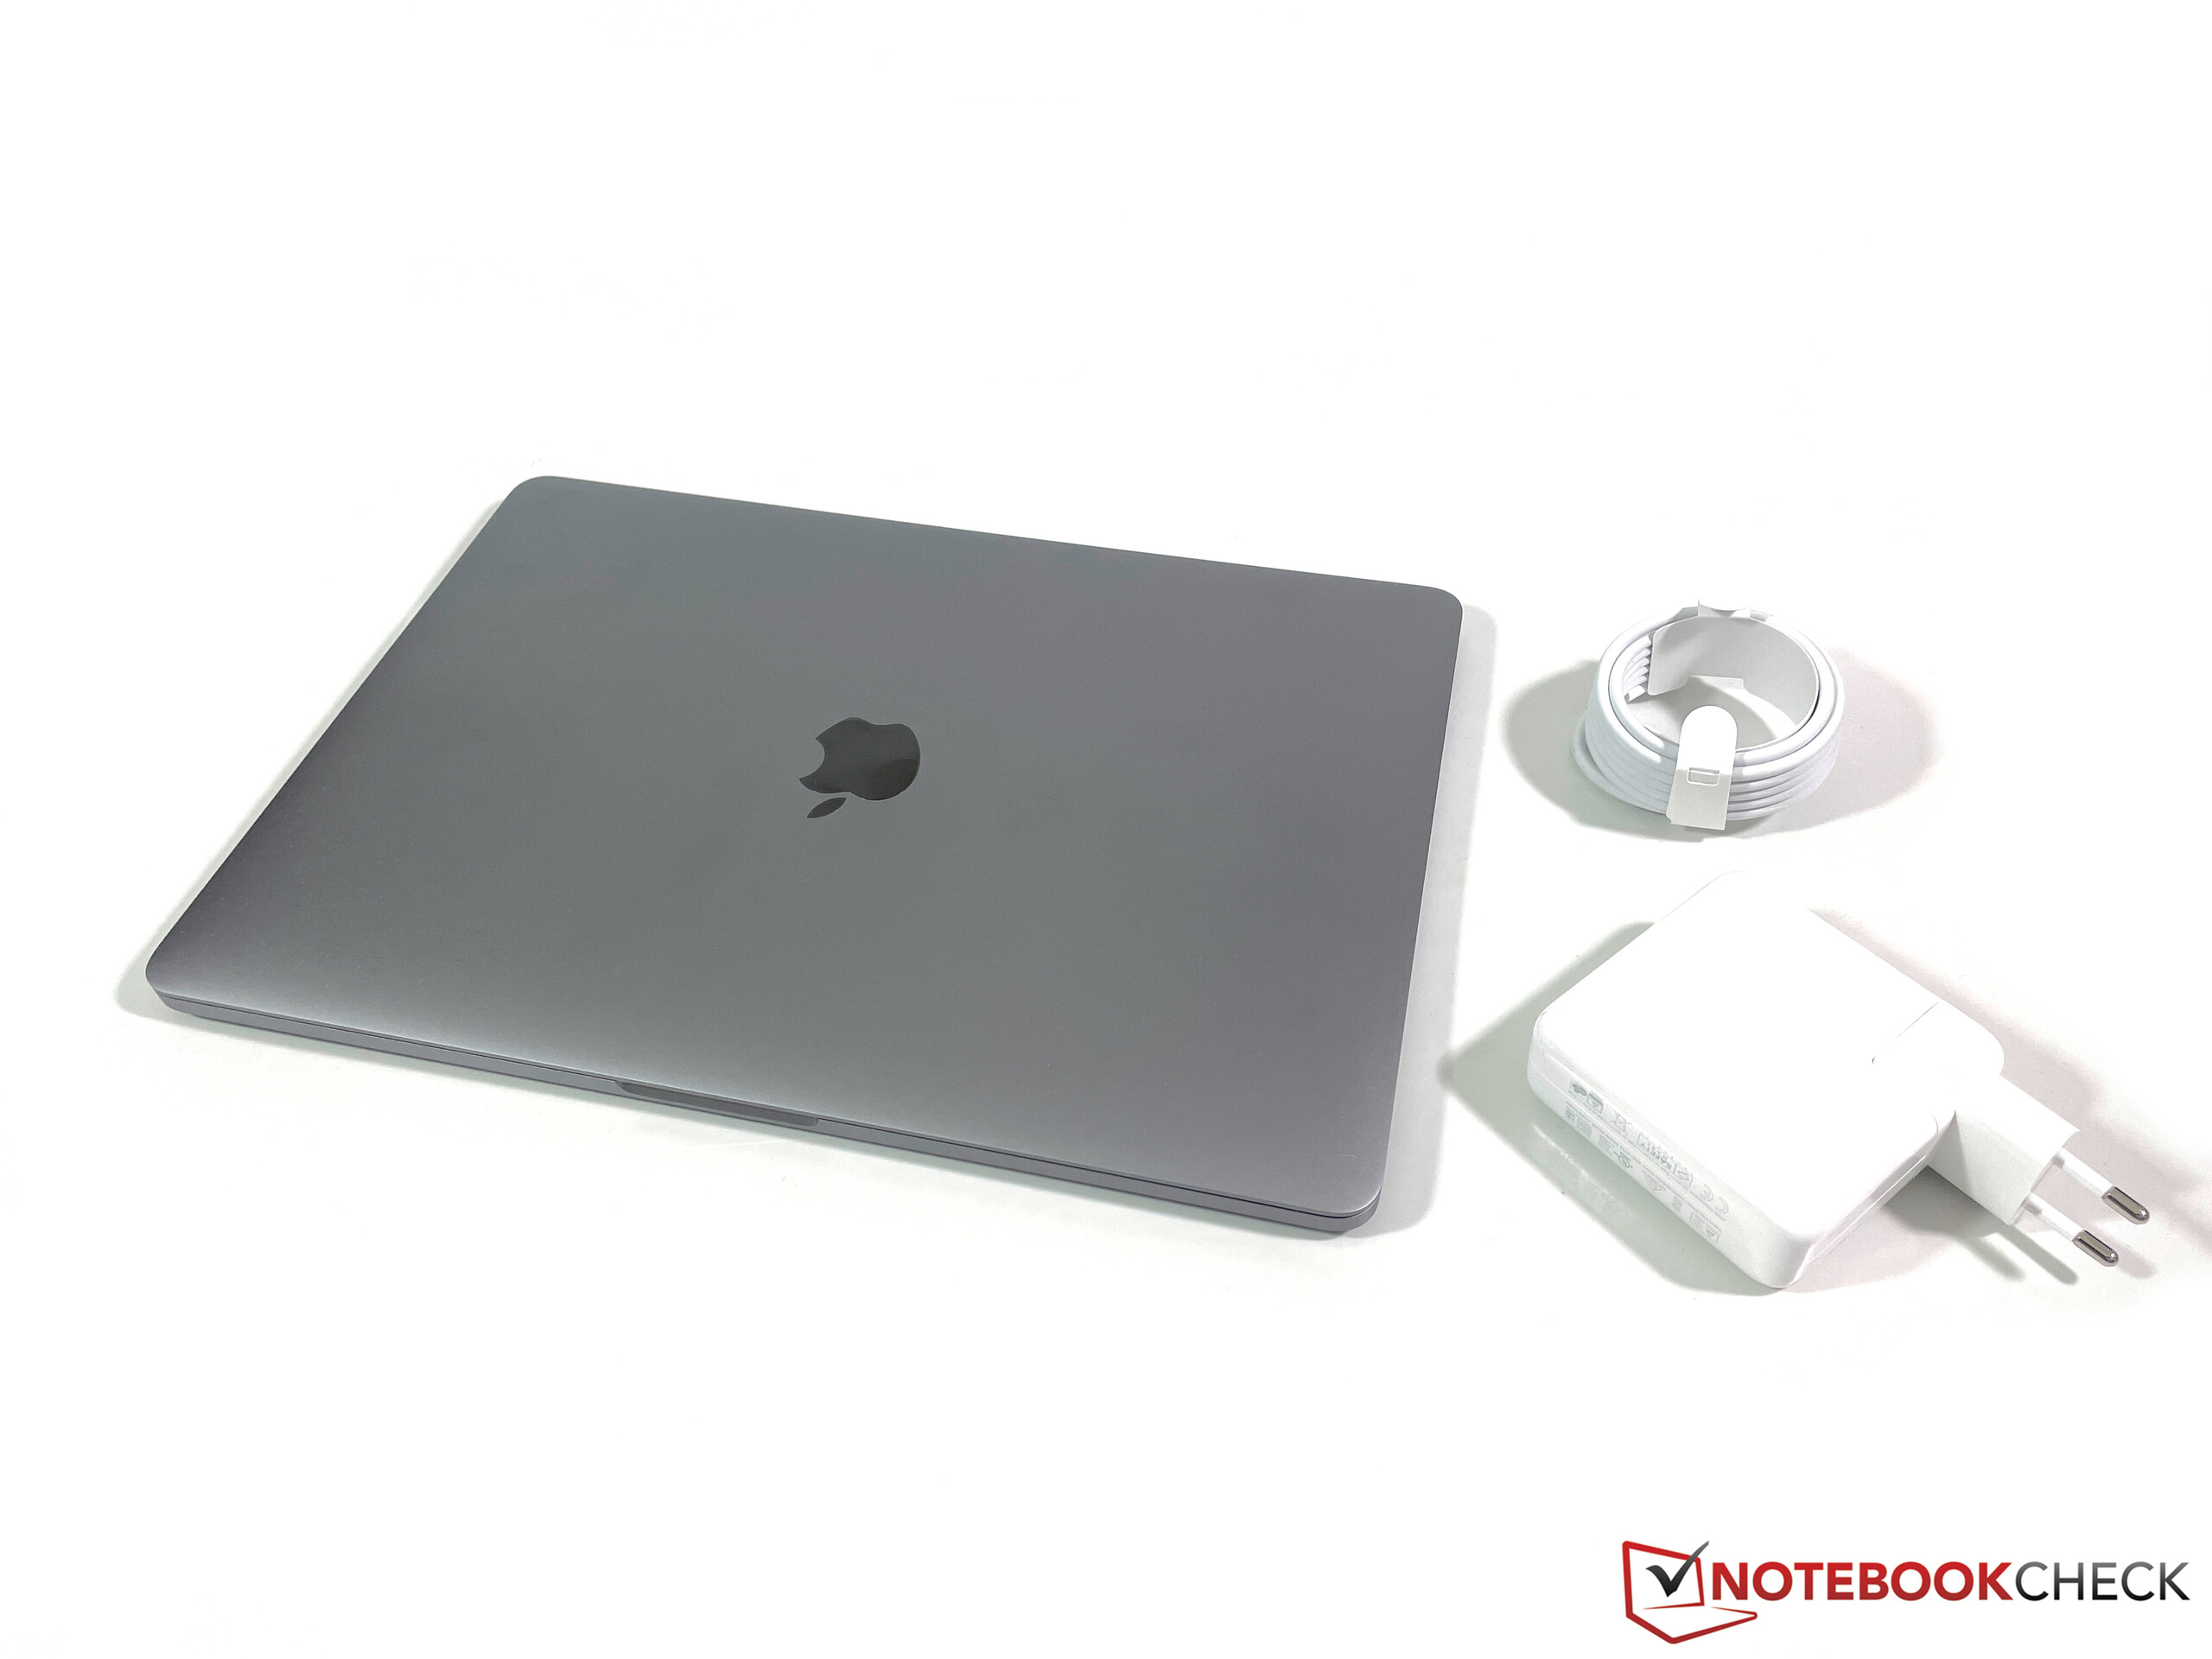
Apple MacBook Pro 13 2022 M2 Laptop Review – Debut for the new Apple M2

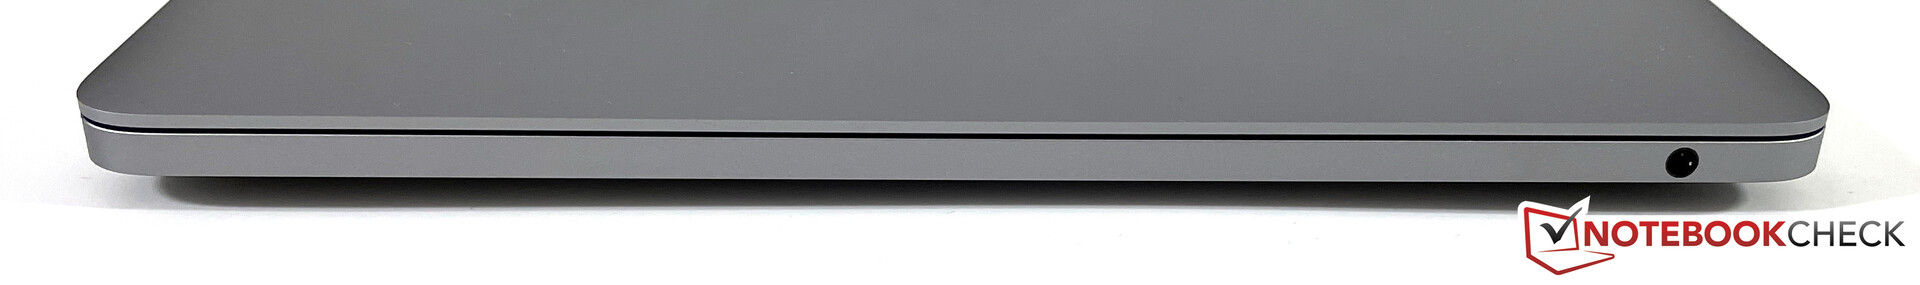
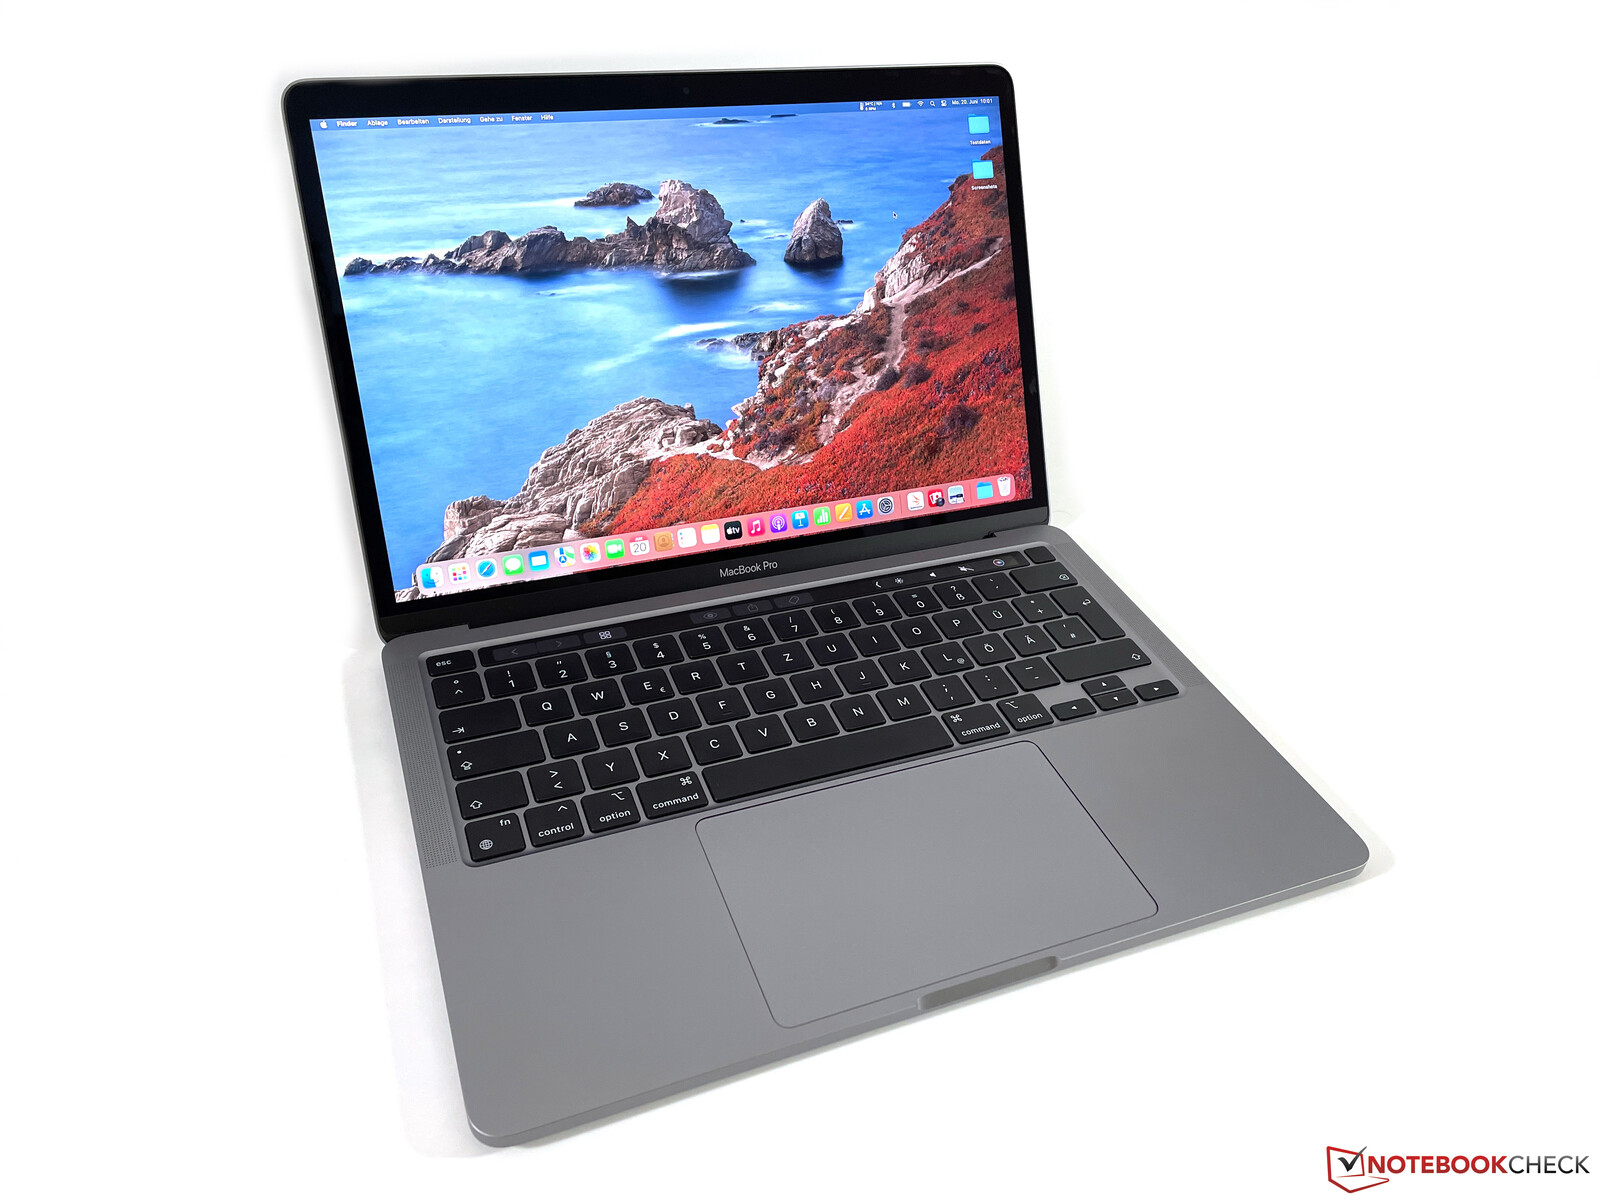
There were plenty of rumors and speculations about a full redesign of the new MacBook Air with Apple’s M2 processor, but the first MacBook with the new M2 SoC is actually a familiar companion, the MacBook Pro 13. It looks just like the previous model equipped with the M1 chip, the 13.3-inch display without a notch is identical and you get the magic keyboard in combination with the Touch Bar. The 2022 MacBook Pro 13 does not get a MagSafe connector, either.
Apple only offers the MacBook Pro 13 with the faster version of the M2, which has 8 CPU cores and 10 GPU cores, while the entry-level model of the new MacBook Air M2 is shipped with a slower 8-core GPU. The MBP 13 features an active cooling solution, so the performance should be more stable compared to the passively cooled MacBook Air M2.
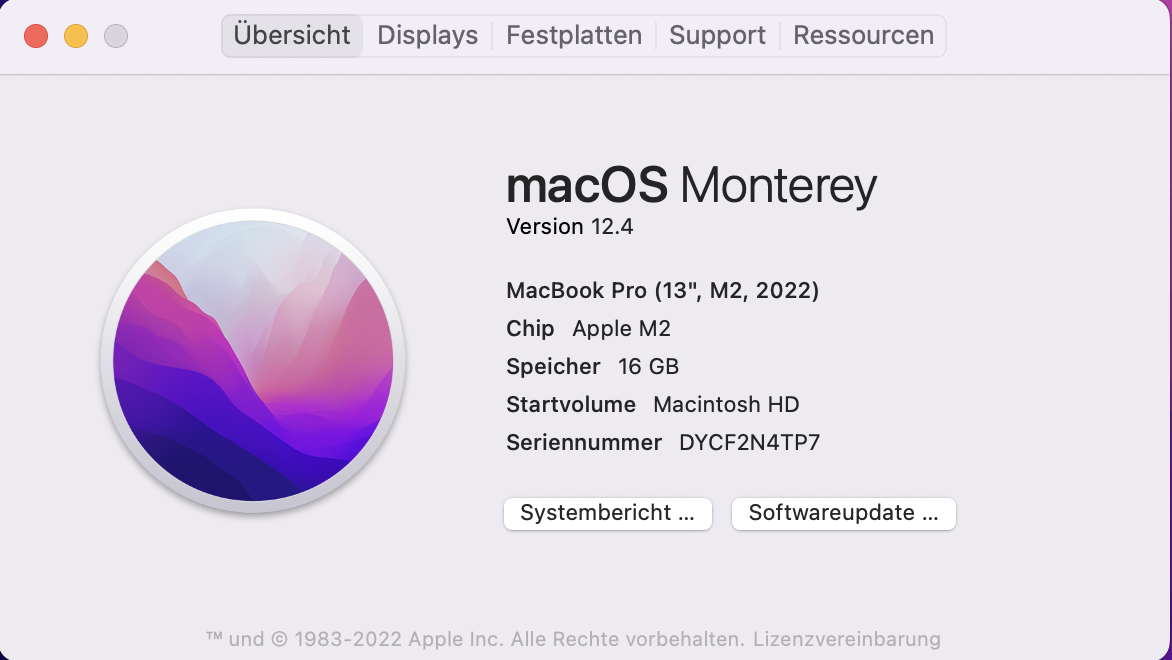
The price of the 2022 MacBook Pro 13 with the M2 processor starts at $1299 with 256 GB SSD storage and 8 GB RAM; our review unit with 16 GB RAM and a 1 TB SSD is available for $1899. All models are shipped with the same M2 SoC (8 CPU cores, 10 GPU cores).
Potential Rivals
Rating | Date | Model | Weight | Height | Size | Resolution | Price |
|---|---|---|---|---|---|---|---|
| 91.9 % v7 (old) | 06 / 2022 | Apple MacBook Pro 13 2022 M2 M2, M2 10-Core GPU | 1.4 kg | 15.6 mm | 13.30" | 2560x1600 | |
| 91.1 % v7 (old) | 12 / 2020 | Apple MacBook Pro 13 Late 2020 M1 Entry (8 / 256 GB) M1, M1 8-Core GPU | 1.4 kg | 15.6 mm | 13.30" | 2560x1600 | |
| 91.1 % v7 (old) | 12 / 2020 | Apple MacBook Air 2020 M1 Entry M1, M1 7-Core GPU | 1.3 kg | 16.1 mm | 13.30" | 2560x1600 | |
| 90.1 % v7 (old) | 07 / 2022 | Asus Zenbook S 13 OLED R7 6800U, Radeon 680M | 1.1 kg | 14.9 mm | 13.30" | 2880x1800 | |
| 86.7 % v7 (old) | 05 / 2022 | Samsung Galaxy Book2 Pro 13 NP930XED-KA1DE i5-1240P, Iris Xe G7 80EUs | 885 g | 11 mm | 13.30" | 1920x1080 | |
| 88.8 % v7 (old) | 02 / 2022 | Huawei MateBook 13s i5 11300H i5-11300H, Iris Xe G7 80EUs | 1.3 kg | 16.5 mm | 13.40" | 2520x1680 | |
| 88.3 % v7 (old) | 05 / 2021 | Dell XPS 13 9310 OLED i7-1185G7, Iris Xe G7 96EUs | 1.2 kg | 14.8 mm | 13.40" | 3456x2160 |
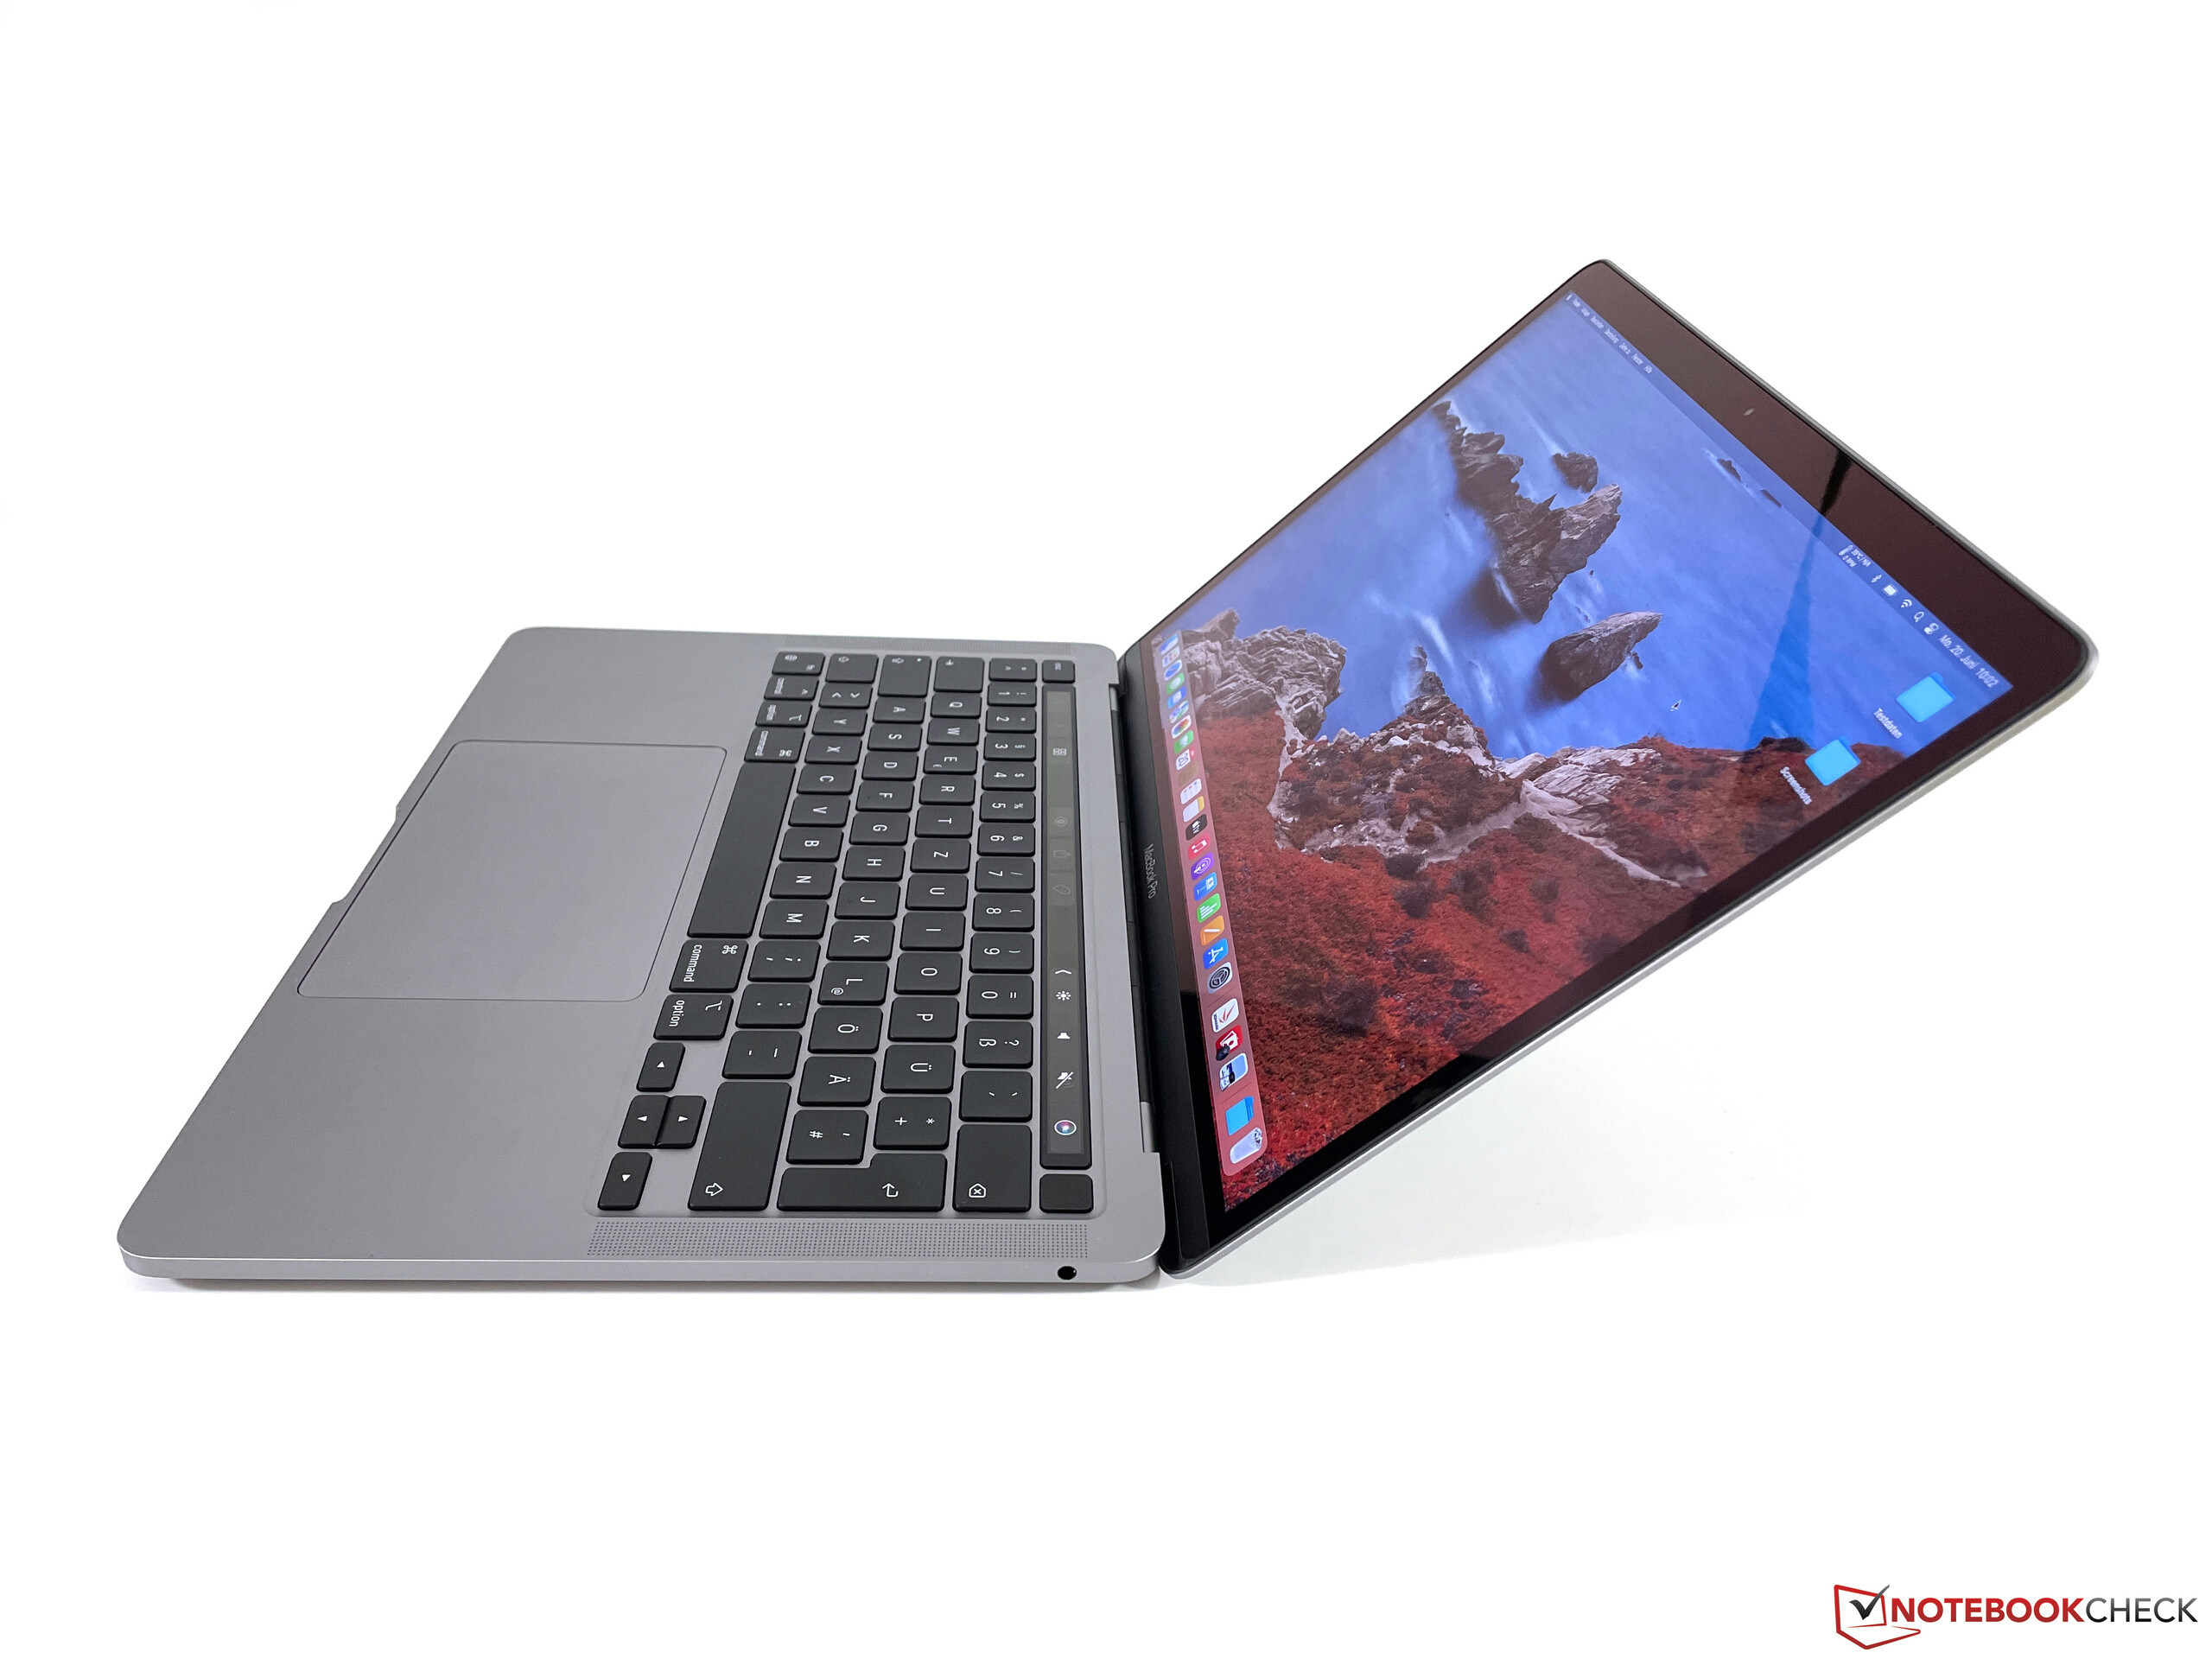
Case – Aluminum MacBook is unchanged
We know the aluminum chassis of the MacBook Pro 13 very well from previous iterations, but it is still great with its high quality and the excellent build quality. The only slightly outdated aspect is the size of the bezels once you open the lid, which are a bit wide for a modern subnotebook despite the 16:10 aspect ratio screen.
There is not much to criticize in terms of quality or stability. The big advantage of the aluminum surfaces is that they do not get dirty or greasy very easily and MacBooks usually look very good even after multiple years with a little care.

Connectivity - MBP 13 again with Thunderbolt 3
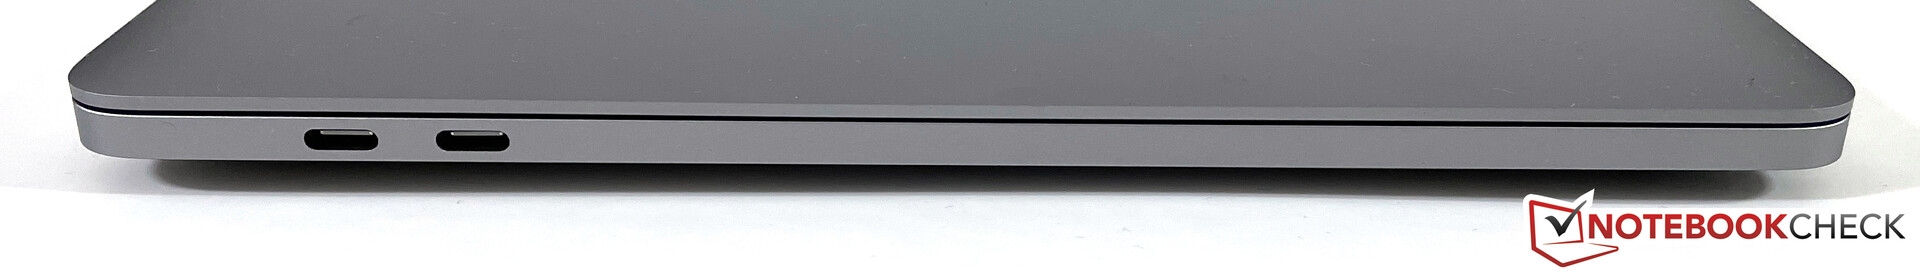
The 2022 MacBook Pro 13 M2 does not get the MagSafe connector, which means you are once again limited to the two USB-C ports on the left side. They support Thunderbolt 3 and USB 4 with the full 40 Gbps (USB 3.1 Gen.2 with 10 Gbps) as well as charging and DisplayPort. In addition to the integrated display, the MBP 13 M2 can only drive one additional external screen at 6K/60 Hz.
Communication
The Wi-Fi performance of the new Apple M2 did not really change from the M1 and is hardly convincing. The modern Wi-Fi 6E standard is not supported and Wi-Fi 6 connections only work with 80 MHz bands, which means the MacBook cannot keep up with the transfer rates of 160 MHz Wi-Fi 6 modules. We see a slight improvement over the previous MacBook Pro 13 M1 in combination with out new reference router from Asus, but the transfer rates are still pretty slow at around 800 Mbps. The performance is at least stable and we did not notice any issues with the signal quality during our review period, so the limitation is not that big unless you transfer large files in your personal network.
Webcam
While the new MacBook Air M2 will get a 1080p webcam, the MBP 13 is still equipped with the same 720p FaceTime HD camera we know from previous iterations. It does its job, but the picture quality is not very convincing.


Maintenance
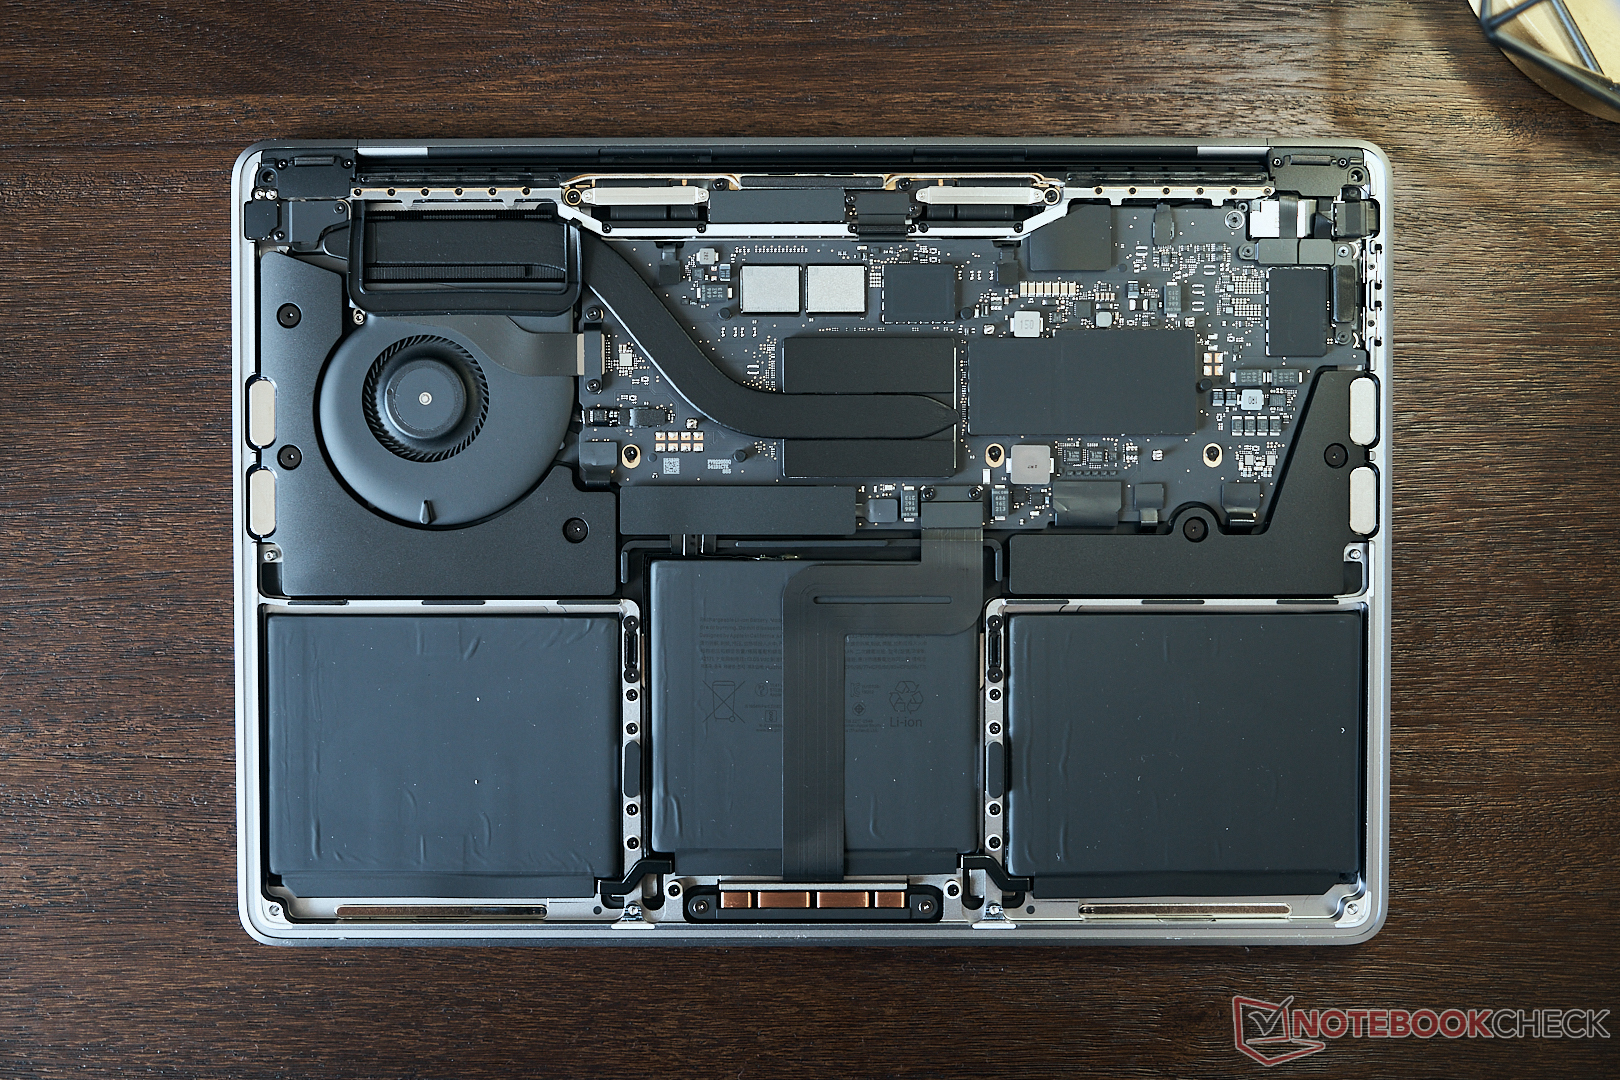
It is easy to remove the bottom cover with the corresponding Pentalobe screw driver, but your maintenance work is limited to the cleaning of the fan.
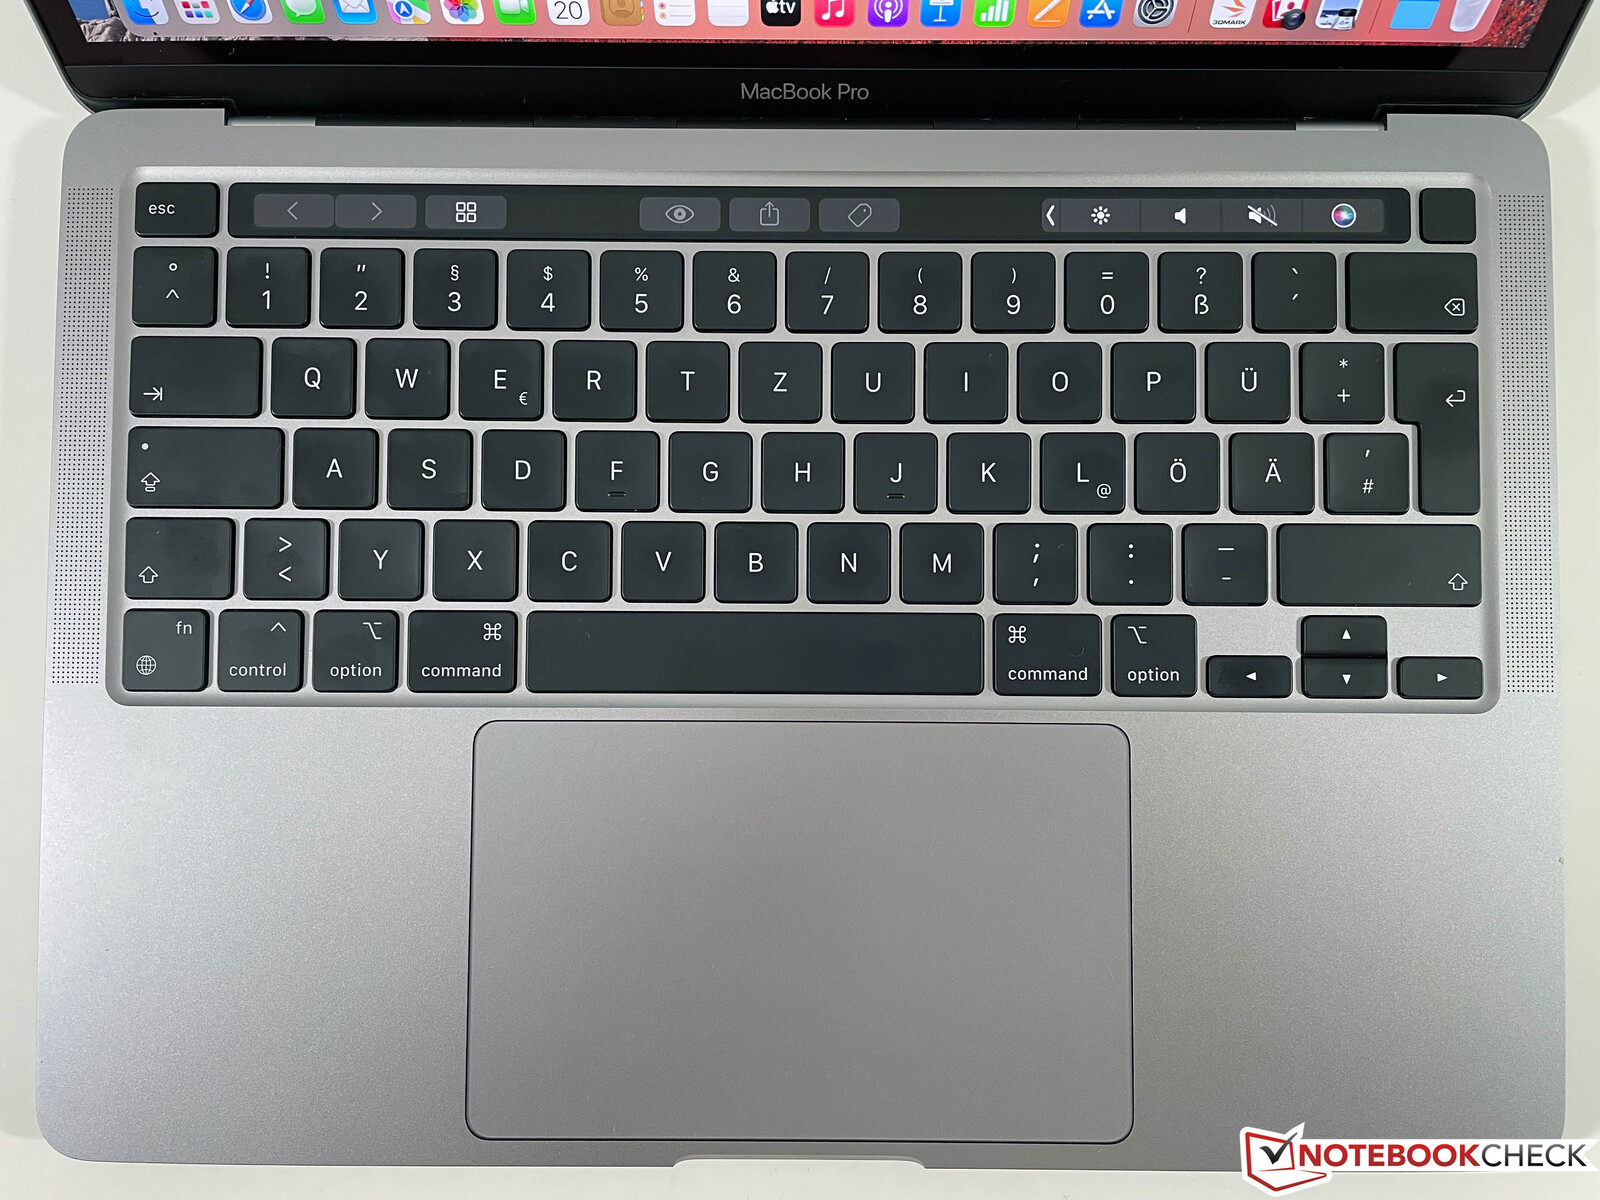
Input Devices - The Touch Bar lives longer than expected
The input devices did not change, either, which means the 2022 MBP 13 is still equipped with the Touch Bar above the keyboard. It is the last model with the little touch-sensitive display, so Apple accepted that it is not much more than a gimmick. All other MacBook models are once again equipped with regular function keys.
Most users should be happy with the keyboard after Apple switched back to a scissor mechanism after the Butterfly key experiment, and the overall typing experience is good. The automatic adjustment of the background illumination is a very convenient feature and improves the overall user experience.
The large trackpad is still the benchmark in the mobile segment, which is also a result of the excellent software support and integration with macOS.
Display - MacBook Pro 13 without a notch
The display is once again the familiar 16:10 IPS screen without a notch. The subjective picture quality is still great after all these years: The high resolution of 2560 x 1600 pixels ensures crisp images and the colors do not disappoint, either. You also benefit from the automatic brightness regulation, which works extremely well, and also the automatic adjustment of the color temperature based on the ambient light (True Tone). macOS does not have any scaling issues, either, which can still be an issue on Windows laptops with high-resolution panels.
The brightness is rated at 500 nits and our test unit reaches up to 514 nits (497 nits on average) in combination with a decent black value of 0.31, which results in a very high contrast ratio of more than 1600:1. We can determine a flickering when the panel brightness drops to 56% and below, but it is not typical PWM flickering. The frequency of 117 kHz is extremely high and should not cause any problems. The response times are decent for an IPS screen and we did not notice any ghosting.
The display of the new MacBook Air M2 will also support the wider P3 reference and the other specs are also identical expect for the slightly different form factor (due to the additional vertical space). Compared to the larger MacBook Pro models with the Mini-LED panels, the smaller MBP 13 does not support the higher refresh rates up to 120 Hz or the HDR capabilities.
| |||||||||||||||||||||||||
Brightness Distribution: 93 %
Center on Battery: 513 cd/m²
Contrast: 1658:1 (Black: 0.31 cd/m²)
ΔE ColorChecker Calman: 1.1 | ∀{0.5-29.43 Ø4.71}
calibrated: 0.6
ΔE Greyscale Calman: 1.8 | ∀{0.09-98 Ø4.96}
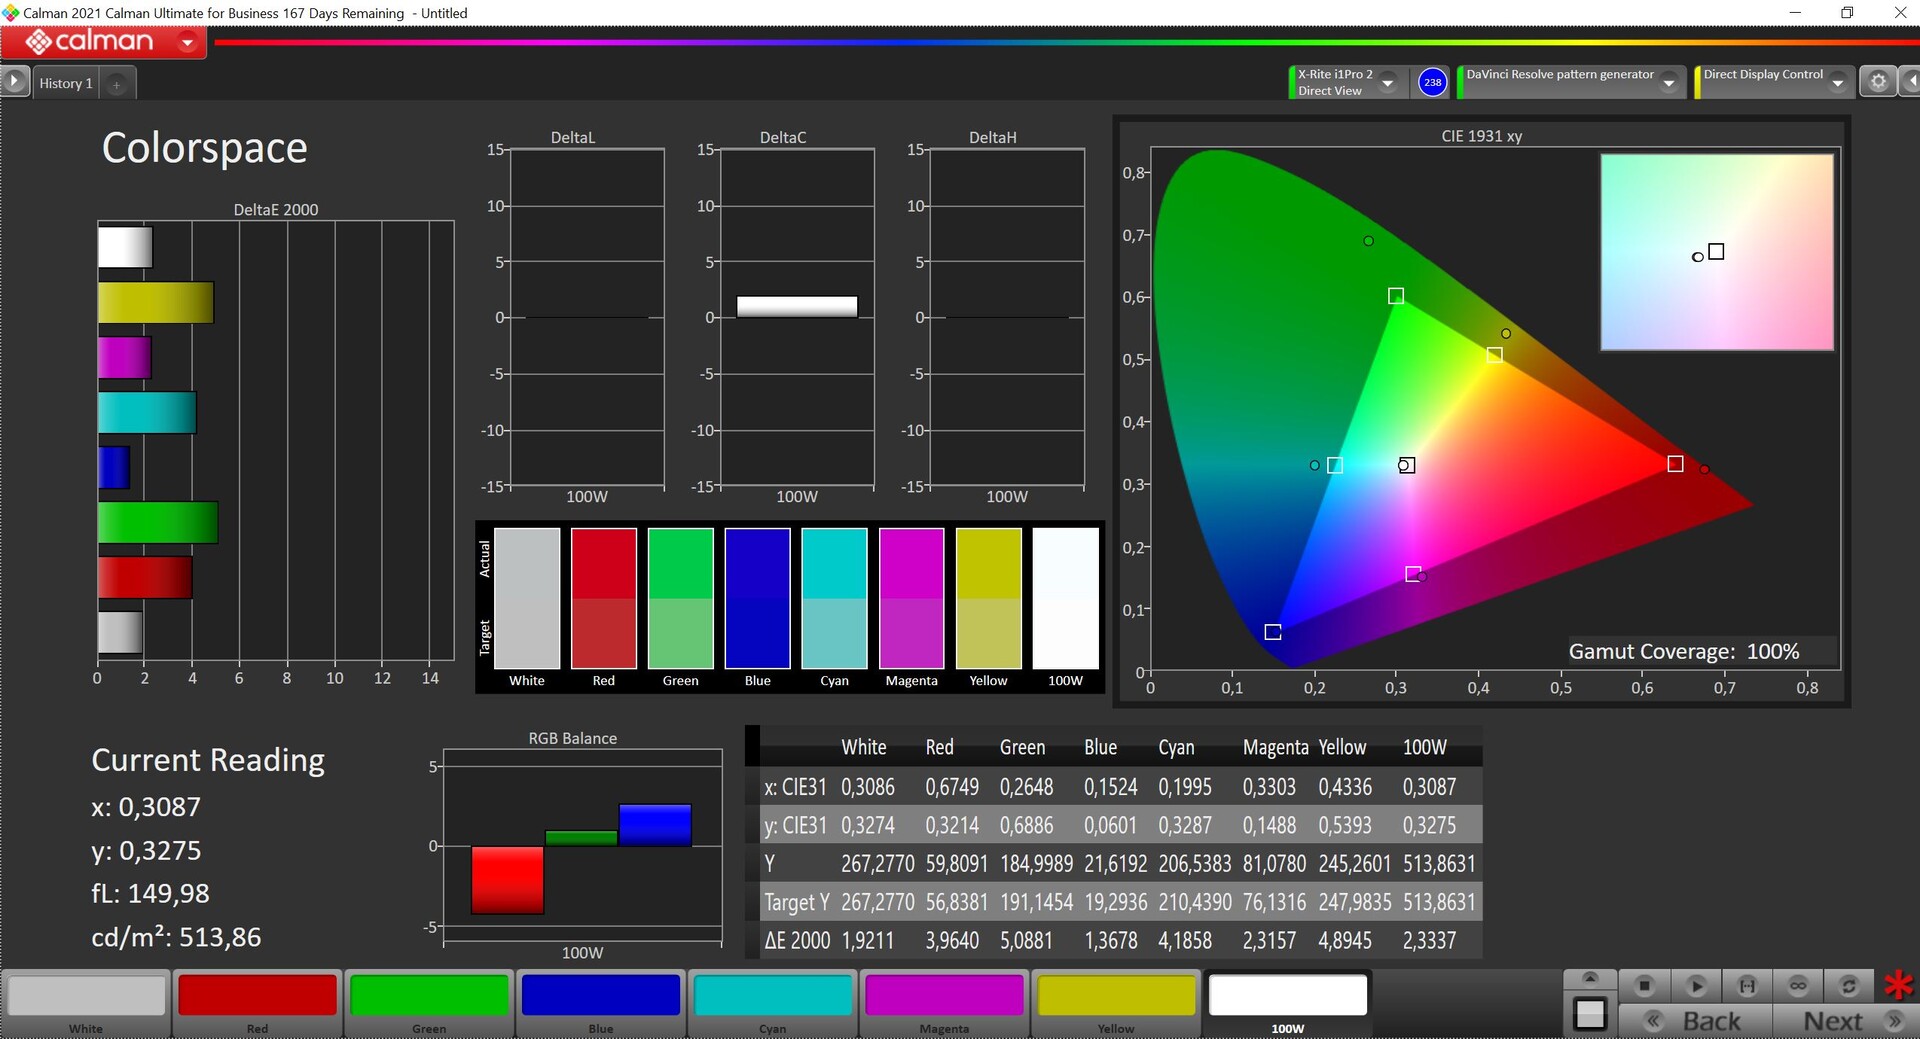
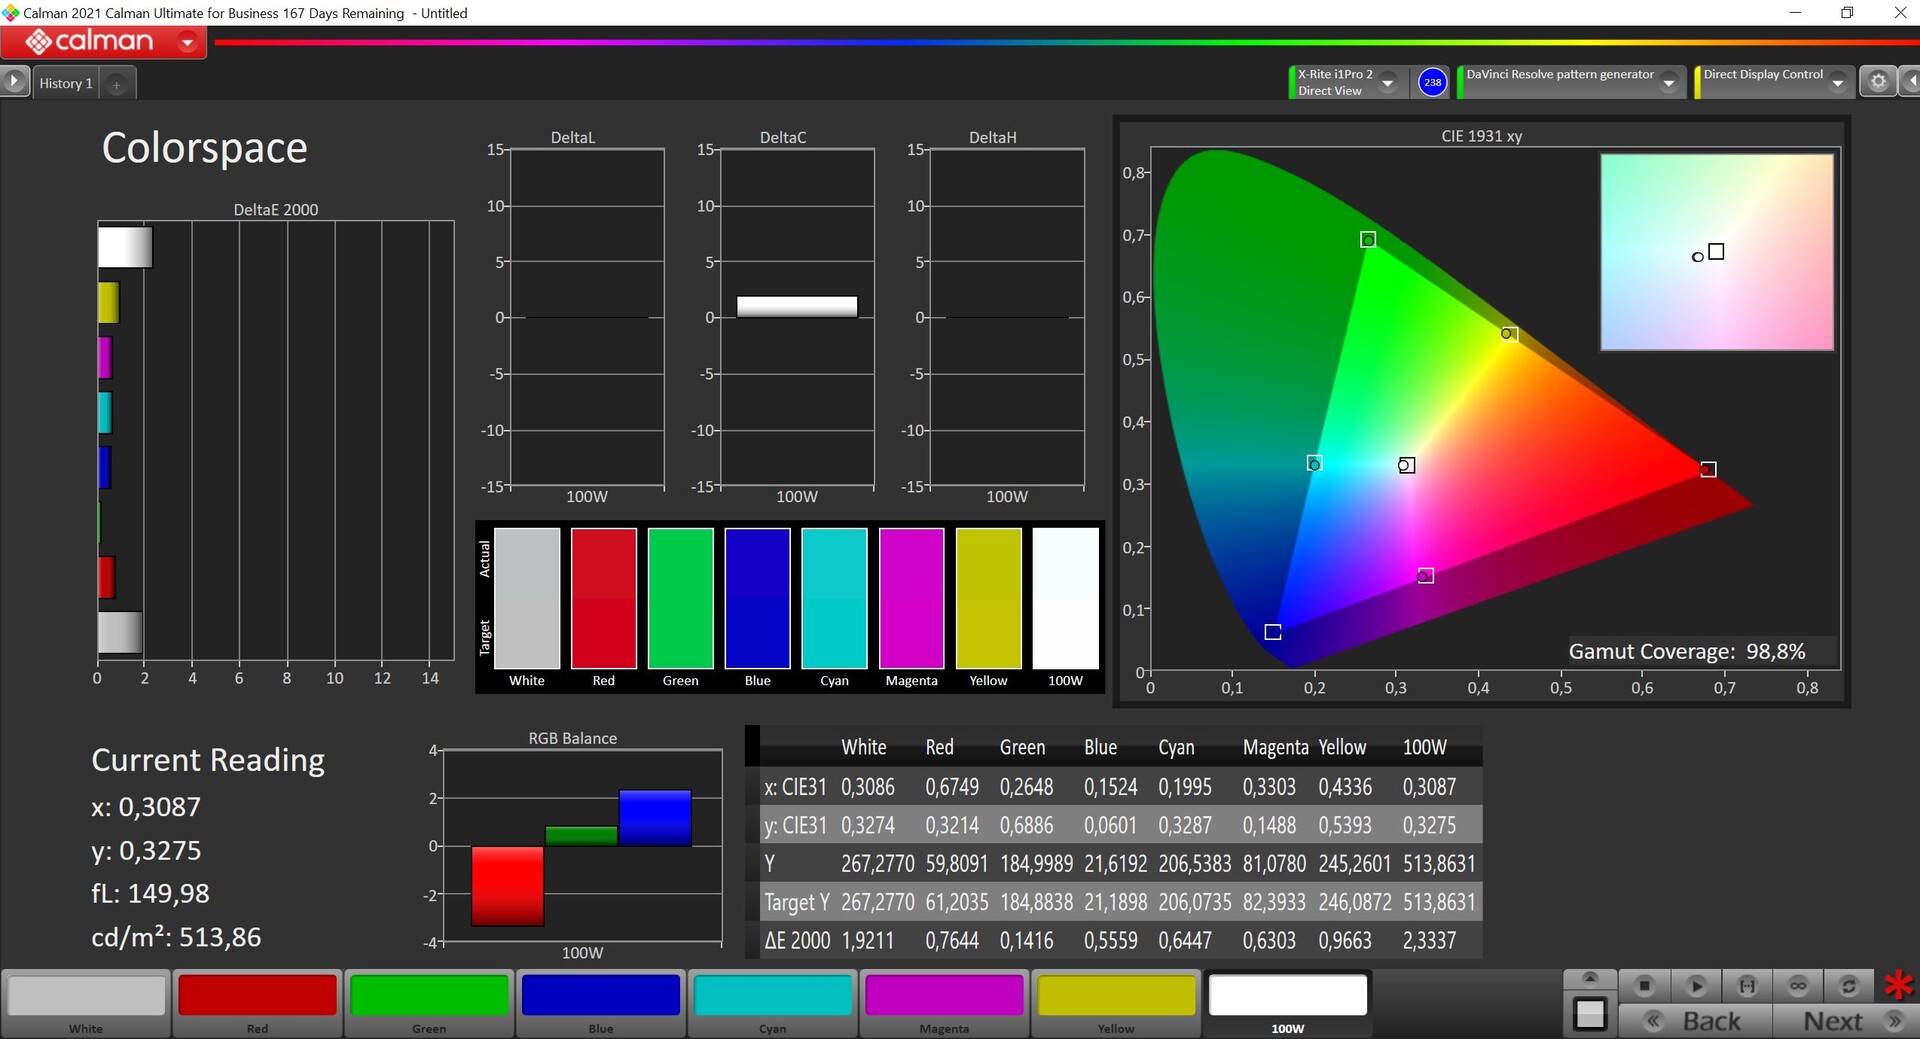
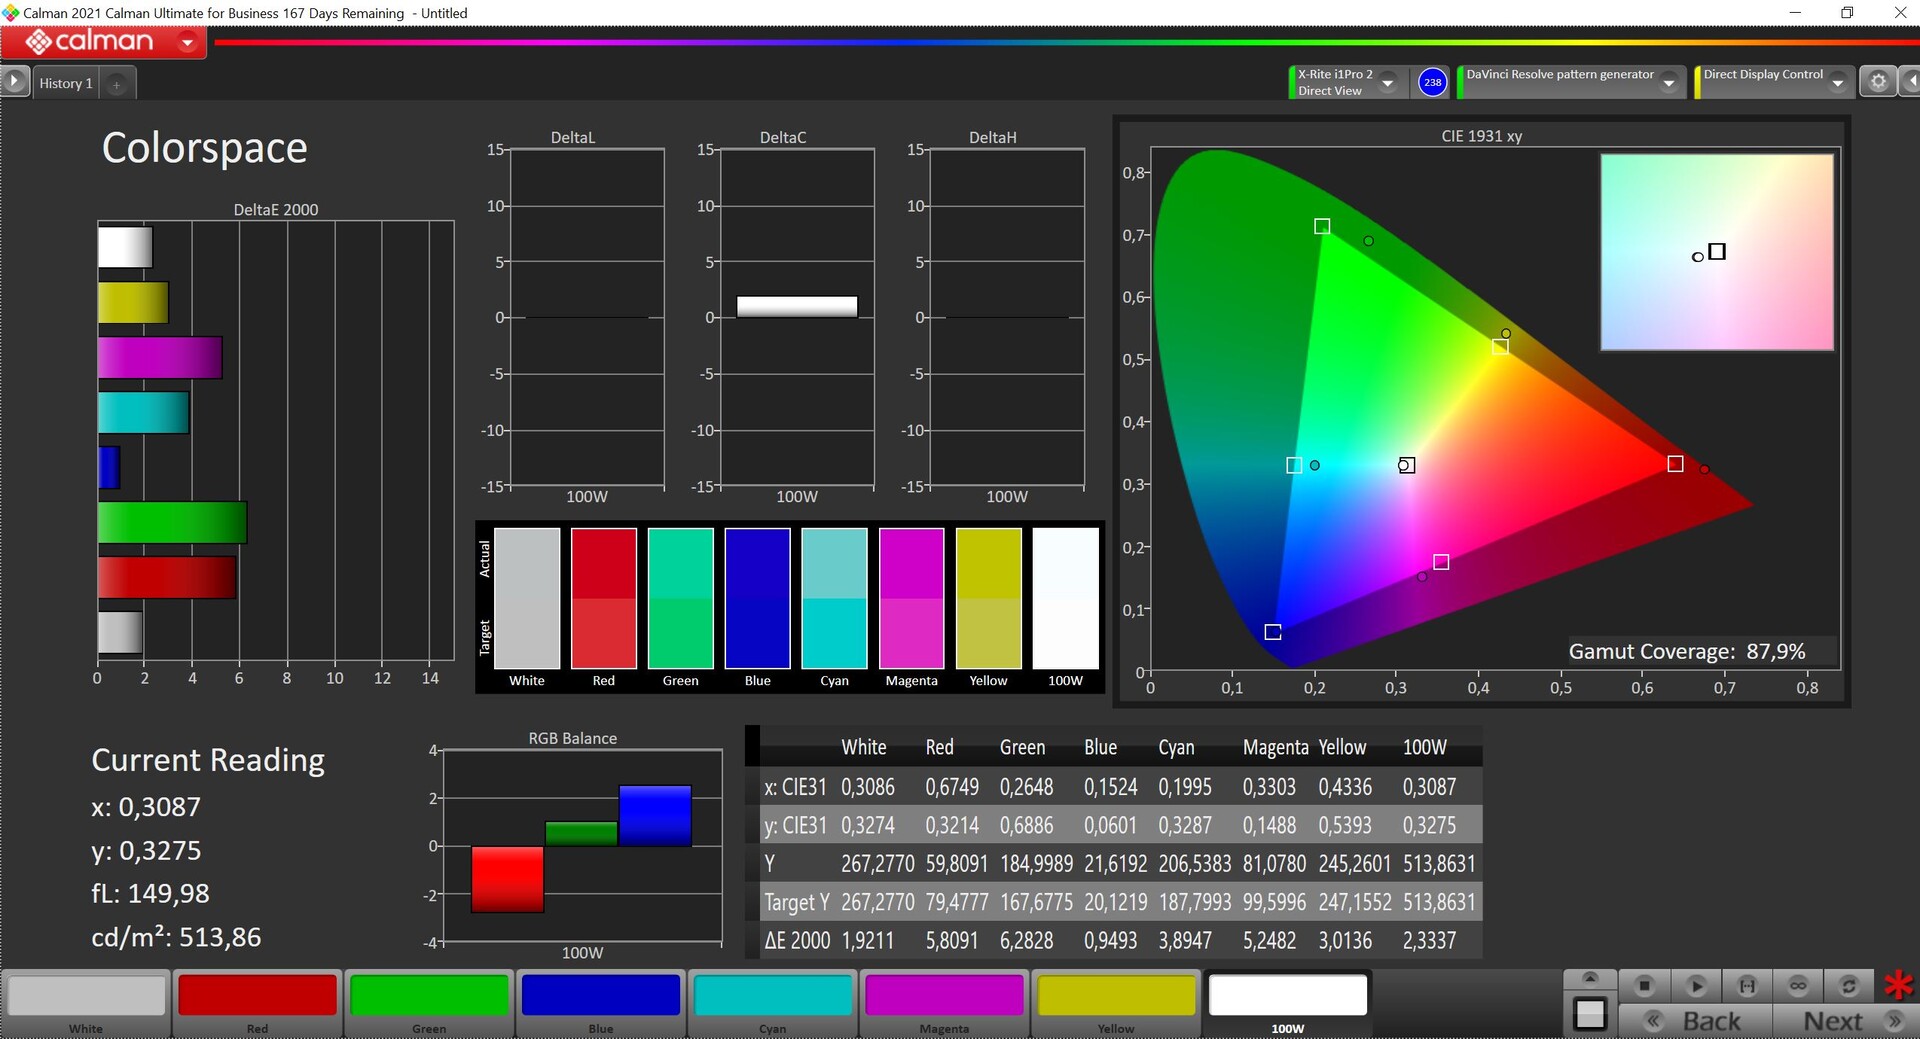
87.9% AdobeRGB 1998 (Argyll 3D)
100% sRGB (Argyll 3D)
98.8% Display P3 (Argyll 3D)
Gamma: 2.23
CCT: 6764 K
| Apple MacBook Pro 13 2022 M2 IPS, 2560x1600, 13.3" | Apple MacBook Pro 13 Late 2020 M1 Entry (8 / 256 GB) IPS, 2560x1600, 13.3" | Apple MacBook Air 2020 M1 Entry IPS, 2560x1600, 13.3" | Asus Zenbook S 13 OLED SDC4172, OLED, 2880x1800, 13.3" | Samsung Galaxy Book2 Pro 13 NP930XED-KA1DE ATNA33XC10-0, OLED, 1920x1080, 13.3" | Huawei MateBook 13s i5 11300H TL134GDXP02-0, LTPS, 2520x1680, 13.4" | Dell XPS 13 9310 OLED Samsung 134XK01, OLED, 3456x2160, 13.4" | |
|---|---|---|---|---|---|---|---|
| Display | -1% | 4% | 3% | -22% | 4% | ||
| Display P3 Coverage (%) | 98.8 | 98.6 0% | 99.8 1% | 99.81 1% | 65.2 -34% | 99.7 1% | |
| sRGB Coverage (%) | 100 | 100 0% | 100 0% | 100 0% | 92 -8% | 100 0% | |
| AdobeRGB 1998 Coverage (%) | 87.9 | 85.9 -2% | 97.8 11% | 95.55 9% | 67.5 -23% | 97.7 11% | |
| Response Times | -3% | 16% | 95% | 92% | 6% | 94% | |
| Response Time Grey 50% / Grey 80% * (ms) | 42 ? | 48 ? -14% | 31 ? 26% | 2.1 ? 95% | 4 ? 90% | 44.8 ? -7% | 2.2 ? 95% |
| Response Time Black / White * (ms) | 27.8 ? | 25.2 ? 9% | 26.1 ? 6% | 1.68 ? 94% | 2 ? 93% | 22.8 ? 18% | 2.2 ? 92% |
| PWM Frequency (Hz) | 117780 ? | 122000 ? | 118000 ? | 240.4 ? | 61 ? | 9804 ? | 240.4 ? |
| Screen | -6% | -16% | 74% | 10% | -43% | -173% | |
| Brightness middle (cd/m²) | 514 | 510 -1% | 417 -19% | 336 -35% | 399 -22% | 468 -9% | 384 -25% |
| Brightness (cd/m²) | 497 | 491 -1% | 395 -21% | 338 -32% | 403 -19% | 450 -9% | 387 -22% |
| Brightness Distribution (%) | 93 | 94 1% | 91 -2% | 99 6% | 98 5% | 92 -1% | 97 4% |
| Black Level * (cd/m²) | 0.31 | 0.29 6% | 0.39 -26% | 0.02 94% | 0.07 77% | 0.23 26% | |
| Contrast (:1) | 1658 | 1759 6% | 1069 -36% | 16800 913% | 5700 244% | 2035 23% | |
| Colorchecker dE 2000 * | 1.1 | 1.3 -18% | 1.12 -2% | 1.8 -64% | 1.35 -23% | 2 -82% | 4.56 -315% |
| Colorchecker dE 2000 max. * | 2.3 | 3 -30% | 2.71 -18% | 3.8 -65% | 2.77 -20% | 5.5 -139% | 7.27 -216% |
| Colorchecker dE 2000 calibrated * | 0.6 | 0.77 -28% | 1.8 -200% | 1.35 -125% | 1.5 -150% | 4.52 -653% | |
| Greyscale dE 2000 * | 1.8 | 2 -11% | 1.7 6% | 0.9 50% | 2.35 -31% | 2.6 -44% | 1.5 17% |
| Gamma | 2.23 99% | 2.23 99% | 2207 0% | 2.22 99% | 2.21 100% | 2.17 101% | 2.26 97% |
| CCT | 6764 96% | 6933 94% | 6870 95% | 6580 99% | 6824 95% | 6511 100% | 6219 105% |
| Color Space (Percent of AdobeRGB 1998) (%) | 88.3 | 87.1 | |||||
| Color Space (Percent of sRGB) (%) | 100 | 100 | |||||
| Total Average (Program / Settings) | -5% /
-5% | -0% /
-8% | 58% /
62% | 35% /
20% | -20% /
-31% | -25% /
-84% |
* ... smaller is better
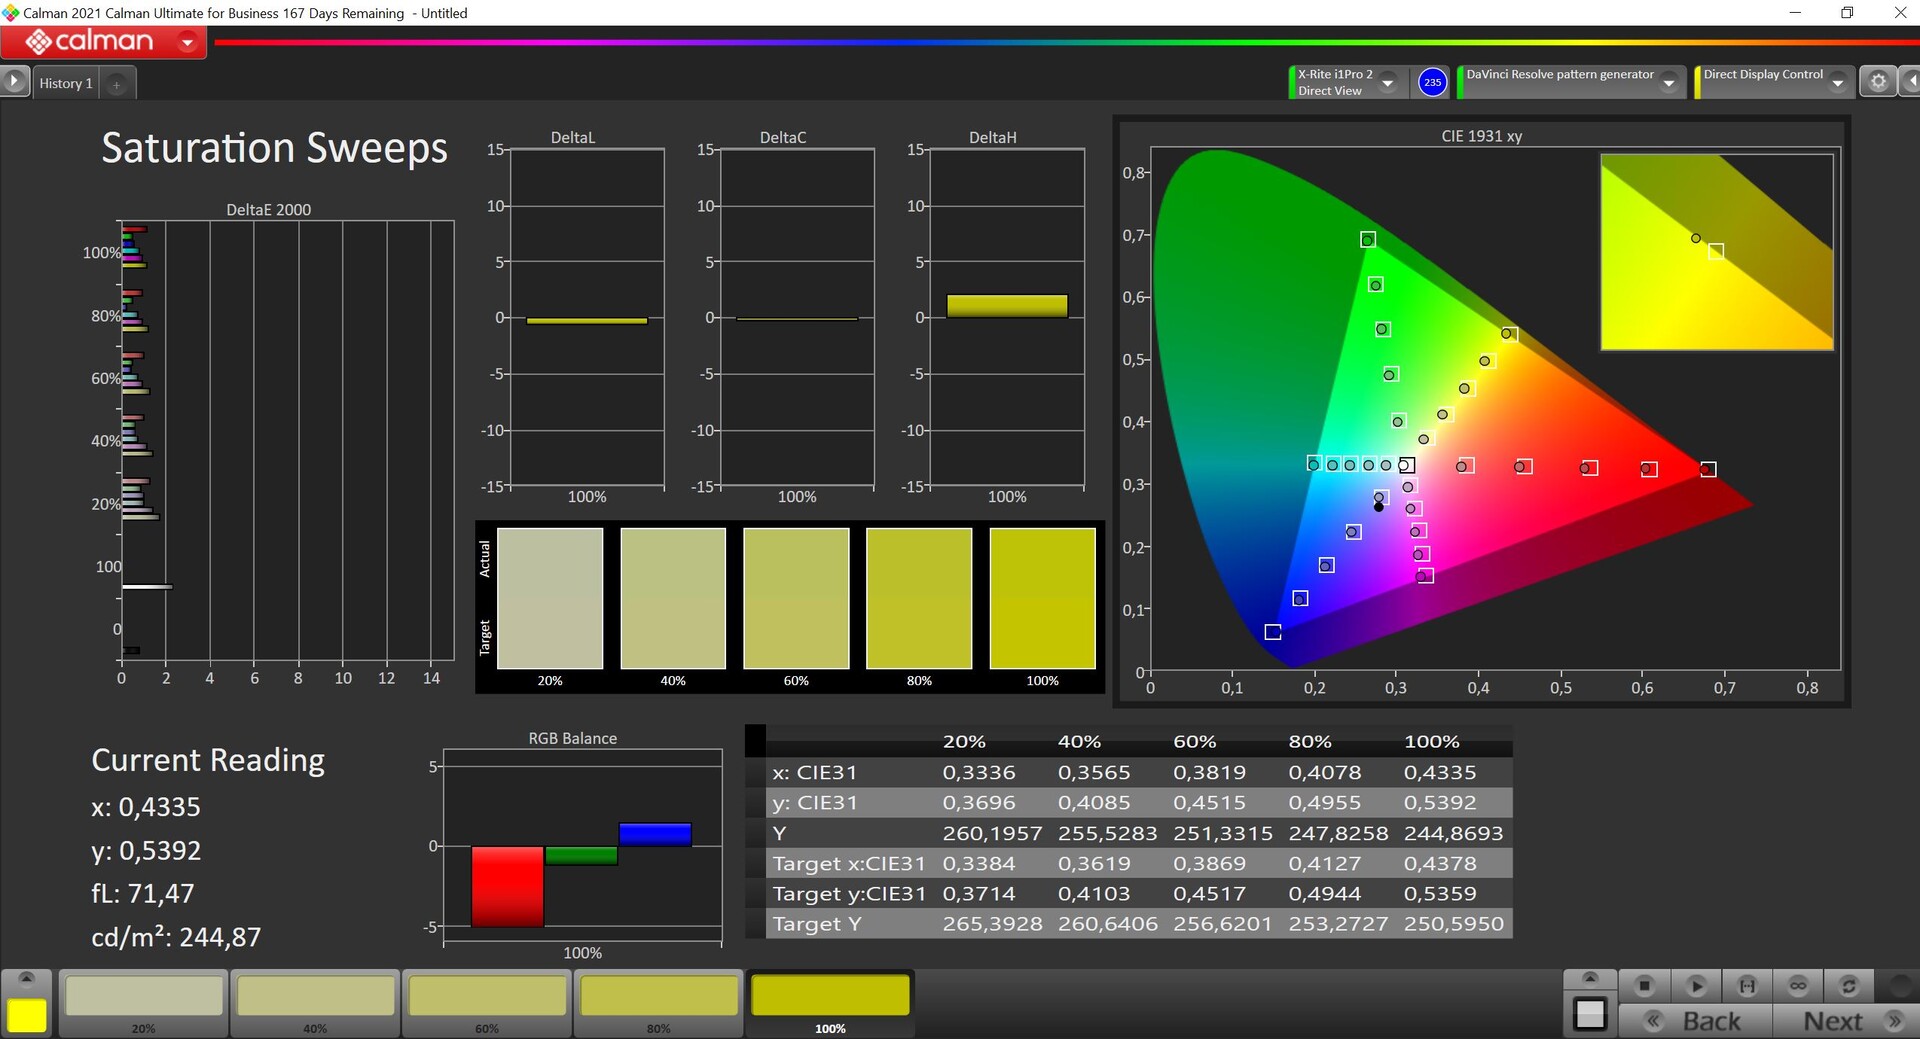
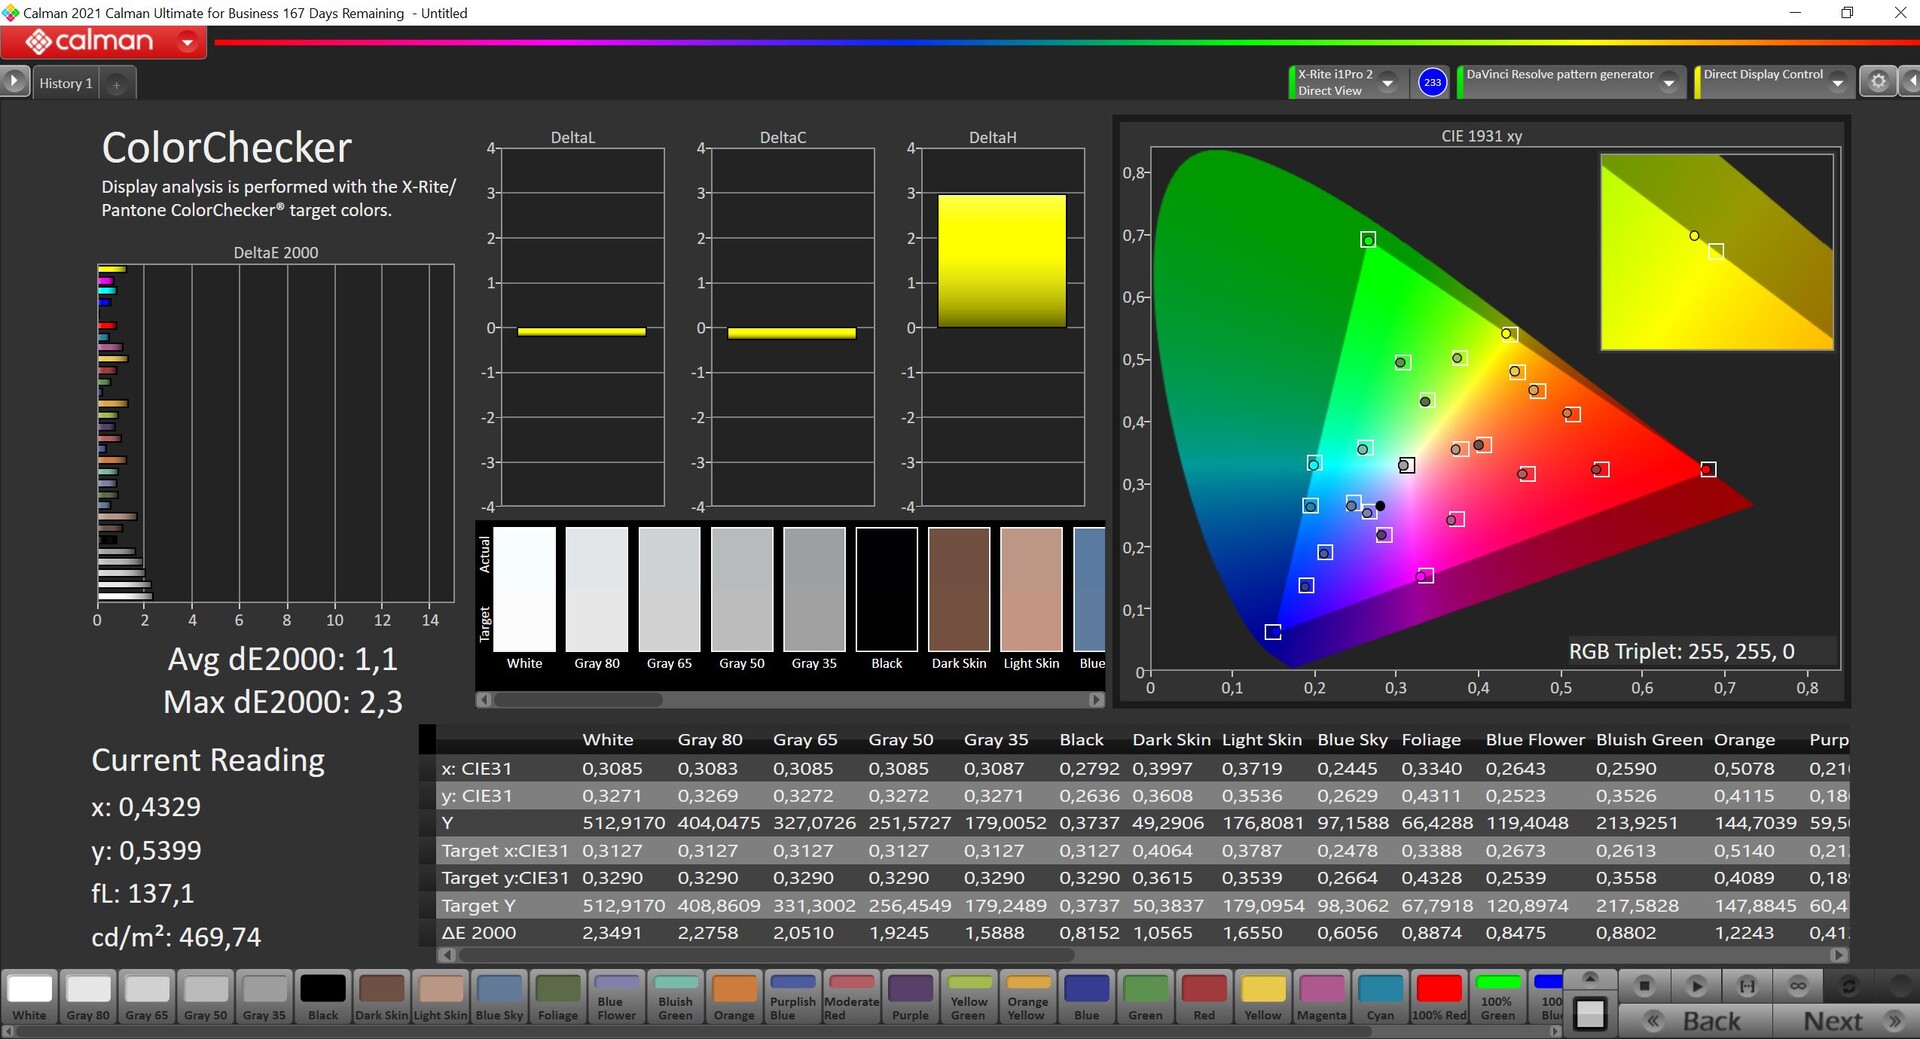
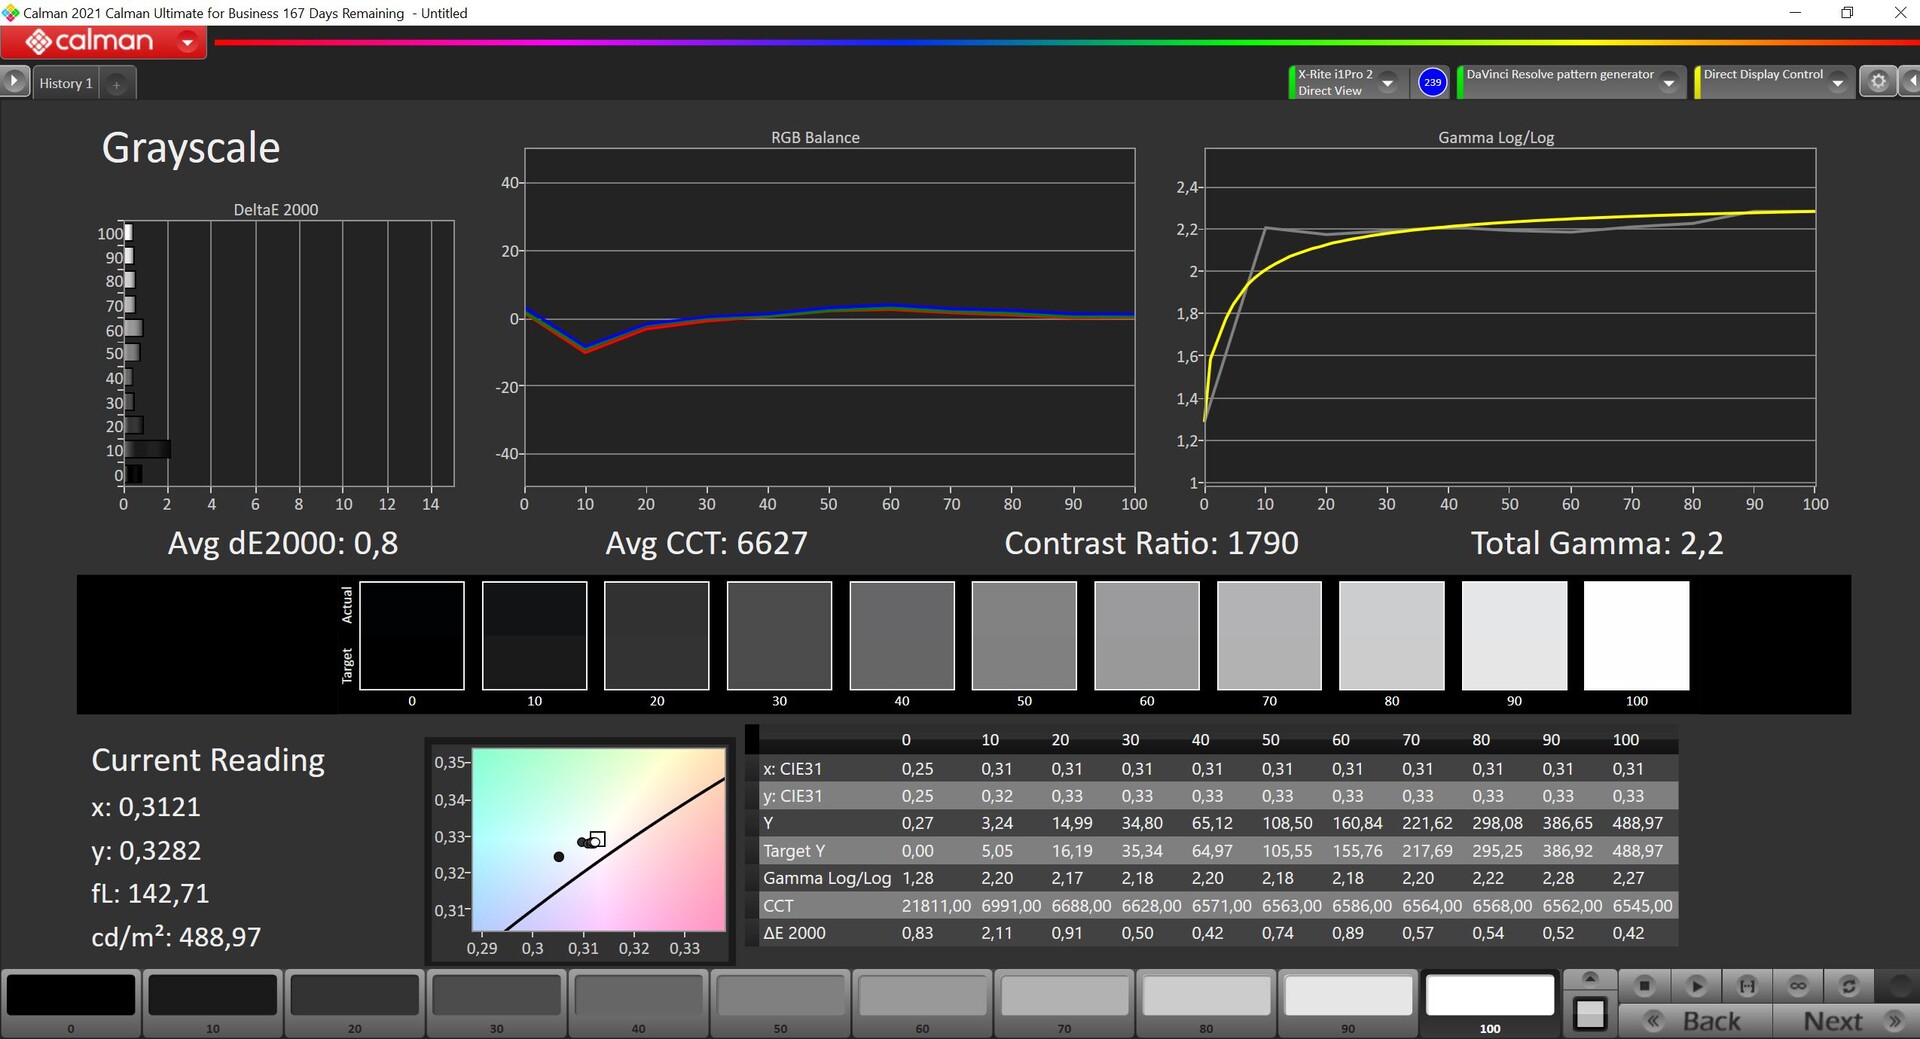
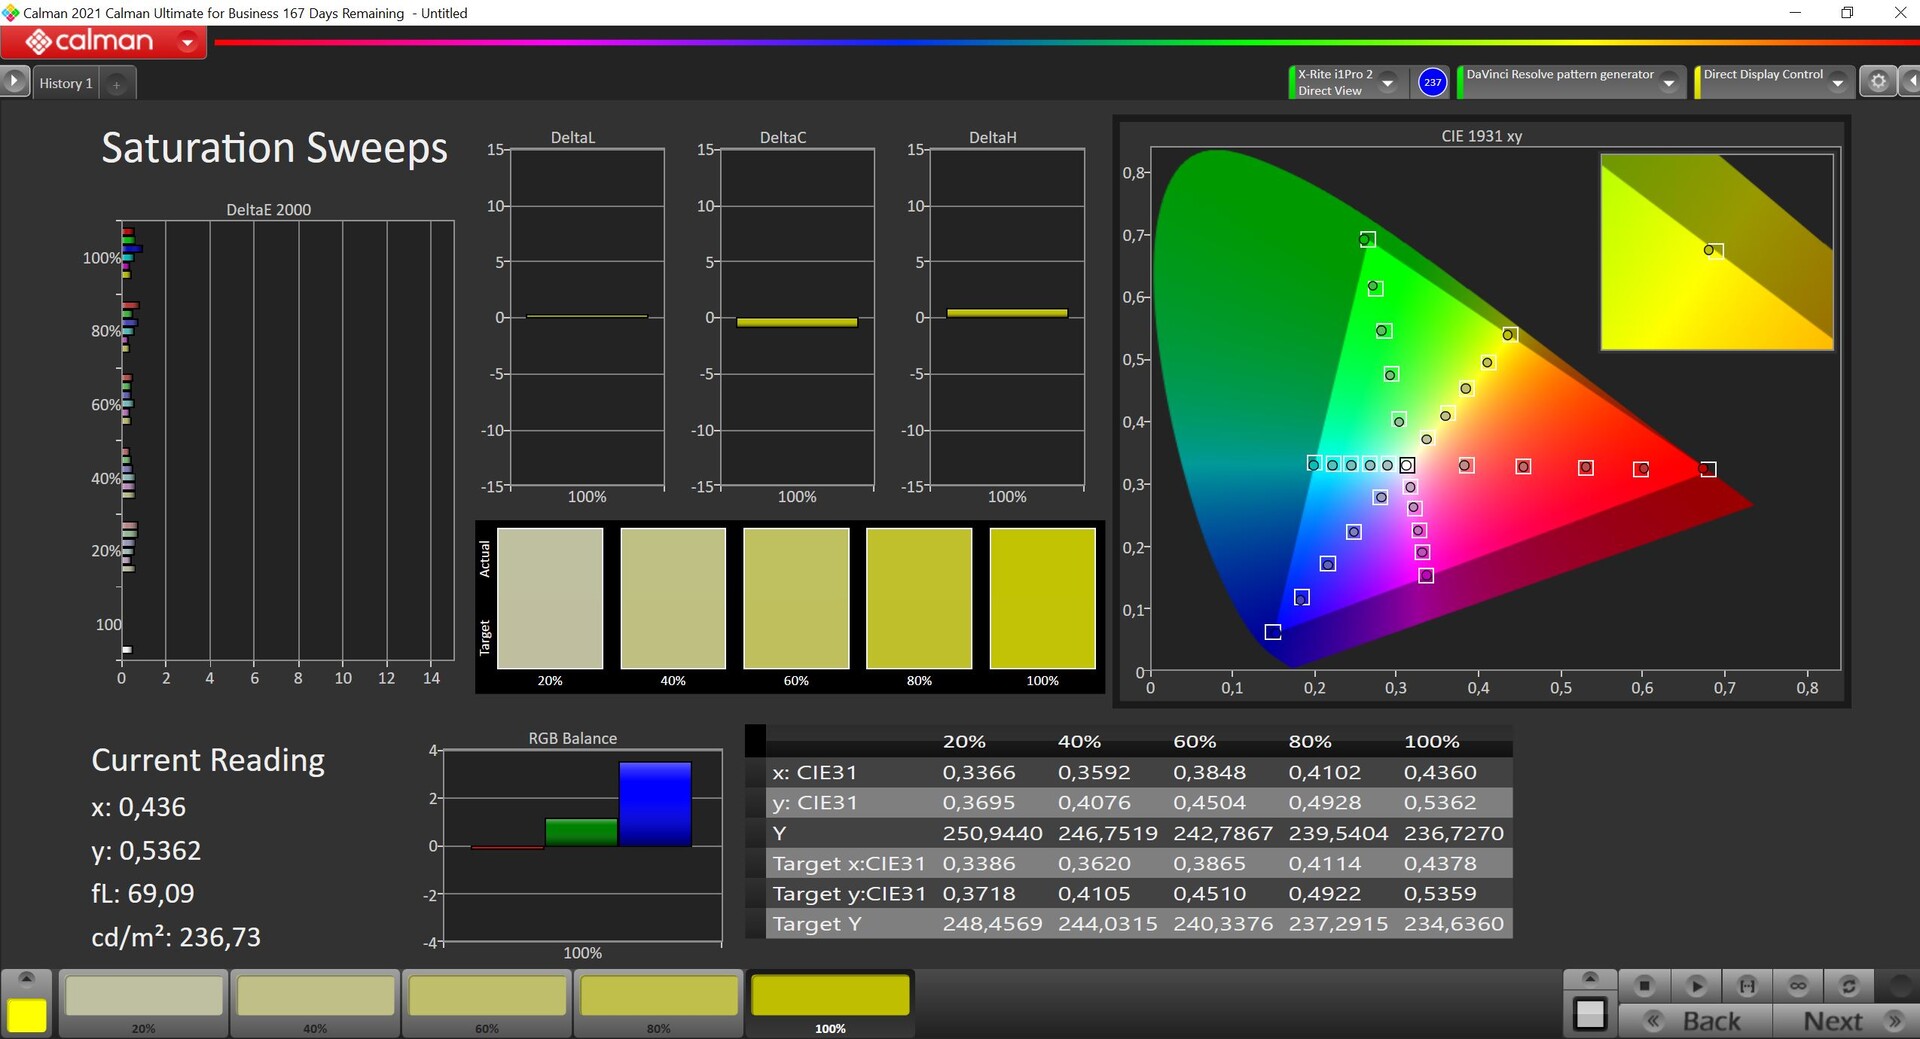
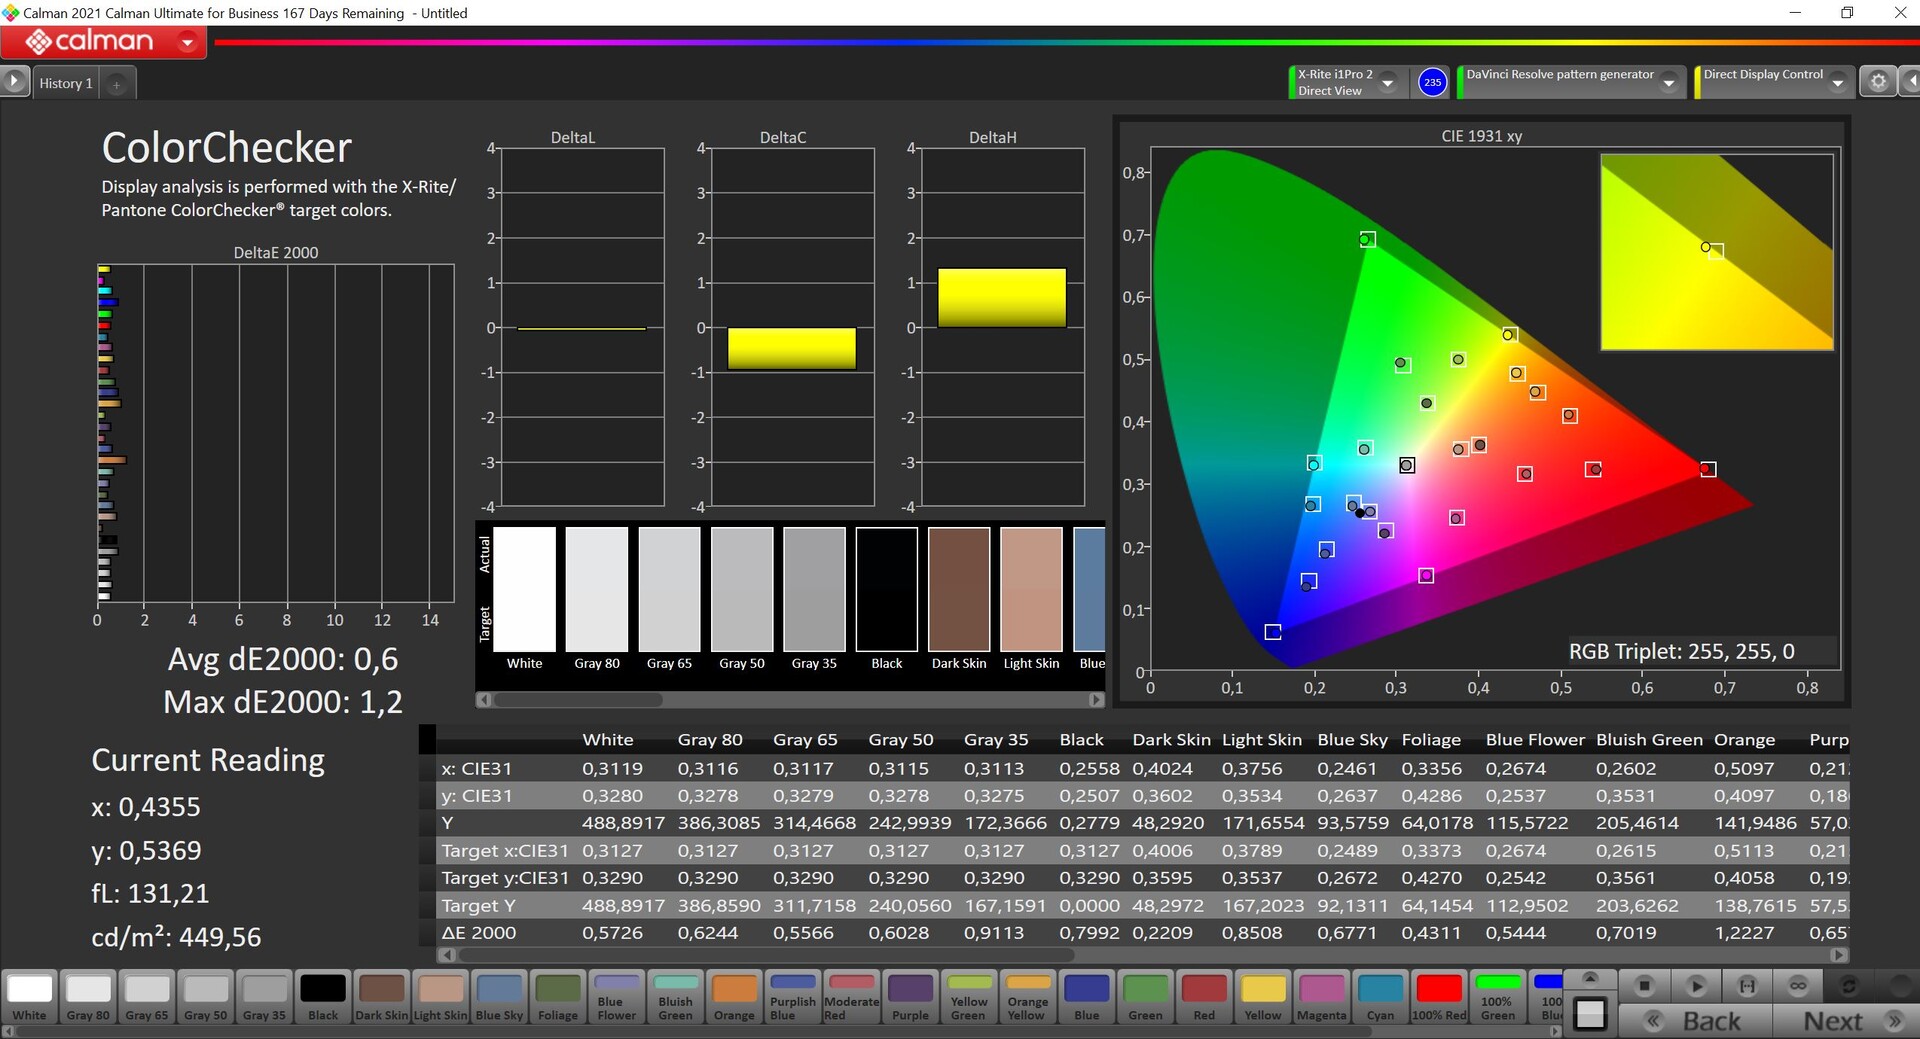
We analyzed the screen with the professional CalMAN software and the X-Rite i1 Pro 2 spectrophotometer. Apple displays are traditionally very well-calibrated out of the box and the 2022 MacBook Pro 13 is no exception. The grayscale only shows a minor color cast towards blue/green in combination with a slightly too cool color temperature, but this is not really visible with the naked eye. The color deviations on the other hand are already clearly below the important mark of 3.
We managed to improve the performance of the display even further with our own calibration and also eliminate the slight color cast (the calibrated profile can be downloaded in the display box above). The MBP 13 almost covers the full P3 gamut, so it is not problem to use the MacBook for picture/video editing in this color space.
Display Response Times
| ↔ Response Time Black to White | ||
|---|---|---|
| 27.8 ms ... rise ↗ and fall ↘ combined | ↗ 14.1 ms rise | 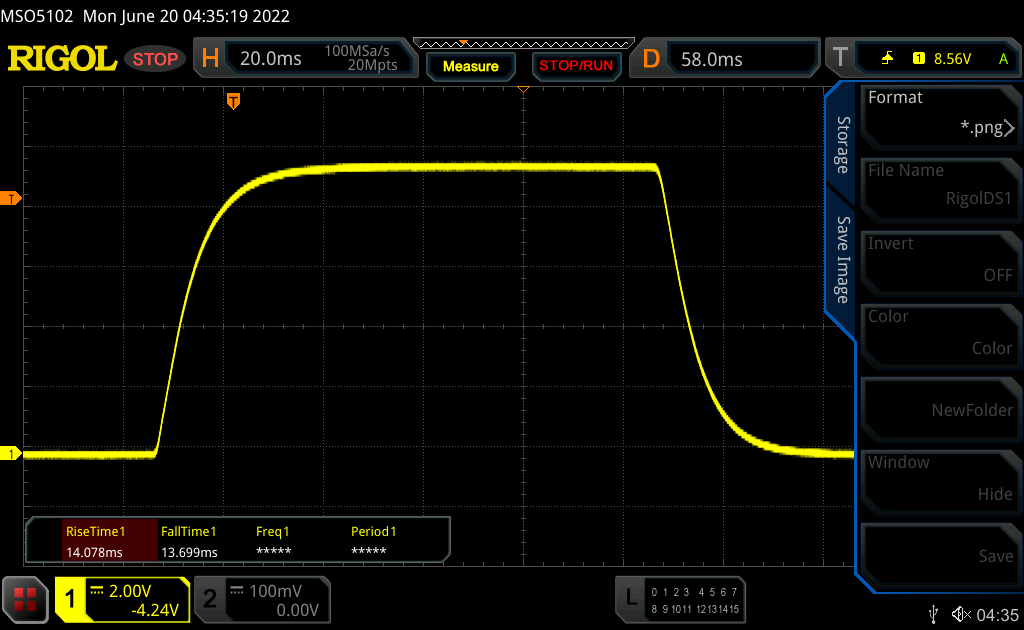 |
| ↘ 13.7 ms fall | ||
| The screen shows relatively slow response rates in our tests and may be too slow for gamers. In comparison, all tested devices range from 0.1 (minimum) to 240 (maximum) ms. » 71 % of all devices are better. This means that the measured response time is worse than the average of all tested devices (19.8 ms). | ||
| ↔ Response Time 50% Grey to 80% Grey | ||
| 42 ms ... rise ↗ and fall ↘ combined | ↗ 19.9 ms rise | 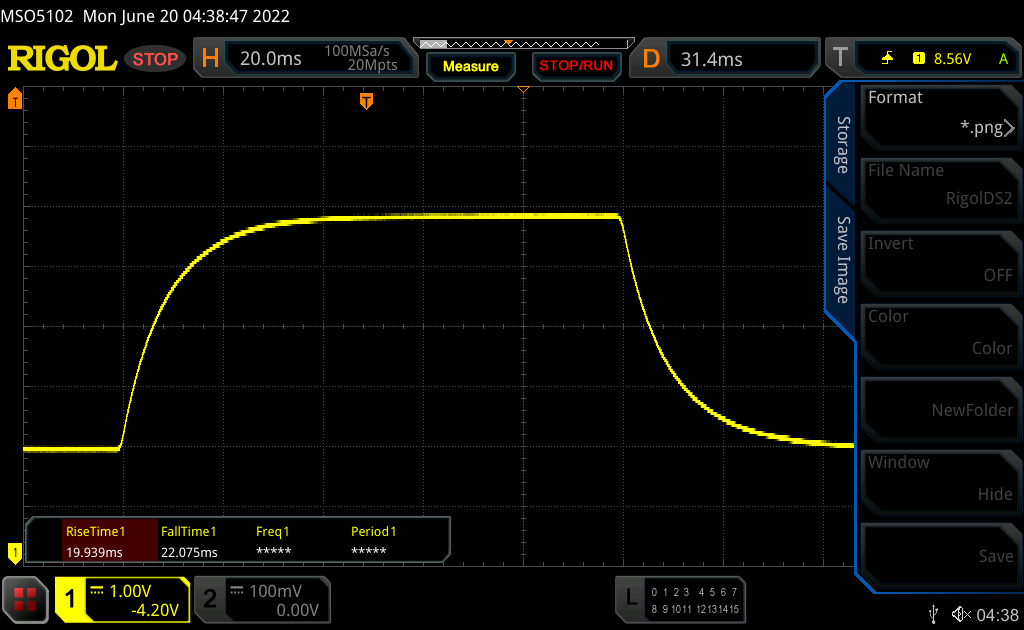 |
| ↘ 22.1 ms fall | ||
| The screen shows slow response rates in our tests and will be unsatisfactory for gamers. In comparison, all tested devices range from 0.165 (minimum) to 636 (maximum) ms. » 67 % of all devices are better. This means that the measured response time is worse than the average of all tested devices (30.9 ms). | ||
Screen Flickering / PWM (Pulse-Width Modulation)
| Screen flickering / PWM detected | 117780 Hz | ≤ 56 % brightness setting | 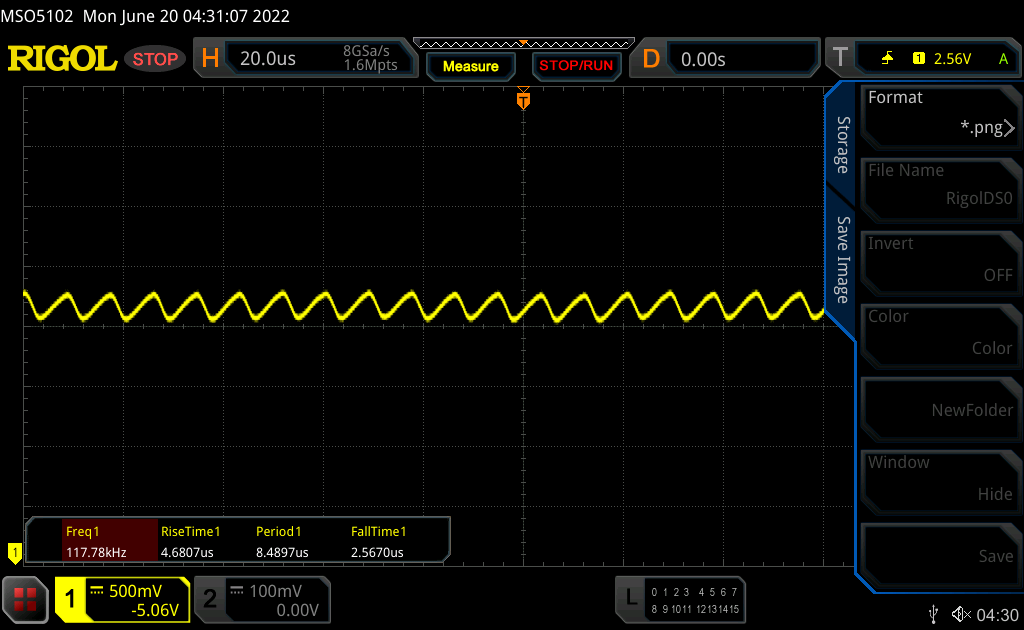 |
The display backlight flickers at 117780 Hz (worst case, e.g., utilizing PWM) Flickering detected at a brightness setting of 56 % and below. There should be no flickering or PWM above this brightness setting. The frequency of 117780 Hz is quite high, so most users sensitive to PWM should not notice any flickering. In comparison: 52 % of all tested devices do not use PWM to dim the display. If PWM was detected, an average of 7741 (minimum: 5 - maximum: 343500) Hz was measured. | |||
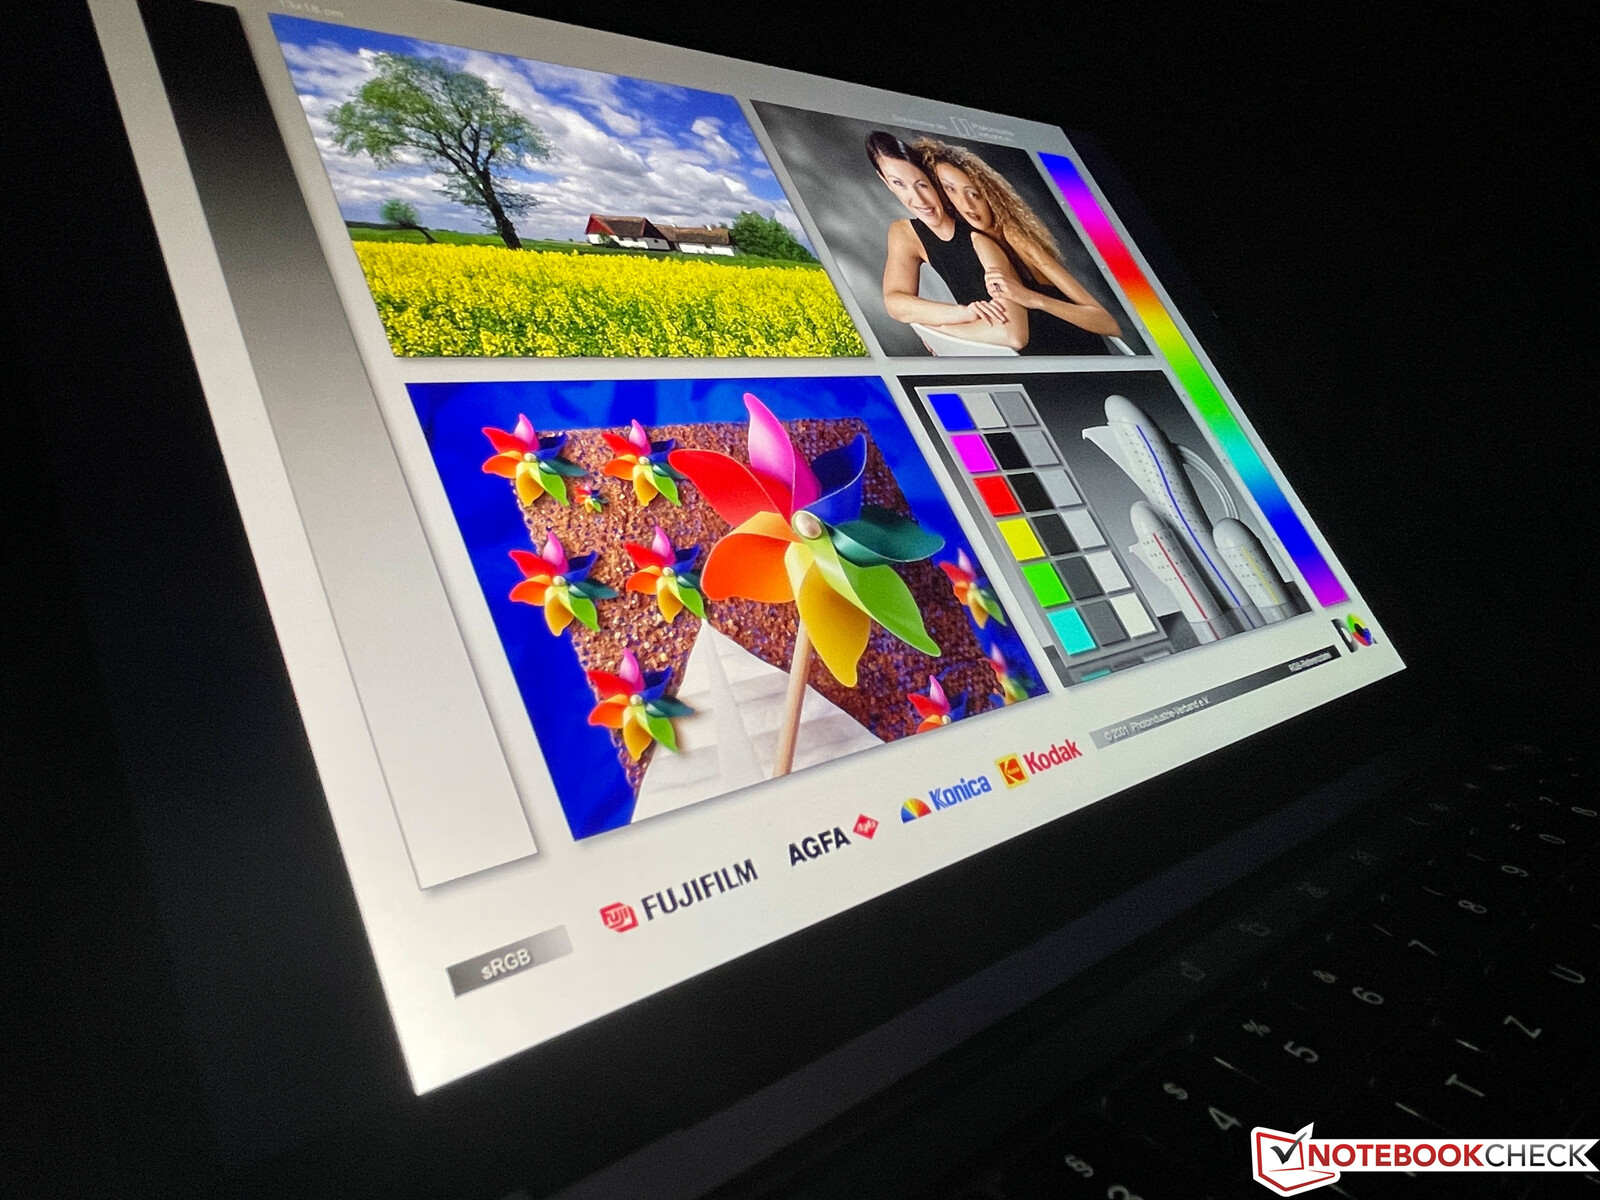
The viewing angle stability of the IPS screen is excellent and the outdoor capabilities are also decent. Apple uses glossy panels, but they are just not as reflective as many competitors. The high brightness also helps to see the display content even in very bright environments. There will obviously be some reflections, but you should be able to find a suitable position and the MBP 13 just has the edge over many glossy rivals in this regard.
Performance - Apple M2 with 16 GB RAM
The 2022 model of the MacBook Pro 13 is always equipped with the faster version of the new M2 processor with 8 CPU cores and 10 GPU cores. The entry-level model gets 8 GB RAM, but you can also select 16 GB and now even 24 GB unified RAM, which is now faster as well (LPDDR5-6400 vs. LPDDR4x-4266 in the M1 MacBook). The entry-level model of the new MacBook Air M2 on the other hand is equipped with a slower 8-core GPU.
Processor - Apple M2
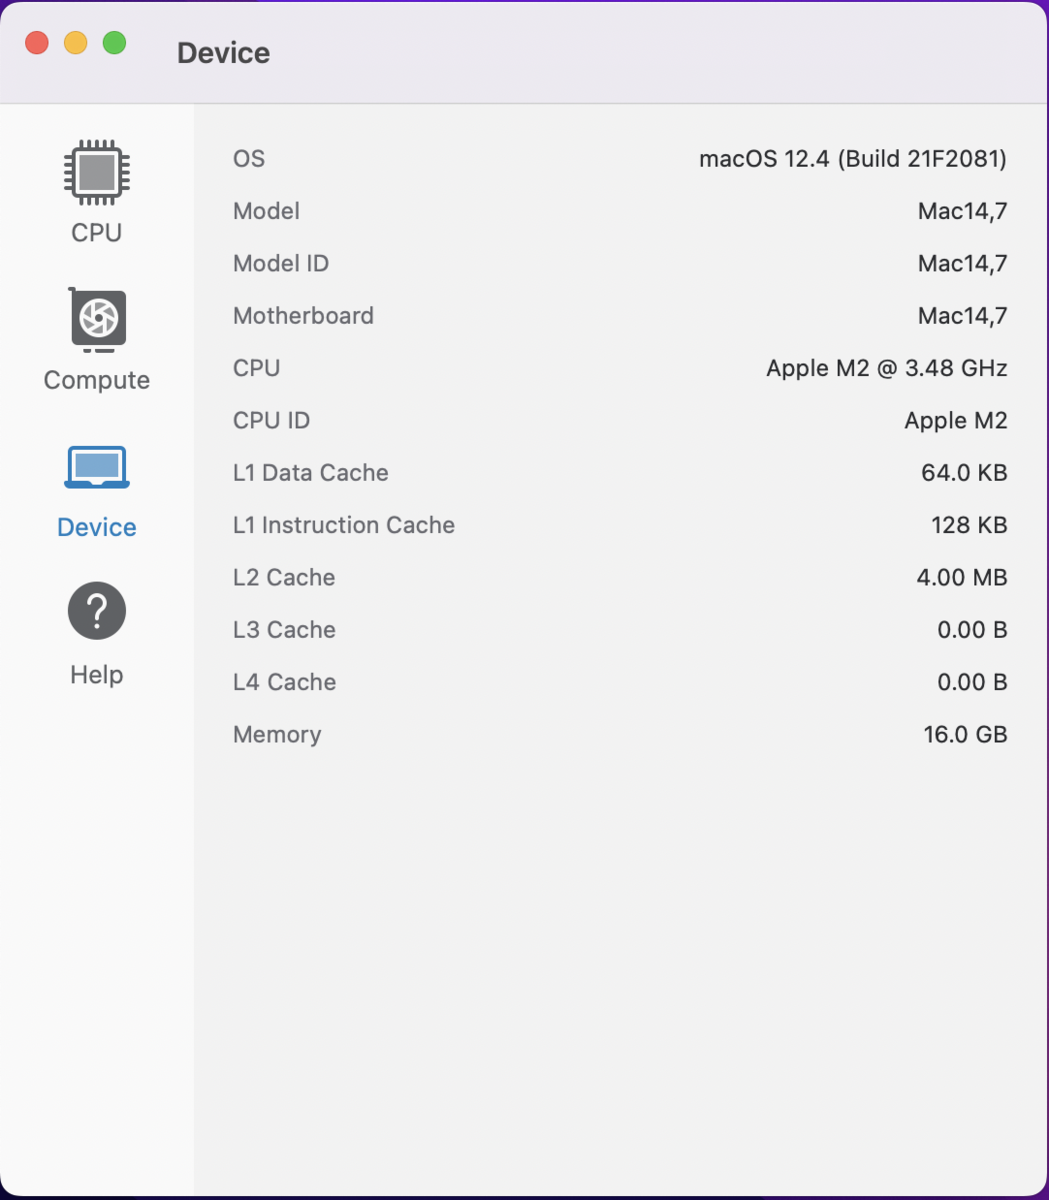
The CPU part of the new Apple M2 SoC did not really change that much and Apple just tweaked the existing chip. We will cover all the changes in a detailed analysis later, but it is still an 8-core CPU with two clusters and slightly higher clocks than before. The efficiency cluster with four cores reaches up to 2.424 GHz (previously 2.064 GHz), while the four performance cores now reach up to 3.48 GHz (previously 3.204 GHz). The manufacturing process was tweaked (now TSMC N5P instead of TSMC N5), but it is still a 5 nm chip and Apple cannot beat the physics, so the higher clocks require more power. The M1 consumes around 15W during multi-core load, the new M2 consumes 19W in the same scenarios. Apple has the same fundamental challenges as the rivals: The comparatively small clock increase requires a lot of additional power.
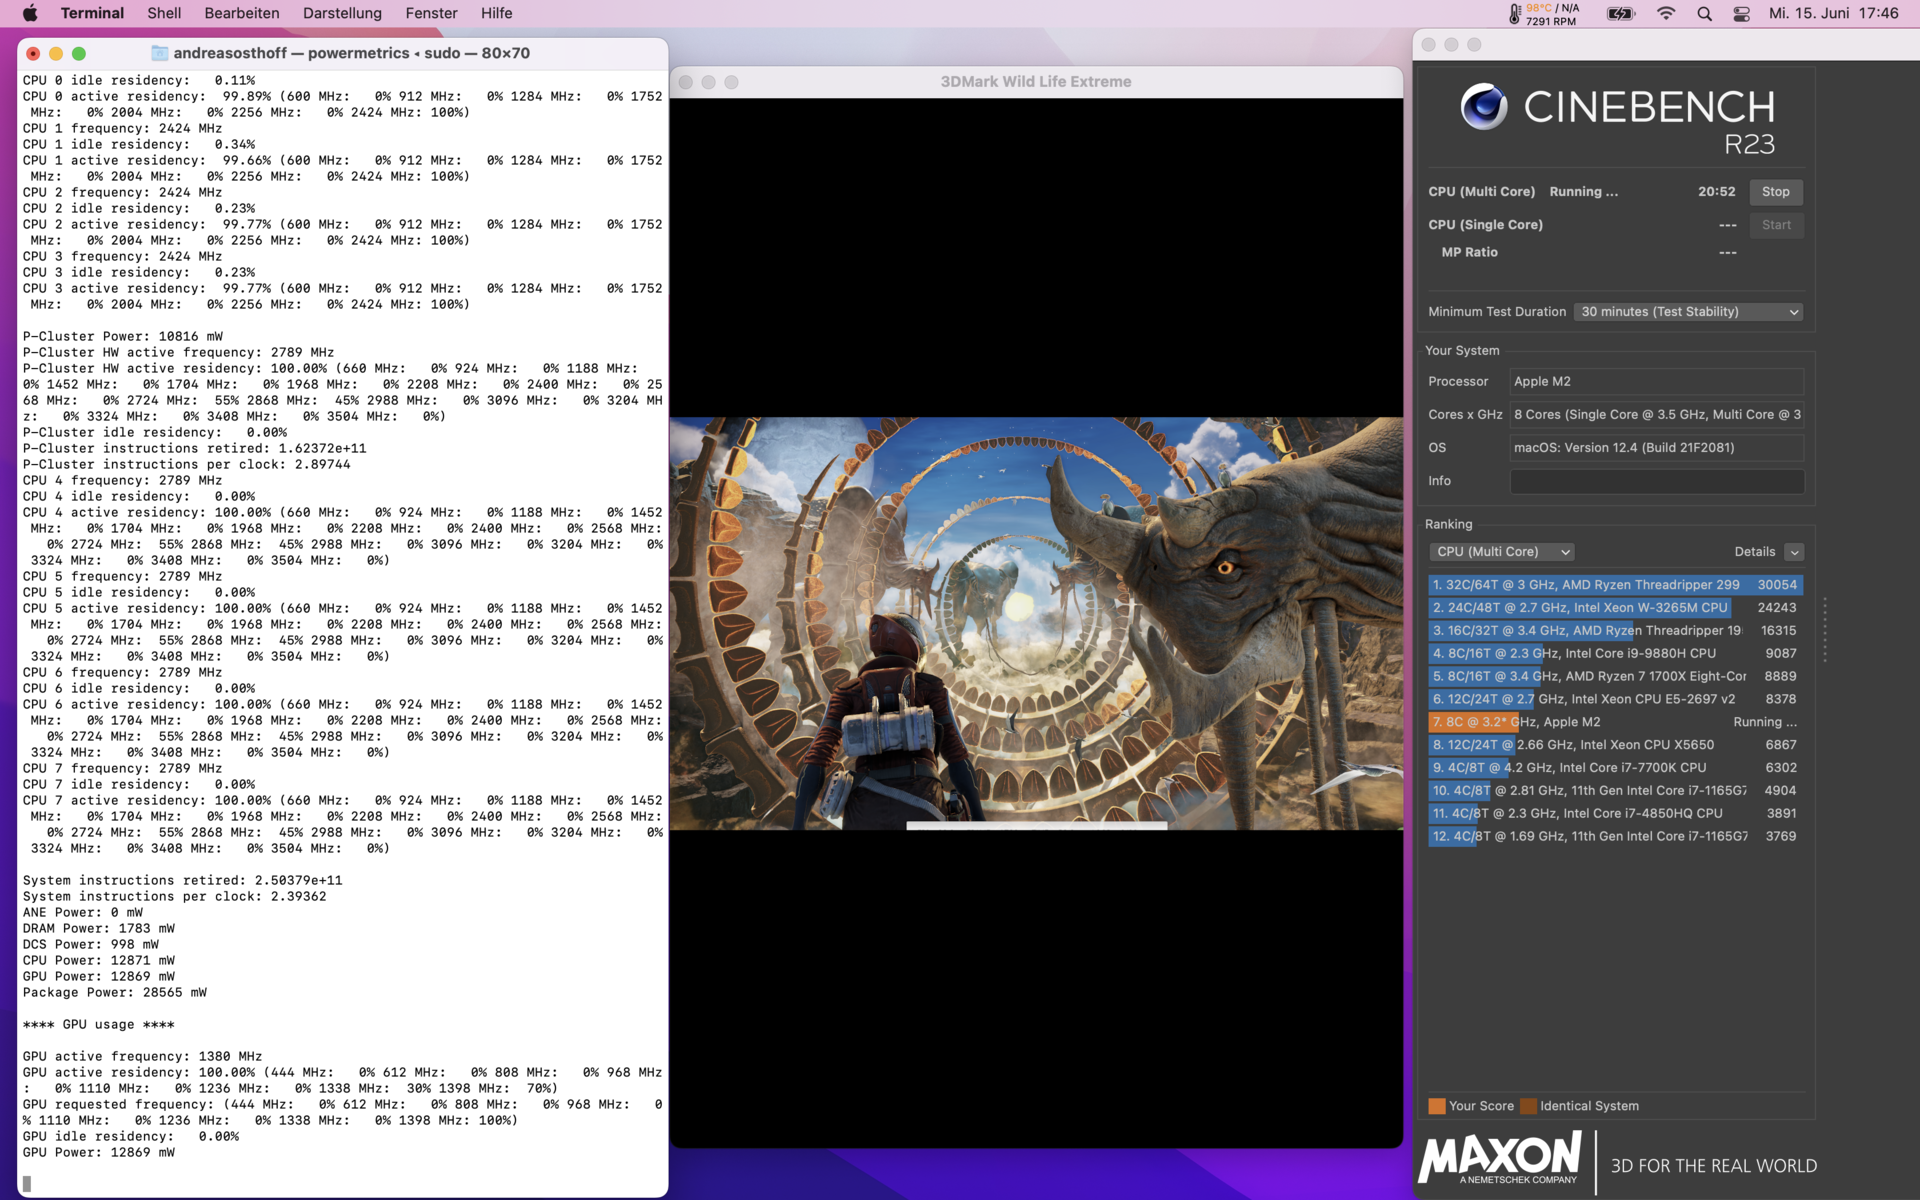
Cinebench R15 Multi Loop
Our Cinebench R15 Multi loop clearly shows that the CPU performance is completely stable under sustained workloads, but we will focus on native benchmarks like Geekbench and Cinebench R23 for the performance comparison. Geekbench Multi shows the biggest performance gains of 18%, which is also advertised by Apple, and the M2 is actually just 10% slower than the small M1 Pro with 8 CPU cores. The advantage over the M1 is a little bit smaller in the other benchmarks (12-15%).
The single-core tests only show a small advantage, but we also saw a maximum consumption of 3.3 GHz in our tests instead of the advertised 3.48 GHz. The overall performance is still very good and also ahead of the new Ryzen 7 6800U, for example. Intel’s current Alder Lake chips offer more performance (see Core i7-1260P in the Lenovo Yoga 9i 14), but they also consume much more power (the i7 requires five times more power for 13% more single-core performance – 5 vs. 26W). At comparable power levels (see Galaxy Book 2 Pro 13), the Core i5-1240P does not stand a chance against the Apple M2 though.
The CPU performance is completely stable on battery power. Please see our tech section for more CPU benchmarks.
Cinebench R20: CPU (Multi Core) | CPU (Single Core)
Cinebench R15: CPU Multi 64Bit | CPU Single 64Bit
Blender: v2.79 BMW27 CPU
Geekbench 5.5: Multi-Core | Single-Core
| Cinebench R20 / CPU (Multi Core) | |
| Average of class Subnotebook (579 - 8541, n=56, last 2 years) | |
| Asus Zenbook S 13 OLED | |
| Lenovo Yoga 9i 14 2022 i7-1260P | |
| Apple MacBook Pro 13 2022 M2 | |
| Average Apple M2 (2231 - 2416, n=5) | |
| Samsung Galaxy Book2 Pro 13 NP930XED-KA1DE | |
| Apple MacBook Pro 13 Late 2020 M1 Entry (8 / 256 GB) | |
| Huawei MateBook 13s i5 11300H | |
| Dell XPS 13 9310 OLED | |
| Apple MacBook Air 2020 M1 Entry | |
| Cinebench R20 / CPU (Single Core) | |
| Average of class Subnotebook (128 - 832, n=56, last 2 years) | |
| Lenovo Yoga 9i 14 2022 i7-1260P | |
| Asus Zenbook S 13 OLED | |
| Dell XPS 13 9310 OLED | |
| Huawei MateBook 13s i5 11300H | |
| Apple MacBook Pro 13 Late 2020 M1 Entry (8 / 256 GB) | |
| Apple MacBook Air 2020 M1 Entry | |
| Apple MacBook Pro 13 2022 M2 | |
| Average Apple M2 (216 - 446, n=5) | |
| Samsung Galaxy Book2 Pro 13 NP930XED-KA1DE | |
| Blender / v2.79 BMW27 CPU | |
| Apple MacBook Air 2020 M1 Entry | |
| Dell XPS 13 9310 OLED | |
| Average Apple M2 (549 - 713, n=5) | |
| Apple MacBook Pro 13 2022 M2 | |
| Samsung Galaxy Book2 Pro 13 NP930XED-KA1DE | |
| Huawei MateBook 13s i5 11300H | |
| Average of class Subnotebook (159 - 2271, n=57, last 2 years) | |
| Asus Zenbook S 13 OLED | |
| Lenovo Yoga 9i 14 2022 i7-1260P | |
* ... smaller is better
System Performance
The previous MacBooks with the Apple M1 processors have already been very snappy devices and this does not change with the new M2 SoC. You cannot really notice a performance difference in everyday situations, which is also confirmed by the similar CrossMark test results, but the M2 performs noticeably better in browser benchmarks we performed with Safari 15.5.
We once again performed the PugetBench tests for the two Adobe apps Photoshop and Premiere Pro. However, the benchmarks only support the emulated Intel versions of the apps, which are subjectively noticeable slower than their macOS optimized counterparts. We already noticed that the results shifted a bit compared to previous M1 MacBook reviews in our review of the Mac Studio, so the PugetBench results are not really representative and should be considered with some caution.
Blackmagic RAW Speed Test: 12:1 8K Metal | 12:1 8K CPU
Premiere Pro PugetBench: Overall Score 0.9
Photoshop PugetBench: Overall Score
Premiere Pro PugetBench: Live Playback 0.9 | Export 0.9 | GPU 0.9
Photoshop PugetBench: Filter Score | General Score | GPU Score
Jetstream 2: 2.0 Total
WebXPRT 3: Overall
Speedometer 2.0: Result 2.0
| CrossMark / Overall | |
| Average of class Subnotebook (365 - 2356, n=59, last 2 years) | |
| Average Apple M2, Apple M2 10-Core GPU (1437 - 1585, n=8) | |
| Apple MacBook Pro 13 2022 M2 | |
| Apple MacBook Pro 14 2021 M1 Pro Entry | |
| Asus Zenbook S 13 OLED | |
| Apple MacBook Air 2020 M1 Entry | |
| Huawei MateBook 13s i5 11300H | |
| CrossMark / Productivity | |
| Average of class Subnotebook (364 - 2277, n=59, last 2 years) | |
| Asus Zenbook S 13 OLED | |
| Huawei MateBook 13s i5 11300H | |
| Average Apple M2, Apple M2 10-Core GPU (1319 - 1441, n=8) | |
| Apple MacBook Pro 13 2022 M2 | |
| Apple MacBook Pro 14 2021 M1 Pro Entry | |
| Apple MacBook Air 2020 M1 Entry | |
| CrossMark / Creativity | |
| Apple MacBook Pro 14 2021 M1 Pro Entry | |
| Average of class Subnotebook (372 - 2743, n=59, last 2 years) | |
| Apple MacBook Pro 13 2022 M2 | |
| Average Apple M2, Apple M2 10-Core GPU (1765 - 1967, n=8) | |
| Apple MacBook Air 2020 M1 Entry | |
| Asus Zenbook S 13 OLED | |
| Huawei MateBook 13s i5 11300H | |
| CrossMark / Responsiveness | |
| Huawei MateBook 13s i5 11300H | |
| Average of class Subnotebook (312 - 1854, n=59, last 2 years) | |
| Asus Zenbook S 13 OLED | |
| Average Apple M2, Apple M2 10-Core GPU (1008 - 1182, n=8) | |
| Apple MacBook Pro 13 2022 M2 | |
| Apple MacBook Pro 14 2021 M1 Pro Entry | |
| Apple MacBook Air 2020 M1 Entry | |
| Blackmagic RAW Speed Test / 12:1 8K Metal | |
| Apple MacBook Pro 14 2021 M1 Pro Entry | |
| Apple MacBook Pro 13 2022 M2 | |
| Average of class Subnotebook (41 - 99, n=5, last 2 years) | |
| Average Apple M2, Apple M2 10-Core GPU (59 - 85, n=4) | |
| Blackmagic RAW Speed Test / 12:1 8K CPU | |
| Average of class Subnotebook (22 - 49, n=5, last 2 years) | |
| Average Apple M2, Apple M2 10-Core GPU (24 - 26, n=4) | |
| Apple MacBook Pro 13 2022 M2 | |
| Apple MacBook Pro 14 2021 M1 Pro Entry | |
| Premiere Pro PugetBench / Overall Score 0.9 | |
| Apple MacBook Pro 14 2021 M1 Pro Entry | |
| Apple MacBook Pro 13 2022 M2 | |
| Average Apple M2, Apple M2 10-Core GPU (500 - 537, n=2) | |
| Apple MacBook Air 2020 M1 Entry | |
| Photoshop PugetBench / Overall Score | |
| Apple MacBook Pro 13 2022 M2 | |
| Average Apple M2, Apple M2 10-Core GPU (747 - 828, n=3) | |
| Apple MacBook Pro 14 2021 M1 Pro Entry | |
| Apple MacBook Air 2020 M1 Entry | |
| Premiere Pro PugetBench / Live Playback 0.9 | |
| Apple MacBook Pro 14 2021 M1 Pro Entry | |
| Apple MacBook Pro 13 2022 M2 | |
| Average Apple M2, Apple M2 10-Core GPU (79.5 - 81.8, n=2) | |
| Apple MacBook Air 2020 M1 Entry | |
| Premiere Pro PugetBench / Export 0.9 | |
| Apple MacBook Pro 13 2022 M2 | |
| Average Apple M2, Apple M2 10-Core GPU (45.4 - 48, n=2) | |
| Apple MacBook Pro 14 2021 M1 Pro Entry | |
| Apple MacBook Air 2020 M1 Entry | |
| Premiere Pro PugetBench / GPU 0.9 | |
| Apple MacBook Pro 14 2021 M1 Pro Entry | |
| Apple MacBook Pro 13 2022 M2 | |
| Average Apple M2, Apple M2 10-Core GPU (24.2 - 26.2, n=2) | |
| Apple MacBook Air 2020 M1 Entry | |
| Photoshop PugetBench / Filter Score | |
| Apple MacBook Pro 13 2022 M2 | |
| Average Apple M2, Apple M2 10-Core GPU (62.8 - 86.9, n=3) | |
| Apple MacBook Pro 14 2021 M1 Pro Entry | |
| Apple MacBook Air 2020 M1 Entry | |
| Photoshop PugetBench / General Score | |
| Average Apple M2, Apple M2 10-Core GPU (78.7 - 86.6, n=3) | |
| Apple MacBook Pro 13 2022 M2 | |
| Apple MacBook Pro 14 2021 M1 Pro Entry | |
| Apple MacBook Air 2020 M1 Entry | |
| Photoshop PugetBench / GPU Score | |
| Apple MacBook Pro 13 2022 M2 | |
| Average Apple M2, Apple M2 10-Core GPU (75.6 - 83.8, n=3) | |
| Apple MacBook Pro 14 2021 M1 Pro Entry | |
| Apple MacBook Air 2020 M1 Entry | |
| Jetstream 2 / 2.0 Total | |
| Average of class Subnotebook (117 - 479, n=27, last 2 years) | |
| Average Apple M2, Apple M2 10-Core GPU (220 - 257, n=8) | |
| Apple MacBook Pro 13 2022 M2 | |
| Asus Zenbook S 13 OLED | |
| Apple MacBook Pro 14 2021 M1 Pro Entry | |
| Apple MacBook Air 2020 M1 Entry | |
| Apple MacBook Air 2020 M1 Entry | |
| Huawei MateBook 13s i5 11300H | |
| Apple MacBook Pro 13 Late 2020 M1 Entry (8 / 256 GB) | |
| Dell XPS 13 9310 OLED | |
| WebXPRT 3 / Overall | |
| Apple MacBook Pro 13 2022 M2 | |
| Average Apple M2, Apple M2 10-Core GPU (342 - 387, n=7) | |
| Apple MacBook Pro 14 2021 M1 Pro Entry | |
| Average of class Subnotebook (156 - 530, n=55, last 2 years) | |
| Apple MacBook Air 2020 M1 Entry | |
| Apple MacBook Air 2020 M1 Entry | |
| Apple MacBook Pro 13 Late 2020 M1 Entry (8 / 256 GB) | |
| Asus Zenbook S 13 OLED | |
| Dell XPS 13 9310 OLED | |
| Huawei MateBook 13s i5 11300H | |
| Samsung Galaxy Book2 Pro 13 NP930XED-KA1DE | |
| Speedometer 2.0 / Result 2.0 | |
| Average of class Subnotebook (110 - 793, n=25, last 2 years) | |
| Apple MacBook Pro 13 2022 M2 | |
| Average Apple M2, Apple M2 10-Core GPU (437 - 445, n=9) | |
| Apple MacBook Air 2020 M1 Entry | |
| Apple MacBook Air 2020 M1 Entry | |
| Apple MacBook Pro 14 2021 M1 Pro Entry | |
| Apple MacBook Pro 13 Late 2020 M1 Entry (8 / 256 GB) | |
| Huawei MateBook 13s i5 11300H | |
| Asus Zenbook S 13 OLED | |
Storage Devices
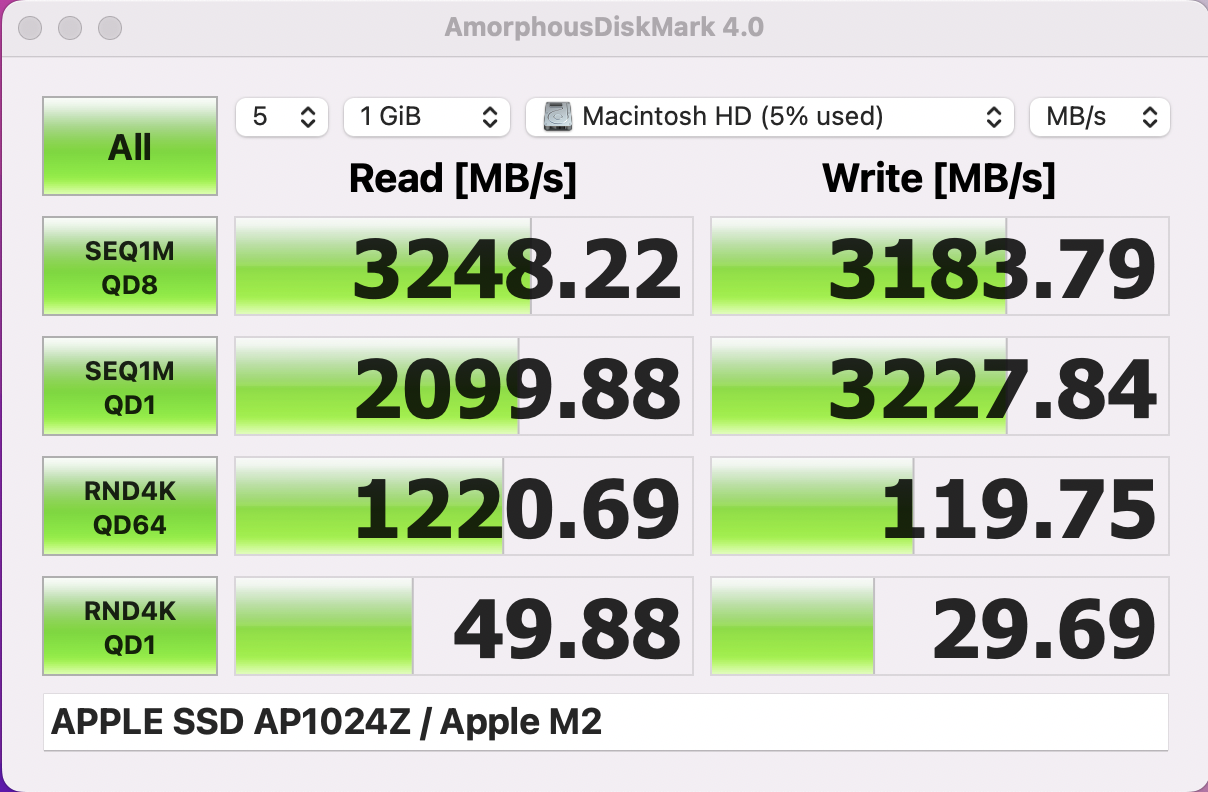
Apple still uses PCIe-3.0-SSDs for the MacBook Pro 13 and the maximum transfer rates are ~3.2 GB/s. This is more than fast enough for everyday tasks, but a PCIe 4.0 drive, which is used in the MacBook Pro 14 for example, would be even faster. Our unit is equipped with a 1 TB SSD and you can use 956 GB for your own apps and files after the initial set-up. The base model is once again shipped with a 256 GB drive, but you can select up to 2 TB SSD storage. More SSD benchmarks are listed here.
GPU Performance
While the performance gains of the CPU part are moderate, we can see a much bigger improvement for the graphics performance of the new M2 SoC, which gets two additional cores (M1: 7 or 8 GPU cores). The M2 GPU should have a maximum consumption of 15W, but we only saw up to 13.5W during our tests with up to 1.398 MHz (the M1 with the 8-core GPU consumes ~10W in the same scenarios). This means the power consumption increase is pretty small for two additional cores.
The benchmark results are very good for this power level and we can see big improvements over the Apple M1 GPU. The performance advantage is around 40% over the 8-core M1 GPU in almost all benchmarks, which is impressive. The new M2 GPU cannot rival the smaller 14-core GPU of the M1 Pro though, which is still between 25-40% faster.
The GPU performance is once again completely stable, both under sustained workloads and on battery power. More GPU benchmarks are available here.
Gaming Performance
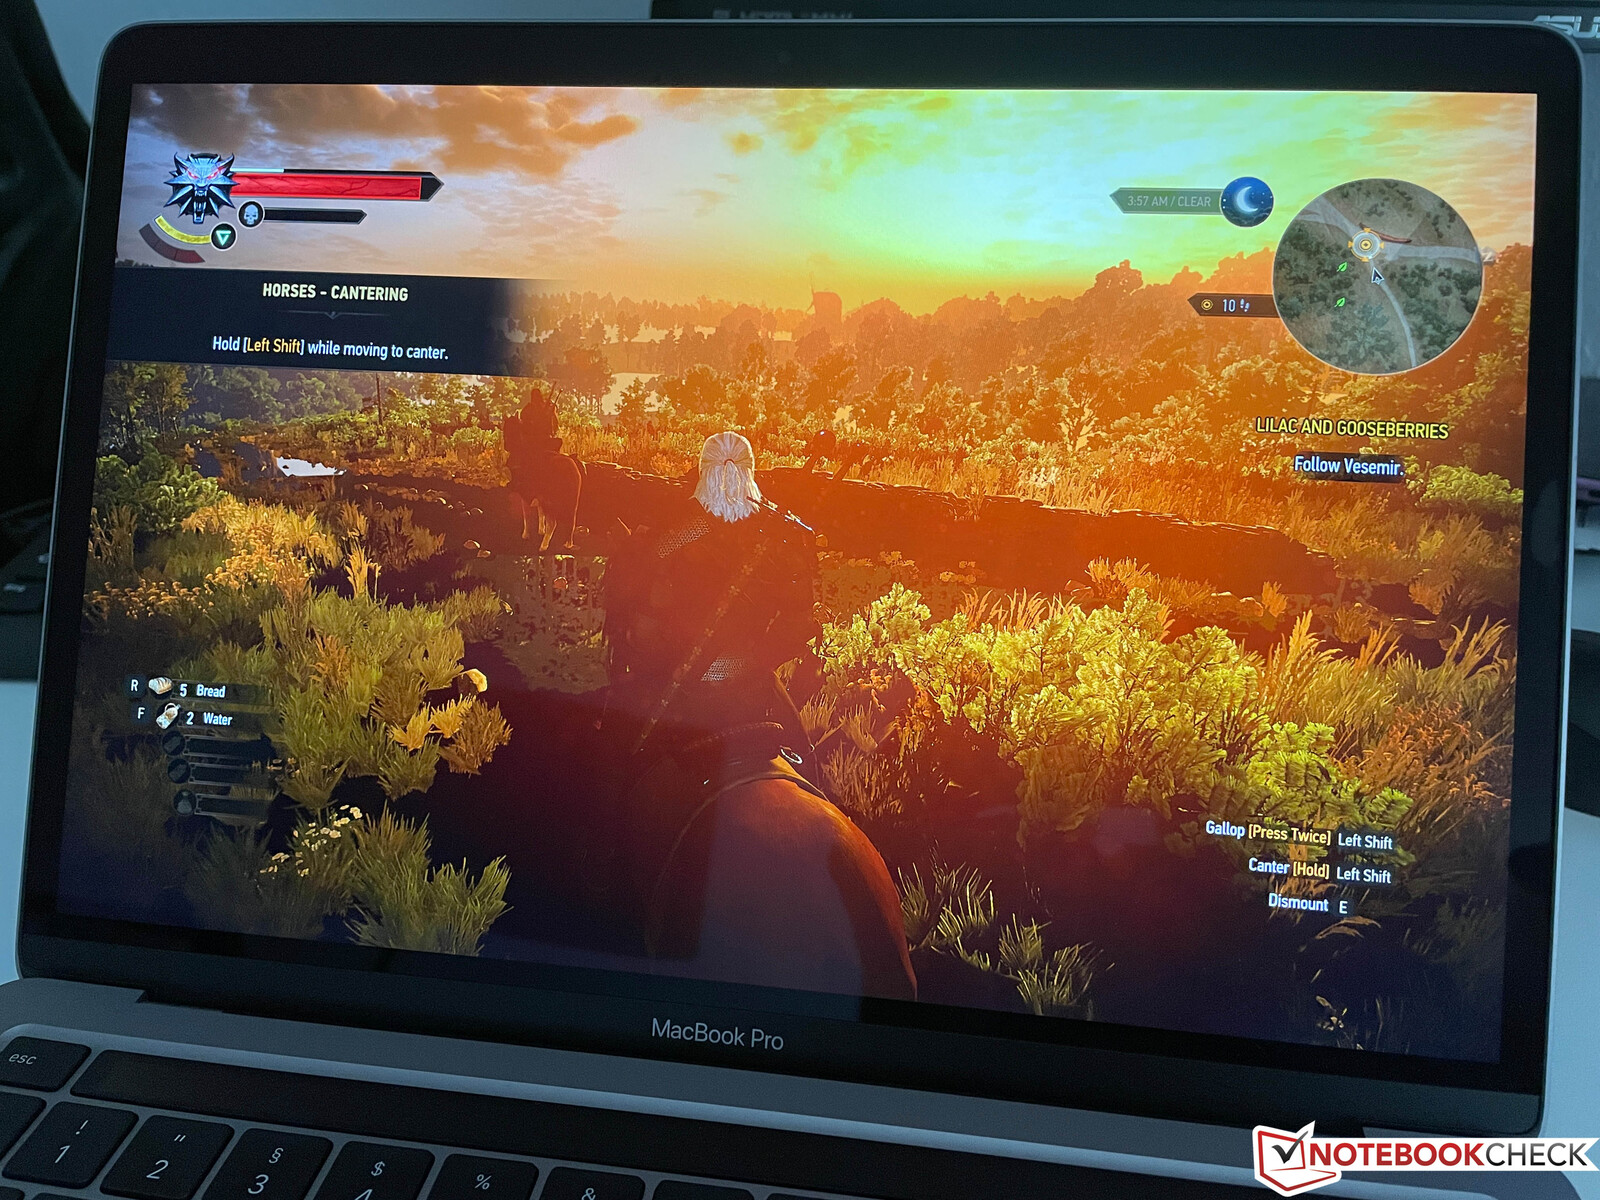
The gaming situation is slowly getting better on the Mac, but the number of available titles is still very limited compared to Windows. In addition to emulated titles like Shadow of the Tomb Raider, there are also more native games like World of Warcraft, which runs very well on the new MacBook Pro 13 M2 with high settings. There will also be a Mac version of No Man’s Sky in fall, for example. CorssOver is another method to use Windows titles, which allowed us to install the Steam version of Witcher 3. However, we noticed some graphics issues compared to the tests on M1 machines, so you cannot really play it very well (even though the subjective performance impression is much better compared to the M1 MBP 13). You can obviously also use titles from Apple’s Arcade collection, which run perfectly on the MacBook.
We noticed some additional issues during our review, and the game Borderlands 3 always crashed in the menus. The benchmark we were able to perform once again show big improvements of 40-50% over the M1 GPU, especially with higher details. The GPU of the M1 Pro (with 14 GPU cores) is still considerably more powerful though.
| Shadow of the Tomb Raider / Medium Preset | |
| Apple MacBook Pro 14 2021 M1 Pro Entry | |
| Apple MacBook Pro 13 2022 M2 | |
| Average of class Subnotebook (16 - 54, n=7, last 2 years) | |
| Average Apple M2 10-Core GPU (28 - 40, n=4) | |
| Apple MacBook Pro 13 Late 2020 M1 Entry (8 / 256 GB) | |
| Apple MacBook Air 2020 M1 Entry | |
| Shadow of the Tomb Raider / High Preset | |
| Apple MacBook Pro 14 2021 M1 Pro Entry | |
| Average of class Subnotebook (18 - 48, n=6, last 2 years) | |
| Apple MacBook Pro 13 2022 M2 | |
| Average Apple M2 10-Core GPU (25 - 36, n=4) | |
| Apple MacBook Pro 13 Late 2020 M1 Entry (8 / 256 GB) | |
| Total War: Three Kingdoms / High (incl textures) | |
| Apple MacBook Pro 14 2021 M1 Pro Entry | |
| Apple MacBook Pro 13 2022 M2 | |
| Average Apple M2 10-Core GPU (22 - 29.5, n=4) | |
| Apple MacBook Pro 13 Late 2020 M1 Entry (8 / 256 GB) | |
| Apple MacBook Air 2020 M1 Entry | |
| Total War: Three Kingdoms / Ultra (incl textures) | |
| Apple MacBook Pro 14 2021 M1 Pro Entry | |
| Apple MacBook Pro 13 2022 M2 | |
| Average Apple M2 10-Core GPU (15.9 - 21.3, n=4) | |
| low | med. | high | ultra | QHD | |
|---|---|---|---|---|---|
| Shadow of the Tomb Raider (2018) | 39 | 36 | 31 | 20 | |
| Total War: Three Kingdoms (2019) | 89 | 47 | 29 | 21 |
Emissions - MBP 13 is often silent, but the fan can be annoying
System Noise
The single fan of the MacBook Pro 13 is often completely deactivated when you just perform your daily tasks and the lowest fan speed at 1200 rpm is not audible, either, so you can enjoy a silent device in many situations. The fan curve is very defensive in general and Apple accepts high chip temperatures. Short peak load is usually compensated without the use of the fan, which was also the case during many of our benchmarks (a single run of Cinebench R23 Multi, for instance).
The following table shows the noise levels with different fan speeds. Emulated apps tend to result in more fan activity compared to native apps, but it will only be loud when you really stress the CPU and the GPU at the same time. We measured up to 49 dB(A) during the stress test, which is a lot for such a compact device.
| Fan speed (rpm) | Fan noise (dB(A)) | Application |
|---|---|---|
| 2300 | 24.5 | - |
| 2800 | 25.7 | Cinebench R23 Multi after 2 minutes |
| 3200 | 28 | Blender 3.2 |
| 3600 | 29.4 | Cinebench R23 Multi after 5 minutes |
| 4000 | 32 | - |
| 4400 | 34.6 | Shadow of the Tomb Raider (emulated), Witcher 3 (via CrossOver) |
| 4800 | 37.2 | World of Warcraft |
| 5200 | 40 | Cinebench R15 Multi loop (emulated) |
| 5600 | 42.7 | Premiere Pro Puget Bench (emulated), sometimes also full fan speed |
| 6000 | 44.5 | |
| 6400 | 45.7 | |
| 6800 | 47.4 | |
| 7200 | 49 | Stress test |
We also noticed that the fan creates a rather unpleasant noise in the range between 2800-3200 rpm, which is a bit annoying. It is covered by the fan murmur at higher speeds though. All in all, the active cooling solution of the MacBook Pro 13 is not ideal. It can be really loud, but there are still scenarios where the cooling performance is insufficient, which we will see in the next review section.
We did not notice an increased fan activity in combination with an external screen. Our review unit did not show any other electronic sounds like coil whine.
Noise level
| Idle |
| 23.9 / 23.9 / 23.9 dB(A) |
| Load |
| 23.9 / 49 dB(A) |
 | ||
30 dB silent 40 dB(A) audible 50 dB(A) loud |
||
min: | ||
| Apple MacBook Pro 13 2022 M2 M2 10-Core GPU, M2, Apple SSD AP1024Z | Apple MacBook Pro 13 Late 2020 M1 Entry (8 / 256 GB) M1 8-Core GPU, M1, Apple SSD AP0256 | Asus Zenbook S 13 OLED Radeon 680M, R7 6800U, Samsung PM9A1 MZVL21T0HCLR | Samsung Galaxy Book2 Pro 13 NP930XED-KA1DE Iris Xe G7 80EUs, i5-1240P, Samsung PM991a MZVLQ256HBJD | Huawei MateBook 13s i5 11300H Iris Xe G7 80EUs, i5-11300H, Phison Electronics PS5012 | Dell XPS 13 9310 OLED Iris Xe G7 96EUs, i7-1185G7, Toshiba XG6 KXG60ZNV512G | |
|---|---|---|---|---|---|---|
| Noise | -18% | -6% | -10% | -8% | -0% | |
| off / environment * (dB) | 23.9 | 29.2 -22% | 24 -0% | 24.6 -3% | 24.5 -3% | 24.8 -4% |
| Idle Minimum * (dB) | 23.9 | 29.2 -22% | 24 -0% | 24.6 -3% | 24.5 -3% | 25 -5% |
| Idle Average * (dB) | 23.9 | 29.2 -22% | 24 -0% | 24.6 -3% | 24.5 -3% | 25 -5% |
| Idle Maximum * (dB) | 23.9 | 29.2 -22% | 24 -0% | 26.3 -10% | 28 -17% | 25 -5% |
| Load Average * (dB) | 23.9 | 32.1 -34% | 33.1 -38% | 38.4 -61% | 35.9 -50% | 25.3 -6% |
| Witcher 3 ultra * (dB) | 34.6 | 40.2 -16% | 35.9 -4% | 35.8 -3% | ||
| Load Maximum * (dB) | 49 | 41.9 14% | 41.7 15% | 38.7 21% | 38.6 21% | 35.8 27% |
* ... smaller is better
Temperature
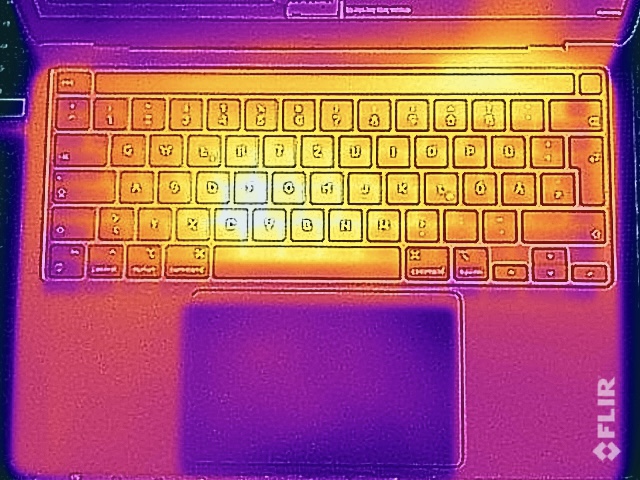
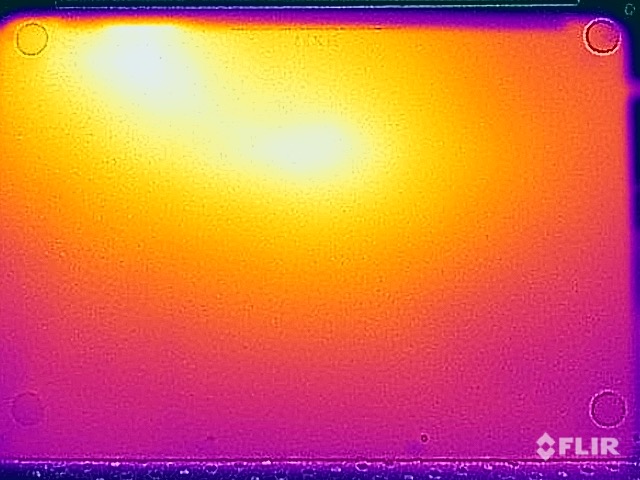
The aluminum chassis of the MacBook Pro 13 does not have any temperature issues and it only gets noticeably warm when you really stress the CPU as well as the GPU at the same time. Still, up to 43 °C at the bottom mean that you can put it on your lap without any problems, even under maximum load (let alone common workloads). The keyboard also gets warmer, but there are no limitations, either.
We can see a maximum package power of 35W for the M2 SoC during combined CPU/GPU load. However, this value can only be maintained for a couple of seconds before there is a drop to around 25W while the fans speed is slowly increasing. The package power will stabilize at 28-30W once the fan has reached its maximum speed, but the chip temperature is still very high at 98 °C. This means the cooling solution cannot utilize the full potential of the M2 chip, despite the fan.
(-) The maximum temperature on the upper side is 45.1 °C / 113 F, compared to the average of 35.9 °C / 97 F, ranging from 21.4 to 59 °C for the class Subnotebook.
(±) The bottom heats up to a maximum of 43 °C / 109 F, compared to the average of 39.2 °C / 103 F
(+) In idle usage, the average temperature for the upper side is 24.9 °C / 77 F, compared to the device average of 30.8 °C / 87 F.
(+) The palmrests and touchpad are reaching skin temperature as a maximum (33.6 °C / 92.5 F) and are therefore not hot.
(-) The average temperature of the palmrest area of similar devices was 28.2 °C / 82.8 F (-5.4 °C / -9.7 F).
| Apple MacBook Pro 13 2022 M2 Apple M2, Apple M2 10-Core GPU | Apple MacBook Pro 13 Late 2020 M1 Entry (8 / 256 GB) Apple M1, Apple M1 8-Core GPU | Apple MacBook Air 2020 M1 Entry Apple M1, Apple M1 7-Core GPU | Asus Zenbook S 13 OLED AMD Ryzen 7 6800U, AMD Radeon 680M | Samsung Galaxy Book2 Pro 13 NP930XED-KA1DE Intel Core i5-1240P, Intel Iris Xe Graphics G7 80EUs | Huawei MateBook 13s i5 11300H Intel Core i5-11300H, Intel Iris Xe Graphics G7 80EUs | Dell XPS 13 9310 OLED Intel Core i7-1185G7, Intel Iris Xe Graphics G7 96EUs | |
|---|---|---|---|---|---|---|---|
| Heat | 7% | -3% | -12% | -14% | -2% | -8% | |
| Maximum Upper Side * (°C) | 45.1 | 41 9% | 44 2% | 47.9 -6% | 47.9 -6% | 42.8 5% | 46.6 -3% |
| Maximum Bottom * (°C) | 43 | 40.4 6% | 44 -2% | 56.1 -30% | 51.3 -19% | 46.9 -9% | 46 -7% |
| Idle Upper Side * (°C) | 25.2 | 23.6 6% | 27 -7% | 26.8 -6% | 28.5 -13% | 25.2 -0% | 26.6 -6% |
| Idle Bottom * (°C) | 25.4 | 23.6 7% | 27 -6% | 27.3 -7% | 29.6 -17% | 26 -2% | 29.2 -15% |
* ... smaller is better
Speakers
The MacBook Pro 13 is still equipped with stereo speakers, which sound very good and better compared to many other Ultrabooks and subnotebooks. Compared to Apple systems with more speakers (like the MacBook Pro 14), the sound lacks a bit of power and spatial awareness. We are already eager to test the new MacBook Air with the new four-speakers sound system.
Apple MacBook Pro 13 2022 M2 audio analysis
(±) | speaker loudness is average but good (81.8 dB)
Bass 100 - 315 Hz
(±) | reduced bass - on average 9.9% lower than median
(±) | linearity of bass is average (10% delta to prev. frequency)
Mids 400 - 2000 Hz
(+) | balanced mids - only 2.8% away from median
(+) | mids are linear (2.7% delta to prev. frequency)
Highs 2 - 16 kHz
(+) | balanced highs - only 2.6% away from median
(+) | highs are linear (4.1% delta to prev. frequency)
Overall 100 - 16.000 Hz
(+) | overall sound is linear (10% difference to median)
Compared to same class
» 7% of all tested devices in this class were better, 2% similar, 91% worse
» The best had a delta of 5%, average was 18%, worst was 53%
Compared to all devices tested
» 4% of all tested devices were better, 1% similar, 94% worse
» The best had a delta of 4%, average was 23%, worst was 134%
Apple MacBook Pro 14 2021 M1 Pro Entry audio analysis
(+) | speakers can play relatively loud (84.9 dB)
Bass 100 - 315 Hz
(+) | good bass - only 4.3% away from median
(+) | bass is linear (5.9% delta to prev. frequency)
Mids 400 - 2000 Hz
(+) | balanced mids - only 1.1% away from median
(+) | mids are linear (1.9% delta to prev. frequency)
Highs 2 - 16 kHz
(+) | balanced highs - only 2.9% away from median
(+) | highs are linear (3% delta to prev. frequency)
Overall 100 - 16.000 Hz
(+) | overall sound is linear (5.6% difference to median)
Compared to same class
» 2% of all tested devices in this class were better, 1% similar, 97% worse
» The best had a delta of 5%, average was 17%, worst was 45%
Compared to all devices tested
» 0% of all tested devices were better, 0% similar, 100% worse
» The best had a delta of 4%, average was 23%, worst was 134%
Energy Management - Almost 20 hours battery runtime with the new M2
Power Consumption
The MacBook Pro 13 is very efficient, especially in scenarios with light workloads, but this was already the case for the previous MBP 13 with the M1 SoC. Our load measurements once again show the increased power consumption of the M2 chip. The stress test result also confirms that the full potential of the M2 cannot be utilized for long. We measured up to 56W, which later stabilized at around 48W. The 67W power adapter is therefore completely sufficient.
| Off / Standby | |
| Idle | |
| Load |
|
Key:
min: | |
| Apple MacBook Pro 13 2022 M2 M2, M2 10-Core GPU, Apple SSD AP1024Z, IPS, 2560x1600, 13.3" | Apple MacBook Pro 13 Late 2020 M1 Entry (8 / 256 GB) M1, M1 8-Core GPU, Apple SSD AP0256, IPS, 2560x1600, 13.3" | Apple MacBook Air 2020 M1 Entry M1, M1 7-Core GPU, Apple SSD AP0256Q, IPS, 2560x1600, 13.3" | Asus Zenbook S 13 OLED R7 6800U, Radeon 680M, Samsung PM9A1 MZVL21T0HCLR, OLED, 2880x1800, 13.3" | Samsung Galaxy Book2 Pro 13 NP930XED-KA1DE i5-1240P, Iris Xe G7 80EUs, Samsung PM991a MZVLQ256HBJD, OLED, 1920x1080, 13.3" | Huawei MateBook 13s i5 11300H i5-11300H, Iris Xe G7 80EUs, Phison Electronics PS5012, LTPS, 2520x1680, 13.4" | Dell XPS 13 9310 OLED i7-1185G7, Iris Xe G7 96EUs, Toshiba XG6 KXG60ZNV512G, OLED, 3456x2160, 13.4" | Average Apple M2 10-Core GPU | Average of class Subnotebook | |
|---|---|---|---|---|---|---|---|---|---|
| Power Consumption | 5% | 12% | -49% | -28% | -41% | -52% | 8% | -35% | |
| Idle Minimum * (Watt) | 1.77 | 1.67 6% | 1.9 -7% | 4.8 -171% | 4.3 -143% | 4.2 -137% | 5.7 -222% | 1.93 ? -9% | 3.73 ? -111% |
| Idle Average * (Watt) | 6.7 | 6.7 -0% | 6.4 4% | 8.7 -30% | 6 10% | 8.1 -21% | 6 10% | 7.94 ? -19% | 6.57 ? 2% |
| Idle Maximum * (Watt) | 6.9 | 7.4 -7% | 7 -1% | 10.1 -46% | 8.8 -28% | 9 -30% | 12.3 -78% | 7.5 ? -9% | 7.93 ? -15% |
| Load Average * (Watt) | 30.9 | 28 9% | 25 19% | 45.6 -48% | 36 -17% | 41.7 -35% | 44.4 -44% | 21.6 ? 30% | 42.1 ? -36% |
| Witcher 3 ultra * (Watt) | 38.9 | 42.4 -9% | 32.9 15% | 40.1 -3% | 36.5 6% | ||||
| Load Maximum * (Watt) | 56 | 47.5 15% | 30.3 46% | 49.5 12% | 60 -7% | 68 -21% | 47.8 15% | 30.1 ? 46% | 65.1 ? -16% |
* ... smaller is better
Energieaufnahme Witcher 3 / Stresstest
Power Consumption external screen
Battery Runtime
The 58.2 Wh battery also enables runtimes of more than 19 hours in combination with the M2 SoC, which is pretty much identical to the previous model. We performed the tests with an adjusted brightness of 150 nits (reduce 7 large and 2 small steps from the maximum brightness). The Wi-Fi runtime drops to almost 10 hours when you use the full brightness, which is still an excellent result. The Windows rivals cannot keep up with these results.
Apple should have another look at the charging speed, because it takes more than 2.5 hours with the 67W power adapter to fully charge the battery from empty when the device is turned on.
| Apple MacBook Pro 13 2022 M2 M2, M2 10-Core GPU, 58.2 Wh | Apple MacBook Pro 13 Late 2020 M1 Entry (8 / 256 GB) M1, M1 8-Core GPU, 58.2 Wh | Apple MacBook Air 2020 M1 Entry M1, M1 7-Core GPU, 49.9 Wh | Asus Zenbook S 13 OLED R7 6800U, Radeon 680M, 67 Wh | Samsung Galaxy Book2 Pro 13 NP930XED-KA1DE i5-1240P, Iris Xe G7 80EUs, 63 Wh | Huawei MateBook 13s i5 11300H i5-11300H, Iris Xe G7 80EUs, 60 Wh | Dell XPS 13 9310 OLED i7-1185G7, Iris Xe G7 96EUs, 52 Wh | Apple MacBook Pro 14 2021 M1 Pro Entry M1 Pro 8-Core, M1 Pro 14-Core GPU, 69.9 Wh | Average of class Subnotebook | |
|---|---|---|---|---|---|---|---|---|---|
| Battery runtime | 4% | -16% | -37% | -40% | -47% | -66% | -26% | -24% | |
| H.264 (h) | 19.2 | 19.2 0% | 15.2 -21% | 11.6 -40% | 11 -43% | 15 -22% | 15.3 ? -20% | ||
| WiFi v1.3 (h) | 19.1 | 20.4 7% | 16 -16% | 9.2 -52% | 11.6 -39% | 9.4 -51% | 6.5 -66% | 13.6 -29% | 13.9 ? -27% |
Pros
Cons
Verdict - The MacBook Pro 13 is still a very good Subnotebook
The 2022 MacBook Pro 13 might look like recycling at first, because the device is completely identical to the old model expect for the new M2 SoC. This also means you once again get the Touch Bar, even though all other MacBooks have switched back to conventional function keys. We have to admit that we were surprised to see another iteration of the MBP 13 as well.
The laptop is obviously familiar, but this does not change the fact that it is still a very good subnotebook. You get an excellent chassis with good stability, a very good display, good input devices and the new M2 chip is very powerful and efficient. The MacBook is also silent most of the time, and the whole package just works really well. The user experience is great, which is also a result of comfort features like the automatic brightness controls of the display or the keyboard illumination. Some laptops offer these features as well, but often not as reliable. The battery runtime is once again very long at more than 19 hours and much better compared to equivalent Windows machines.
The MacBook Pro 13 with the new M2 processor is once again a very good subnotebook. There are some drawbacks, but they do not really affect the user experience and the whole package just works extremely well.
The new M2 processor is faster than before, but we will have a closer look in a separate article soon. The processor part in particular consumes more power, while the GPU shows bigger performance gains. All in all, the M2 just need more power and even the active cooling solution of the MacBook Pro 13 is not always sufficient. These are not great news for the passive cooling of the new MacBook Air M2 and we are really curious how the Air will handle the new M2. We are also a bit worried about the PSU selection (30W adapter by default), but we have to wait a bit longer for results.
We also don’t think that Apple will continue to offer the small MacBook Pro 13 much longer, because the MBP 13 and the new MacBook Air M2 are sitting in the same price range. The specs of the new MacBook Air were also lifted to the same level with the 500-nit P3 display, so the only difference is the active cooling. Whether this aspect alone justifies the “Pro” designation is questionable. It certainly makes sense for Apple to continue the MacBook Air M1 to have a product in the $1000 segment, but the new Air and the MBP 13 are direct rivals. We suspect that Apple will discontinue the MBP 13 at some point (maybe when all the existing inventory is sold) and only offer the 13-inch MacBook Air.
Price and Availability
The new 2022 MacBook Pro 13 is available on June 24th. You can order the entry-level model from Best Buy for $1299 or our review configuration with 16 GB RAM and 1 TB SSD storage for $1899 from the Apple store.
Apple MacBook Pro 13 2022 M2
- 06/21/2022 v7 (old)
Andreas Osthoff
