 Deutsch
 English
 Español
 Français
 Italiano
 Nederlands
 Polski
 Português
 Русский
 Türkçe
 Svenska
 Chinese
 Magyar
Laptop, Smartphone, and Tablet Comparison
On this page you are able to compare test data and specifications from our reviews. Select a model using our search, the search box below or the compare link in our reviews (below the specs).
Lenovo ThinkPad L390 Yoga-20NT000XGELenovo ThinkPad L390 Yoga (Core i5-8265U, 256 GB, FHD) Convertible Review by Sebastian Bade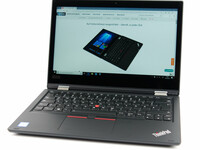 | HP Elitebook x360 1040 G5HP Elitebook x360 1040 G5 (i7-8650U, FHD) Convertible Review by Allen Ngo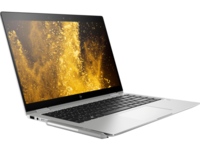 | HP Spectre x360 13-ap0312ngHP Spectre x360 13 Review: classy convertible foiled by its display by Andreas Osthoff | Lenovo Yoga C940-14IIL 81Q9Lenovo Yoga C940-14IIL Review: The 14-inch Consumer Convertible to Beat by Allen Ngo | ||||||||||||||||||||||||||||||||||||||||||||||||||||||||||||||||||||||||||||||||||||||||||||||||||||||||||||||||||||||||||||||||||||||||||
#490 Intel Core i5-8265U 8192 MB 256 GB unknown: 6 13.30-inch 1920x1080 1520 g 321.8 x 224.2 x 18.8 45 Wh 1039 Euro | #452 Intel Core i7-8650U » 92% #600 Intel UHD Graphics 620 » 100% 16384 MB » 200% 512 GB » 200% unknown: 6 14.00-inch » 105% 1920x1080 » 100% 1350 g » 89% 321.4 x 215 x 16.9 » 86% 56 Wh » 124% 2350 Euro » 226% | #464 Intel Core i7-8565U » 95% #600 Intel UHD Graphics 620 » 100% 16384 MB » 200% 512 GB » 200% SSD 13.30-inch » 100% 1920x1080 » 100% 1317 g » 87% 308.8 x 217.9 x 14.7 » 73% 61 Wh » 136% 1599 Euro » 154% | #423 Intel Core i7-1065G7 » 86% #384 Intel Iris Plus Graphics G7 (Ice Lake 64 EU) » 64% 16384 MB » 200% 1024 GB » 400% SSD 14.00-inch » 105% 3840x2160 » 400% 1350 g » 89% 320.3 x 215.6 x 15.7 » 80% 60 Wh » 133% 1400 Euro » 135% | ||||||||||||||||||||||||||||||||||||||||||||||||||||||||||||||||||||||||||||||||||||||||||||||||||||||||||||||||||||||||||||||||||||||||||
SpecificationsLenovo ThinkPad L390 Yoga-20NT000XGE Processor Intel Core i5-8265U 4 x 1.6 - 3.9 GHz, Whiskey Lake-U Graphics adapter Intel UHD Graphics 620, Core: 1100 MHz, Memory: 1200 MHz, 24.20.100.6346 DCH Memory 8 GB , DDR-2400, 1 of 2 slots occupied, 32 GB maximum Display 13.30 inch 16:9, 1920 x 1080 pixel 166 PPI, 10-finger multi-touch, native pen support, LEN4094, NV133FHM-N5A, IPS LED, glossy: yes Mainboard Intel Cannon Lake-U PCH-LP Premium Storage Samsung SSD PM981 MZVLB256HAHQ, 256 GB , M.2 2280, PCIe NVMe, 215 GB free Soundcard Realtek Audio Connections 4 USB 3.0 / 3.1 Gen1, 1 HDMI, 2 DisplayPort, 1 Kensington Lock, Audio Connections: 3.5 mm combined headphone and microphone jack, Card Reader: MicroSD, 1 Fingerprint Reader Networking Intel Ethernet Connection I219-V (10/100/1000MBit/s), Intel Wireless-AC 9560 (a/b/g/n = Wi-Fi 4/ac = Wi-Fi 5/), Bluetooth 5.0 Size height x width x depth (in mm): 18.8 x 321.8 x 224.2 ( = 0.74 x 12.67 x 8.83 in) Battery 45 Wh Lithium-Ion Operating System Microsoft Windows 10 Pro 64 Bit Camera Webcam: 720p Additional features Speakers: 2 x 2 W stereo, Keyboard: 6-row chiclet keyboard, splash proof, Keyboard Light: yes, Lenovo Vantage, Microsoft Office Trial, 12 Months Warranty Weight 1.52 kg ( = 53.62 oz / 3.35 pounds), Power Supply: 359 g ( = 12.66 oz / 0.79 pounds) Price 1039 Euro
| SpecificationsHP Elitebook x360 1040 G5 (EliteBook x360 1040 Series) Processor Intel Core i7-8650U 4 x 1.9 - 4.2 GHz, Kaby Lake Refresh Graphics adapter Intel UHD Graphics 620, Core: 300 MHz, Memory: 1200 MHz, DDR4, 24.20.100.6222 Memory 16 GB , 1200 MHz, 17-17-17-39, Dual-Channel Display 14.00 inch 16:9, 1920 x 1080 pixel 157 PPI, 10-point capacitive, native pen support, AU Optronics AUO533D, IPS, glossy: no Mainboard Intel Kaby Lake-U + iHDCP 2.2 Base PCH Storage Samsung SSD PM981 MZVLB512HAJQ, 512 GB Soundcard Intel Kaby Lake-U/Y PCH - High Definition Audio Connections 4 USB 3.0 / 3.1 Gen1, 2 USB 3.1 Gen2, 2 Thunderbolt, 1 HDMI, 2 DisplayPort, 1 Kensington Lock, Audio Connections: 3.5 mm combo, 1 Fingerprint Reader, Brightness Sensor, Sensors: Accelerometer Networking Intel Dual Band Wireless-AC 8265 (a/b/g/n = Wi-Fi 4/ac = Wi-Fi 5/), Bluetooth 5, LTE Size height x width x depth (in mm): 16.9 x 321.4 x 215 ( = 0.67 x 12.65 x 8.46 in) Battery 56 Wh, 7300 mAh Lithium-Polymer Operating System Microsoft Windows 10 Pro 64 Bit Camera Webcam: 1080p FHD Additional features Speakers: Quad speakers, Keyboard: Chiclet, Keyboard Light: yes, USB Type-C to RJ-45 adapter, USB Type-C to Type-A adapter, Windows 10 Pro installation DVD, HP Client Security, JumpStart, SoftPaq, ePrint SW, 36 Months Warranty Weight 1.35 kg ( = 47.62 oz / 2.98 pounds), Power Supply: 333 g ( = 11.75 oz / 0.73 pounds) Price 2350 USD Links
| SpecificationsHP Spectre x360 13-ap0312ng (Spectre x360 13 Series) Processor Intel Core i7-8565U 4 x 1.8 - 4.6 GHz (Intel Core i7) Graphics adapter Memory 16 GB , DDR4-2400, dual-channel, onboard Display 13.30 inch 16:9, 1920 x 1080 pixel 166 PPI, capacitive, M133NVF3, IPS, glossy: yes Mainboard Intel Cannon Lake-U PCH-LP Premium Storage Toshiba XG5 KXG50ZNV512G, 512 GB , 435 GB free Soundcard Intel Cannon Lake-LP - cAVS Connections 3 USB 3.1 Gen2, 2 Thunderbolt, 2 DisplayPort, Audio Connections: 3.5-mm headset, Card Reader: microSD (UHS-II), 1 Fingerprint Reader Networking Intel Wireless-AC 9560 (a/b/g/n = Wi-Fi 4/ac = Wi-Fi 5/), Bluetooth 5.0 Size height x width x depth (in mm): 14.7 x 308.8 x 217.9 ( = 0.58 x 12.16 x 8.58 in) Battery 61 Wh Lithium-Ion, 4-cell Operating System Microsoft Windows 10 Home 64 Bit Camera Webcam: FHD infrared camera Additional features Speakers: four speakers, Bang & Olufsen, Keyboard: Chiclet, Keyboard Light: yes, 65 W charger, sleeve, HP Tools, 24 Months Warranty Weight 1.317 kg ( = 46.46 oz / 2.9 pounds), Power Supply: 309 g ( = 10.9 oz / 0.68 pounds) Price 1599 Euro Links
| SpecificationsLenovo Yoga C940-14IIL 81Q9 (Yoga C940 Series) Processor Intel Core i7-1065G7 4 x 1.3 - 3.9 GHz, Ice Lake-U Graphics adapter Intel Iris Plus Graphics G7 (Ice Lake 64 EU), Core: 300 MHz, Memory: 1800 MHz, DDR4, 25.20.100.7014 Memory 16 GB , 1866.7 MHz, 20-20-20-45, Dual-Channel Display 14.00 inch 16:9, 3840 x 2160 pixel 315 PPI, 10-point capacitive, native pen support, BOE HF NV140QUM-N54, IPS, glossy: yes Mainboard Intel 495 (Ice Lake-U PCH-LP Premium) Storage Samsung PM981a MZVLB1T0HBLR, 1024 GB Soundcard Intel Ice Lake-U/Y PCH-LP cAVS Connections 3 USB 3.1 Gen2, 2 Thunderbolt, 2 DisplayPort, Audio Connections: Combo audio, 1 Fingerprint Reader, Sensors: Accelerometer Networking Intel Wi-Fi 6 AX201 (a/b/g/h/n = Wi-Fi 4/ac = Wi-Fi 5/ax = Wi-Fi 6/), Bluetooth 5 Size height x width x depth (in mm): 15.7 x 320.3 x 215.6 ( = 0.62 x 12.61 x 8.49 in) Battery 60 Wh Lithium-Polymer Operating System Microsoft Windows 10 Home 64 Bit Camera Webcam: 720p with privacy slider Additional features Speakers: 4 x 2 W Quad speakers, Keyboard: Chiclet, Keyboard Light: yes, Lenovo WACOM AES Pen, McAfee LiveSafe, Microsoft Office Trial, Lenovo Pen Settings, Lenovo Vantage, 12 Months Warranty Weight 1.35 kg ( = 47.62 oz / 2.98 pounds), Power Supply: 357 g ( = 12.59 oz / 0.79 pounds) Price 1400 USD
| ||||||||||||||||||||||||||||||||||||||||||||||||||||||||||||||||||||||||||||||||||||||||||||||||||||||||||||||||||||||||||||||||||||||||||
LEN4094, NV133FHM-N5A tested with X-Rite i1Pro 2 Maximum: 313 cd/m² (Nits) Average: 295.4 cd/m² Minimum: 3.7 cd/m²Brightness Distribution: 90 % Center on Battery: 311 cd/m² Contrast: 1423:1 (Black: 0.22 cd/m²) ΔE Color 6.2 | 0.5-29.43 Ø4.99, calibrated: 2.5 ΔE Greyscale 8 | 0.57-98 Ø5.2 90.6% sRGB (Argyll 1.6.3 3D) 59.1% AdobeRGB 1998 (Argyll 1.6.3 3D) 66.3% AdobeRGB 1998 (Argyll 2.2.0 3D) 90.6% sRGB (Argyll 2.2.0 3D) 69.2% Display P3 (Argyll 2.2.0 3D) Gamma: 2.38 |
AU Optronics AUO533D tested with X-Rite i1Pro 2 Maximum: 421.2 cd/m² (Nits) Average: 400.4 cd/m² Minimum: 33.95 cd/m²Brightness Distribution: 89 % Center on Battery: 416.3 cd/m² Contrast: 1436:1 (Black: 0.29 cd/m²) ΔE Color 2.69 | 0.5-29.43 Ø4.99, calibrated: 2.13 ΔE Greyscale 2.9 | 0.57-98 Ø5.2 94.5% sRGB (Argyll 1.6.3 3D) 60.1% AdobeRGB 1998 (Argyll 1.6.3 3D) 65.5% AdobeRGB 1998 (Argyll 2.2.0 3D) 94.1% sRGB (Argyll 2.2.0 3D) 64.3% Display P3 (Argyll 2.2.0 3D) Gamma: 2.4 |
M133NVF3 tested with X-Rite i1Pro 2 Maximum: 323 cd/m² (Nits) Average: 298 cd/m² Minimum: 13.1 cd/m²Brightness Distribution: 84 % Center on Battery: 271 cd/m² Contrast: 697:1 (Black: 0.39 cd/m²) ΔE Color 4.3 | 0.5-29.43 Ø4.99, calibrated: 2.4 ΔE Greyscale 4.4 | 0.57-98 Ø5.2 89.8% sRGB (Argyll 1.6.3 3D) 58.9% AdobeRGB 1998 (Argyll 1.6.3 3D) 64.1% AdobeRGB 1998 (Argyll 2.2.0 3D) 89.8% sRGB (Argyll 2.2.0 3D) 63% Display P3 (Argyll 2.2.0 3D) Gamma: 1.97 |
BOE HF NV140QUM-N54 tested with X-Rite i1Pro 2 Maximum: 549 cd/m² (Nits) Average: 500.6 cd/m² Minimum: 30 cd/m²Brightness Distribution: 82 % Center on Battery: 501.7 cd/m² Contrast: 1568:1 (Black: 0.32 cd/m²) ΔE Color 5.48 | 0.5-29.43 Ø4.99, calibrated: 2.22 ΔE Greyscale 8.1 | 0.57-98 Ø5.2 100% sRGB (Argyll 1.6.3 3D) 74.1% AdobeRGB 1998 (Argyll 1.6.3 3D) 83.3% AdobeRGB 1998 (Argyll 2.2.0 3D) 99.9% sRGB (Argyll 2.2.0 3D) 83.8% Display P3 (Argyll 2.2.0 3D) Gamma: 2.07 | ||||||||||||||||||||||||||||||||||||||||||||||||||||||||||||||||||||||||||||||||||||||||||||||||||||||||||||||||||||||||||||||||||||||||||
ERROR no Specs ID specified in element or header and also no heat ID found in element
|
ERROR no Specs ID specified in element or header and also no heat ID found in element
|
ERROR no Specs ID specified in element or header and also no heat ID found in element
|
ERROR no Specs ID specified in element or header and also no heat ID found in element
| ||||||||||||||||||||||||||||||||||||||||||||||||||||||||||||||||||||||||||||||||||||||||||||||||||||||||||||||||||||||||||||||||||||||||||
Noise Level
| Noise Level
| Noise Level
| Noise Level
| ||||||||||||||||||||||||||||||||||||||||||||||||||||||||||||||||||||||||||||||||||||||||||||||||||||||||||||||||||||||||||||||||||||||||||
Power Consumption
| Power Consumption
| Power Consumption
| Power Consumption
| ||||||||||||||||||||||||||||||||||||||||||||||||||||||||||||||||||||||||||||||||||||||||||||||||||||||||||||||||||||||||||||||||||||||||||
Lenovo ThinkPad L390 Yoga-20NT000XGE
-
02/13/2019 v6 (old)
Convertible - Weighted Average
|
HP Elitebook x360 1040 G5
-
10/22/2019 v7 (old)
Office - Weighted Average
|
HP Spectre x360 13-ap0312ng
-
09/19/2019 v7 (old)
Convertible - Weighted Average
|
Lenovo Yoga C940-14IIL 81Q9
-
12/19/2019 v7 (old)
Convertible - Weighted Average
| ||||||||||||||||||||||||||||||||||||||||||||||||||||||||||||||||||||||||||||||||||||||||||||||||||||||||||||||||||||||||||||||||||||||||||
|
|
|
| ||||||||||||||||||||||||||||||||||||||||||||||||||||||||||||||||||||||||||||||||||||||||||||||||||||||||||||||||||||||||||||||||||||||||||
CrystalDiskMark 3.0 Write 4k QD32: 405.9 MB/s | CrystalDiskMark 3.0 Write 4k QD32: 312.8 MB/s » 77% | ||||||||||||||||||||||||||||||||||||||||||||||||||||||||||||||||||||||||||||||||||||||||||||||||||||||||||||||||||||||||||||||||||||||||||||
CrystalDiskMark 3.0 Read 4k QD32: 257.5 MB/s | CrystalDiskMark 3.0 Read 4k QD32: 253.4 MB/s » 98% | ||||||||||||||||||||||||||||||||||||||||||||||||||||||||||||||||||||||||||||||||||||||||||||||||||||||||||||||||||||||||||||||||||||||||||||
CrystalDiskMark 3.0 Write 4k: 102.2 MB/s | CrystalDiskMark 3.0 Write 4k: 98.2 MB/s » 96% | ||||||||||||||||||||||||||||||||||||||||||||||||||||||||||||||||||||||||||||||||||||||||||||||||||||||||||||||||||||||||||||||||||||||||||||
CrystalDiskMark 3.0 Read 4k: 49.42 MB/s | CrystalDiskMark 3.0 Read 4k: 34.01 MB/s » 69% | ||||||||||||||||||||||||||||||||||||||||||||||||||||||||||||||||||||||||||||||||||||||||||||||||||||||||||||||||||||||||||||||||||||||||||||
CrystalDiskMark 3.0 Write 512: 1573 MB/s | CrystalDiskMark 3.0 Write 512: 642 MB/s » 41% | ||||||||||||||||||||||||||||||||||||||||||||||||||||||||||||||||||||||||||||||||||||||||||||||||||||||||||||||||||||||||||||||||||||||||||||
CrystalDiskMark 3.0 Read 512: 1514 MB/s | CrystalDiskMark 3.0 Read 512: 551 MB/s » 36% | ||||||||||||||||||||||||||||||||||||||||||||||||||||||||||||||||||||||||||||||||||||||||||||||||||||||||||||||||||||||||||||||||||||||||||||
CrystalDiskMark 3.0 Write Seq: 1309 MB/s | CrystalDiskMark 3.0 Write Seq: 525 MB/s » 40% | ||||||||||||||||||||||||||||||||||||||||||||||||||||||||||||||||||||||||||||||||||||||||||||||||||||||||||||||||||||||||||||||||||||||||||||
CrystalDiskMark 3.0 Read Seq: 2290 MB/s | CrystalDiskMark 3.0 Read Seq: 1887 MB/s » 82% | ||||||||||||||||||||||||||||||||||||||||||||||||||||||||||||||||||||||||||||||||||||||||||||||||||||||||||||||||||||||||||||||||||||||||||||
Cinebench R10 Shading 64Bit: 7906 Points | |||||||||||||||||||||||||||||||||||||||||||||||||||||||||||||||||||||||||||||||||||||||||||||||||||||||||||||||||||||||||||||||||||||||||||||
Cinebench R10 Rendering Multiple CPUs 64Bit: 22625 Points | |||||||||||||||||||||||||||||||||||||||||||||||||||||||||||||||||||||||||||||||||||||||||||||||||||||||||||||||||||||||||||||||||||||||||||||
Cinebench R10 Rendering Single CPUs 64Bit: 7932 Points | |||||||||||||||||||||||||||||||||||||||||||||||||||||||||||||||||||||||||||||||||||||||||||||||||||||||||||||||||||||||||||||||||||||||||||||
Cinebench R10 Shading 32Bit: 7830 | |||||||||||||||||||||||||||||||||||||||||||||||||||||||||||||||||||||||||||||||||||||||||||||||||||||||||||||||||||||||||||||||||||||||||||||
Cinebench R10 Rendering Multiple CPUs 32Bit: 17195 | |||||||||||||||||||||||||||||||||||||||||||||||||||||||||||||||||||||||||||||||||||||||||||||||||||||||||||||||||||||||||||||||||||||||||||||
Cinebench R10 Rendering Single 32Bit: 5942 | |||||||||||||||||||||||||||||||||||||||||||||||||||||||||||||||||||||||||||||||||||||||||||||||||||||||||||||||||||||||||||||||||||||||||||||
AS SSD Copy Game MB/s: 637 MB/s | AS SSD Copy Game MB/s: 1024 MB/s » 161% | AS SSD Copy Game MB/s: 1433 MB/s » 225% | |||||||||||||||||||||||||||||||||||||||||||||||||||||||||||||||||||||||||||||||||||||||||||||||||||||||||||||||||||||||||||||||||||||||||||
AS SSD Copy Program MB/s: 322.1 MB/s | AS SSD Copy Program MB/s: 450.3 MB/s » 140% | AS SSD Copy Program MB/s: 572 MB/s » 178% | |||||||||||||||||||||||||||||||||||||||||||||||||||||||||||||||||||||||||||||||||||||||||||||||||||||||||||||||||||||||||||||||||||||||||||
AS SSD Copy ISO MB/s: 1025 MB/s | AS SSD Copy ISO MB/s: 2034 MB/s » 198% | AS SSD Copy ISO MB/s: 2161 MB/s » 211% | |||||||||||||||||||||||||||||||||||||||||||||||||||||||||||||||||||||||||||||||||||||||||||||||||||||||||||||||||||||||||||||||||||||||||||
AS SSD Score Total: 2889 Points | AS SSD Score Total: 3790 Points » 131% | AS SSD Score Total: 1971 Points » 68% | AS SSD Score Total: 3467 Points » 120% | ||||||||||||||||||||||||||||||||||||||||||||||||||||||||||||||||||||||||||||||||||||||||||||||||||||||||||||||||||||||||||||||||||||||||||
AS SSD Score Write: 1440 Points | AS SSD Score Write: 1440 Points » 100% | AS SSD Score Write: 653 Points » 45% | AS SSD Score Write: 1748 Points » 121% | ||||||||||||||||||||||||||||||||||||||||||||||||||||||||||||||||||||||||||||||||||||||||||||||||||||||||||||||||||||||||||||||||||||||||||
AS SSD Score Read: 969 Points | AS SSD Score Read: 1569 Points » 162% | AS SSD Score Read: 925 Points » 95% | AS SSD Score Read: 1154 Points » 119% | ||||||||||||||||||||||||||||||||||||||||||||||||||||||||||||||||||||||||||||||||||||||||||||||||||||||||||||||||||||||||||||||||||||||||||
AS SSD Access Time Write: 0.028 ms* | AS SSD Access Time Write: 0.035 ms* » 125% | AS SSD Access Time Write: 0.049 ms* » 175% | AS SSD Access Time Write: 0.086 ms* » 307% | ||||||||||||||||||||||||||||||||||||||||||||||||||||||||||||||||||||||||||||||||||||||||||||||||||||||||||||||||||||||||||||||||||||||||||
AS SSD Access Time Read: 0.041 ms* | AS SSD Access Time Read: 0.043 ms* » 105% | AS SSD Access Time Read: 0.117 ms* » 285% | AS SSD Access Time Read: 0.036 ms* » 88% | ||||||||||||||||||||||||||||||||||||||||||||||||||||||||||||||||||||||||||||||||||||||||||||||||||||||||||||||||||||||||||||||||||||||||||
AS SSD 4K-64 Write: 1193 MB/s | AS SSD 4K-64 Write: 1209 MB/s » 101% | AS SSD 4K-64 Write: 479.3 MB/s » 40% | AS SSD 4K-64 Write: 1478 MB/s » 124% | ||||||||||||||||||||||||||||||||||||||||||||||||||||||||||||||||||||||||||||||||||||||||||||||||||||||||||||||||||||||||||||||||||||||||||
AS SSD 4K-64 Read: 745 MB/s | AS SSD 4K-64 Read: 1342 MB/s » 180% | AS SSD 4K-64 Read: 674 MB/s » 90% | AS SSD 4K-64 Read: 878 MB/s » 118% | ||||||||||||||||||||||||||||||||||||||||||||||||||||||||||||||||||||||||||||||||||||||||||||||||||||||||||||||||||||||||||||||||||||||||||
AS SSD 4K Write: 133.8 MB/s | AS SSD 4K Write: 104.1 MB/s » 78% | AS SSD 4K Write: 123.9 MB/s » 93% | AS SSD 4K Write: 130.3 MB/s » 97% | ||||||||||||||||||||||||||||||||||||||||||||||||||||||||||||||||||||||||||||||||||||||||||||||||||||||||||||||||||||||||||||||||||||||||||
AS SSD 4K Read: 51.8 MB/s | AS SSD 4K Read: 46.25 MB/s » 89% | AS SSD 4K Read: 31.4 MB/s » 61% | AS SSD 4K Read: 55.2 MB/s » 107% | ||||||||||||||||||||||||||||||||||||||||||||||||||||||||||||||||||||||||||||||||||||||||||||||||||||||||||||||||||||||||||||||||||||||||||
AS SSD Seq Write: 1123 MB/s | AS SSD Seq Write: 1270 MB/s » 113% | AS SSD Seq Write: 493 MB/s » 44% | AS SSD Seq Write: 1401 MB/s » 125% | ||||||||||||||||||||||||||||||||||||||||||||||||||||||||||||||||||||||||||||||||||||||||||||||||||||||||||||||||||||||||||||||||||||||||||
AS SSD Seq Read: 1724 MB/s | AS SSD Seq Read: 1816 MB/s » 105% | AS SSD Seq Read: 2197 MB/s » 127% | AS SSD Seq Read: 2213 MB/s » 128% | ||||||||||||||||||||||||||||||||||||||||||||||||||||||||||||||||||||||||||||||||||||||||||||||||||||||||||||||||||||||||||||||||||||||||||
Cinebench R15 CPU Single 64Bit: 157 Points | Cinebench R15 CPU Single 64Bit: 172 Points » 110% | Cinebench R15 CPU Single 64Bit: 164 Points » 104% | Cinebench R15 CPU Single 64Bit: 181 Points » 115% | ||||||||||||||||||||||||||||||||||||||||||||||||||||||||||||||||||||||||||||||||||||||||||||||||||||||||||||||||||||||||||||||||||||||||||
Cinebench R15 CPU Multi 64Bit: 634 Points | Cinebench R15 CPU Multi 64Bit: 564 Points » 89% | Cinebench R15 CPU Multi 64Bit: 538 Points » 85% | Cinebench R15 CPU Multi 64Bit: 749 Points » 118% | ||||||||||||||||||||||||||||||||||||||||||||||||||||||||||||||||||||||||||||||||||||||||||||||||||||||||||||||||||||||||||||||||||||||||||
Cinebench R15 Ref. Match 64Bit: 97.8 % | Cinebench R15 Ref. Match 64Bit: 97.8 % » 100% | Cinebench R15 Ref. Match 64Bit: 97.8 % » 100% | Cinebench R15 Ref. Match 64Bit: 97.8 % » 100% | ||||||||||||||||||||||||||||||||||||||||||||||||||||||||||||||||||||||||||||||||||||||||||||||||||||||||||||||||||||||||||||||||||||||||||
Cinebench R15 OpenGL 64Bit: 44.36 fps | Cinebench R15 OpenGL 64Bit: 55.7 fps » 126% | Cinebench R15 OpenGL 64Bit: 46.73 fps » 105% | Cinebench R15 OpenGL 64Bit: 74.1 fps » 167% | ||||||||||||||||||||||||||||||||||||||||||||||||||||||||||||||||||||||||||||||||||||||||||||||||||||||||||||||||||||||||||||||||||||||||||
Cinebench R11.5 CPU Single 32Bit: 1.58 Points | |||||||||||||||||||||||||||||||||||||||||||||||||||||||||||||||||||||||||||||||||||||||||||||||||||||||||||||||||||||||||||||||||||||||||||||
Cinebench R11.5 CPU Multi 32Bit: 5.17 Points | |||||||||||||||||||||||||||||||||||||||||||||||||||||||||||||||||||||||||||||||||||||||||||||||||||||||||||||||||||||||||||||||||||||||||||||
Cinebench R11.5 OpenGL 32Bit: 38.73 fps | |||||||||||||||||||||||||||||||||||||||||||||||||||||||||||||||||||||||||||||||||||||||||||||||||||||||||||||||||||||||||||||||||||||||||||||
Cinebench R11.5 CPU Single 64Bit: 1.8 Points | |||||||||||||||||||||||||||||||||||||||||||||||||||||||||||||||||||||||||||||||||||||||||||||||||||||||||||||||||||||||||||||||||||||||||||||
Cinebench R11.5 CPU Multi 64Bit: 5.74 Points | |||||||||||||||||||||||||||||||||||||||||||||||||||||||||||||||||||||||||||||||||||||||||||||||||||||||||||||||||||||||||||||||||||||||||||||
Cinebench R11.5 OpenGL 64Bit: 37.85 fps | |||||||||||||||||||||||||||||||||||||||||||||||||||||||||||||||||||||||||||||||||||||||||||||||||||||||||||||||||||||||||||||||||||||||||||||
3DMark 11 Performance Combined: 1361 Points | 3DMark 11 Performance Combined: 1869 Points » 137% | 3DMark 11 Performance Combined: 1921 Points » 141% | 3DMark 11 Performance Combined: 4163 Points » 306% | ||||||||||||||||||||||||||||||||||||||||||||||||||||||||||||||||||||||||||||||||||||||||||||||||||||||||||||||||||||||||||||||||||||||||||
3DMark 11 Performance Physics: 6222 Points | 3DMark 11 Performance Physics: 7062 Points » 114% | 3DMark 11 Performance Physics: 7275 Points » 117% | 3DMark 11 Performance Physics: 9377 Points » 151% | ||||||||||||||||||||||||||||||||||||||||||||||||||||||||||||||||||||||||||||||||||||||||||||||||||||||||||||||||||||||||||||||||||||||||||
3DMark 11 Performance GPU: 1721 Points | 3DMark 11 Performance GPU: 1902 Points » 111% | 3DMark 11 Performance GPU: 1929 Points » 112% | 3DMark 11 Performance GPU: 4630 Points » 269% | ||||||||||||||||||||||||||||||||||||||||||||||||||||||||||||||||||||||||||||||||||||||||||||||||||||||||||||||||||||||||||||||||||||||||||
3DMark 11 Performance: 1874 Points | 3DMark 11 Performance: 2131 Points » 114% | 3DMark 11 Performance: 2166 Points » 116% | 3DMark 11 Performance: 4950 Points » 264% | ||||||||||||||||||||||||||||||||||||||||||||||||||||||||||||||||||||||||||||||||||||||||||||||||||||||||||||||||||||||||||||||||||||||||||
3DMark Fire Strike Ultra Combined: 106 Points | 3DMark Fire Strike Ultra Combined: 325 Points » 307% | ||||||||||||||||||||||||||||||||||||||||||||||||||||||||||||||||||||||||||||||||||||||||||||||||||||||||||||||||||||||||||||||||||||||||||||
3DMark Fire Strike Ultra Physics: 8200 Points | 3DMark Fire Strike Ultra Physics: 11049 Points » 135% | ||||||||||||||||||||||||||||||||||||||||||||||||||||||||||||||||||||||||||||||||||||||||||||||||||||||||||||||||||||||||||||||||||||||||||||
3DMark Fire Strike Ultra Graphics: 251 Points | 3DMark Fire Strike Ultra Graphics: 715 Points » 285% | ||||||||||||||||||||||||||||||||||||||||||||||||||||||||||||||||||||||||||||||||||||||||||||||||||||||||||||||||||||||||||||||||||||||||||||
3DMark Fire Strike Ultra Score: 253 Points | 3DMark Fire Strike Ultra Score: 729 Points » 288% | ||||||||||||||||||||||||||||||||||||||||||||||||||||||||||||||||||||||||||||||||||||||||||||||||||||||||||||||||||||||||||||||||||||||||||||
3DMark Fire Strike Extreme Combined: 155 Points | |||||||||||||||||||||||||||||||||||||||||||||||||||||||||||||||||||||||||||||||||||||||||||||||||||||||||||||||||||||||||||||||||||||||||||||
3DMark Fire Strike Extreme Physics: 8876 Points | |||||||||||||||||||||||||||||||||||||||||||||||||||||||||||||||||||||||||||||||||||||||||||||||||||||||||||||||||||||||||||||||||||||||||||||
3DMark Fire Strike Extreme Graphics: 484 Points | |||||||||||||||||||||||||||||||||||||||||||||||||||||||||||||||||||||||||||||||||||||||||||||||||||||||||||||||||||||||||||||||||||||||||||||
3DMark Fire Strike Extreme Score: 452 Points | |||||||||||||||||||||||||||||||||||||||||||||||||||||||||||||||||||||||||||||||||||||||||||||||||||||||||||||||||||||||||||||||||||||||||||||
3DMark Fire Strike Combined: 345 Points | 3DMark Fire Strike Combined: 426 Points » 123% | 3DMark Fire Strike Combined: 1082 Points » 314% | |||||||||||||||||||||||||||||||||||||||||||||||||||||||||||||||||||||||||||||||||||||||||||||||||||||||||||||||||||||||||||||||||||||||||||
3DMark Fire Strike Physics: 8855 Points | 3DMark Fire Strike Physics: 9335 Points » 105% | 3DMark Fire Strike Physics: 11230 Points » 127% | |||||||||||||||||||||||||||||||||||||||||||||||||||||||||||||||||||||||||||||||||||||||||||||||||||||||||||||||||||||||||||||||||||||||||||
3DMark Fire Strike Graphics: 1083 Points | 3DMark Fire Strike Graphics: 1401 Points » 129% | 3DMark Fire Strike Graphics: 2973 Points » 275% | |||||||||||||||||||||||||||||||||||||||||||||||||||||||||||||||||||||||||||||||||||||||||||||||||||||||||||||||||||||||||||||||||||||||||||
3DMark Fire Strike Score: 1000 Points | 3DMark Fire Strike Score: 1272 Points » 127% | 3DMark Fire Strike Score: 2792 Points » 279% | |||||||||||||||||||||||||||||||||||||||||||||||||||||||||||||||||||||||||||||||||||||||||||||||||||||||||||||||||||||||||||||||||||||||||||
3DMark Sky Diver Stress Test: 97.6 % | |||||||||||||||||||||||||||||||||||||||||||||||||||||||||||||||||||||||||||||||||||||||||||||||||||||||||||||||||||||||||||||||||||||||||||||
3DMark Sky Diver Physics: 7079 Points | 3DMark Sky Diver Physics: 8116 Points » 115% | ||||||||||||||||||||||||||||||||||||||||||||||||||||||||||||||||||||||||||||||||||||||||||||||||||||||||||||||||||||||||||||||||||||||||||||
3DMark Sky Diver Graphics: 3894 Points | 3DMark Sky Diver Graphics: 4597 Points » 118% | ||||||||||||||||||||||||||||||||||||||||||||||||||||||||||||||||||||||||||||||||||||||||||||||||||||||||||||||||||||||||||||||||||||||||||||
3DMark Sky Diver Score: 4172 Points | 3DMark Sky Diver Score: 4933 Points » 118% | ||||||||||||||||||||||||||||||||||||||||||||||||||||||||||||||||||||||||||||||||||||||||||||||||||||||||||||||||||||||||||||||||||||||||||||
3DMark Cloud Gate Standard Physics: 6140 Points | 3DMark Cloud Gate Standard Physics: 6089 Points » 99% | 3DMark Cloud Gate Standard Physics: 6449 Points » 105% | 3DMark Cloud Gate Standard Physics: 7393 Points » 120% | ||||||||||||||||||||||||||||||||||||||||||||||||||||||||||||||||||||||||||||||||||||||||||||||||||||||||||||||||||||||||||||||||||||||||||
3DMark Cloud Gate Standard Graphics: 8677 Points | 3DMark Cloud Gate Standard Graphics: 10804 Points » 125% | 3DMark Cloud Gate Standard Graphics: 11436 Points » 132% | 3DMark Cloud Gate Standard Graphics: 16268 Points » 187% | ||||||||||||||||||||||||||||||||||||||||||||||||||||||||||||||||||||||||||||||||||||||||||||||||||||||||||||||||||||||||||||||||||||||||||
3DMark Cloud Gate Standard Score: 7947 Points | 3DMark Cloud Gate Standard Score: 9217 Points » 116% | 3DMark Cloud Gate Standard Score: 9758 Points » 123% | 3DMark Cloud Gate Standard Score: 12842 Points » 162% | ||||||||||||||||||||||||||||||||||||||||||||||||||||||||||||||||||||||||||||||||||||||||||||||||||||||||||||||||||||||||||||||||||||||||||
3DMark Ice Storm Unlimited Physics: 55479 Points | 3DMark Ice Storm Unlimited Physics: 57349 Points » 103% | ||||||||||||||||||||||||||||||||||||||||||||||||||||||||||||||||||||||||||||||||||||||||||||||||||||||||||||||||||||||||||||||||||||||||||||
3DMark Ice Storm Unlimited Graphics Score: 82388 Points | 3DMark Ice Storm Unlimited Graphics Score: 151767 Points » 184% | ||||||||||||||||||||||||||||||||||||||||||||||||||||||||||||||||||||||||||||||||||||||||||||||||||||||||||||||||||||||||||||||||||||||||||||
3DMark Ice Storm Unlimited Score: 74371 Points | 3DMark Ice Storm Unlimited Score: 111114 Points » 149% | ||||||||||||||||||||||||||||||||||||||||||||||||||||||||||||||||||||||||||||||||||||||||||||||||||||||||||||||||||||||||||||||||||||||||||||
3DMark Ice Storm Extreme Physics: 48559 Points | 3DMark Ice Storm Extreme Physics: 47695 Points » 98% | ||||||||||||||||||||||||||||||||||||||||||||||||||||||||||||||||||||||||||||||||||||||||||||||||||||||||||||||||||||||||||||||||||||||||||||
3DMark Ice Storm Extreme Graphics: 36659 Points | 3DMark Ice Storm Extreme Graphics: 50911 Points » 139% | ||||||||||||||||||||||||||||||||||||||||||||||||||||||||||||||||||||||||||||||||||||||||||||||||||||||||||||||||||||||||||||||||||||||||||||
3DMark Ice Storm Extreme Score: 38770 Points | 3DMark Ice Storm Extreme Score: 50159 Points » 129% | ||||||||||||||||||||||||||||||||||||||||||||||||||||||||||||||||||||||||||||||||||||||||||||||||||||||||||||||||||||||||||||||||||||||||||||
3DMark Ice Storm Standard Physics: 47129 Points | 3DMark Ice Storm Standard Physics: 52327 Points » 111% | ||||||||||||||||||||||||||||||||||||||||||||||||||||||||||||||||||||||||||||||||||||||||||||||||||||||||||||||||||||||||||||||||||||||||||||
3DMark Ice Storm Standard Graphics: 61549 Points | 3DMark Ice Storm Standard Graphics: 59867 Points » 97% | ||||||||||||||||||||||||||||||||||||||||||||||||||||||||||||||||||||||||||||||||||||||||||||||||||||||||||||||||||||||||||||||||||||||||||||
3DMark Ice Storm Standard Score: 57630 Points | 3DMark Ice Storm Standard Score: 58009 Points » 101% | ||||||||||||||||||||||||||||||||||||||||||||||||||||||||||||||||||||||||||||||||||||||||||||||||||||||||||||||||||||||||||||||||||||||||||||
3DMark Time Spy CPU: 3753 Points | |||||||||||||||||||||||||||||||||||||||||||||||||||||||||||||||||||||||||||||||||||||||||||||||||||||||||||||||||||||||||||||||||||||||||||||
3DMark Time Spy Graphics: 825 Points | |||||||||||||||||||||||||||||||||||||||||||||||||||||||||||||||||||||||||||||||||||||||||||||||||||||||||||||||||||||||||||||||||||||||||||||
3DMark Time Spy Score: 934 Points | |||||||||||||||||||||||||||||||||||||||||||||||||||||||||||||||||||||||||||||||||||||||||||||||||||||||||||||||||||||||||||||||||||||||||||||
Mozilla Kraken 1.1 Total: 1198 ms* | Mozilla Kraken 1.1 Total: 1075 ms* » 90% | Mozilla Kraken 1.1 Total: 1205 ms* » 101% | Mozilla Kraken 1.1 Total: 980 ms* » 82% | ||||||||||||||||||||||||||||||||||||||||||||||||||||||||||||||||||||||||||||||||||||||||||||||||||||||||||||||||||||||||||||||||||||||||||
Octane V2 Total Score: 31901 Points | Octane V2 Total Score: 24785 Points » 78% | Octane V2 Total Score: 30924 Points » 97% | Octane V2 Total Score: 37344 Points » 117% | ||||||||||||||||||||||||||||||||||||||||||||||||||||||||||||||||||||||||||||||||||||||||||||||||||||||||||||||||||||||||||||||||||||||||||
SPECviewperf 12 Solidworks (sw-03): 21.93 fps | |||||||||||||||||||||||||||||||||||||||||||||||||||||||||||||||||||||||||||||||||||||||||||||||||||||||||||||||||||||||||||||||||||||||||||||
SPECviewperf 12 Siemens NX (snx-02): 2.49 fps | |||||||||||||||||||||||||||||||||||||||||||||||||||||||||||||||||||||||||||||||||||||||||||||||||||||||||||||||||||||||||||||||||||||||||||||
SPECviewperf 12 Showcase (showcase-01): 5 fps | |||||||||||||||||||||||||||||||||||||||||||||||||||||||||||||||||||||||||||||||||||||||||||||||||||||||||||||||||||||||||||||||||||||||||||||
SPECviewperf 12 Medical (medical-01): 3.09 fps | |||||||||||||||||||||||||||||||||||||||||||||||||||||||||||||||||||||||||||||||||||||||||||||||||||||||||||||||||||||||||||||||||||||||||||||
SPECviewperf 12 Maya (maya-04): 11.34 fps | |||||||||||||||||||||||||||||||||||||||||||||||||||||||||||||||||||||||||||||||||||||||||||||||||||||||||||||||||||||||||||||||||||||||||||||
SPECviewperf 12 Energy (energy-01): 0.24 fps | |||||||||||||||||||||||||||||||||||||||||||||||||||||||||||||||||||||||||||||||||||||||||||||||||||||||||||||||||||||||||||||||||||||||||||||
SPECviewperf 12 Creo (creo-01): 12.51 fps | |||||||||||||||||||||||||||||||||||||||||||||||||||||||||||||||||||||||||||||||||||||||||||||||||||||||||||||||||||||||||||||||||||||||||||||
SPECviewperf 12 Catia (catia-04): 12.55 fps | |||||||||||||||||||||||||||||||||||||||||||||||||||||||||||||||||||||||||||||||||||||||||||||||||||||||||||||||||||||||||||||||||||||||||||||
SPECviewperf 12 3ds Max (3dsmax-05): 10.98 fps | |||||||||||||||||||||||||||||||||||||||||||||||||||||||||||||||||||||||||||||||||||||||||||||||||||||||||||||||||||||||||||||||||||||||||||||
CrystalDiskMark 5.2 / 6 Write 4K: 126.3 MB/s | CrystalDiskMark 5.2 / 6 Write 4K: 122.7 MB/s » 97% | CrystalDiskMark 5.2 / 6 Write 4K: 105.1 MB/s » 83% | CrystalDiskMark 5.2 / 6 Write 4K: 128.6 MB/s » 102% | ||||||||||||||||||||||||||||||||||||||||||||||||||||||||||||||||||||||||||||||||||||||||||||||||||||||||||||||||||||||||||||||||||||||||||
CrystalDiskMark 5.2 / 6 Read 4K: 41.58 MB/s | CrystalDiskMark 5.2 / 6 Read 4K: 46.57 MB/s » 112% | CrystalDiskMark 5.2 / 6 Read 4K: 42.3 MB/s » 102% | CrystalDiskMark 5.2 / 6 Read 4K: 45.25 MB/s » 109% | ||||||||||||||||||||||||||||||||||||||||||||||||||||||||||||||||||||||||||||||||||||||||||||||||||||||||||||||||||||||||||||||||||||||||||
CrystalDiskMark 5.2 / 6 Write Seq: 1383 MB/s | CrystalDiskMark 5.2 / 6 Write Seq: 1725 MB/s » 125% | CrystalDiskMark 5.2 / 6 Write Seq: 677 MB/s » 49% | CrystalDiskMark 5.2 / 6 Write Seq: 1949 MB/s » 141% | ||||||||||||||||||||||||||||||||||||||||||||||||||||||||||||||||||||||||||||||||||||||||||||||||||||||||||||||||||||||||||||||||||||||||||
CrystalDiskMark 5.2 / 6 Read Seq: 2012 MB/s | CrystalDiskMark 5.2 / 6 Read Seq: 2392 MB/s » 119% | CrystalDiskMark 5.2 / 6 Read Seq: 2092 MB/s » 104% | CrystalDiskMark 5.2 / 6 Read Seq: 2359 MB/s » 117% | ||||||||||||||||||||||||||||||||||||||||||||||||||||||||||||||||||||||||||||||||||||||||||||||||||||||||||||||||||||||||||||||||||||||||||
CrystalDiskMark 5.2 / 6 Write 4K Q32T1: 543 MB/s | CrystalDiskMark 5.2 / 6 Write 4K Q32T1: 470.6 MB/s » 87% | CrystalDiskMark 5.2 / 6 Write 4K Q32T1: 378.8 MB/s » 70% | CrystalDiskMark 5.2 / 6 Write 4K Q32T1: 445 MB/s » 82% | ||||||||||||||||||||||||||||||||||||||||||||||||||||||||||||||||||||||||||||||||||||||||||||||||||||||||||||||||||||||||||||||||||||||||||
CrystalDiskMark 5.2 / 6 Read 4K Q32T1: 411 MB/s | CrystalDiskMark 5.2 / 6 Read 4K Q32T1: 313.2 MB/s » 76% | CrystalDiskMark 5.2 / 6 Read 4K Q32T1: 271.3 MB/s » 66% | CrystalDiskMark 5.2 / 6 Read 4K Q32T1: 404.5 MB/s » 98% | ||||||||||||||||||||||||||||||||||||||||||||||||||||||||||||||||||||||||||||||||||||||||||||||||||||||||||||||||||||||||||||||||||||||||||
CrystalDiskMark 5.2 / 6 Write Seq Q32T1: 1712 MB/s | CrystalDiskMark 5.2 / 6 Write Seq Q32T1: 1869 MB/s » 109% | CrystalDiskMark 5.2 / 6 Write Seq Q32T1: 527 MB/s » 31% | CrystalDiskMark 5.2 / 6 Write Seq Q32T1: 3019 MB/s » 176% | ||||||||||||||||||||||||||||||||||||||||||||||||||||||||||||||||||||||||||||||||||||||||||||||||||||||||||||||||||||||||||||||||||||||||||
CrystalDiskMark 5.2 / 6 Read Seq Q32T1: 3423 MB/s | CrystalDiskMark 5.2 / 6 Read Seq Q32T1: 3380 MB/s » 99% | CrystalDiskMark 5.2 / 6 Read Seq Q32T1: 3175 MB/s » 93% | CrystalDiskMark 5.2 / 6 Read Seq Q32T1: 3564 MB/s » 104% | ||||||||||||||||||||||||||||||||||||||||||||||||||||||||||||||||||||||||||||||||||||||||||||||||||||||||||||||||||||||||||||||||||||||||||
CrystalDiskMark 5.2 / 6 Write 4K Q8T8: 1031 MB/s | |||||||||||||||||||||||||||||||||||||||||||||||||||||||||||||||||||||||||||||||||||||||||||||||||||||||||||||||||||||||||||||||||||||||||||||
CrystalDiskMark 5.2 / 6 Read 4K Q8T8: 572 MB/s | |||||||||||||||||||||||||||||||||||||||||||||||||||||||||||||||||||||||||||||||||||||||||||||||||||||||||||||||||||||||||||||||||||||||||||||
Geekbench 4.4 Compute OpenCL Score: 29517 | Geekbench 4.4 Compute OpenCL Score: 35886 » 122% | ||||||||||||||||||||||||||||||||||||||||||||||||||||||||||||||||||||||||||||||||||||||||||||||||||||||||||||||||||||||||||||||||||||||||||||
Geekbench 4.4 64 Bit Multi-Core Score: 12488 | Geekbench 4.4 64 Bit Multi-Core Score: 12427 » 100% | ||||||||||||||||||||||||||||||||||||||||||||||||||||||||||||||||||||||||||||||||||||||||||||||||||||||||||||||||||||||||||||||||||||||||||||
Geekbench 4.4 64 Bit Single-Core Score: 4151 | Geekbench 4.4 64 Bit Single-Core Score: 4637 » 112% | ||||||||||||||||||||||||||||||||||||||||||||||||||||||||||||||||||||||||||||||||||||||||||||||||||||||||||||||||||||||||||||||||||||||||||||
SPECviewperf 13 Solidworks (sw-04): 27.99 fps | |||||||||||||||||||||||||||||||||||||||||||||||||||||||||||||||||||||||||||||||||||||||||||||||||||||||||||||||||||||||||||||||||||||||||||||
SPECviewperf 13 Siemens NX (snx-03): 4.37 fps | |||||||||||||||||||||||||||||||||||||||||||||||||||||||||||||||||||||||||||||||||||||||||||||||||||||||||||||||||||||||||||||||||||||||||||||
SPECviewperf 13 Showcase (showcase-02): 4.99 fps | |||||||||||||||||||||||||||||||||||||||||||||||||||||||||||||||||||||||||||||||||||||||||||||||||||||||||||||||||||||||||||||||||||||||||||||
SPECviewperf 13 Medical (medical-02): 2.15 fps | |||||||||||||||||||||||||||||||||||||||||||||||||||||||||||||||||||||||||||||||||||||||||||||||||||||||||||||||||||||||||||||||||||||||||||||
SPECviewperf 13 Maya (maya-05): 15.66 fps | |||||||||||||||||||||||||||||||||||||||||||||||||||||||||||||||||||||||||||||||||||||||||||||||||||||||||||||||||||||||||||||||||||||||||||||
SPECviewperf 13 Energy (energy-02): 0.21 fps | |||||||||||||||||||||||||||||||||||||||||||||||||||||||||||||||||||||||||||||||||||||||||||||||||||||||||||||||||||||||||||||||||||||||||||||
SPECviewperf 13 Creo (creo-02): 15.15 fps | |||||||||||||||||||||||||||||||||||||||||||||||||||||||||||||||||||||||||||||||||||||||||||||||||||||||||||||||||||||||||||||||||||||||||||||
SPECviewperf 13 Catia (catia-05): 17.43 fps | |||||||||||||||||||||||||||||||||||||||||||||||||||||||||||||||||||||||||||||||||||||||||||||||||||||||||||||||||||||||||||||||||||||||||||||
SPECviewperf 13 3ds Max (3dsmax-06): 10.82 fps | |||||||||||||||||||||||||||||||||||||||||||||||||||||||||||||||||||||||||||||||||||||||||||||||||||||||||||||||||||||||||||||||||||||||||||||
PCMark 8 Storage Score v2: 4912 Points | |||||||||||||||||||||||||||||||||||||||||||||||||||||||||||||||||||||||||||||||||||||||||||||||||||||||||||||||||||||||||||||||||||||||||||||
PCMark 8 Work Score Accelerated v2: 4843 Points | PCMark 8 Work Score Accelerated v2: 4558 Points » 94% | PCMark 8 Work Score Accelerated v2: 5189 Points » 107% | PCMark 8 Work Score Accelerated v2: 4382 Points » 90% | ||||||||||||||||||||||||||||||||||||||||||||||||||||||||||||||||||||||||||||||||||||||||||||||||||||||||||||||||||||||||||||||||||||||||||
PCMark 8 Creative Score Accelerated v2: 4924 Points | PCMark 8 Creative Score Accelerated v2: 5338 Points » 108% | ||||||||||||||||||||||||||||||||||||||||||||||||||||||||||||||||||||||||||||||||||||||||||||||||||||||||||||||||||||||||||||||||||||||||||||
PCMark 8 Home Score Accelerated v2: 3780 Points | PCMark 8 Home Score Accelerated v2: 3308 Points » 88% | PCMark 8 Home Score Accelerated v2: 4166 Points » 110% | PCMark 8 Home Score Accelerated v2: 3448 Points » 91% | ||||||||||||||||||||||||||||||||||||||||||||||||||||||||||||||||||||||||||||||||||||||||||||||||||||||||||||||||||||||||||||||||||||||||||
JetStream 1.1 Total Score: 226.5 Points | JetStream 1.1 Total Score: 253.9 Points » 112% | JetStream 1.1 Total Score: 235.9 Points » 104% | JetStream 1.1 Total Score: 257.3 Points » 114% | ||||||||||||||||||||||||||||||||||||||||||||||||||||||||||||||||||||||||||||||||||||||||||||||||||||||||||||||||||||||||||||||||||||||||||
PCMark 10 Digital Content Creation: 2982 Points | PCMark 10 Digital Content Creation: 3069 Points » 103% | PCMark 10 Digital Content Creation: 3055 Points » 102% | PCMark 10 Digital Content Creation: 3902 Points » 131% | ||||||||||||||||||||||||||||||||||||||||||||||||||||||||||||||||||||||||||||||||||||||||||||||||||||||||||||||||||||||||||||||||||||||||||
PCMark 10 Productivity: 6288 Points | PCMark 10 Productivity: 6670 Points » 106% | PCMark 10 Productivity: 6774 Points » 108% | PCMark 10 Productivity: 6989 Points » 111% | ||||||||||||||||||||||||||||||||||||||||||||||||||||||||||||||||||||||||||||||||||||||||||||||||||||||||||||||||||||||||||||||||||||||||||
PCMark 10 Essentials: 8201 Points | PCMark 10 Essentials: 8992 Points » 110% | PCMark 10 Essentials: 8454 Points » 103% | PCMark 10 Essentials: 9902 Points » 121% | ||||||||||||||||||||||||||||||||||||||||||||||||||||||||||||||||||||||||||||||||||||||||||||||||||||||||||||||||||||||||||||||||||||||||||
PCMark 10 Score: 3840 Points | PCMark 10 Score: 4078 Points » 106% | PCMark 10 Score: 4009 Points » 104% | PCMark 10 Score: 4633 Points » 121% | ||||||||||||||||||||||||||||||||||||||||||||||||||||||||||||||||||||||||||||||||||||||||||||||||||||||||||||||||||||||||||||||||||||||||||
Blender v2.79 BMW27 CPU: 861 Seconds* | Blender v2.79 BMW27 CPU: 938 Seconds* » 109% | ||||||||||||||||||||||||||||||||||||||||||||||||||||||||||||||||||||||||||||||||||||||||||||||||||||||||||||||||||||||||||||||||||||||||||||
7-Zip 18.03 7z b 4: 16245 MIPS | 7-Zip 18.03 7z b 4: 14784 MIPS » 91% | ||||||||||||||||||||||||||||||||||||||||||||||||||||||||||||||||||||||||||||||||||||||||||||||||||||||||||||||||||||||||||||||||||||||||||||
7-Zip 18.03 7z b 4 -mmt1: 4133 MIPS | 7-Zip 18.03 7z b 4 -mmt1: 4069 MIPS » 98% | ||||||||||||||||||||||||||||||||||||||||||||||||||||||||||||||||||||||||||||||||||||||||||||||||||||||||||||||||||||||||||||||||||||||||||||
HWBOT x265 Benchmark v2.2 4k Preset: 4.2 fps | HWBOT x265 Benchmark v2.2 4k Preset: 3.7 fps » 88% | ||||||||||||||||||||||||||||||||||||||||||||||||||||||||||||||||||||||||||||||||||||||||||||||||||||||||||||||||||||||||||||||||||||||||||||
X-Plane 11.11 high (fps_test=3): 19.1 fps | X-Plane 11.11 high (fps_test=3): 14.6 fps » 76% | ||||||||||||||||||||||||||||||||||||||||||||||||||||||||||||||||||||||||||||||||||||||||||||||||||||||||||||||||||||||||||||||||||||||||||||
X-Plane 11.11 med (fps_test=2): 22.7 fps | X-Plane 11.11 med (fps_test=2): 15.8 fps » 70% | ||||||||||||||||||||||||||||||||||||||||||||||||||||||||||||||||||||||||||||||||||||||||||||||||||||||||||||||||||||||||||||||||||||||||||||
X-Plane 11.11 low (fps_test=1): 30.3 fps | X-Plane 11.11 low (fps_test=1): 25 fps » 83% | ||||||||||||||||||||||||||||||||||||||||||||||||||||||||||||||||||||||||||||||||||||||||||||||||||||||||||||||||||||||||||||||||||||||||||||
BioShock Infinite Ultra Preset, DX11 (DDOF): 7.3 fps | BioShock Infinite Ultra Preset, DX11 (DDOF): 9.4 fps » 129% | BioShock Infinite Ultra Preset, DX11 (DDOF): 22.1 fps » 303% | |||||||||||||||||||||||||||||||||||||||||||||||||||||||||||||||||||||||||||||||||||||||||||||||||||||||||||||||||||||||||||||||||||||||||||
BioShock Infinite High Preset: 23.7 fps | BioShock Infinite High Preset: 28.9 fps » 122% | BioShock Infinite High Preset: 59.9 fps » 253% | |||||||||||||||||||||||||||||||||||||||||||||||||||||||||||||||||||||||||||||||||||||||||||||||||||||||||||||||||||||||||||||||||||||||||||
BioShock Infinite Medium Preset: 29.1 fps | BioShock Infinite Medium Preset: 35.8 fps » 123% | BioShock Infinite Medium Preset: 68.3 fps » 235% | |||||||||||||||||||||||||||||||||||||||||||||||||||||||||||||||||||||||||||||||||||||||||||||||||||||||||||||||||||||||||||||||||||||||||||
BioShock Infinite Very Low Preset: 54.3 fps | BioShock Infinite Very Low Preset: 59.8 fps » 110% | BioShock Infinite Very Low Preset: 104.2 fps » 192% | |||||||||||||||||||||||||||||||||||||||||||||||||||||||||||||||||||||||||||||||||||||||||||||||||||||||||||||||||||||||||||||||||||||||||||
Dota 2 Reborn ultra (3/3) best looking: 16 fps | Dota 2 Reborn ultra (3/3) best looking: 18.3 fps » 114% | ||||||||||||||||||||||||||||||||||||||||||||||||||||||||||||||||||||||||||||||||||||||||||||||||||||||||||||||||||||||||||||||||||||||||||||
Dota 2 Reborn high (2/3): 18 fps | Dota 2 Reborn high (2/3): 20.6 fps » 114% | ||||||||||||||||||||||||||||||||||||||||||||||||||||||||||||||||||||||||||||||||||||||||||||||||||||||||||||||||||||||||||||||||||||||||||||
Dota 2 Reborn med (1/3): 38.7 fps | Dota 2 Reborn med (1/3): 44.8 fps » 116% | ||||||||||||||||||||||||||||||||||||||||||||||||||||||||||||||||||||||||||||||||||||||||||||||||||||||||||||||||||||||||||||||||||||||||||||
Dota 2 Reborn min (0/3) fastest: 69.5 fps | Dota 2 Reborn min (0/3) fastest: 68 fps » 98% | ||||||||||||||||||||||||||||||||||||||||||||||||||||||||||||||||||||||||||||||||||||||||||||||||||||||||||||||||||||||||||||||||||||||||||||
SD Card Reader JPG Copy Test (av. of 3 runs): 72.3 MB/s | SD Card Reader JPG Copy Test (av. of 3 runs): 162 MB/s » 224% | ||||||||||||||||||||||||||||||||||||||||||||||||||||||||||||||||||||||||||||||||||||||||||||||||||||||||||||||||||||||||||||||||||||||||||||
SD Card Reader AS SSD Seq Read Test (1GB): 81.2 MB/s | SD Card Reader AS SSD Seq Read Test (1GB): 198 MB/s » 244% | ||||||||||||||||||||||||||||||||||||||||||||||||||||||||||||||||||||||||||||||||||||||||||||||||||||||||||||||||||||||||||||||||||||||||||||
Battery Runtime WiFi Websurfing: 431 min | Battery Runtime WiFi Websurfing: 623 min » 145% | Battery Runtime WiFi Websurfing: 531 min » 123% | Battery Runtime WiFi Websurfing: 436 min » 101% | ||||||||||||||||||||||||||||||||||||||||||||||||||||||||||||||||||||||||||||||||||||||||||||||||||||||||||||||||||||||||||||||||||||||||||
Response Times Response Time Grey 50% / Grey 80%: 51.2 ms* | Response Times Response Time Grey 50% / Grey 80%: 70.8 ms* » 138% | Response Times Response Time Grey 50% / Grey 80%: 29.2 ms* » 57% | Response Times Response Time Grey 50% / Grey 80%: 44.4 ms* » 87% | ||||||||||||||||||||||||||||||||||||||||||||||||||||||||||||||||||||||||||||||||||||||||||||||||||||||||||||||||||||||||||||||||||||||||||
Response Times Response Time Black / White: 36.8 ms* | Response Times Response Time Black / White: 34.4 ms* » 93% | Response Times Response Time Black / White: 20 ms* » 54% | Response Times Response Time Black / White: 27.2 ms* » 74% | ||||||||||||||||||||||||||||||||||||||||||||||||||||||||||||||||||||||||||||||||||||||||||||||||||||||||||||||||||||||||||||||||||||||||||
Response Times PWM Frequency: 1000 Hz | Response Times PWM Frequency: 735 Hz » 74% | Response Times PWM Frequency: 1000 Hz » 100% | Response Times PWM Frequency: 0 Hz » 0% | ||||||||||||||||||||||||||||||||||||||||||||||||||||||||||||||||||||||||||||||||||||||||||||||||||||||||||||||||||||||||||||||||||||||||||
Emissions Fan Noise: 30.6 dB(A) | Emissions Fan Noise: 32.1 dB(A) » 105% | Emissions Fan Noise: 42.6 dB(A) » 139% | |||||||||||||||||||||||||||||||||||||||||||||||||||||||||||||||||||||||||||||||||||||||||||||||||||||||||||||||||||||||||||||||||||||||||||
Emissions Fan Noise The Witcher 3 ultra: 40.7 dB(A) | |||||||||||||||||||||||||||||||||||||||||||||||||||||||||||||||||||||||||||||||||||||||||||||||||||||||||||||||||||||||||||||||||||||||||||||
Loudspeakers Pink Noise: 76.3 dB(A) | Loudspeakers Pink Noise: 80.9 dB(A) » 106% | Loudspeakers Pink Noise: 79.8 dB(A) » 105% | Loudspeakers Pink Noise: 90.3 dB(A) » 118% | ||||||||||||||||||||||||||||||||||||||||||||||||||||||||||||||||||||||||||||||||||||||||||||||||||||||||||||||||||||||||||||||||||||||||||
Networking iperf3 receive AX12: 649 MBit/s | Networking iperf3 receive AX12: 654 MBit/s » 101% | Networking iperf3 receive AX12: 647 MBit/s » 100% | |||||||||||||||||||||||||||||||||||||||||||||||||||||||||||||||||||||||||||||||||||||||||||||||||||||||||||||||||||||||||||||||||||||||||||
Networking iperf3 transmit AX12: 680 MBit/s | Networking iperf3 transmit AX12: 477 MBit/s » 70% | Networking iperf3 transmit AX12: 681 MBit/s » 100% | |||||||||||||||||||||||||||||||||||||||||||||||||||||||||||||||||||||||||||||||||||||||||||||||||||||||||||||||||||||||||||||||||||||||||||
Display Display P3 Coverage: 69.2 % | Display Display P3 Coverage: 64.3 % » 93% | Display Display P3 Coverage: 63 % » 91% | Display Display P3 Coverage: 83.8 % » 121% | ||||||||||||||||||||||||||||||||||||||||||||||||||||||||||||||||||||||||||||||||||||||||||||||||||||||||||||||||||||||||||||||||||||||||||
Display sRGB Coverage: 90.6 % | Display sRGB Coverage: 94.1 % » 104% | Display sRGB Coverage: 89.8 % » 99% | Display sRGB Coverage: 99.9 % » 110% | ||||||||||||||||||||||||||||||||||||||||||||||||||||||||||||||||||||||||||||||||||||||||||||||||||||||||||||||||||||||||||||||||||||||||||
Display AdobeRGB 1998 Coverage: 66.3 % | Display AdobeRGB 1998 Coverage: 65.5 % » 99% | Display AdobeRGB 1998 Coverage: 64.1 % » 97% | Display AdobeRGB 1998 Coverage: 83.3 % » 126% | ||||||||||||||||||||||||||||||||||||||||||||||||||||||||||||||||||||||||||||||||||||||||||||||||||||||||||||||||||||||||||||||||||||||||||
Cinebench R20 CPU (Single Core): 357 Points | Cinebench R20 CPU (Single Core): 452 Points | ||||||||||||||||||||||||||||||||||||||||||||||||||||||||||||||||||||||||||||||||||||||||||||||||||||||||||||||||||||||||||||||||||||||||||||
Cinebench R20 CPU (Multi Core): 1021 Points | Cinebench R20 CPU (Multi Core): 1590 Points | ||||||||||||||||||||||||||||||||||||||||||||||||||||||||||||||||||||||||||||||||||||||||||||||||||||||||||||||||||||||||||||||||||||||||||||
Speedometer 2.0 Result: 59.1 runs/min | |||||||||||||||||||||||||||||||||||||||||||||||||||||||||||||||||||||||||||||||||||||||||||||||||||||||||||||||||||||||||||||||||||||||||||||
Tomb Raider Ultra Preset: 14.4 fps | |||||||||||||||||||||||||||||||||||||||||||||||||||||||||||||||||||||||||||||||||||||||||||||||||||||||||||||||||||||||||||||||||||||||||||||
Tomb Raider High Preset: 30.7 fps | |||||||||||||||||||||||||||||||||||||||||||||||||||||||||||||||||||||||||||||||||||||||||||||||||||||||||||||||||||||||||||||||||||||||||||||
Tomb Raider Normal Preset: 46.1 fps | |||||||||||||||||||||||||||||||||||||||||||||||||||||||||||||||||||||||||||||||||||||||||||||||||||||||||||||||||||||||||||||||||||||||||||||
Tomb Raider Low Preset: 98.9 fps | |||||||||||||||||||||||||||||||||||||||||||||||||||||||||||||||||||||||||||||||||||||||||||||||||||||||||||||||||||||||||||||||||||||||||||||
The Witcher 3 Low Graphics & Postprocessing: 11.8 fps | The Witcher 3 Low Graphics & Postprocessing: 52.7 fps | ||||||||||||||||||||||||||||||||||||||||||||||||||||||||||||||||||||||||||||||||||||||||||||||||||||||||||||||||||||||||||||||||||||||||||||
The Witcher 3 Ultra Graphics & Postprocessing (HBAO+): 9.9 fps | |||||||||||||||||||||||||||||||||||||||||||||||||||||||||||||||||||||||||||||||||||||||||||||||||||||||||||||||||||||||||||||||||||||||||||||
The Witcher 3 High Graphics & Postprocessing (Nvidia HairWorks Off): 19.6 fps | |||||||||||||||||||||||||||||||||||||||||||||||||||||||||||||||||||||||||||||||||||||||||||||||||||||||||||||||||||||||||||||||||||||||||||||
The Witcher 3 Medium Graphics & Postprocessing: 36.3 fps | |||||||||||||||||||||||||||||||||||||||||||||||||||||||||||||||||||||||||||||||||||||||||||||||||||||||||||||||||||||||||||||||||||||||||||||
Shadow of the Tomb Raider Lowest Preset: 26 fps | |||||||||||||||||||||||||||||||||||||||||||||||||||||||||||||||||||||||||||||||||||||||||||||||||||||||||||||||||||||||||||||||||||||||||||||
Rocket League High Quality: 44.3 fps | |||||||||||||||||||||||||||||||||||||||||||||||||||||||||||||||||||||||||||||||||||||||||||||||||||||||||||||||||||||||||||||||||||||||||||||
Rocket League Quality: 68.5 fps | |||||||||||||||||||||||||||||||||||||||||||||||||||||||||||||||||||||||||||||||||||||||||||||||||||||||||||||||||||||||||||||||||||||||||||||
Rocket League Performance: 90.7 fps | |||||||||||||||||||||||||||||||||||||||||||||||||||||||||||||||||||||||||||||||||||||||||||||||||||||||||||||||||||||||||||||||||||||||||||||
Rocket League Performance: 119 fps | |||||||||||||||||||||||||||||||||||||||||||||||||||||||||||||||||||||||||||||||||||||||||||||||||||||||||||||||||||||||||||||||||||||||||||||
Power Consumption Witcher 3 ultra Efficiency: 0.2111 fps per Watt | |||||||||||||||||||||||||||||||||||||||||||||||||||||||||||||||||||||||||||||||||||||||||||||||||||||||||||||||||||||||||||||||||||||||||||||
Power Consumption Witcher 3 ultra: 46.9 Watt* | |||||||||||||||||||||||||||||||||||||||||||||||||||||||||||||||||||||||||||||||||||||||||||||||||||||||||||||||||||||||||||||||||||||||||||||

#0 before search +0s ... 0s
#1 after search +0s ... 0s
#2 added compareJS +0s ... 0s
#3 looking up spec 306251 +0s ... 0s
#4 looking up spec 307211 +0s ... 0s
#5 looking up spec 310352 +0s ... 0s
#6 looking up spec 313523 +0s ... 0s
#7 more than one entry found +0.003s ... 0.003s
#8 ThinkPad L390 Yoga-20NT000XGE for array +0.26s ... 0.263s
#9 Elitebook x360 1040 G5 for array +0.266s ... 0.529s
#10 Spectre x360 13-ap0312ng for array +0.244s ... 0.774s
#11 Yoga C940-14IIL 81Q9 for array +0.28s ... 1.054s
#12 return log +0s ... 1.054s