Notebookcheck Logo

Intel Core i5-13400F vs Intel Core i5-13400

Intel Core i5-13400F

► remove from comparison Intel i5-13400F

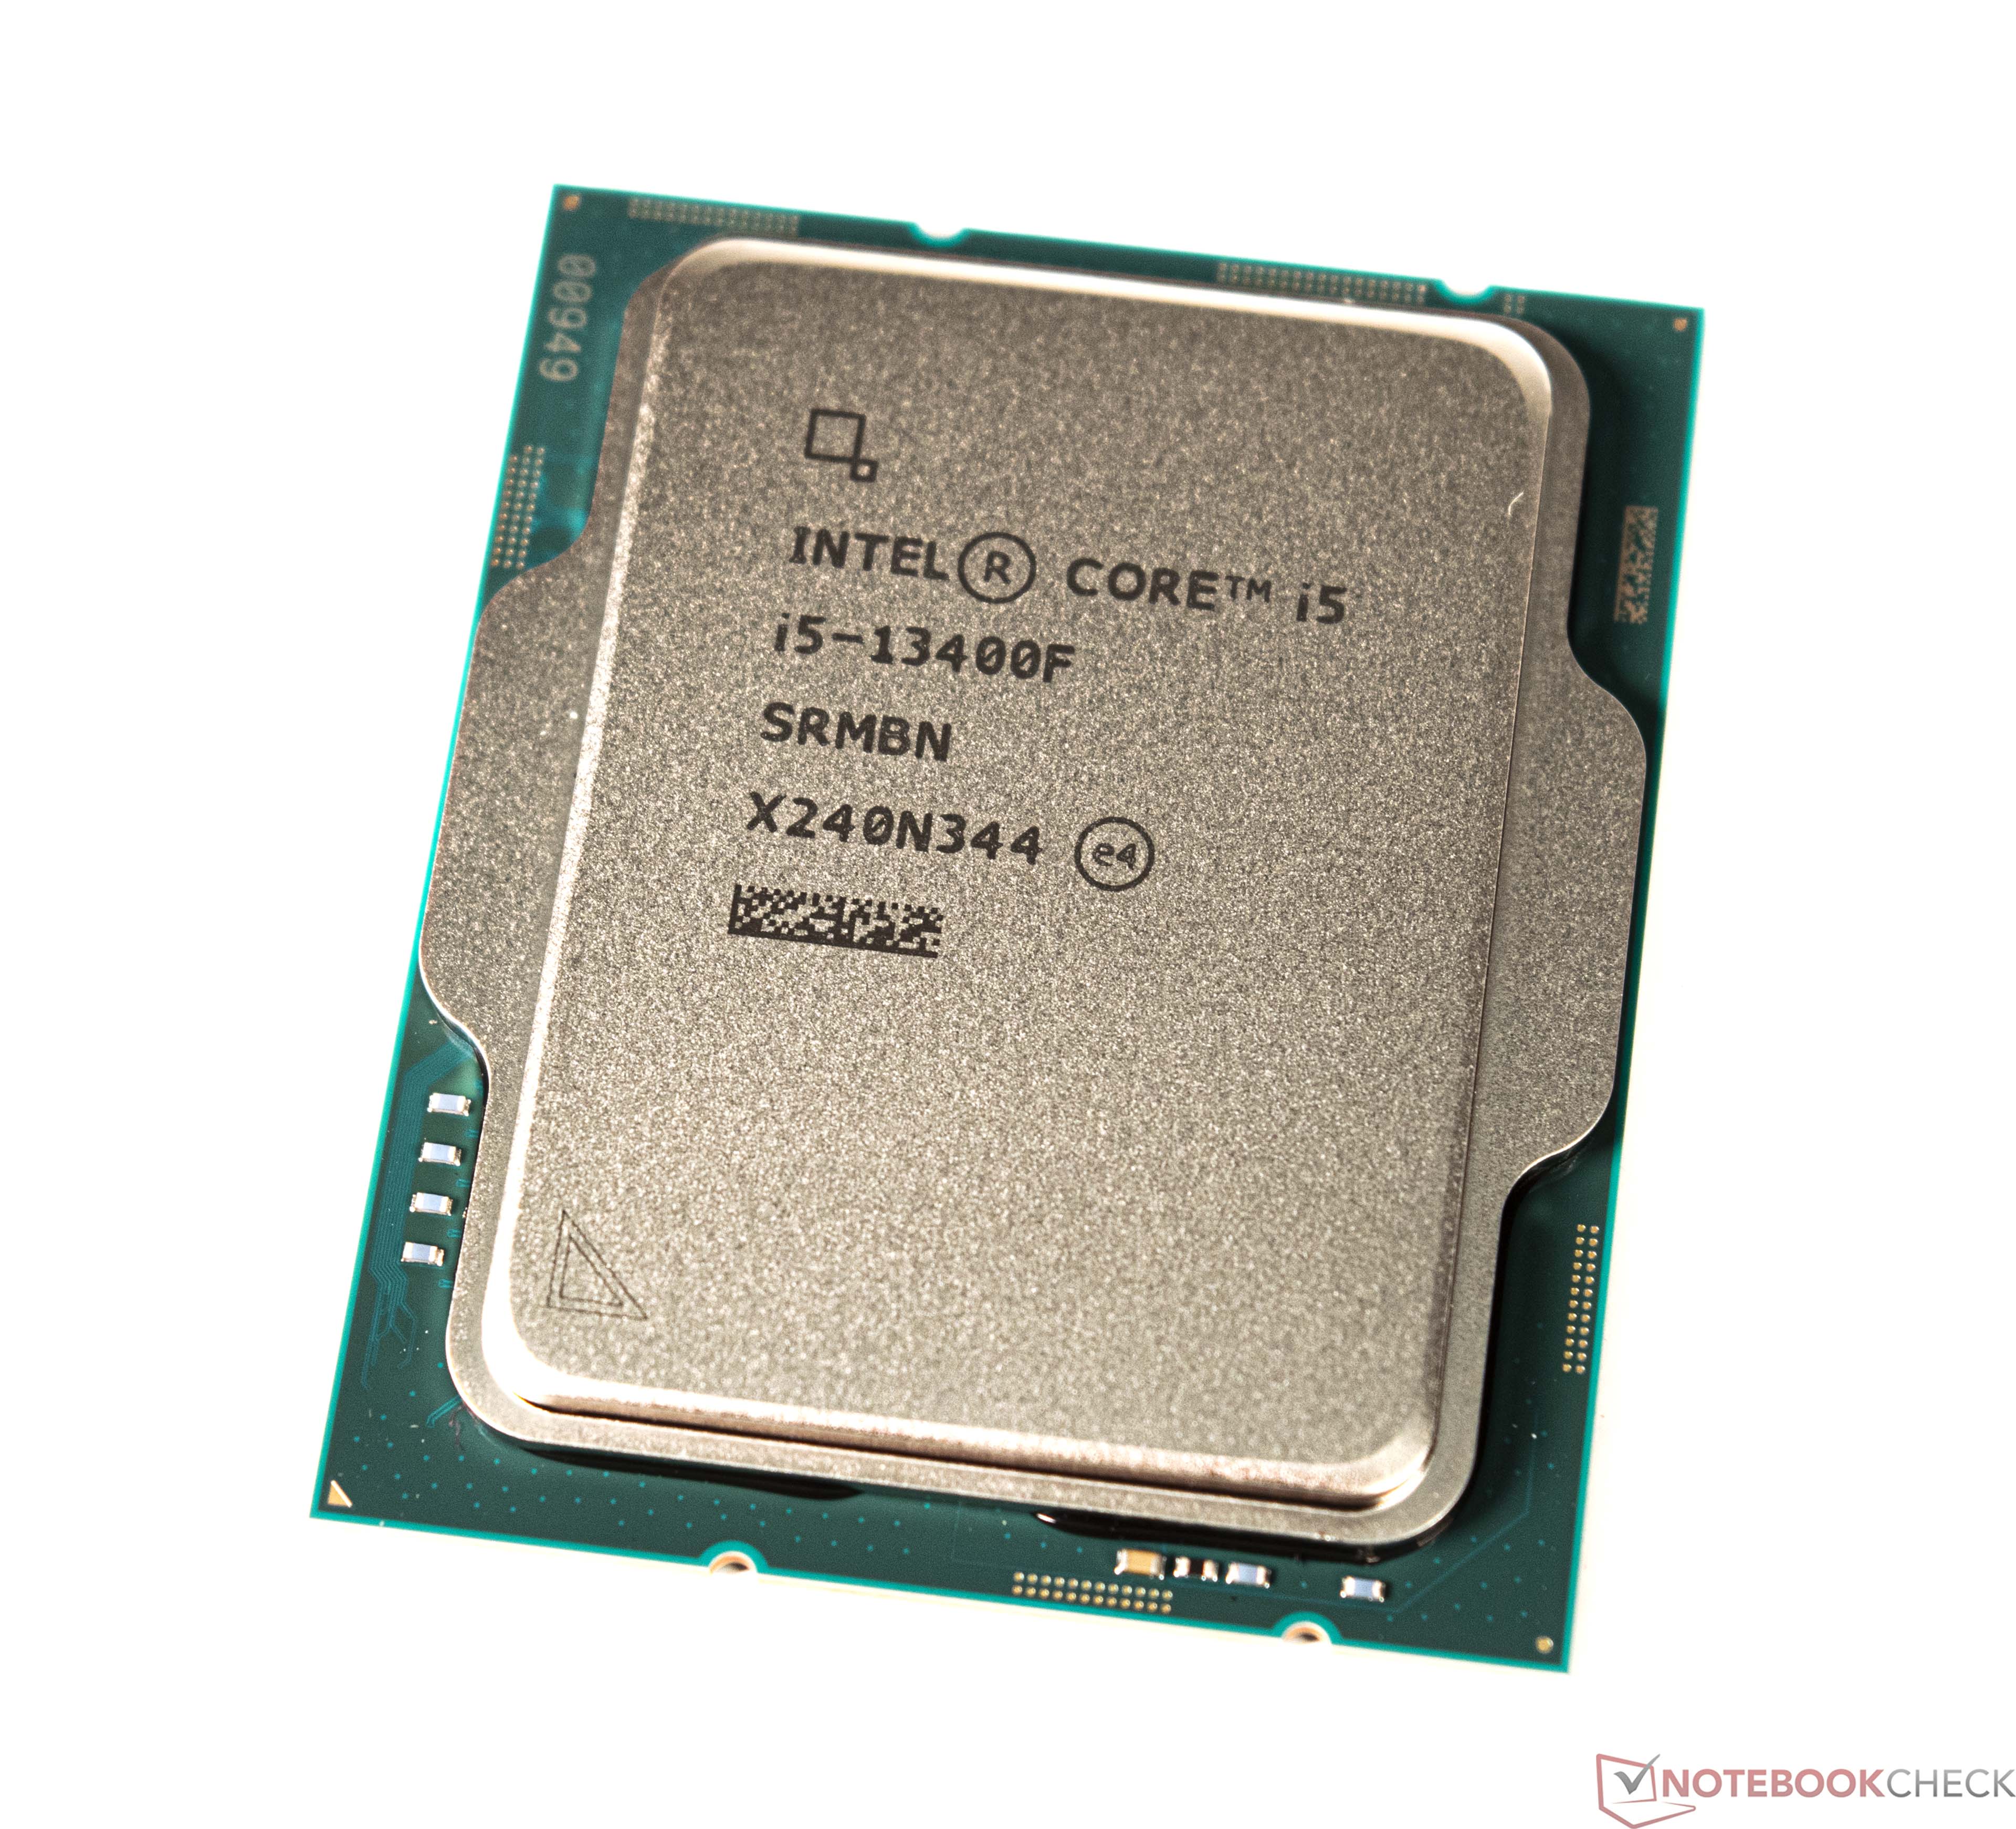
The Intel Core i5-13400F is a mid-range desktop processor of the Raptor Lake series. It includes a hybrid architecture for the CPU cores with combined 10 cores. Six fast Golden Cove / Raptor Cove performance cores (P-cores) with HyperThreading and a clock speed of 3.5 - 5.1 GHz and four Gracemont efficiency cores without HyperThreading and a clock speed of 2.6 - 3.9 GHz. The 13400F can be based on the older Alder Lake chips (at least for early models) or the newer Raptor Lake chips. The F-series of CPUs do not integrate a iGPU.

The performance is clearly higher than the old Core i5-12400F due to the additional four E-cores. These help in multi-threaded workloads and the higher boost core of the p-cores help for single threaded workloads.

The power consumption of the 13400F is rated at 65 Watt for sustained workloads (PL1) and 148 Watt for short bursts (PL2).

Intel Core i5-13400

► remove from comparison Intel i5-13400

The Intel Core i5-13400 is a top modern and fast desktop processor and belongs to the current Raptor Lake series. The processor was introduced early 2023 and offers a base clock of 2.5 GHz. It reaches up to 4.6 GHz in Turbo mode. As with Alder Lake-S, Raptor Lake-S is also based on a hybrid design that combines P and E cores. The Intel Core i5-13400 therefore offers 6 P-cores and 4 E-cores, which can process a total of up to 16 threads in parallel. The processor continues to be manufactured using the 10 nm production process (called "Intel 7"). The Intel Core i5-13400 does not have a freely selectable multiplier. The LGA 1700 socket introduced with the Alder Lake series serves as the basis. The Intel Core i5-13400 can be based on either a Raptor Lake or Alder Lake chip. Initially, however, Alder Lake chips will be supplied.

Performance

Compared to the Intel Core i5-12400, the IPC of the new Core i5-13400 has been increased slightly. Nevertheless, there are now also 4 e-cores, which support the processor in terms of multi-thread performance. This puts the Intel Core i5-13400 at the level of an Intel Core i5-12600K, which also offers a total of 16 threads.

Graphics unit

The Intel Core i5-13400 is a processor with an integrated graphics unit, but it is only suited for office use or very old and low demanding games.

Power consumption

The TDP of the Intel Core i5-13400 is 65 watts in PL1. Intel defines the PL2 limit at 148 watts. If the restrictions regarding power consumption are deactivated in the BIOS, the PL2 value can be reached permanently. However, a high-quality and powerful cooling unit should be used for this.

ModelIntel Core i5-13400FIntel Core i5-13400
SeriesIntel Raptor Lake-SIntel Raptor Lake-S
CodenameRaptor Lake-SRaptor Lake-S
Series: Raptor Lake-S Raptor Lake-S
Intel Core i7-13700 compare2.1 - 5.2 GHz16 / 24 cores30 MB L3
Intel Core i5-13400F « 2.5 - 4.6 GHz10 / 16 cores20 MB L3
Intel Core i5-134002.5 - 4.6 GHz10 / 16 cores20 MB L3
Intel Core i7-13700 compare2.1 - 5.2 GHz16 / 24 cores30 MB L3
Intel Core i5-13400F2.5 - 4.6 GHz10 / 16 cores20 MB L3
Intel Core i5-13400 « 2.5 - 4.6 GHz10 / 16 cores20 MB L3
Clock2500 - 4600 MHz2500 - 4600 MHz
L1 Cache0.1 MB0.1 MB
L2 Cache9.5 MB9.5 MB
L3 Cache20 MB20 MB
Cores / Threads10 / 1610 / 16
TDP65 Watt65 Watt
Technology10 nm10 nm
Die Size257 mm2257 mm2
max. Temp.100 °C100 °C
SocketLGA 1700LGA 1700
FeaturesIntel SSE4.1, Intel SSE4.2, Intel AVX2Intel SSE4.1, Intel SSE4.2, Intel AVX2
Architecturex86x86
$196 U.S.$221 U.S.
Announced
Manufacturerark.intel.comwww.intel.de
iGPUIntel UHD Graphics 730 (Rocket Lake) (300 - 1550 MHz)

Benchmarks

Performance Rating - CB R15 + R20 + 7-Zip + X265 + Blender + 3DM11 CPU - i5-13400F
42.5 pt (59%)
Performance Rating - CB R15 + R20 + 7-Zip + X265 + Blender + 3DM11 CPU - i5-13400
42.9 pt (60%)
Cinebench R23 - Cinebench R23 Multi Core
15911 Points (15%)
15953 Points (15%)
Cinebench R23 - Cinebench R23 Single Core
1744 Points (74%)
1786 Points (76%)
Cinebench R20 - Cinebench R20 CPU (Single Core)
672 Points (75%)
688 Points (76%)
Cinebench R20 - Cinebench R20 CPU (Multi Core)
6091 Points (15%)
6135 Points (15%)
Cinebench R15 - Cinebench R15 CPU Multi 64 Bit
2364 Points (15%)
2358 Points (15%)
Cinebench R15 - Cinebench R15 CPU Single 64 Bit
252 Points (76%)
257 Points (77%)
Cinebench R11.5 - Cinebench R11.5 CPU Multi 64 Bit
27.5 Points (36%)
27.4 Points (36%)
Cinebench R11.5 - Cinebench R11.5 CPU Single 64 Bit
3.1 Points (76%)
3.1 Points (77%)
Cinebench R10 - Cinebench R10 Rend. Single (32bit)
8689 Points (52%)
8721 Points (53%)
Cinebench R10 - Cinebench R10 Rend. Multi (32bit)
51113 Points (37%)
51095 Points (37%)
Cinebench R10 - Cinebench R10 Rend. Multi (64bit)
82988 Points (58%)
83214 Points (58%)
Cinebench R10 - Cinebench R10 Rend. Single (64bit)
13947 Points (17%)
14142 Points (17%)
wPrime 2.10 - wPrime 2.0 1024m *
367.9 s (4%)
452.3 s (5%)
wPrime 2.10 - wPrime 2.0 32m *
3.3 s (1%)
3.5 s (1%)
WinRAR - WinRAR 4.0
8602 Points (14%)
7979 Points (13%)
7-Zip 18.03 - 7-Zip 18.03 Multli Thread 4 runs
60048 MIPS (34%)
59510 MIPS (34%)
7-Zip 18.03 - 7-Zip 18.03 Single Thread 4 runs
5743 MIPS (69%)
5829 MIPS (70%)
X264 HD Benchmark 4.0 - x264 Pass 2
136.9 fps (48%)
135.8 fps (47%)
X264 HD Benchmark 4.0 - x264 Pass 1
314.5 fps (73%)
311 fps (72%)
HWBOT x265 Benchmark v2.2 - HWBOT x265 4k Preset
19.2 fps (34%)
19.1 fps (34%)
TrueCrypt - TrueCrypt Serpent
1.1 GB/s (0%)
1.2 GB/s (0%)
TrueCrypt - TrueCrypt Twofish
2 GB/s (34%)
2 GB/s (34%)
TrueCrypt - TrueCrypt AES
12.2 GB/s (32%)
11.8 GB/s (31%)
Blender - Blender 3.3 Classroom CPU *
336 Seconds (4%)
336 Seconds (4%)
Blender - Blender 2.79 BMW27 CPU *
206 Seconds (1%)
206 Seconds (1%)
R Benchmark 2.5 - R Benchmark 2.5 *
0.5 sec (10%)
0.5 sec (10%)
3DMark 06 - CPU - 3DMark 06 - CPU
13989 Points (30%)
13632 Points (29%)
Super Pi mod 1.5 XS 1M - Super Pi mod 1.5 XS 1M *
8 s (2%)
8 s (2%)
Super Pi mod 1.5 XS 2M - Super Pi mod 1.5 XS 2M *
17.9 s (1%)
18 s (1%)
Super Pi Mod 1.5 XS 32M - Super Pi mod 1.5 XS 32M *
420.5 s (2%)
427.2 s (2%)
3DMark Vantage - 3DM Vant. Perf. CPU no Physx
77937 Points (68%)
79573 Points (70%)
3DMark 11 - 3DM11 Performance Physics
23820 Points (64%)
23120 Points (63%)
3DMark - 3DMark Ice Storm Physics
77765 Points (63%)
83302 Points (68%)
3DMark - 3DMark Ice Storm Extreme Physics
76636 Points (62%)
82671 Points (67%)
3DMark - 3DMark Ice Storm Unlimited Physics
80273 Points (68%)
89999 Points (76%)
3DMark - 3DMark Cloud Gate Physics
19846 Points (50%)
19608 Points (50%)
3DMark - 3DMark Fire Strike Standard Physics
28087 Points (50%)
27135 Points (48%)
3DMark - 3DMark Time Spy CPU
12669 Points (53%)
12948 Points (55%)
Geekbench 5.5 - Geekbench 5.1 - 5.4 64 Bit Single-Core
1792 Points (76%)
1795 Points (76%)
Geekbench 5.5 - Geekbench 5.1 - 5.4 64 Bit Multi-Core
12095 Points (22%)
12107 Points (22%)
Geekbench 5.0 - Geekbench 5.0 64 Bit Single-Core
1721 Points (7%)
1706 Points (7%)
Geekbench 5.0 - Geekbench 5.0 64 Bit Multi-Core
12009 Points (38%)
11801 Points (37%)
Geekbench 4.4 - Geekbench 4.1 - 4.4 64 Bit Single-Core
7684 Points (77%)
7683 Points (77%)
Geekbench 4.4 - Geekbench 4.1 - 4.4 64 Bit Multi-Core
43856 Points (49%)
42509 Points (47%)
Mozilla Kraken 1.1 - Kraken 1.1 Total Score *
535 ms (1%)
535 ms (1%)
WebXPRT 4 - WebXPRT 4 Score
254 Points (73%)
251 Points (72%)
WebXPRT 3 - WebXPRT 3 Score
294 Points (61%)
306 Points (64%)
CrossMark - CrossMark Overall
1941 Points (74%)
1877 Points (72%)
Power Consumption - Prime95 Power Consumption - external Monitor *
214 Watt (37%)
229 Watt (39%)
Power Consumption - Cinebench R15 Multi Power Consumption - external Monitor *
184.2 Watt (34%)
196.6 Watt (36%)
Power Consumption - Idle Power Consumption - external Monitor *
76.3 Watt (50%)
Power Consumption - Idle Power Consumption 150cd 1min *
82.8 Watt (92%)

Average Benchmarks Intel Core i5-13400F → 100% n=48

Average Benchmarks Intel Core i5-13400 → 100% n=48

- Range of benchmark values for this graphics card
- Average benchmark values for this graphics card
* Smaller numbers mean a higher performance
1 This benchmark is not used for the average calculation

Add one or more devices and compare

In the following list you can select (and also search for) devices that should be added to the comparison. You can select more than one device.

restrict list:

show all (including archived), 2024, 2023
v1.26
log 27. 04:24:25

#0 checking url part for id 14966 +0s ... 0s

#1 checking url part for id 14996 +0s ... 0s

#2 not redirecting to Ajax server +0s ... 0s

#3 did not recreate cache, as it is less than 5 days old! Created at Thu, 25 Apr 2024 05:38:32 +0200 +0.001s ... 0.001s

#4 composed specs +0.013s ... 0.014s

#5 did output specs +0s ... 0.014s

#6 getting avg benchmarks for device 14966 +0.019s ... 0.033s

#7 got single benchmarks 14966 +0.011s ... 0.045s

#8 getting avg benchmarks for device 14996 +0.014s ... 0.059s

#9 got single benchmarks 14996 +0.009s ... 0.068s

#10 got avg benchmarks for devices +0s ... 0.068s

#11 min, max, avg, median took s +0.412s ... 0.48s

#12 return log +0.026s ... 0.506s

Please share our article, every link counts!
> Expert Reviews and News on Laptops, Smartphones and Tech Innovations > Benchmarks / Tech > Processor Comparison - Head 2 Head
Redaktion, 2017-09- 8 (Update: 2023-07- 1)