Notebookcheck Logo

Qualcomm Snapdragon 8cx Gen 3 vs Qualcomm Snapdragon X Plus X1P-46-100

Qualcomm Snapdragon 8cx Gen 3

► remove from comparison Qualcomm SD 8cx Gen 3

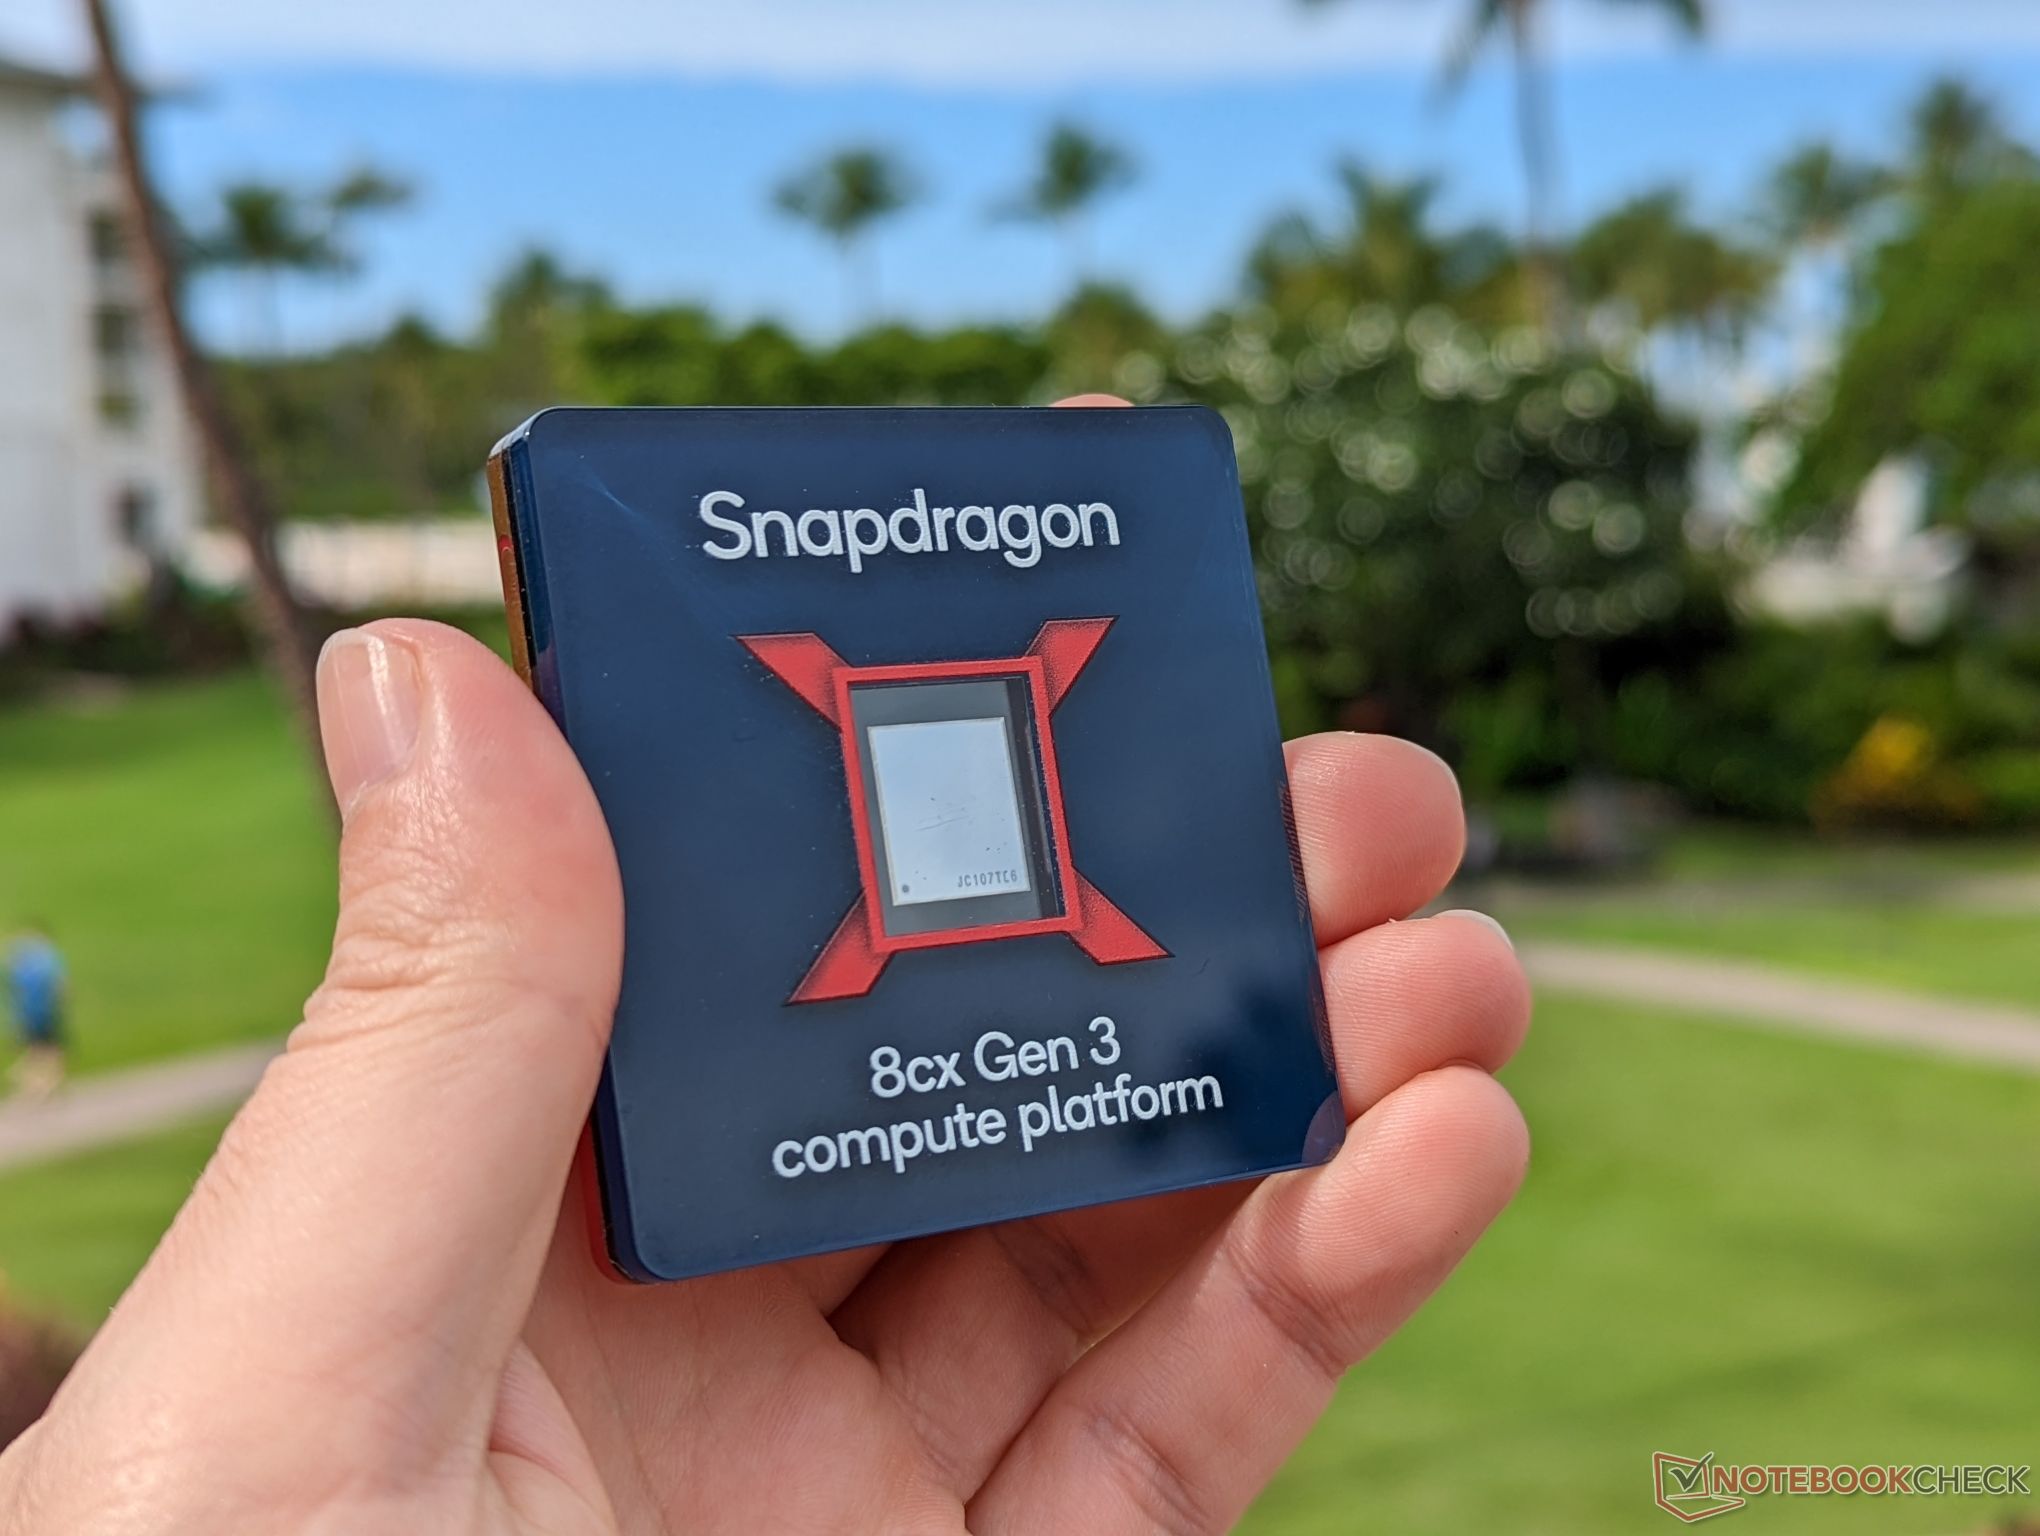
The Qualcomm Snapdragon 8cx Gen 3 Compute Platform is an ARM based SoC for Windows laptops. It integrates four big ARM Cortex-X1 performance cores (up to 3 GHz) and four smaller ARM Cortex-A78 with up to 2.4 GHz.

The Compute Platform also integrates a Snapdragon X62 5G modem with up to 10 Gbps download and 316 Mbps upload. The integrated WLAN modem supports Wi-Fi 6E (2x2) and the satellite positioning system supports BeiDou, Galileo, GLONASS, GPS, QZSS, and SBAS. The integrated video engine supports H.264, H.265, and VP9 decoding in 4K 120fps.

The performance should be around 85% faster for the CPU and 60% faster for the GPU compared to the previous generation (Snapdragon 8cx Gen 2).

The chip is produced in the modern 5nm process at Samsung (5LPE) and designed for fanless laptops (7 to 9 Watt TDP range).

Qualcomm Snapdragon X Plus X1P-46-100

► remove from comparison Qualcomm SD X Plus X1P-46-100

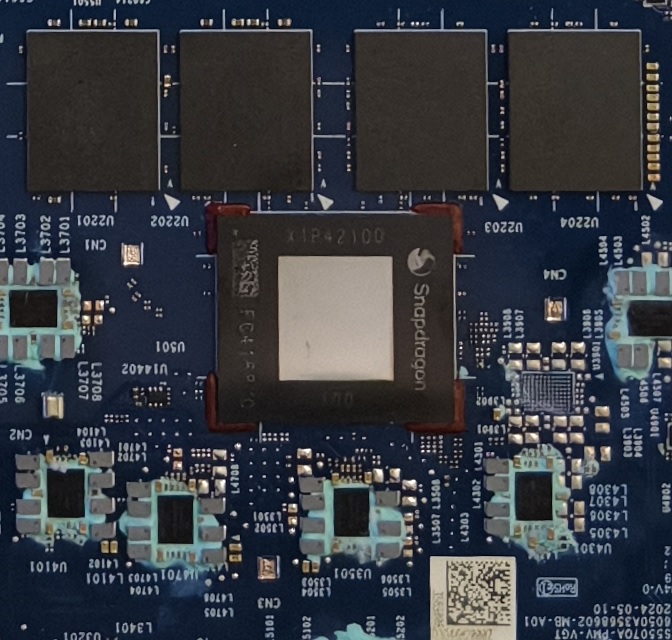
The Snapdragon X Plus 8-core (X1P-46-100) is a relatively affordable ARM architecture processor for use in Windows laptops that was unveiled in Sep 2024. This Qualcomm SoC features 8 Oryon CPU cores running at up to 4.0 GHz, along with the 2.1 TFLOPS X1-45 iGPU and the 45 TOPS Hexagon NPU. The super-fast LPDDR5x-8448 memory controller, USB 4.0 support, TB 4 support and PCIe 4 support are all onboard as well.

Architecture and Features

The Oryon cores (2 clusters of essentially identical cores; 8 threads) are mostly based on Nuvia IP and they reportedly make use of the ARM v8.7 microarchitecture. Much like modern AMD and Intel processors, the Snapdragon chip is compatible with USB 4 and thus with Thunderbolt 4 however it does not appear to support eGPUs as of September 2024.

The X1P-46-100 is based on the smaller die codenamed Purwa, unlike most X Elite and X Plus processors. It is believed to have at least 8 PCIe 4 and 4 PCIe 3 lanes for connecting various kinds of devices. NVMe SSDs are supported with a throughput of up to 7.9 GB/s; furthermore, most laptops built around the chip are expected to have 16 GB of LPDDR5x-8448 RAM. There is also a 45 TOPS NPU present for accelerating AI workloads.

Performance

A lot depends on the power targets of a specific system, just like it is with AMD, Intel and Nvidia products. That being said, we fully expect the X1P-46-100 to be just a little faster than the Core i5-1245U when executing multi-threaded x86 code.

The 4.0 GHz clock speed is only achievable in single-thread workloads. When executing multi-threaded tasks, the CPU cores will run at no more than 3.4 GHz.

Graphics

The X1-45 used here delivers up to 2.1 TFLOPS of performance. Unlike the much faster 3.8 TFLOPS and 4.6 TFLOPS X1-85 iGPUs, this little graphics adapter has much fewer unified shaders at its disposal. Its gaming performance is set to be sufficient for pre-2021 games at resolutions such as 1600x900 on low graphics settings.

AVC, HEVC and AV1 video codecs can be both hardware-decoded and hardware-encoded whereas with VP9, only decoding is possible. The highest monitor resolution supported is UHD 2160p.

Power consumption

Expect to see anything between 15 W and 30 W under long-term workloads depending on the system and the power profile chosen. The number includes RAM.

The SoC is built with TSMC's N4P process for better-than-average power efficiency, as of H2 2024.

ModelQualcomm Snapdragon 8cx Gen 3Qualcomm Snapdragon X Plus X1P-46-100
CodenameCortex-X1 / A78Oryon
SeriesQualcomm SnapdragonQualcomm Snapdragon X
Clock2400 - 2995 MHz <=4000 MHz
L1 Cache768 KB2.3 MB
L2 Cache6 MB12 MB
L3 Cache8 MB6 MB
Cores / Threads8 / 88 / 8 4.0 GHz Qualcomm Oryon
TDP7 Watt30 Watt
Technology5 nm4 nm
FeaturesFastConnect 6900 2x2 Wi-Fi, Adreno 690 GPU
iGPUQualcomm Adreno 690Qualcomm SD X Adreno X1-45 1.7 TFLOPS
NPU / AI15 TOPS INT845 TOPS INT8
ArchitectureARMARM
Announced
Manufacturerwww.qualcomm.comwww.qualcomm.com
Series: Snapdragon X Oryon
Qualcomm Snapdragon X Elite X1E-00-1DE compare3.8 - 4.3 GHz12 / 12 cores6 MB L3 Oryon
Qualcomm Snapdragon X Elite X1E-84-100 compare3.8 - 4.2 GHz12 / 12 cores6 MB L3 Oryon
Qualcomm Snapdragon X Elite X1E-80-100 compare - 4 GHz12 / 12 cores6 MB L3 Oryon
Qualcomm Snapdragon X Elite X1E-78-100 compare - 3.4 GHz12 / 12 cores6 MB L3 Oryon
Qualcomm Snapdragon X Plus X1P-64-100 compare - 3.4 GHz10 / 10 cores6 MB L3 Oryon
Qualcomm Snapdragon X Plus X1P-46-100 « - 4 GHz8 / 8 cores6 MB L3 Oryon
Qualcomm Snapdragon X Plus X1P-42-100 compare - 3.4 GHz8 / 8 cores6 MB L3 Oryon
Qualcomm Snapdragon X X1-26-100 compare - 2.98 GHz8 / 8 cores6 MB L3 Oryon

Benchmarks

Performance Rating - CB R15 + R20 + 7-Zip + X265 + Blender + 3DM11 CPU - SD 8cx Gen 3
22.5 pt (37%)
Restrict / Search: Model: Max. age: years
Cinebench R23 - Cinebench R23 Multi Core
min: 3534     avg: 3603     median: 3567 (3%)     max: 3709 Points
Cinebench R23 - Cinebench R23 Single Core
min: 559     avg: 588     median: 598 (24%)     max: 608 Points
Cinebench R20 - Cinebench R20 CPU (Single Core)
min: 199     avg: 208.7     median: 205 (22%)     max: 222 Points
Cinebench R20 - Cinebench R20 CPU (Multi Core)
min: 810     avg: 1105     median: 1248 (3%)     max: 1258 Points
Cinebench R15 - Cinebench R15 CPU Multi 64 Bit
min: 723     avg: 749     median: 748.5 (5%)     max: 774 Points
Cinebench R15 - Cinebench R15 CPU Single 64 Bit
min: 119     avg: 119.1     median: 119.1 (33%)     max: 119.1 Points
Cinebench R11.5 - Cinebench R11.5 CPU Multi 64 Bit
9.2 Points (12%)
Cinebench R11.5 - Cinebench R11.5 CPU Single 64 Bit
1.4 Points (33%)
Cinebench R10 - Cinebench R10 Rend. Single (32bit)
2481 Points (15%)
Cinebench R10 - Cinebench R10 Rend. Multi (32bit)
13940 Points (10%)
wPrime 2.10 - wPrime 2.0 1024m *
305.3 s (4%)
wPrime 2.10 - wPrime 2.0 32m *
8.7 s (2%)
WinRAR - WinRAR 4.0
4046 Points (6%)
7-Zip 18.03 - 7-Zip 18.03 Multi Thread 4 runs
min: 16223     avg: 21572     median: 23989 (14%)     max: 24505 MIPS
7-Zip 18.03 - 7-Zip 18.03 Single Thread 4 runs
min: 3874     avg: 3912     median: 3915 (46%)     max: 3946 MIPS
X264 HD Benchmark 4.0 - x264 Pass 2
33.2 fps (1%)
X264 HD Benchmark 4.0 - x264 Pass 1
146.9 fps (4%)
HWBOT x265 Benchmark v2.2 - HWBOT x265 4k Preset
min: 1.5     avg: 2.2     median: 2.5 (4%)     max: 2.68 fps
Blender - Blender 3.3 Classroom CPU *
min: 1153     avg: 1626     median: 1625.5 (21%)     max: 2098 Seconds
Blender - Blender 2.79 BMW27 CPU *
min: 1059     avg: 1246     median: 1080 (8%)     max: 1600 Seconds
R Benchmark 2.5 - R Benchmark 2.5 *
min: 1.011     avg: 1     median: 1 (22%)     max: 1.013 sec
3DMark 06 - CPU - 3DMark 06 - CPU
3876 Points (8%)
Super Pi mod 1.5 XS 1M - Super Pi mod 1.5 XS 1M *
17.5 s (4%)
Super Pi mod 1.5 XS 2M - Super Pi mod 1.5 XS 2M *
37.4 s (2%)
Super Pi Mod 1.5 XS 32M - Super Pi mod 1.5 XS 32M *
848 s (4%)
3DMark 11 - 3DM11 Performance Physics
min: 7084     avg: 7306     median: 7333 (18%)     max: 7500 Points
3DMark - 3DMark Ice Storm Physics
18857 Points (15%)
3DMark - 3DMark Cloud Gate Physics
min: 2899     avg: 4704     median: 4704 (12%)     max: 6509 Points
3DMark - 3DMark Fire Strike Standard Physics
min: 9533     avg: 9637     median: 9637 (17%)     max: 9741 Points
3DMark - 3DMark Time Spy CPU
2939 Points (12%)
Geekbench 6.5 - Geekbench 6.5 Single-Core
1592 Points (37%)
Geekbench 6.5 - Geekbench 6.5 Multi-Core
6248 Points (24%)
Geekbench 5.5 - Geekbench 5.1 - 5.5 64 Bit Single-Core
min: 1486     avg: 1588     median: 1588 (53%)     max: 1690 Points
Geekbench 5.5 - Geekbench 5.1 - 5.5 64 Bit Multi-Core
min: 4457     avg: 5990     median: 5989.5 (11%)     max: 7522 Points
Geekbench 5.0 - Geekbench 5.0 64 Bit Single-Core
min: 663     avg: 665     median: 665 (3%)     max: 667 Points
Geekbench 5.0 - Geekbench 5.0 64 Bit Multi-Core
min: 3749     avg: 3797     median: 3796.5 (12%)     max: 3844 Points
Geekbench 4.4 - Geekbench 4.1 - 4.4 64 Bit Single-Core
3460 Points (35%)
Geekbench 4.4 - Geekbench 4.1 - 4.4 64 Bit Multi-Core
15240 Points (15%)
Mozilla Kraken 1.1 - Kraken 1.1 Total Score *
min: 1913     avg: 1925     median: 1915 (2%)     max: 1946 ms
Octane V2 - Octane V2 Total Score
49893 Points (33%)
WebXPRT 4 - WebXPRT 4 Score
min: 64.2     avg: 66.2     median: 67.2 (18%)     max: 67.2 Points
WebXPRT 3 - WebXPRT 3 Score
min: 84.7     avg: 90.5     median: 90.5 (16%)     max: 96.2 Points
CrossMark - CrossMark Overall
min: 627     avg: 673     median: 672.5 (25%)     max: 718 Points
Power Consumption - Prime95 Power Consumption - external Monitor *
min: 26.9     avg: 33.5     median: 35.7 (6%)     max: 37.9 Watt
Power Consumption - Cinebench R15 Multi Power Consumption - external Monitor *
min: 32.7     avg: 33     median: 33 (6%)     max: 33.2 Watt
Power Consumption - Idle Power Consumption - external Monitor *
min: 3.21     avg: 3.4     median: 3.2 (2%)     max: 3.6 Watt
Power Consumption - Idle Power Consumption 150cd 1min *
min: 3.5     avg: 3.7     median: 3.7 (4%)     max: 3.9 Watt
Power Consumption - Power Efficiency - Cinebench R15 Multi external Monitor
min: 22.1     avg: 22.7     median: 22.7 (17%)     max: 23.3 Points per Watt

Average Benchmarks Qualcomm Snapdragon 8cx Gen 3 → 0% n=0

- Range of benchmark values for this graphics card
red legend - Average benchmark values for this graphics card
* Smaller numbers mean a higher performance
1 This benchmark is not used for the average calculation

Add one or more devices and compare

In the following list you can select (and also search for) devices that should be added to the comparison. You can select more than one device.

restrict list:
v1.34
log 28. 00:50:06

#0 ran 0s before starting gpusingle class +0s ... 0s

#1 checking url part for id 14600 +0s ... 0s

#2 checking url part for id 18002 +0s ... 0s

#3 redirected to Ajax server, took 1761609006s time from redirect:0 +0s ... 0s

#4 did not recreate cache, as it is less than 5 days old! Created at Mon, 27 Oct 2025 17:54:47 +0100 +0s ... 0s

#5 composed specs +0.006s ... 0.006s

#6 did output specs +0s ... 0.006s

#7 getting avg benchmarks for device 14600 +0.004s ... 0.01s

#8 got single benchmarks 14600 +0.006s ... 0.017s

#9 getting avg benchmarks for device 18002 +0.001s ... 0.017s

#10 got single benchmarks 18002 +0s ... 0.017s

#11 got avg benchmarks for devices +0s ... 0.017s

#12 min, max, avg, median took s +0.02s ... 0.037s

#13 return log +0.001s ... 0.038s

Please share our article, every link counts!
Mail Logo
> Expert Reviews and News on Laptops, Smartphones and Tech Innovations > Benchmarks / Tech > Processor Comparison - Head 2 Head
Redaktion, 2017-09- 8 (Update: 2023-07- 1)