Notebookcheck Logo

Qualcomm Snapdragon 460 vs Mediatek Helio G25 vs Mediatek Helio G37

Qualcomm Snapdragon 460

► remove from comparison Qualcomm SD 460

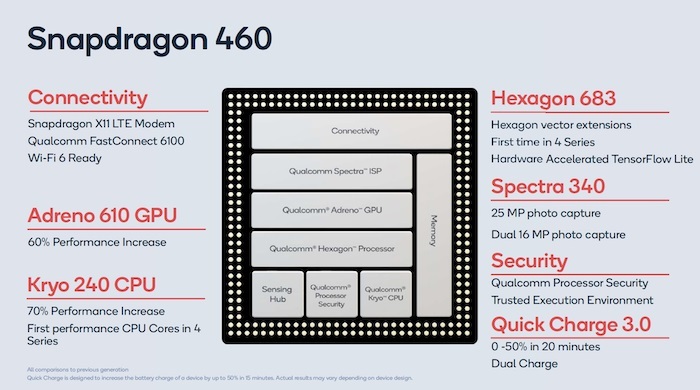
The Qualcomm Snapdragon 460 (SM4250) is a lower mainstream SoC for (Android based) smartphones and tablets. It features eight cores in two clusters. A performance cluster with four ARM Cortex A73 cores and a efficiency cluster with four small ARM Cortex A53 cores. All cores can reach up to 1.8 GHz.

The integrated Qualcomm X11 LTE modem can reach Cat. 13 (400 Mbps max) download and Cat. 12 (150 Mbps max.) upload speeds. The SoC also integrates WiFi 6, however only MIMO 1x1 and therefore the top speed is not very good.

The SD460 is manufactured in the modern 11nm process and should be very energy efficient.

Mediatek Helio G25

► remove from comparison Mediatek Helio G25

The Mediatek Helio G25 is an entry level ARM SoC for smartphones (mainly Android based) that was introduced in late 2020. It is manufactured in a 12 nm FinFET process and is equipped with 8 ARM Cortex-A53 CPU cores divided in two clusters. A performance cluster with 4 cores clocked at up to 2 GHz and a efficiency cluster clocked at up to 1.5 GHz. Compared to the similar Helio A25, the G25 clocks the GPU (+50 MHz) and the CPU cores higher (+200 MHz).

Furthermore, the SoC integrates a LTE Cat.4 modem, a LPDDR3-933 / LPDDR4-1200 / LPDDR4x-1600 memory controller, a IMG PowerVR GE8320 graphics card and a 1080p30 video de- and encoder (H.265 decoding, H.264 encoding).

Mediatek Helio G37

► remove from comparison Mediatek Helio G37

The Mediatek Helio G37 is an entry level ARM SoC for smartphones (mainly Android based) that was introduced in late 2020. It is manufactured in a 12 nm FinFET process and is equipped with 8 ARM Cortex-A53 CPU cores clocked at up to 2.3 GHz. They are divided in two clusters, with the four efficiency cores only clock up to 1.8 GHz. Compared to the similar Helio G35, the G37 offers support for 90 Hz displays and 8 GB RAM.

The performance of the G37 is positioned in the entry level and especially the single core performance is very slow due to the small A53 cores and no big performance cores.

Furthermore, the SoC integrates a LTE Cat.4 modem, a Wi-Fi 5 / Bluetooth 5.0 modem, a LPDDR3-933 / LPDDR4-1200 / LPDDR4x-1600 memory controller, a IMG PowerVR GE8320 graphics card, and a 1080p30 video de- and encoder (H.265 decoding, H.264 encoding).

The G37 is produced in 12nm FinFET.

ModelQualcomm Snapdragon 460Mediatek Helio G25Mediatek Helio G37
CodenameCortex-A73 / 53Cortex-A53Cortex-A53
SeriesQualcomm SnapdragonMediatek Mediatek Helio GMediatek Mediatek Helio G
Clock1800 MHz2000 MHz1800 - 2300 MHz
Cores / Threads8 / 88 / 88 / 8
Technology14 nm12 nm12 nm
FeaturesAdreno 510 GPU, X11 LTE Modem (Cat 13 / 12)UMTS/HSPA+, LTE Cat. 4, LPDDR3-933 / LPDDR4-1200 / LPDDR4x-1600 Memory Controller, 1080p30 H.264 Video Encoder, H.264 / H.265 1080p30 DecoderUMTS/HSPA+, LTE Cat. 4, Cat-7 DL / Cat-13 UL, LPDDR3-933 / LPDDR4-1200 / LPDDR4x-1600 Memory Controller, 1080p30 H.264 Video Encoder, H.264 / H.265 1080p30 Decoder
iGPUQualcomm Adreno 610PowerVR GE8320 ( - 650 MHz)PowerVR GE8320 ( - 680 MHz)
ArchitectureARMARMARM
Announced
Manufacturerwww.qualcomm.comwww.mediatek.comwww.mediatek.com
Series: Mediatek Helio G Cortex-A53
Mediatek Helio G371.8 - 2.3 GHz8 / 8 cores Cortex-A53
Mediatek Helio G352.3 GHz8 / 8 cores Cortex-A53
Mediatek Helio G362.2 GHz8 / 8 cores Cortex-A53
Mediatek Helio G25 « 2 GHz8 / 8 cores Cortex-A53
Mediatek Helio G37 « 1.8 - 2.3 GHz8 / 8 cores Cortex-A53
Mediatek Helio G352.3 GHz8 / 8 cores Cortex-A53
Mediatek Helio G362.2 GHz8 / 8 cores Cortex-A53
Mediatek Helio G252 GHz8 / 8 cores Cortex-A53

Benchmarks

Performance Rating - Geekbench 5.5, PCM Work, Sling Shot Physics, Antutu v8 CPU - SD 460
0.4 pt (32%)
Restrict / Search: Model: Max. age: years
Performance Rating - Geekbench 5.5, PCM Work, Sling Shot Physics, Antutu v8 CPU - Helio G25
0.2 pt (18%)
Restrict / Search: Model: Max. age: years
3DMark - 3DMark Ice Storm Unlimited Physics
100%
1 SD 460 +
min: 15499     avg: 16510     median: 16068 (13%)     max: 17962 Points
min: 11896     avg: 13006     median: 12213.5 (10%)     max: 15702 Points
3DMark - 3DMark Sling Shot Extreme (ES 3.1) Unlimited Physics
min: 1953     avg: 2117     median: 2166 (20%)     max: 2190 Points
min: 1211     avg: 1264     median: 1283 (12%)     max: 1298 Points
3DMark - 3DMark Sling Shot (ES 3.0) Unlimited Physics
min: 1963     avg: 2083     median: 2109 (24%)     max: 2152 Points
min: 1173     avg: 1241     median: 1257 (14%)     max: 1292 Points
Geekbench 6.5 - Geekbench 6.5 Single-Core
193 Points (4%)
Geekbench 6.5 - Geekbench 6.5 Multi-Core
845 Points (3%)
Geekbench 5.5 - Geekbench 5.1 - 5.5 64 Bit Single-Core
min: 246     avg: 251.4     median: 254 (9%)     max: 256 Points
min: 146     avg: 160     median: 161 (5%)     max: 172 Points
Geekbench 5.5 - Geekbench 5.1 - 5.5 64 Bit Multi-Core
min: 1135     avg: 1176     median: 1155 (2%)     max: 1270 Points
min: 553     avg: 728     median: 706 (1%)     max: 947 Points
Geekbench 4.4 - Geekbench 4.1 - 4.4 64 Bit Single-Core
min: 1277     avg: 1291     median: 1290.5 (13%)     max: 1304 Points
711 Points (7%)
800 Points (8%)
Geekbench 4.4 - Geekbench 4.1 - 4.4 64 Bit Multi-Core
min: 4770     avg: 4970     median: 4970 (5%)     max: 5170 Points
3574 Points (4%)
3716 Points (4%)
Geekbench 4.0 - Geekbench 4.0 64 Bit Single-Core
100%
1 SD 460 +
1340 Points (15%)
Geekbench 4.0 - Geekbench 4.0 64 Bit Multi-Core
100%
1 SD 460 +
4626 Points (6%)
Geekbench 3 - Geekbench 3 64 Bit Multi-Core
100%
1 SD 460 +
5155 Points (8%)
Geekbench 3 - Geekbench 3 64 Bit Single-Core
100%
1 SD 460 +
1277 Points (19%)
Geekbench 2 - 32 Bit - Geekbench Stream
100%
1 SD 460 +
1938 Points (10%)
543 Points (3%)
Geekbench 2 - 32 Bit - Geekbench Memory
100%
1 SD 460 +
1784 Points (12%)
1132 Points (8%)
Geekbench 2 - 32 Bit - Geekbench Floating Point
100%
1 SD 460 +
9270 Points (18%)
5643 Points (11%)
Geekbench 2 - 32 Bit - Geekbench Integer
100%
1 SD 460 +
4505 Points (9%)
3076 Points (6%)
Geekbench 2 - 32 Bit - Geekbench Total Score
100%
1 SD 460 +
5371 Points (14%)
3256 Points (9%)
Mozilla Kraken 1.1 - Kraken 1.1 Total Score *
min: 5433     avg: 6178     median: 5532.5 (6%)     max: 8215 ms
min: 12437     avg: 12740     median: 12740 (15%)     max: 13043 ms
9051 ms (11%)
Sunspider - Sunspider 1.0 Total Score *
100%
1 SD 460 +
1219 ms (13%)
Octane V2 - Octane V2 Total Score
min: 4832     avg: 6708     median: 7240.5 (5%)     max: 7517 Points
min: 3965     avg: 3974     median: 3974 (3%)     max: 3983 Points
min: 5648     avg: 6000     median: 6000 (4%)     max: 6352 Points
WebXPRT 3 - WebXPRT 3 Score
min: 31     avg: 40     median: 42.5 (8%)     max: 44 Points
24 Points (4%)
37 Points (7%)
AnTuTu v8 - AnTuTu v8 UX
min: 25755     avg: 34228     median: 35535 (30%)     max: 40087 Points
min: 20014     avg: 21818     median: 21818 (18%)     max: 23622 Points
23028 Points (19%)
AnTuTu v8 - AnTuTu v8 MEM
min: 29373     avg: 33246     median: 29470 (24%)     max: 44671 Points
min: 15077     avg: 18158     median: 18157.5 (15%)     max: 21238 Points
25210 Points (20%)
AnTuTu v8 - AnTuTu v8 GPU
min: 18941     avg: 21283     median: 21129.5 (4%)     max: 23931 Points
min: 12344     avg: 12390     median: 12389.5 (2%)     max: 12435 Points
15006 Points (3%)
AnTuTu v8 - AnTuTu v8 CPU
min: 56737     avg: 58369     median: 57626 (21%)     max: 61488 Points
min: 36740     avg: 37077     median: 37077 (13%)     max: 37414 Points
38092 Points (14%)
AnTuTu v8 - AnTuTu v8 Total Score
min: 143097     avg: 147126     median: 145284 (14%)     max: 154839 Points
min: 84175     avg: 89392     median: 89392 (9%)     max: 94609 Points
101336 Points (10%)
Antutu v9 - AnTuTu v9 Total Score
100%
1 SD 460 +
148855 Points (7%)
111952 Points (5%)
Antutu v9 - AnTuTu v9 CPU
100%
1 SD 460 +
54407 Points (14%)
32647 Points (8%)
PassMark PerformanceTest Mobile V1 - PerformanceTest Mobile V1 CPU Tests
100%
1 SD 460 +
13985 Points (2%)
PCMark for Android - PCM f. Android Computer Vision
100%
1 SD 460 +
3013 Points (16%)
min: 1443     avg: 1471     median: 1471 (8%)     max: 1499 Points
PCMark for Android - PCM f. Android Storage
100%
1 SD 460 +
10129 Points (22%)
min: 5394     avg: 5797     median: 5796.5 (12%)     max: 6199 Points
PCMark for Android - PCM f. Android Work Score 2.0
100%
1 SD 460 +
min: 5316     avg: 5633     median: 5669 (37%)     max: 5869 Points
min: 4938     avg: 5162     median: 5246 (34%)     max: 5296 Points
PCMark for Android - PCM f. Android Work Score
100%
1 SD 460 +
min: 7036     avg: 7416     median: 7526 (38%)     max: 7779 Points
min: 6083     avg: 6471     median: 6322 (32%)     max: 7009 Points
PCMark for Android - PCM f. Android Work Score 3.0
min: 5329     avg: 5367     median: 5367 (19%)     max: 5405 Points
min: 4922     avg: 5435     median: 5502 (19%)     max: 5815 Points
PCMark for Android - PCM f. Android Storage 2.0 score
6065 Points (3%)
CrossMark - CrossMark Overall
232 Points (9%)
Power Consumption - Geekbench 5.5 Power Consumption 150cd *
2.9 Watt (1%)
Power Consumption - Idle Power Consumption 150cd 1min *
0.8 Watt (1%)

Average Benchmarks Qualcomm Snapdragon 460 → 100% n=14

Average Benchmarks Mediatek Helio G25 → 57% n=14

Average Benchmarks Mediatek Helio G37 → 69% n=14

- Range of benchmark values for this graphics card
red legend - Average benchmark values for this graphics card
* Smaller numbers mean a higher performance
1 This benchmark is not used for the average calculation

v1.34
log 31. 11:22:25

#0 ran 0s before starting gpusingle class +0s ... 0s

#1 checking url part for id 12991 +0s ... 0s

#2 checking url part for id 12926 +0s ... 0s

#3 checking url part for id 14388 +0s ... 0s

#4 redirected to Ajax server, took 1761906145s time from redirect:0 +0s ... 0s

#5 did not recreate cache, as it is less than 5 days old! Created at Fri, 31 Oct 2025 05:18:25 +0100 +0s ... 0s

#6 composed specs +0.005s ... 0.006s

#7 did output specs +0s ... 0.006s

#8 getting avg benchmarks for device 12991 +0.003s ... 0.009s

#9 got single benchmarks 12991 +0.007s ... 0.016s

#10 getting avg benchmarks for device 12926 +0.002s ... 0.018s

#11 got single benchmarks 12926 +0.009s ... 0.027s

#12 getting avg benchmarks for device 14388 +0.001s ... 0.028s

#13 got single benchmarks 14388 +0.006s ... 0.034s

#14 got avg benchmarks for devices +0s ... 0.034s

#15 min, max, avg, median took s +0.031s ... 0.065s

#16 return log +0s ... 0.065s

Please share our article, every link counts!
Mail Logo
> Expert Reviews and News on Laptops, Smartphones and Tech Innovations > Benchmarks / Tech > Processor Comparison - Head 2 Head
Redaktion, 2017-09- 8 (Update: 2023-07- 1)