Review Intel Sandy Bridge (Core i7) Update

With "Sandy Bridge", Intel brought an extremely popular CPU architecture to the people. The dual or quad core processors did not only stand out with high performance, but also with good efficiency and various features. To bridge the waiting time for the successor generation "Ivy Bridge", expected in 2012, Intel has – despite its dominance over AMD – released four new Core i7 CPUs. We would like to primarily deal with their performance in the following review.
The Test System
In order to make this review possible, the German company Schenker (mysn.de) provided us with the gaming machine XMG P701 PRO. The 17 inch notebook is based on the nearly 4 kilogram heavy P170HM Clevo barebone that is also sold by Hawkforce and DevilTech besides Schenker.
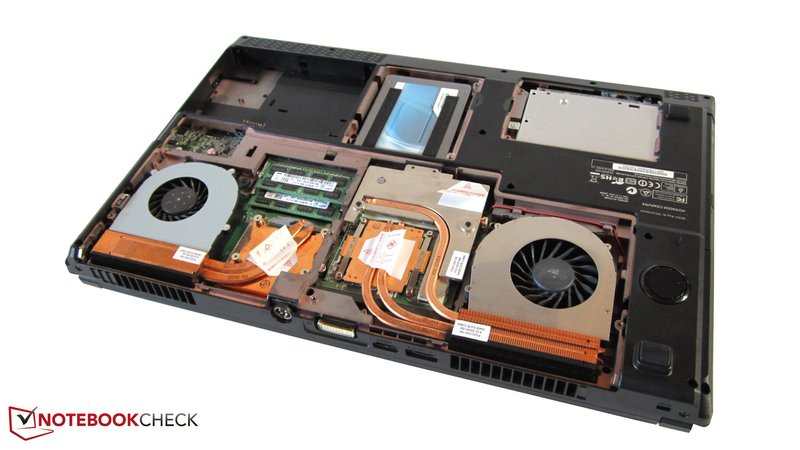
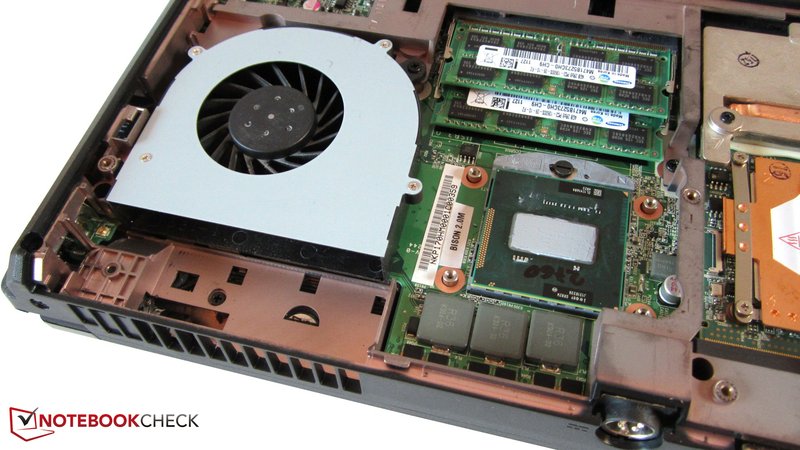
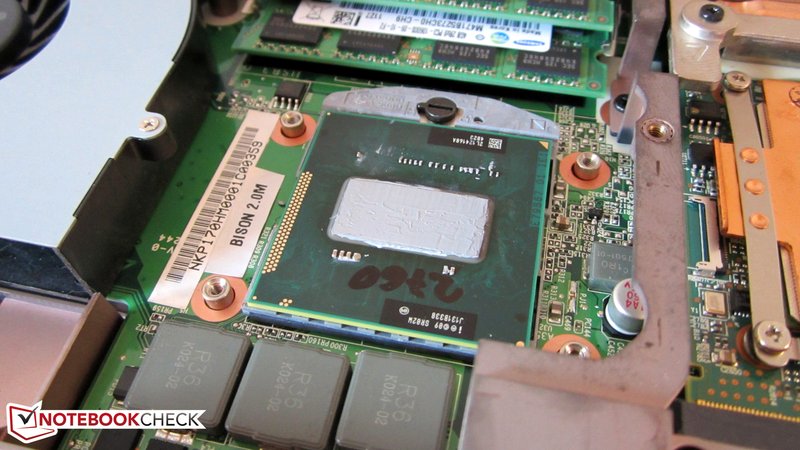
Our test device's configuration proved to be more than lavish. In addition to AMD's high-end graphics card, Radeon HD 6990M, a total of 16 GB of DDR3 RAM was built in. Windows 7 Home Premium 64 bit does its job on a 128 GB SSD hard disk (Crucial RealSSD M4). The bundle was completed by Samsung's Spinpoint M8 HDD with a capacity of 1000 GBs. Replacing the processor proved to be very easy – like in most Clevo barebones: remove the bottom cover, unscrew the CPU cooler and the user has reached his goal.
Test configuration:
- Windows 7 Home Premium 64 bit
- Intel HM67 chipset
- Intel Core i7 Sandy Bridge CPU
- AMD Radeon HD 6990M high-end GPU
- 17.3" Full HD LED display (glare)
- 16 GB DDR3-RAM (1333MHz)
- Crucial RealSSD M4 CT128M4SSD2 (128 GB)
- Samsung Spinpoint M8 HN-M101MBB (1000 GB, 5400 rpm)
- Price: depends on the configuration; at least 1149€
Overview
Since we've already taken a closer look at the Sandy Bridge generation (see review), we won't go into details about the core architecture and will get down to business right away.
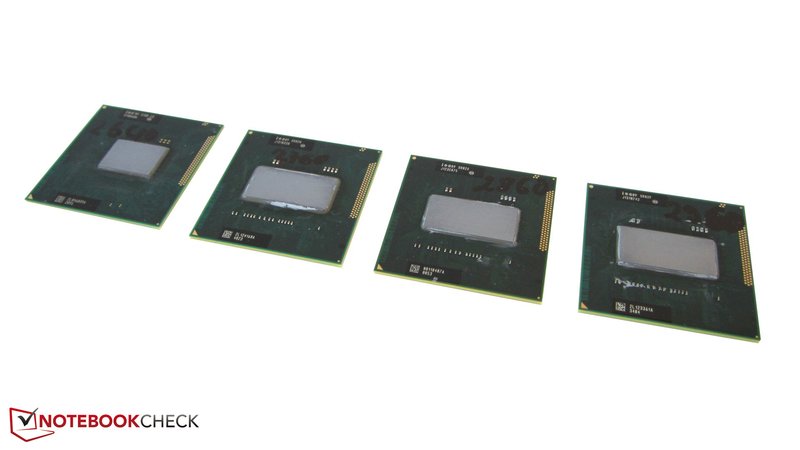
Intel presents three new quad core models that each differ from their older family members by a 200 MHz higher clock. It starts with the former top model, Core i7-2920XM (2.5 – 3.5 GHz) that is heir to the 2.7 – 3.7 GHz swift and also wickedly expensive Core i7-2960XM. The 2.5 – 3.6 GHz clocked Core i7-2860QM follows and replaces the rather infrequently installed Core i7-2820QM (2.3 – 3.4 GHz). The 2.4 – 3.5 GHz successor of the Core i7-2720QM (2.2 – 3.3 GHz), which has been called Core i7-2760QM, is more interesting in terms of price.
However, Intel hasn't touched the L3 cache (eight MBs in the 2900 & 2800 series, six MBs in the 2700 range). The manufacturing process (32 nm) and the embedded HD Graphics 3000 chip's clock (650 – 1300 MHz) also correspond to that of its slower siblings. The thermal design power is 55, respectively 45 watts like in the past (see chart). Intel's most inexpensive and very popular among manufacturers quad Core i7-2630QM (2.0 – 2.9 GHz) is rumored to soon get competition in the way of a Core i7-2670QM (2.2 – 3.1 GHz).

Apart from that, Intel also has the Core i7-2640M in its range. It is the now strongest mobile dual core processor with a clock of 2.8 – 3.5 GHz. The L3 cache "only" has four rather than six or eight MBs, but the TDP of 35 watts is significantly lower in this case. The until now fastest dual core called Core i7-2620M (2.7 – 3.4 GHz) has to step down from its top position, like it or not. It's too bad that Intel (still) leaves its attractive Core i5 range untouched.
| Bezeichnung | Kerne | Basistakt | max. Turbo | L3-Cache | TDP | GPU-Takt | Preis / 1000 Einheiten |
|---|---|---|---|---|---|---|---|
| Quad-Core | |||||||
| Core i7-2960XM | 4/8 | 2.7 GHz | 3.7 GHz | 8MB | 55W | 650-1300MHz | $1096 |
| Core i7-2860QM | 4/8 | 2.5 GHz | 3.6 GHz | 8MB | 45W | 650-1300MHz | $568 |
| Core i7-2760QM | 4/8 | 2.4 GHz | 3.5 GHz | 6MB | 45W | 650-1300MHz | $378 |
| Dual-Core | |||||||
| Core i7-2640M | 2/4 | 2.8 GHz | 3.5 GHz | 4MB | 35W | 650-1300MHz | $346 |
Benchmarks
Before we take a closer look at the benchmarks, we would like to note one thing first. Because Intel's Turbo Boost Technology behaves differently depending on the cooling system (automatic processor overclocking), our CPU results do not inevitably have to be in line with other devices.
Cinebench R10 Single
As the name already indicates, only one CPU core is loaded in Cinebench R10's single core rendering (64 bit). So, quad cores can't play on their superior number of cores and it is only the clock that counts. Thanks to its high maximum clock of 3.7 GHz, it's not much of a surprise that the Core i7-2960 GHz places itself at the top. 6184 points are 16% higher than the score of the old title holder, Core i7-2920XM (5343 points @Schenker XMG P501). In contrast to the other benchmarks, the new dual core reference fares well. With 5642 points the Core i7-2640M sprints past the i7-2760QM (5471 points). In the meantime, the Core i7-2860QM shows an equal performance with 5639 points.
| Cinebench R10 - Rendering Single CPUs 64Bit (sort by value) | |
| Schenker XMG P701 PRO | |
| Schenker XMG P701 PRO | |
| Schenker XMG P701 PRO | |
| Schenker XMG P701 PRO | |
| Schenker XMG P501 | |
| Lenovo ThinkPad W520 | |
| Schenker XMG P501 PRO | |
| MSI GT780R | |
| Dell Latitude E6520 i7/FHD | |
Cinebench R10 Multi
As anticipated, the situation changes in multi core rendering (64 bit). Due to its lower core count, the Core i7-2640M clearly loses ground. While the dual core has to be satisfied with 11936 points, the Core i7-2960XM manages almost twice as much with 22311 points. The Core i7-2860QM (20290 points) and i7-2760QM (19747 points) follow by 9%, respectively 11%. The popular Core i7-2630QM looks rather more like an old hat in a direct comparison. The new quad core models can only smile wearily at 16876 points (MSI GT780R). However, the Core i7-2630QM always wins against its dual core brother.
| Cinebench R10 - Rendering Multiple CPUs 64Bit (sort by value) | |
| Schenker XMG P701 PRO | |
| Schenker XMG P701 PRO | |
| Schenker XMG P701 PRO | |
| Schenker XMG P701 PRO | |
| Schenker XMG P501 | |
| Lenovo ThinkPad W520 | |
| Eurocom Racer | |
| MSI GT780R | |
| Dell Latitude E6520 i7/FHD | |
Cinebench R11.5
The latest Cinebench R11.5 (64 bit) should of course not be left out in a CPU test. Like in Cinebench R10's multi core rendering, the quad cores clearly take the lead. The Core i7-2760QM places itself right between the older models, 2820QM (5.57 points @ Lenovo ThinkPad W520) and 2920XM (5.7 points @ Schenker XMG P501) with 5.63 points. The Core i7-2860QM snatches itself the second place with 5.84 points in the meantime. The Core i7-2960XM again fetches itself the top rank with an outstanding 6.33 points. The brand new dual core superior, i7-2640M doesn't stand the slightest chance – 3.17 points equal a minus of 50%. In comparison: The preceding Core i7-2620M only managed an insignificantly lower score of 3.08 points in the review of the Dell Latitude E6520.
| Cinebench R11.5 - CPU Multi 64Bit (sort by value) | |
| Schenker XMG P701 PRO | |
| Schenker XMG P701 PRO | |
| Schenker XMG P701 PRO | |
| Schenker XMG P701 PRO | |
| Schenker XMG P501 | |
| Lenovo ThinkPad W520 | |
| Eurocom Racer | |
| MSI GT780R | |
| Dell Latitude E6520 i7/FHD | |
3DMark Vantage
We tested the two newest 3DMark versions for the gamer community. We'll start with the 3DMark Vantage CPU score that is similar to the performance structure of Cinebench R11.5. While the Core i7-2960XM clearly calls the shots with 23249 points, the Core i7-2860QM settles down to the second place (21417 points). The third place isn't as clear. The Core i7-2760QM is slightly defeated by the Core i7-2920XM (Schenker XMG P501) with 20494 to 20540 points. In light of 20456 points, the Core i7-2820QM (Lenovo ThinkPad W520) also still has a say. The usual image is shown with the dual core: The Core i7-2640M falls behind massively with 10838 points. Even the entry level quad core, i7-2630QM, calculates a lot faster in 3DMark Vantage (17692 points @ MSI GT780R).
| 3DMark Vantage - 1280x1024 P CPU no PhysX (sort by value) | |
| Schenker XMG P701 PRO | |
| Schenker XMG P701 PRO | |
| Schenker XMG P701 PRO | |
| Schenker XMG P701 PRO | |
| Schenker XMG P501 | |
| Lenovo ThinkPad W520 | |
| Eurocom Racer | |
| MSI GT780R | |
| Dell Latitude E6520 i7/FHD | |
3DMark 11
The so-called physics score focuses on in the DirectX 11 based 3DMark 11. To make it short: The processor sequence basically stayed the same. With 7068 points, the Core i7-2760QM didn't quite manage to reach the Core i7-2820QM (7245 points @ Lenovo ThinkPad W520). In return, the Core i7-2720QM lags behind by 3% (6839 @ Eurocom Racer). When the Core i7-2860QM was used, 3DMark 11 recorded a physics score of 7590 points and the Core i7-2960XM even reached 8098 points. Regrettably, we don't have a score from the former leader, i7-2920XM. In the meantime, the less expensive Core i7-2640M can only distance itself marginally from its smaller brother, i7-2620M (Dell Latitude E6520).
| 3DMark 11 - 1280x720 Performance Physics (sort by value) | |
| Schenker XMG P701 PRO | |
| Schenker XMG P701 PRO | |
| Schenker XMG P701 PRO | |
| Schenker XMG P701 PRO | |
| Lenovo ThinkPad W520 | |
| Eurocom Racer | |
| MSI GT780R | |
| Dell Latitude E6520 i7/FHD | |
Power Consumption
Idle
A very frequent question asked in our forum is about the differences in power consumption of various processors. To find an answer we measured both the power consumption in idle mode and during load. The listed rates do not solely apply to the processor, but are rather valid for the entire notebook. Consequently, the difference is especially interesting. The pure wattage in the charts below is only of limited significance. But back to topic: The new CPUs all consume a similar amount of power in idle mode. Thus, the top quad core, i7-2960XM only used 2 watts more on average than the top dual core, i7-2640M – an indication for the good energy saving mechanisms of the Sandy Bridge generation. The Core i7-2860QM and 2760QM were between that in terms of consumption.
| Power consumption | Core i7-2960XM | Core i7-2860QM | Core i7-2760QM | Core i7-2640M |
|---|---|---|---|---|
| Idle minimum | 55.8 watts | 55.7 watts | 53.8 watts | 53.5 watts |
| Idle maximum | 63.9 watts | 63.7 watts | 63.5 watts | 63.3 watts |
Load
Larger deviations showed up during load. For example, the Core i7-2960XM and i7-2640 had a difference of 60 watts when fully loaded by the tool, Prime95. The difference was also considerable in Cinebench R10's multi core rendering with nearly 50 watts. The Core i7-2860QM's and i7-2760QM's consumption sooner goes in the direction of the quad core reference. While they nearly drained 40 watts more out of the outlet than the Core i7-2640M during full load, they consumed about 35 watts more in multi core rendering. The processors again closed the gap in single core rendering. The difference between the strongest and weakest CPU was only 9 watts. Thus, the power consumption first drifts apart noticeably when all cores are loaded.
| Power consumption | Core i7-2960XM | Core i7-2860QM | Core i7-2760QM | Core i7-2640M |
|---|---|---|---|---|
| Cinebench R10 Single (max.) | 89.6 watts | 85.2 watts | 84.8 watts | 80.8 watts |
| Cinebench R10 Multi (max.) | 142.3 watts | 127.9 watts | 126.5 watts | 92.8 watts |
| Prime95 (max.) | 159.7 watts | 139.2 watts | 139.1 watts | 102.7 watts |
Verdict
The new Sandy Bridge processor gave an impressive show in the test. We especially liked the performance of the quad core models. Thanks to the higher clock, the newbies can easily stand out from their older brothers – and that at a reasonable additional cost. The quad cores feel comfortable in every application, regardless of the requirement. The user is well taken care of for years with such a processor. Overall, the quad core mentioned in the test results in the following ranking:
- 1st place: Core i7-2960XM
- 2nd place: Core i7-2860QM
- 3rd place: Core i7-2920XM
- 4th place: Core i7-2760QM
- 5th place: Core i7-2820QM
- 6th place: Core i7-2720QM
- 7th place: Core i7-2630QM
In our opinion, performance-orientated users are well advised with the Core i7-2860QM as the maximum because Intel again bestows the top model with a high price tag. Or to say it differently, the performance gain and surcharge ratio is disproportional. The majority of high-end users will be satisfied with a Core i7-2630QM anyway. If you want to be a proud owner of a strong processor, you should take one of the newer models in any case.
On the other hand, the Core i7-2640M didn't exactly knock off our socks. Of course, the performance is outstanding for a dual core. But the buyer can get a quad core that can boast with having a higher future security for the same price (see benchmarks). Moreover, the advantage is rather low in comparison to the 100 MHz lower clocked Core i7-2620M.
By the way, a processor on a par with the latest Core i5-2410M will suffice the average user.
