Notebookcheck Logo

Apple M3 10-Core GPU vs Apple M1 7-Core GPU vs Apple M3 Max 30-Core GPU

Apple M3 10-Core GPU

► remove from comparison Apple M3 10-Core GPU

The 10-core Apple M3 GPU is an integrated graphics adapter designed by Apple that features 10 cores. This iGPU is built into the Apple M3 SoC and it uses the unified memory architecture (up to 24 GB LPDDR5-6400 with 100 GB/s bandwidth). Compared to M2 series GPUs, this new graphics adapter uses a new architecture with support for mesh shading and ray tracing. Dynamic caching is another new feature worth mentioning - it is coming to optimize shared memory usage.

In our testing, the M3 GPU (10 cores) mostly was 5% to 20% faster than the 10-core M2 GPU depending on the task.

Just like the rest of the Apple M3 chip, the graphics adapter is manufactured on a 3 nm TSMC process (possibly N3B). Our MBP 14 review revealed sustained power consumption figures of around 15 W for the iGPU.

Apple M1 7-Core GPU

► remove from comparison Apple M1 7-Core GPU

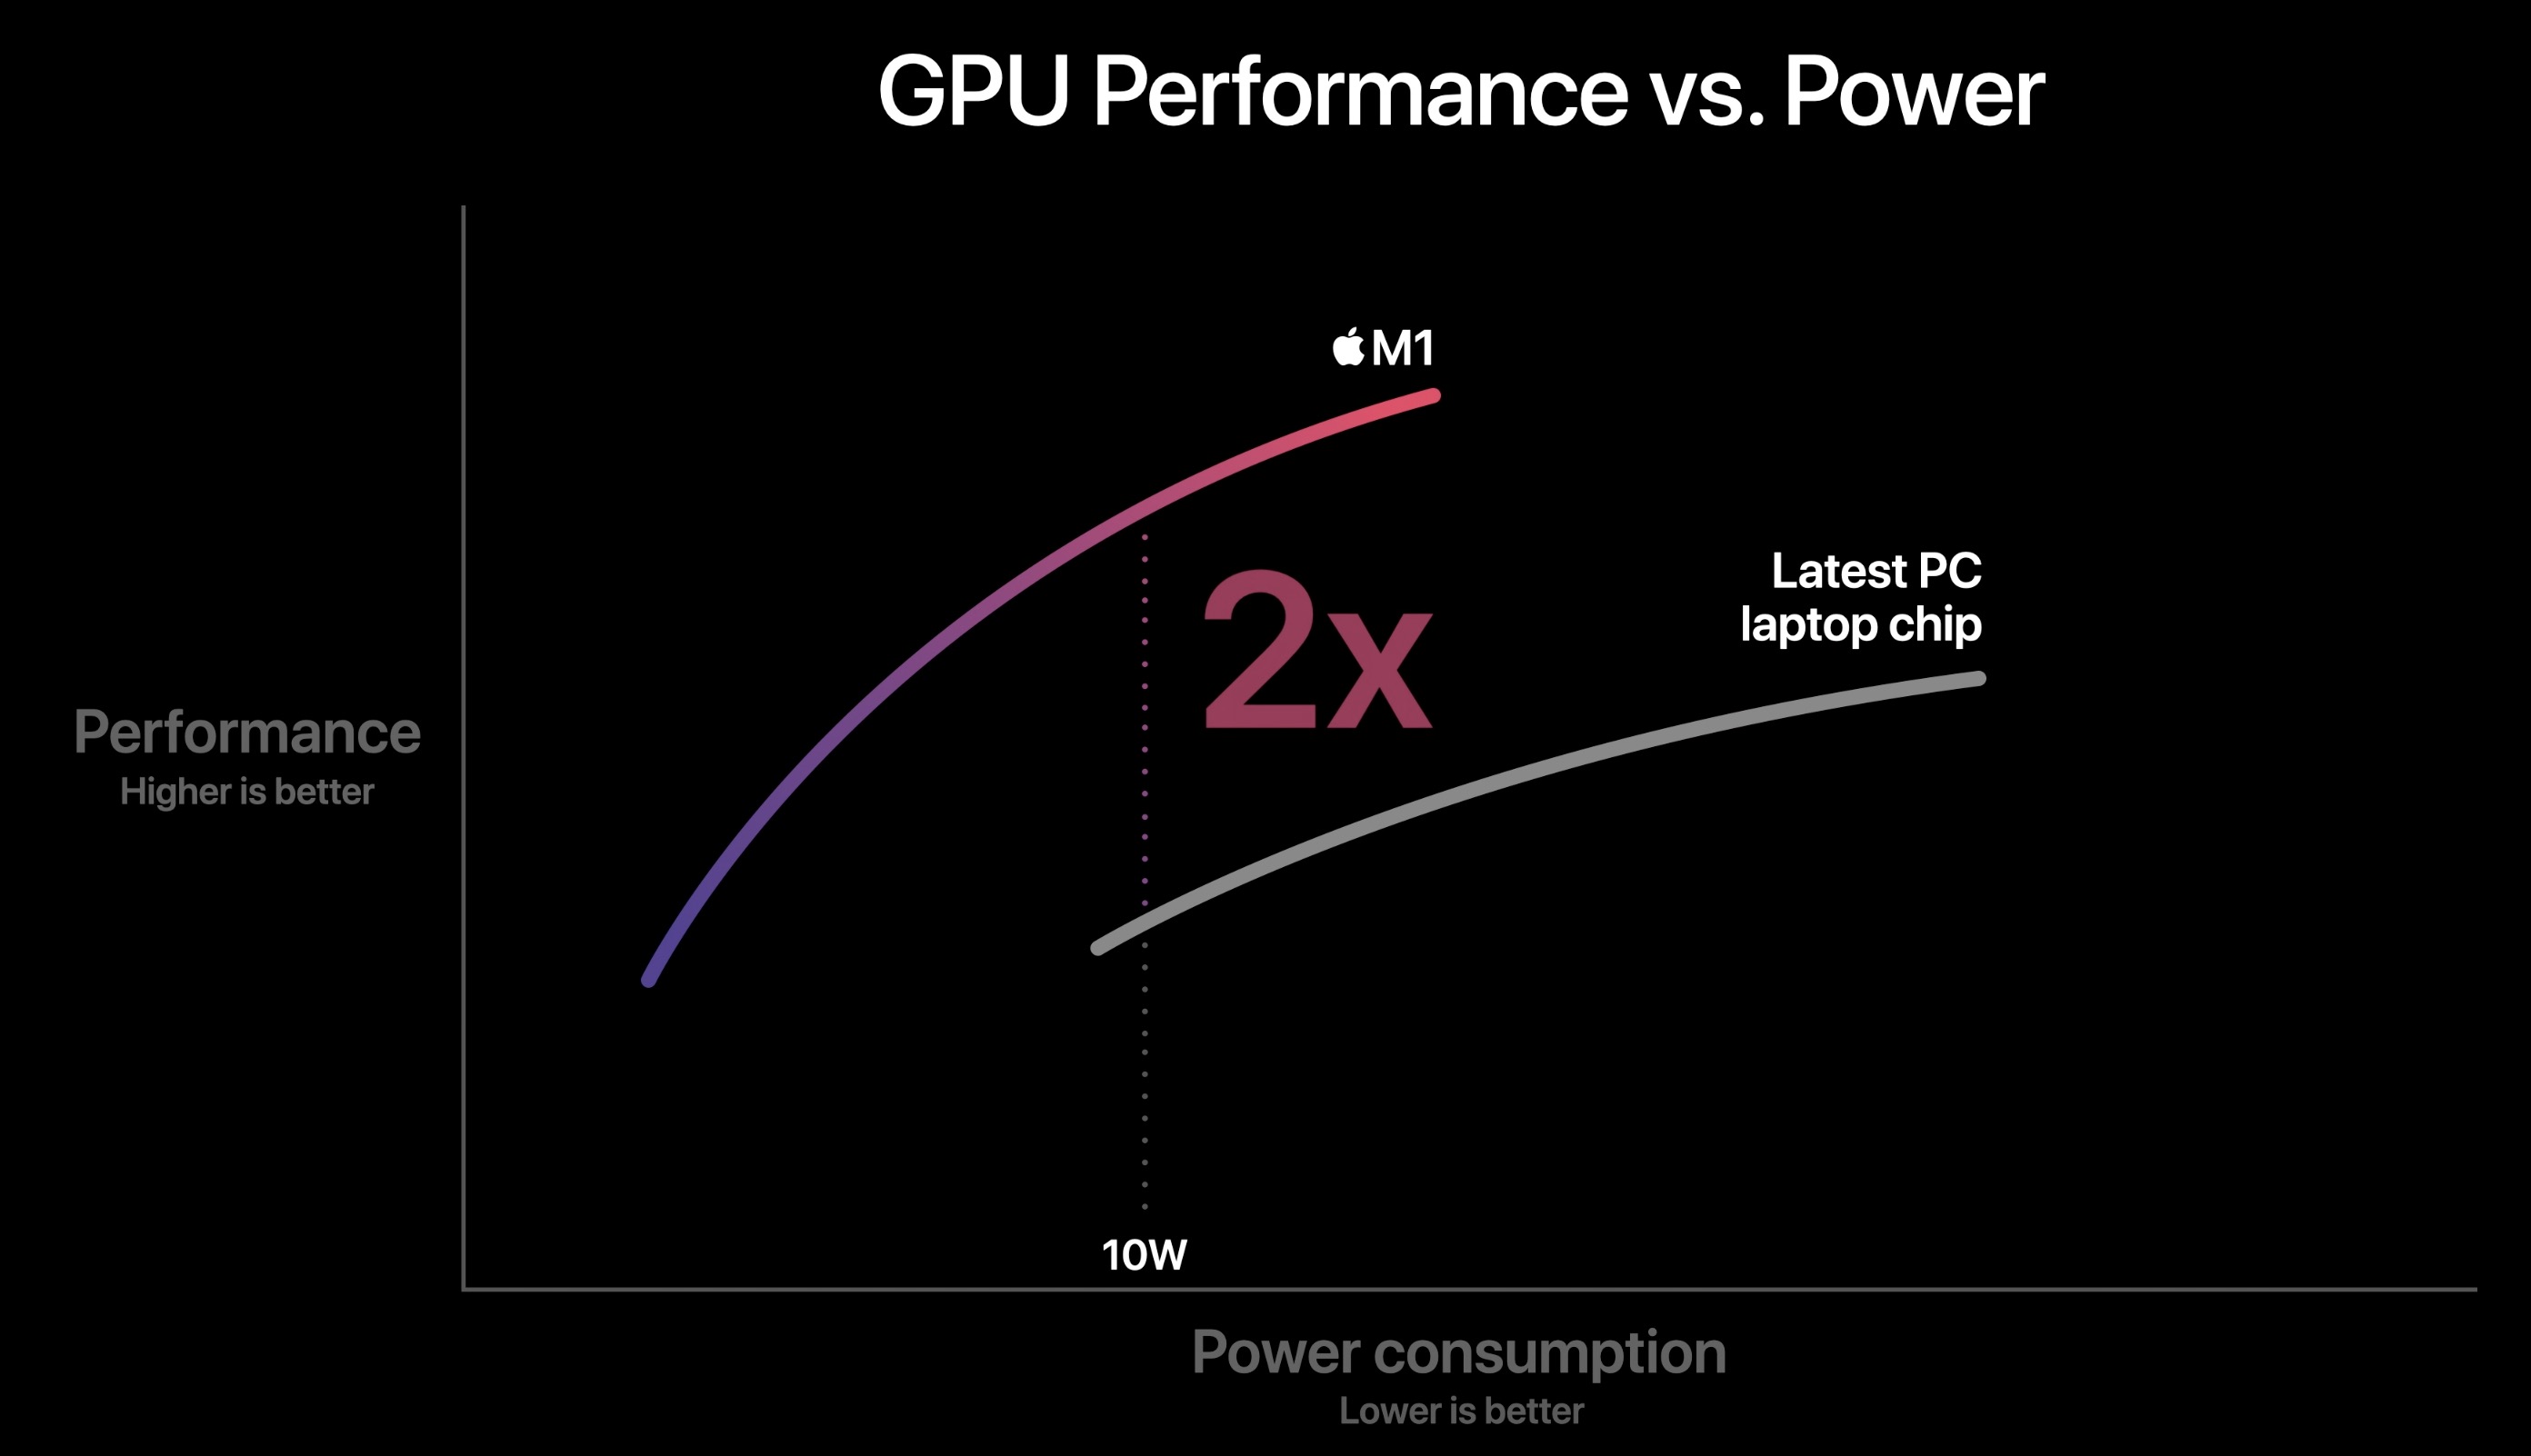
The Apple M1 GPU is an integrated graphics card offering 7 cores (1 deactivated core in the entry MacBook Air) designed by Apple and integrated in the Apple M1 SoC. According to Apple it is faster and more energy efficient as competing products (like the Tiger Lake Xe GPU). The peak performance of the high end variant with 8 cores is 2.6 teraflops, therefore the 7 core version should offer around 2.3 teraflops. Thanks to the unified memory architecture it should have fast access to the RAM.

The Apple M1 is manufactured in the modern 5nm process at TSMC and should offer an excellent energy efficiency.

Apple M3 Max 30-Core GPU

► remove from comparison Apple M3 Max 30-Core GPU

The Apple M3 Max 30-Core GPU is a self-designed graphics card in the Apple M3 SoC and offers 30 of the 40 cores that are included in the chip. According to Apple, the GPU uses a new architecture and now offers dynamic caching, mesh shading and ray tracing acceleration.

The graphics card can access up to 96 GB LPDDR5-6400 unified memory via a 512 bit memory bus (max 400 GBit/s). Thanks to dynamic caching, the GPU only reserves as much memory as is required.

Since the SoC is manufactured in the current 3nm (probably N3B) at TSMC.

Apple M3 10-Core GPUApple M1 7-Core GPUApple M3 Max 30-Core GPU
Apple M3 Series
M3 Max 40-Core GPU 40
M3 Max 30-Core GPU 30
M3 Pro 18-Core GPU 18
M3 Pro 14-Core GPU 14
M3 10-Core GPU 10
M3 9-Core GPU 9
M3 8-Core GPU 8
M1 Max 32-Core GPU 32 @ 1.3 GHz512 Bit
M1 Max 24-Core GPU 24 @ 1.3 GHz
M1 Pro 16-Core GPU 16 @ 1.3 GHz
M1 Pro 14-Core GPU 14 @ 1.3 GHz
M1 8-Core GPU 8 @ 1.28 GHz
M1 7-Core GPU 7 @ 1.28 GHz
M3 Max 40-Core GPU 40
M3 Max 30-Core GPU 30
M3 Pro 18-Core GPU 18
M3 Pro 14-Core GPU 14
M3 10-Core GPU 10
M3 9-Core GPU 9
M3 8-Core GPU 8
Pipelines10 - unified7 - unified30 - unified
Memory TypeLPDDR5-6400LPDDR4X-4266LPDDR5-6400
Shared Memorynonono
Power Consumption15 Watt53 Watt
technology5 nm5 nm5 nm
Date of Announcement31.10.2023 10.11.2020 31.10.2023
PredecessorM1 8-Core GPU
Core Speed1278 MHz
Notebook Sizemedium sized
CPU in M3 10-Core GPUGPU Base SpeedGPU Boost / Turbo
Apple M38 x 2748 MHz? MHz? MHz
CPU in M3 Max 30-Core GPUGPU Base SpeedGPU Boost / Turbo
Apple M3 Max 14-Core14 x 2748 MHz, 78 W? MHz? MHz

Benchmarks

3DMark - 3DMark Wild Life Unlimited
16159 Points (8%)
3DMark - 3DMark Wild Life Extreme Unlimited
min: 8239     avg: 8276     median: 8286 (10%)     max: 8302 Points
4515 Points (5%)
Unigine Heaven 3.0 - Unigine Heaven 3.0 OpenGL
36.4 fps (16%)
Blender - Blender 3.3 Classroom METAL *
min: 121     avg: 128     median: 129 (13%)     max: 134 Seconds
956 Seconds (100%)
Cinebench R15
Cinebench R15 OpenGL 64 Bit + Apple M3 10-Core GPU
Cinebench R15 - Cinebench R15 OpenGL 64 Bit
129.8 fps (8%)
Cinebench R15 OpenGL 64 Bit + Apple M1 7-Core GPU
90 fps (5%)
Cinebench R15 OpenGL Ref. Match 64 Bit + Apple M3 10-Core GPU
Cinebench R15 - Cinebench R15 OpenGL Ref. Match 64 Bit
99.5 % (100%)
Cinebench R15 OpenGL Ref. Match 64 Bit + Apple M1 7-Core GPU
99.5 % (100%)
GFXBench - GFXBench 5.0 4K Aztec Ruins High Tier Offscreen
min: 51.8     avg: 52.2     median: 52.3 (20%)     max: 52.6 fps
GFXBench - GFXBench 5.0 Aztec Ruins High Tier Offscreen
min: 114.4     avg: 118.5     median: 120 (22%)     max: 121 fps
72.4 fps (13%)
GFXBench - GFXBench 5.0 Aztec Ruins Normal Tier Offscreen
min: 320     avg: 326.9     median: 329.6 (24%)     max: 331 fps
192 fps (14%)
GFXBench - GFXBench Car Chase Offscreen
min: 259     avg: 262.5     median: 260 (25%)     max: 268.6 fps
162 fps (15%)
GFXBench 3.1 - GFXBench Manhattan ES 3.1 Offscreen
min: 370     avg: 378.3     median: 372 (8%)     max: 393 fps
240 fps (5%)
GFXBench 3.0 - GFXBench 3.0 Manhattan Offscreen
min: 541     avg: 552     median: 551 (23%)     max: 563.5 fps
376 fps (16%)
GFXBench (DX / GLBenchmark) 2.7
GFXBench T-Rex HD Offscreen C24Z16 + Apple M3 10-Core GPU
GFXBench (DX / GLBenchmark) 2.7 - GFXBench T-Rex HD Offscreen C24Z16
min: 835     avg: 849     median: 848 (7%)     max: 864.2 fps
GFXBench T-Rex HD Offscreen C24Z16 + Apple M1 7-Core GPU
620 fps (5%)
Geekbench 6.4 - Geekbench 6.4 GPU OpenCL
min: 30414     avg: 30463     median: 30470 (8%)     max: 30506 Points
18341 Points (5%)
Geekbench 6.4 - Geekbench 6.4 GPU Metal
min: 47494     avg: 47626     median: 47686 (27%)     max: 47699 Points
30112 Points (17%)
Power Consumption - The Witcher 3 Power Consumption - external Monitor *
min: 21.9     avg: 22.8     median: 23.2 (3%)     max: 23.2 Watt
Power Consumption - Witcher 3 Power Consumption *
min: 28.6     avg: 30     median: 29.6 (7%)     max: 31.9 Watt
Power Consumption - GFXBench Aztec Ruins Normal Tier Offscreen Power Consumption 150cd *
19.5 Watt (8%)
Power Consumption - Power Efficiency - Witcher 3 ultra
min: 0.811     avg: 0.8     median: 0.8 (76%)     max: 0.878 fps per Watt
Power Consumption - Power Efficiency - Witcher 3 ultra external Monitor
min: 1.034     avg: 1.1     median: 1.1 (91%)     max: 1.207 fps per Watt
Emissions Witcher 3 Fan Noise + Apple M3 10-Core GPU
Emissions - Witcher 3 Fan Noise
25.1 dB(A) (36%)

Average Benchmarks Apple M3 10-Core GPU → 0% n=0

Average Benchmarks Apple M1 7-Core GPU → 0% n=0

- Range of benchmark values for this graphics card
red legend - Average benchmark values for this graphics card
* Smaller numbers mean a higher performance
1 This benchmark is not used for the average calculation

Game Benchmarks

The following benchmarks stem from our benchmarks of review laptops. The performance depends on the used graphics memory, clock rate, processor, system settings, drivers, and operating systems. So the results don't have to be representative for all laptops with this GPU. For detailed information on the benchmark results, click on the fps number.

low 1920x1080
100%
M3 10-Core GPU:
123 133 134 ~ 130 fps
med. 1920x1080
100%
M3 10-Core GPU:
67 83 86 ~ 79 fps
high 1920x1080
100%
M3 10-Core GPU:
43 44 45 ~ 44 fps
ultra 1920x1080
100%
M3 10-Core GPU:
28 35 36 ~ 33 fps
QHD 2560x1440
100%
M3 10-Core GPU:
24  fps
low 1920x1080
100%
M3 10-Core GPU:
33  fps
med. 1920x1080
100%
M3 10-Core GPU:
25.7  fps
high 1920x1080
100%
M3 10-Core GPU:
21.3  fps
ultra 1920x1080
100%
M3 10-Core GPU:
18.1  fps
low 1920x1080
100%
M3 10-Core GPU:
31 32 ~ 32 fps
med. 1920x1080
100%
M3 10-Core GPU:
26 26 ~ 26 fps
high 1920x1080
100%
M3 10-Core GPU:
21 22 ~ 22 fps
ultra 1920x1080
100%
M3 10-Core GPU:
19 19 ~ 19 fps
QHD 2560x1440
M1 7-Core GPU:
58  fps
low 1280x720
M1 7-Core GPU:
45.2  fps
med. 1920x1080
M1 7-Core GPU:
28  fps
high 1920x1080
M1 7-Core GPU:
17.7  fps
low 1280x720
100%
M3 10-Core GPU:
151  fps
63%
M1 7-Core GPU:
95.2 (!)  fps
med. 1920x1080
100%
M3 10-Core GPU:
52  fps
51%
M1 7-Core GPU:
26.3 (!)  fps
high 1920x1080
100%
M3 10-Core GPU:
33  fps
53%
M1 7-Core GPU:
17.4 (!)  fps
ultra 1920x1080
100%
M3 10-Core GPU:
24  fps
QHD 2560x1440
100%
M3 10-Core GPU:
15  fps
low 1280x720
100%
M3 10-Core GPU:
102 103 113 ~ 106 fps
61%
M1 7-Core GPU:
65  fps
med. 1920x1080
100%
M3 10-Core GPU:
38 44 45 ~ 42 fps
52%
M1 7-Core GPU:
22  fps
high 1920x1080
100%
M3 10-Core GPU:
34 38 41 ~ 38 fps
ultra 1920x1080
100%
M3 10-Core GPU:
30 32 36 ~ 33 fps
QHD 2560x1440
100%
M3 10-Core GPU:
23  fps
Far Cry 5

Far Cry 5

2018
low 1280x720
100%
M3 10-Core GPU:
79  fps
med. 1920x1080
100%
M3 10-Core GPU:
46  fps
high 1920x1080
100%
M3 10-Core GPU:
42  fps
ultra 1920x1080
100%
M3 10-Core GPU:
39  fps
QHD 2560x1440
100%
M3 10-Core GPU:
26  fps
F1 2017

F1 2017

2017
low 1280x720
M1 7-Core GPU:
60  fps
med. 1920x1080
M1 7-Core GPU:
54  fps
high 1920x1080
M1 7-Core GPU:
43  fps
low 1280x720
M1 7-Core GPU:
43.9  fps
med. 1920x1080
M1 7-Core GPU:
32.5  fps
low 1024x768
M1 7-Core GPU:
80.3  fps
high 1920x1080
M1 7-Core GPU:
30.1  fps
ultra 1920x1080
M1 7-Core GPU:
27  fps
4K 3840x2160
M1 7-Core GPU:
15.8  fps
low 1280x720
M1 7-Core GPU:
47.6  fps
med. 1366x768
M1 7-Core GPU:
35.3  fps
high 1920x1080
M1 7-Core GPU:
19  fps
high 1920x1080
100%
M3 10-Core GPU:
36 36 38 ~ 37 fps
ultra 1920x1080
100%
M3 10-Core GPU:
24 24 28 ~ 25 fps
GTA V

GTA V

2015
low 1024x768
100%
M3 10-Core GPU:
98  fps
med. 1366x768
100%
M3 10-Core GPU:
83  fps
high 1920x1080
100%
M3 10-Core GPU:
68  fps
ultra 1920x1080
100%
M3 10-Core GPU:
44  fps
low 1024x768
M1 7-Core GPU:
109  fps
high 1366x768
M1 7-Core GPU:
69  fps
ultra 1920x1080
M1 7-Core GPU:
44.4  fps
high 1366x768
M1 7-Core GPU:
86  fps
ultra 1920x1080
M1 7-Core GPU:
47  fps

Average Gaming Apple M3 10-Core GPU → 100%

Average Gaming 30-70 fps → 100%

Average Gaming Apple M1 7-Core GPU → 56%

Average Gaming 30-70 fps → 61%

Apple M3 10-Core GPUApple M1 7-Core GPUApple M3 Max 30-Core GPU
lowmed.highultraQHD4Klowmed.highultraQHD4Klowmed.highultraQHD4K
Total War Pharaoh13079443324
Cyberpunk 2077 2.2 Phantom Liberty3325.721.318.1
Baldur's Gate 332262219
Total War: Three Kingdoms1515233241595.226.317.4
Shadow of the Tomb Raider106423833236522
Far Cry 57946423926
The Witcher 33725
GTA V98836844
Apple M3 10-Core GPUApple M1 7-Core GPUApple M3 Max 30-Core GPU
lowmed.highultraQHD4Klowmed.highultraQHD4Klowmed.highultraQHD4K
< 30 fps
< 60 fps
< 120 fps
≥ 120 fps

2
3
2
2
3
2
2
5
1
4
4

4


< 30 fps
< 60 fps
< 120 fps
≥ 120 fps


2
2


1


< 30 fps
< 60 fps
< 120 fps
≥ 120 fps


For more games that might be playable and a list of all games and graphics cards visit our Gaming List

v1.33
log 22. 00:52:24

#0 ran 0s before starting gpusingle class +0s ... 0s

#1 checking url part for id 11633 +0s ... 0s

#2 checking url part for id 10560 +0s ... 0s

#3 checking url part for id 12034 +0s ... 0s

#4 redirected to Ajax server, took 1755816744s time from redirect:0 +0s ... 0s

#5 did not recreate cache, as it is less than 5 days old! Created at Tue, 19 Aug 2025 05:19:58 +0200 +0s ... 0s

#6 composed specs +0.033s ... 0.033s

#7 did output specs +0s ... 0.033s

#8 start showIntegratedCPUs +0s ... 0.033s

#9 getting avg benchmarks for device 11633 +0.019s ... 0.052s

#10 got single benchmarks 11633 +0.005s ... 0.057s

#11 getting avg benchmarks for device 10560 +0s ... 0.057s

#12 got single benchmarks 10560 +0.003s ... 0.061s

#13 getting avg benchmarks for device 12034 +0s ... 0.061s

#14 got single benchmarks 12034 +0.002s ... 0.063s

#15 got avg benchmarks for devices +0s ... 0.063s

#16 min, max, avg, median took s +0.012s ... 0.075s

#17 before gaming benchmark output +0s ... 0.075s

#18 Got 114 rows for game benchmarks. +0.009s ... 0.084s

#19 composed SQL query for gamebenchmarks +0s ... 0.084s

#20 got data and put it in $dataArray +0.001s ... 0.085s

#21 benchmarks composed for output. +0.005s ... 0.09s

#22 calculated avg scores. +0s ... 0.09s

#23 return log +0s ... 0.09s

Please share our article, every link counts!
Mail Logo
> Expert Reviews and News on Laptops, Smartphones and Tech Innovations > Benchmarks / Tech > Graphics Card Comparison - Head 2 Head
Redaktion, 2017-09- 8 (Update: 2023-07- 1)