Apple M2 Max 38-Core GPU vs Apple M2 Pro 19-Core GPU vs Apple M2 10-Core GPU
Apple M2 Max 38-Core GPU ► remove from comparison
The Apple M2 Max 38-Core-GPU is an integrated graphics card by Apple offering all 38 cores in the M2 Max Chip .
The graphics card has no dedicated graphics memory but can use the fast LPDDR5-6400 unified memory with a 512 bit bus (up to 400 GBit/s).
Thanks to the additional cores and architectural improvements, the M2 Max GPU should clearly best the old M1 Max GPU with 32 cores and therefore be the fastest iGPU currently available.
The GPU is intended to use Apple Metal 2 API and could still be based on the older PowerVR architectures (last used in the Apple A10). A new feature in the MacBook Pro 14 and 16 of 2023 is the support for HDMI 2.1 and 8k output.
The Apple M2 Max is manufactured in the second generation 5nm process at TSMC. According to the internal powermetrics tool, the GPU uses up to 53.6 Watt (performance mode) and the whole chip (including the CPU) up to 89 Watt.
Apple M2 Pro 19-Core GPU ► remove from comparison
The Apple M2 Pro 19-Core-GPU is an integrated graphics card by Apple offering all 19 cores in the M2 Pro Chip .
The graphics card has no dedicated graphics memory but can use the fast LPDDR5-6400 unified memory with a 256 bit bus (up to 200 GBit/s). The GPU clocks from 444 MHz to 1398 MHz and was maintaining the 1398 MHz in games.
According to Apple, the performance should be 30% higher than the old 16-core-GPU in the M1 Pro .
The GPU is intended to use Apple Metal 2 API and could still be based on the older PowerVR architectures (last used in the Apple A10). A new feature in the MacBook Pro 14 and 16 of 2023 is the support for HDMI 2.1 and 8k output.
The Apple M2 Pro is manufactured in the second generation 5nm process at TSMC. The power consumption of the GPU part in the M2 Pro is slightly below 20 Watt in games (Borderlands 3 measured with powermetrics).
Apple M2 10-Core GPU ► remove from comparison
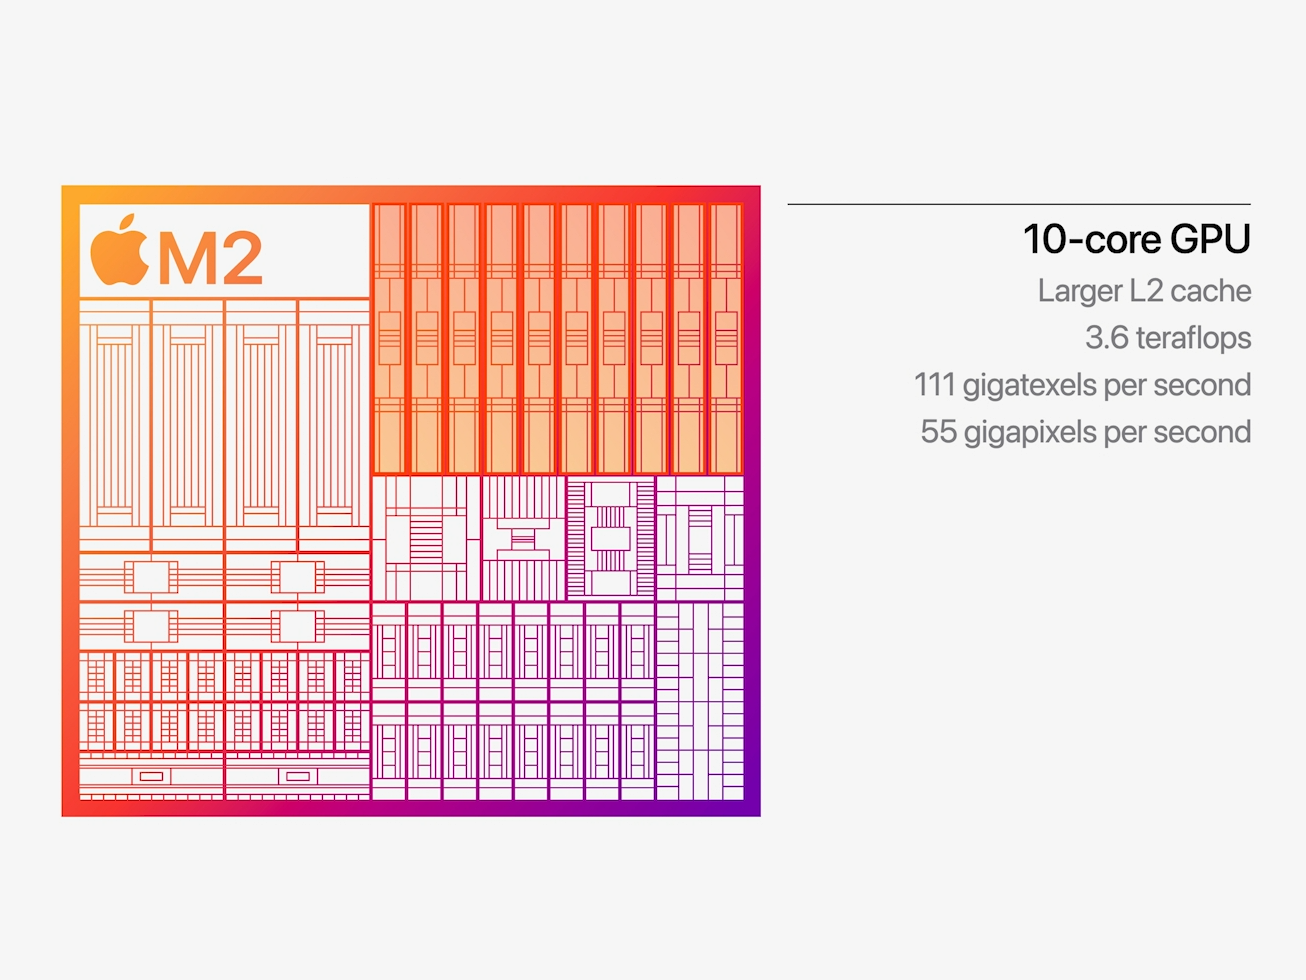
The Apple M2 GPU is an integrated graphics card offering 10 cores designed by Apple and integrated in the Apple M2 SoC . It uses the unified memory architecture of the M2 SoC (up to 24 GB LPDDR5-6400 with 100 GB/s bandwidth) and should offer 160 execution units.
According to Apple it offers a 25% higher performance at slightly higher power consumption. The theoretical performance is rated at 3.6 Teraflops and therefore 1 TFLOP higher than the M1 8-core GPU . In our benchmarks, the GPU was able to top the M1 with up to 40%, but still stays behind the 14-core GPU in the M1 Pro. Compared to other iGPUs from AMD and Intel, the M2 benefits greatly from the unified memory architecture and the high bandwidth.
The M2 chip is manufactured in the second generation 5nm process at TSMC (most likely N5P). The power consumption is around 13.5 Watt (in our tests under load of the MBP13) and up to 15W according to Apple.
Apple M2 Max 38-Core GPU Apple M2 Pro 19-Core GPU Apple M2 10-Core GPU Apple M2 Series Pipelines 38 - unified 19 - unified 10 - unified Memory Type LPDDR5-6400 LPDDR5-6400 LPDDR5-6400 Shared Memory no no no Power Consumption 53 Watt 20 Watt 15 Watt technology 5 nm 5 nm 5 nm Notebook Size medium sized medium sized Date of Announcement 17.01.2023 17.01.2023 06.06.2022 Core Speed 444 - 1398 (Boost) MHz 1398 (Boost) MHz Predecessor M1 8-Core GPU
CPU in M2 Max 38-Core GPU GPU Base Speed GPU Boost / Turbo Apple M2 Max 12 x 2424 MHz, 79 W ? MHz ? MHz
CPU in M2 Pro 19-Core GPU GPU Base Speed GPU Boost / Turbo Apple M2 Pro 12 x 2424 MHz ? MHz ? MHz
CPU in M2 10-Core GPU GPU Base Speed GPU Boost / Turbo Apple M2 8 x 2424 MHz, 20 W ? MHz 1398 MHz
Benchmarks 3DMark - 3DMark Wild Life Unlimited
min: 21302 avg: 23989 median: 24875 (13%) max: 25317 Points
GPU TDP ? TDP 13 W 94% 100%
3DMark - 3DMark Wild Life Extreme Unlimited
25103 Points (29%)
min: 12968 avg: 12983 median: 12982.5 (15%) max: 12997 Points
GPU TDP ? TDP 64 W 52% 100%
min: 5328 avg: 6563 median: 6824 (8%) max: 6987 Points
GPU TDP ? TDP 12 W TDP 13 W TDP 64 W 35% 28% 27% 100%
Blender - Blender 3.3 Classroom METAL *
51.2 Seconds (5%)
97 Seconds (10%)
GPU TDP ? TDP 64 W 100% 105%
min: 205 avg: 221 median: 221 (23%) max: 237 Seconds
GPU TDP ? TDP 12 W TDP 13 W TDP 64 W 119% 104% 100% 126%
Cinebench R15 + Apple M2 Max 38-Core GPU Cinebench R15 - Cinebench R15 OpenGL 64 Bit
147.5 fps (9%)
Cinebench R15 OpenGL 64 Bit + Apple M2 Pro 19-Core GPU
140.9 fps (8%)
GPU TDP ? TDP 64 W 96% 100%
Cinebench R15 OpenGL 64 Bit + Apple M2 10-Core GPU
min: 128.65 avg: 132.8 median: 131 (8%) max: 140.5 fps
GPU TDP ? TDP 12 W TDP 13 W TDP 64 W 96% 95% 88% 100%
Cinebench R15 OpenGL Ref. Match 64 Bit + Apple M2 Max 38-Core GPU Cinebench R15 - Cinebench R15 OpenGL Ref. Match 64 Bit
99.5 % (100%)
Cinebench R15 OpenGL Ref. Match 64 Bit + Apple M2 Pro 19-Core GPU
99.5 % (100%)
GPU TDP ? TDP 64 W 100% 100%
Cinebench R15 OpenGL Ref. Match 64 Bit + Apple M2 10-Core GPU
99.5 % (100%)
GPU TDP ? TDP 12 W TDP 13 W TDP 64 W 100% 100% 100% 100%
GFXBench - GFXBench 5.0 4K Aztec Ruins High Tier Offscreen
179.9 fps (73%)
min: 92.1 avg: 92.2 median: 92.2 (37%) max: 92.2 fps
GPU TDP ? TDP 64 W 51% 100%
min: 35.6 avg: 44.1 median: 48 (19%) max: 48.6 fps
GPU TDP ? TDP 12 W TDP 13 W TDP 64 W 34% 27% 27% 100%
GFXBench - GFXBench 5.0 Aztec Ruins High Tier Offscreen
397.6 fps (72%)
min: 210.4 avg: 210.6 median: 210.6 (38%) max: 210.7 fps
GPU TDP ? TDP 64 W 53% 100%
min: 68 avg: 95.8 median: 107.7 (20%) max: 110 fps
GPU TDP ? TDP 12 W TDP 13 W TDP 64 W 33% 27% 27% 100%
GFXBench - GFXBench 5.0 Aztec Ruins Normal Tier Offscreen
950 fps (70%)
min: 565.3 avg: 567 median: 566.7 (42%) max: 568 fps
GPU TDP ? TDP 64 W 60% 100%
min: 208 avg: 271 median: 289 (21%) max: 296 fps
GPU TDP ? TDP 12 W TDP 13 W TDP 64 W 39% 30% 31% 100%
GFXBench - GFXBench Car Chase Offscreen
585 fps (66%)
min: 434.4 avg: 435.2 median: 435.2 (49%) max: 436 fps
GPU TDP ? TDP 64 W 74% 100%
min: 136 avg: 197.5 median: 214 (24%) max: 232 fps
GPU TDP ? TDP 12 W TDP 13 W TDP 64 W 49% 40% 34% 100%
GFXBench 3.1 - GFXBench Manhattan ES 3.1 Offscreen
1294 fps (27%)
min: 748 avg: 748 median: 748.2 (16%) max: 748.4 fps
GPU TDP ? TDP 64 W 58% 100%
min: 247 avg: 317.9 median: 339 (7%) max: 374.6 fps
GPU TDP ? TDP 12 W TDP 13 W TDP 64 W 37% 29% 25% 100%
GFXBench 3.0 - GFXBench 3.0 Manhattan Offscreen
1708 fps (100%)
min: 1126.4 avg: 1131 median: 1131.2 (66%) max: 1136 fps
GPU TDP ? TDP 64 W 66% 100%
min: 411 avg: 504 median: 525 (31%) max: 557.2 fps
GPU TDP ? TDP 12 W TDP 13 W TDP 64 W 42% 33% 32% 100%
GFXBench (DX / GLBenchmark) 2.7 + Apple M2 Max 38-Core GPU GFXBench (DX / GLBenchmark) 2.7 - GFXBench T-Rex HD Offscreen C24Z16
3185 fps (25%)
GFXBench T-Rex HD Offscreen C24Z16 + Apple M2 Pro 19-Core GPU
min: 1967.2 avg: 1970 median: 1969.6 (16%) max: 1972 fps
GPU TDP ? TDP 64 W 62% 100%
GFXBench T-Rex HD Offscreen C24Z16 + Apple M2 10-Core GPU
min: 628 avg: 840 median: 910 (7%) max: 931.9 fps
GPU TDP ? TDP 12 W TDP 13 W TDP 64 W 39% 29% 29% 100%
Antutu v9 - AnTuTu v9 GPU
min: 654168 avg: 728087 median: 728086 (91%) max: 802005 Points
Geekbench 6.2 - Geekbench 6.2 GPU OpenCL
50447 Points (15%)
min: 27880 avg: 27900 median: 27900 (8%) max: 27920 Points
GPU TDP ? TDP 12 W TDP 13 W 100% 55% 55%
Geekbench 6.2 - Geekbench 6.2 GPU Metal
82134 Points (53%)
min: 45460 avg: 45703 median: 45703 (29%) max: 45946 Points
GPU TDP ? TDP 12 W TDP 13 W 100% 56% 55%
Power Consumption - The Witcher 3 Power Consumption - external Monitor *
80.7 Watt (11%)
49.6 Watt (7%)
GPU TDP ? TDP 64 W 105% 100%
min: 22.8 avg: 27.8 median: 26.9 (4%) max: 34.4 Watt
GPU TDP ? TDP 12 W TDP 13 W TDP 64 W 105% 108% 108% 100%
Power Consumption - Witcher 3 Power Consumption *
92 Watt (20%)
55.9 Watt (12%)
GPU TDP ? TDP 64 W 110% 100%
min: 27.8 avg: 32.5 median: 30.8 (7%) max: 38.9 Watt
GPU TDP ? TDP 13 W TDP 64 W 110% 116% 100%
Power Consumption - GFXBench Aztec Ruins Normal Tier Offscreen Power Consumption 150cd *
min: 16 avg: 16.5 median: 16.7 (6%) max: 16.7 Watt
Power Consumption - Witcher 3 ultra Power Efficiency
1 fps per Watt (100%)
Power Consumption - Witcher 3 ultra Power Efficiency - external Monitor
0.9 fps per Watt (78%)
min: 1.028 avg: 1 median: 1 (85%) max: 1.207 fps per Watt
GPU TDP ? TDP 64 W 100% 92%
min: 1.116 avg: 1.1 median: 1.1 (92%) max: 1.207 fps per Watt
GPU TDP ? TDP 13 W TDP 64 W 92% 100% 84%
Emissions Witcher 3 Fan Noise + Apple M2 Max 38-Core GPU Emissions - Witcher 3 Fan Noise
35.1 dB(A) (56%)
Witcher 3 Fan Noise + Apple M2 10-Core GPU
34.6 dB(A) (55%)
GPU TDP 13 W TDP 64 W 99% 100%
Average Benchmarks Apple M2 Max 38-Core GPU → 100% n=11 Average Benchmarks Apple M2 Pro 19-Core GPU → 70% n=11 Average Benchmarks Apple M2 10-Core GPU → 46% n=11
- Range of benchmark values for this graphics card
- Average benchmark values for this graphics card
* Smaller numbers mean a higher performance
1 This benchmark is not used for the average calculation
Game Benchmarks The following benchmarks stem from our benchmarks of review laptops. The performance depends on the used graphics memory, clock rate, processor, system settings, drivers, and operating systems. So the results don't have to be representative for all laptops with this GPU. For detailed information on the benchmark results, click on the fps number.
M2 Pro 19-Core GPU:
39.6 [X] Apple MacBook Pro 14 2023 M2 Pro Apple M2 Pro 2.4GHz
M2 Pro 19-Core GPU
fps
M2 Pro 19-Core GPU:
33.5 [X] Apple MacBook Pro 14 2023 M2 Pro Apple M2 Pro 2.4GHz
M2 Pro 19-Core GPU
fps
M2 Pro 19-Core GPU:
29.3 [X] Apple MacBook Pro 14 2023 M2 Pro Apple M2 Pro 2.4GHz
M2 Pro 19-Core GPU
fps
M2 Pro 19-Core GPU:
26.5 [X] Apple MacBook Pro 14 2023 M2 Pro Apple M2 Pro 2.4GHz
M2 Pro 19-Core GPU
fps
M2 Pro 19-Core GPU:
34 [X] Apple MacBook Pro 14 2023 M2 Pro Apple M2 Pro 2.4GHz
M2 Pro 19-Core GPU
fps
M2 Pro 19-Core GPU:
75.9 [X] Apple MacBook Pro 14 2023 M2 Pro Apple M2 Pro 2.4GHz
M2 Pro 19-Core GPU
79 ~ 77 fps
100%
M2 Max 38-Core GPU:
72 fps
79%
M2 Pro 19-Core GPU:
54 60.3 [X] Apple MacBook Pro 14 2023 M2 Pro Apple M2 Pro 2.4GHz
M2 Pro 19-Core GPU
~ 57 fps
100%
M2 Max 38-Core GPU:
60.2 fps
66%
M2 Pro 19-Core GPU:
40 40.6 [X] Apple MacBook Pro 14 2023 M2 Pro Apple M2 Pro 2.4GHz
M2 Pro 19-Core GPU
~ 40 fps
100%
M2 Max 38-Core GPU:
48.6 fps
62%
M2 Pro 19-Core GPU:
29 30.4 [X] Apple MacBook Pro 14 2023 M2 Pro Apple M2 Pro 2.4GHz
M2 Pro 19-Core GPU
~ 30 fps
100%
M2 Max 38-Core GPU:
330 fps
82%
M2 Pro 19-Core GPU:
269 fps
100%
M2 Max 38-Core GPU:
147 fps
57%
M2 Pro 19-Core GPU:
84 fps
100%
M2 Max 38-Core GPU:
96 fps
56%
M2 Pro 19-Core GPU:
54 fps
100%
M2 Max 38-Core GPU:
71 fps
56%
M2 Pro 19-Core GPU:
40 fps
100%
M2 Max 38-Core GPU:
47 fps
53%
M2 Pro 19-Core GPU:
25 fps
100%
M2 Max 38-Core GPU:
182 fps
93%
M2 Pro 19-Core GPU:
169 fps
43%
M2 10-Core GPU:
60 76 102 ~ 79 fps
100%
M2 Max 38-Core GPU:
131 fps
61%
M2 Pro 19-Core GPU:
80 fps
100%
M2 Max 38-Core GPU:
122 fps
59%
M2 Pro 19-Core GPU:
72 fps
100%
M2 Max 38-Core GPU:
109 fps
58%
M2 Pro 19-Core GPU:
63 fps
100%
M2 Max 38-Core GPU:
78 fps
51%
M2 Pro 19-Core GPU:
40 fps
26%
M2 10-Core GPU:
20 fps
100%
M2 Max 38-Core GPU:
83 fps
69%
M2 Pro 19-Core GPU:
57 fps
41%
M2 10-Core GPU:
34 fps
100%
M2 Max 38-Core GPU:
76 fps
67%
M2 Pro 19-Core GPU:
51 fps
37%
M2 10-Core GPU:
28 fps
100%
M2 Max 38-Core GPU:
84 fps
100%
M2 Max 38-Core GPU:
81 fps
100%
M2 Max 38-Core GPU:
57 fps
Average Gaming Apple M2 Max 38-Core GPU → 100% Average Gaming 30-70 fps → 100%
Average Gaming Apple M2 Pro 19-Core GPU → 65% Average Gaming 30-70 fps → 63%
Average Gaming Apple M2 10-Core GPU → 33% Average Gaming 30-70 fps → 34%
Apple M2 Pro 19-Core GPU low med. high ultra QHD 4K Cyberpunk 2077 2.1 Phantom Liberty 39.6 33.5 29.3 26.5 Baldur's Gate 3 34 Borderlands 3 77 57 40 30 Total War: Three Kingdoms 269 84 54 40 25 Shadow of the Tomb Raider 169 80 72 63 40 The Witcher 3 57 51 < 30 fps < 60 fps < 120 fps ≥ 120 fps 1 1 2 2 2 1 3 1 1 4 1 1 1
Apple M2 Max 38-Core GPU low med. high ultra QHD 4K Borderlands 3 72 60.2 48.6 Total War: Three Kingdoms 330 147 96 71 47 Shadow of the Tomb Raider 182 131 122 109 78 The Witcher 3 83 76 GTA V 84 81 57 < 30 fps < 60 fps < 120 fps ≥ 120 fps 1 2 2 2 1 3 1 1 3 1 1
For more games that might be playable and a list of all games and graphics cards visit our Gaming List
v1.27
log 15. 23:54:54
#0 checking url part for id 11574 +0s ... 0s
#1 checking url part for id 11568 +0s ... 0s
#2 checking url part for id 11368 +0s ... 0s
#3 not redirecting to Ajax server +0s ... 0s
#4 did not recreate cache, as it is less than 5 days old! Created at Thu, 13 Jun 2024 05:35:10 +0200 +0.001s ... 0.001s
#5 composed specs +0.114s ... 0.115s
#6 did output specs +0s ... 0.115s
#7 start showIntegratedCPUs +0s ... 0.115s
#8 getting avg benchmarks for device 11574 +0.038s ... 0.153s
#9 got single benchmarks 11574 +0.008s ... 0.161s
#10 getting avg benchmarks for device 11568 +0.002s ... 0.163s
#11 got single benchmarks 11568 +0.008s ... 0.171s
#12 getting avg benchmarks for device 11368 +0.002s ... 0.173s
#13 got single benchmarks 11368 +0.015s ... 0.188s
#14 got avg benchmarks for devices +0s ... 0.188s
#15 min, max, avg, median took s +0.144s ... 0.332s
#16 before gaming benchmark output +0s ... 0.332s
#17 Got 131 rows for game benchmarks. +0.02s ... 0.352s
#18 composed SQL query for gamebenchmarks +0s ... 0.352s
#19 got data and put it in $dataArray +0.009s ... 0.361s
#20 benchmarks composed for output. +0.033s ... 0.394s
#21 calculated avg scores. +0s ... 0.394s
#22 return log +0.002s ... 0.396s
Please share our article, every link counts!
Redaktion, 2017-09- 8 (Update: 2023-07- 1)
 Deutsch
 English
 Español
 Français
 Italiano
 Nederlands
 Polski
 Português
 Русский
 Türkçe
 Svenska
 Chinese
 Magyar