Apple M1 8-Core GPU vs
Apple M1 8-Core GPU
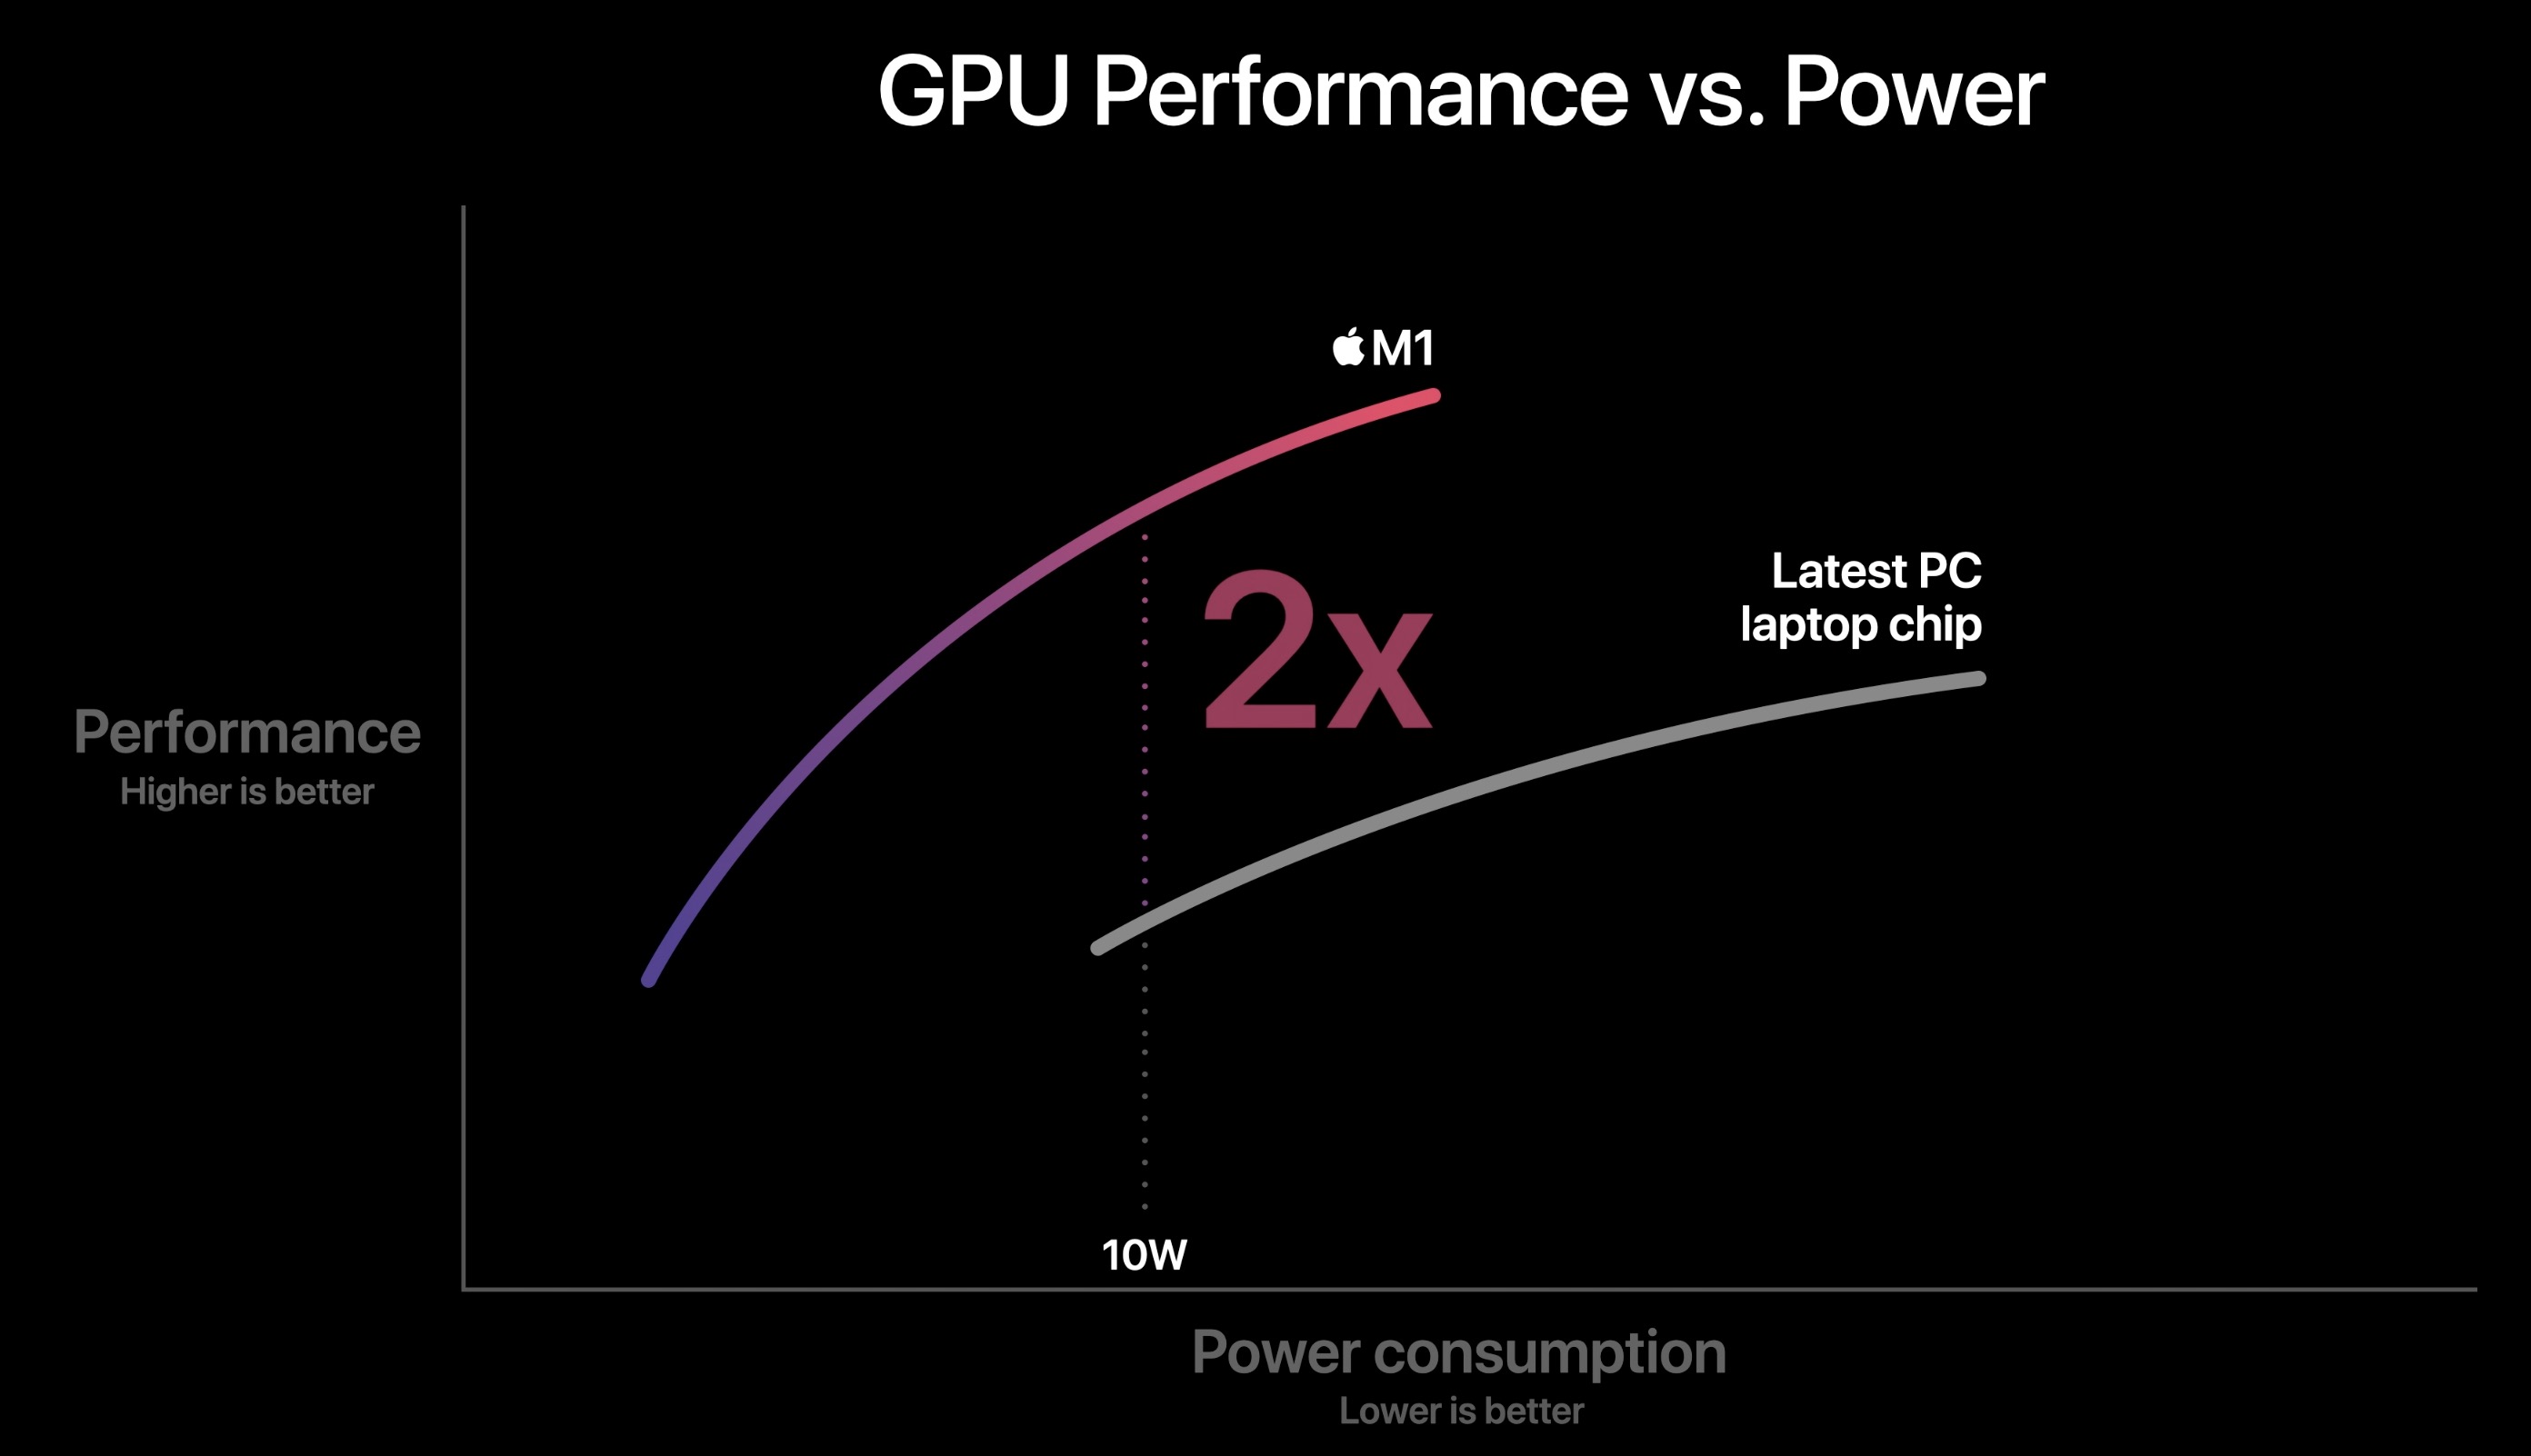
The Apple M1 GPU is an integrated graphics card offering 8 cores (1 deactivated core in the entry MacBook Air) designed by Apple and integrated in the Apple M1 SoC . According to Apple it is faster and more energy efficient as competing products (like the Tiger Lake Xe GPU ). The peak performance of the high end variant is 2.6 teraflops and thanks to the unified memory architecture it should have fast access to the RAM.
The Apple M1 is manufactured in the modern 5nm process at TSMC and should offer an excellent energy efficiency. According to internal tools, the M1 GPU uses under load approximately 10 Watt (11.5 Watt package power including the RAM).
Apple M1 8-Core GPU Series Pipelines 8 - unified Core Speed 1278 MHz Theoretical Performance 2.6 TFLOPS FP32 Memory Type LPDDR4X-4266 Shared Memory no Power Consumption 10 Watt technology 5 nm Date of Announcement 10.11.2020
CPU in M1 8-Core GPU GPU Base Speed GPU Boost / Turbo Apple M1 8 x 2064 MHz ? MHz ? MHz
Benchmarks 3DMark - 3DMark Ice Storm Unlimited Graphics
280200 Points (32%)
Model CPU GPU RAM Value Apple Mac Mini Late 2020 (M1, 16GB) M1 M1 8-Core GPU 16 GB 280200
3DMark - 3DMark Sling Shot (ES 3.0) Unlimited
min: 7588 avg: 10635 median: 10635 (46%) max: 13682 Points
3DMark - 3DMark Sling Shot (ES 3.0) Unlimited Graphics
min: 35978 avg: 39365 median: 39364.5 (87%) max: 42751 Points
3DMark - 3DMark Sling Shot Extreme (ES 3.1) Unlimited
min: 8911 avg: 9606 median: 9605.5 (48%) max: 10300 Points
3DMark - 3DMark Sling Shot Extreme (ES 3.1) Unlimited Graphics
25707 Points (77%)
3DMark - 3DMark Wild Life Unlimited
min: 17731 avg: 18099 median: 18177 (9%) max: 18326 Points
3DMark - 3DMark Wild Life Extreme Unlimited
min: 4144 avg: 4696 median: 4821 (6%) max: 4997 Points
Cinebench R15 + Apple M1 8-Core GPU Cinebench R15 - Cinebench R15 OpenGL 64 Bit
min: 88.1 avg: 89.1 median: 89.4 (5%) max: 89.8 fps
Cinebench R15 OpenGL Ref. Match 64 Bit + Apple M1 8-Core GPU Cinebench R15 - Cinebench R15 OpenGL Ref. Match 64 Bit
99.5 % (100%)
GFXBench - GFXBench 5.0 Aztec Ruins High Tier Offscreen
min: 60.9 avg: 74.3 median: 78.1 (14%) max: 81.7 fps
GFXBench - GFXBench 5.0 Aztec Ruins Normal Tier Offscreen
min: 149 avg: 196.9 median: 206 (15%) max: 216.1 fps
GFXBench - GFXBench Car Chase Offscreen
min: 150 avg: 167.4 median: 165.1 (19%) max: 197 fps
GFXBench 3.1 - GFXBench Manhattan ES 3.1 Offscreen
min: 216 avg: 248.2 median: 248.7 (5%) max: 275 fps
GFXBench 3.0 - GFXBench 3.0 Manhattan Offscreen
min: 317 avg: 358.5 median: 345 (20%) max: 408 fps
GFXBench (DX / GLBenchmark) 2.7 + Apple M1 8-Core GPU GFXBench (DX / GLBenchmark) 2.7 - GFXBench T-Rex HD Offscreen C24Z16
min: 557 avg: 610 median: 588 (5%) max: 670 fps
Antutu v9 - AnTuTu v9 GPU
min: 549301 avg: 598951 median: 598951 (75%) max: 648601 Points
Power Consumption - Witcher 3 Power Consumption *
min: 19.6 avg: 39.4 median: 39.4 (9%) max: 59.2 Watt
Power Consumption - GFXBench Aztec Ruins Normal Tier Offscreen Power Consumption 150cd *
min: 16 avg: 16.4 median: 16.5 (6%) max: 16.6 Watt
Average Benchmarks Apple M1 8-Core GPU → 0% n=
- Range of benchmark values for this graphics card
- Average benchmark values for this graphics card
* Smaller numbers mean a higher performance
1 This benchmark is not used for the average calculation
Game Benchmarks The following benchmarks stem from our benchmarks of review laptops. The performance depends on the used graphics memory, clock rate, processor, system settings, drivers, and operating systems. So the results don't have to be representative for all laptops with this GPU. For detailed information on the benchmark results, click on the fps number.
100%
M1 8-Core GPU:
60 fps
100%
M1 8-Core GPU:
59 60 ~ 60 fps
100%
M1 8-Core GPU:
59 60 60 ~ 60 fps
100%
M1 8-Core GPU:
59 60 ~ 60 fps
100%
M1 8-Core GPU:
59 60 ~ 60 fps
100%
M1 8-Core GPU:
15 15 ~ 15 fps
100%
M1 8-Core GPU:
64 66 78 ~ 69 fps
100%
M1 8-Core GPU:
25 27 45 ~ 32 fps
100%
M1 8-Core GPU:
23 25 43 ~ 30 fps
100%
M1 8-Core GPU:
38 fps
100%
M1 8-Core GPU:
39 fps
100%
M1 8-Core GPU:
39 44 ~ 42 fps
100%
M1 8-Core GPU:
59 fps
100%
M1 8-Core GPU:
39.6 [X] Apple Mac Mini Late 2020 (M1, 16GB) Metal
Apple M1 2.1GHz
M1 8-Core GPU
fps
Average Gaming Apple M1 8-Core GPU → 100% Average Gaming 30-70 fps → 100%
For more games that might be playable and a list of all games and graphics cards visit our Gaming List
v1.26
log 26. 08:12:42
#0 checking url part for id 10552 +0s ... 0s
#1 checking url part for id 9878 +0s ... 0s
#2 not redirecting to Ajax server +0s ... 0s
#3 did not recreate cache, as it is less than 5 days old! Created at Thu, 25 Apr 2024 05:40:10 +0200 +0.001s ... 0.001s
#4 composed specs +0.084s ... 0.085s
#5 did output specs +0s ... 0.085s
#6 start showIntegratedCPUs +0s ... 0.085s
#7 getting avg benchmarks for device 10552 +0.025s ... 0.11s
#8 got single benchmarks 10552 +0.015s ... 0.125s
#9 getting avg benchmarks for device 9878 +0.002s ... 0.126s
#10 got single benchmarks 9878 +0s ... 0.127s
#11 got avg benchmarks for devices +0s ... 0.127s
#12 min, max, avg, median took s +0.06s ... 0.186s
#13 before gaming benchmark output +0s ... 0.186s
#14 Got 53 rows for game benchmarks. +0.009s ... 0.196s
#15 composed SQL query for gamebenchmarks +0s ... 0.196s
#16 got data and put it in $dataArray +0.006s ... 0.202s
#17 benchmarks composed for output. +0.023s ... 0.224s
#18 calculated avg scores. +0s ... 0.224s
#19 return log +0.043s ... 0.267s
Please share our article, every link counts!
Redaktion, 2017-09- 8 (Update: 2023-07- 1)
 Deutsch
 English
 Español
 Français
 Italiano
 Nederlands
 Polski
 Português
 Русский
 Türkçe
 Svenska
 Chinese
 Magyar