Notebookcheck Logo

Apple M3 Pro 12-Core vs Apple M1 Max vs Apple M1

Apple M3 Pro 12-Core

► remove from comparison Apple Apple M3 Pro 12-Core

The Apple M3 Pro (12 Core) is a system on a chip (SoC) from Apple for notebooks that was launched in late 2023. It integrates a new 12-core CPU with 6 performance cores with up to 4.06 GHz and 6 efficiency cores with 2.8 GHz. There is also a slimmed-down 11-core variant with a 14-core GPU.

Compared to the M2 Pro the M3 Pro has been slimmed down somewhat and swaps two performance cores for efficiency cores. This is due to the changed core configuration, as 6 cores are now used per cluster (the M2 Pro and M3 still have 4 cores per cluster). Furthermore, the memory bus has been reduced from 256 bits to 192 bits (150 GB/s vs. 200 GB/s). However, thanks to the new architecture and higher clock rates, the new M3 Pro is still slightly faster.

The M3 Pro also integrates a new graphics card with dynamic caching, mesh shading and ray tracing acceleration via hardware. In the top model, all 18 cores of the chip are used and support up to 3 displays simultaneously (internal and 2 external).

GPU and CPU can jointly access the shared memory on the package (unified memory). This is available in 18 or 36 GB variants and offers 150 GB/s maximum bandwidth (192 bit bus).

The integrated 16-core Neural Engine has also been revised and now offers 18 TOPS peak performance (compared to 15.8 TOPS in the M2 but 35 TOPS in the new A17 Pro). The video engine now also supports AV1 decoding in hardware. H.264, HEVC and ProRes (RAW) can still be decoded and encoded.

Unfortunately, the integrated WLAN only continues to support WiFi 6E (no WiFi 7), unlike the small M3 SoC thunderbolt 4 is also supported (max 40 Gbit/s).

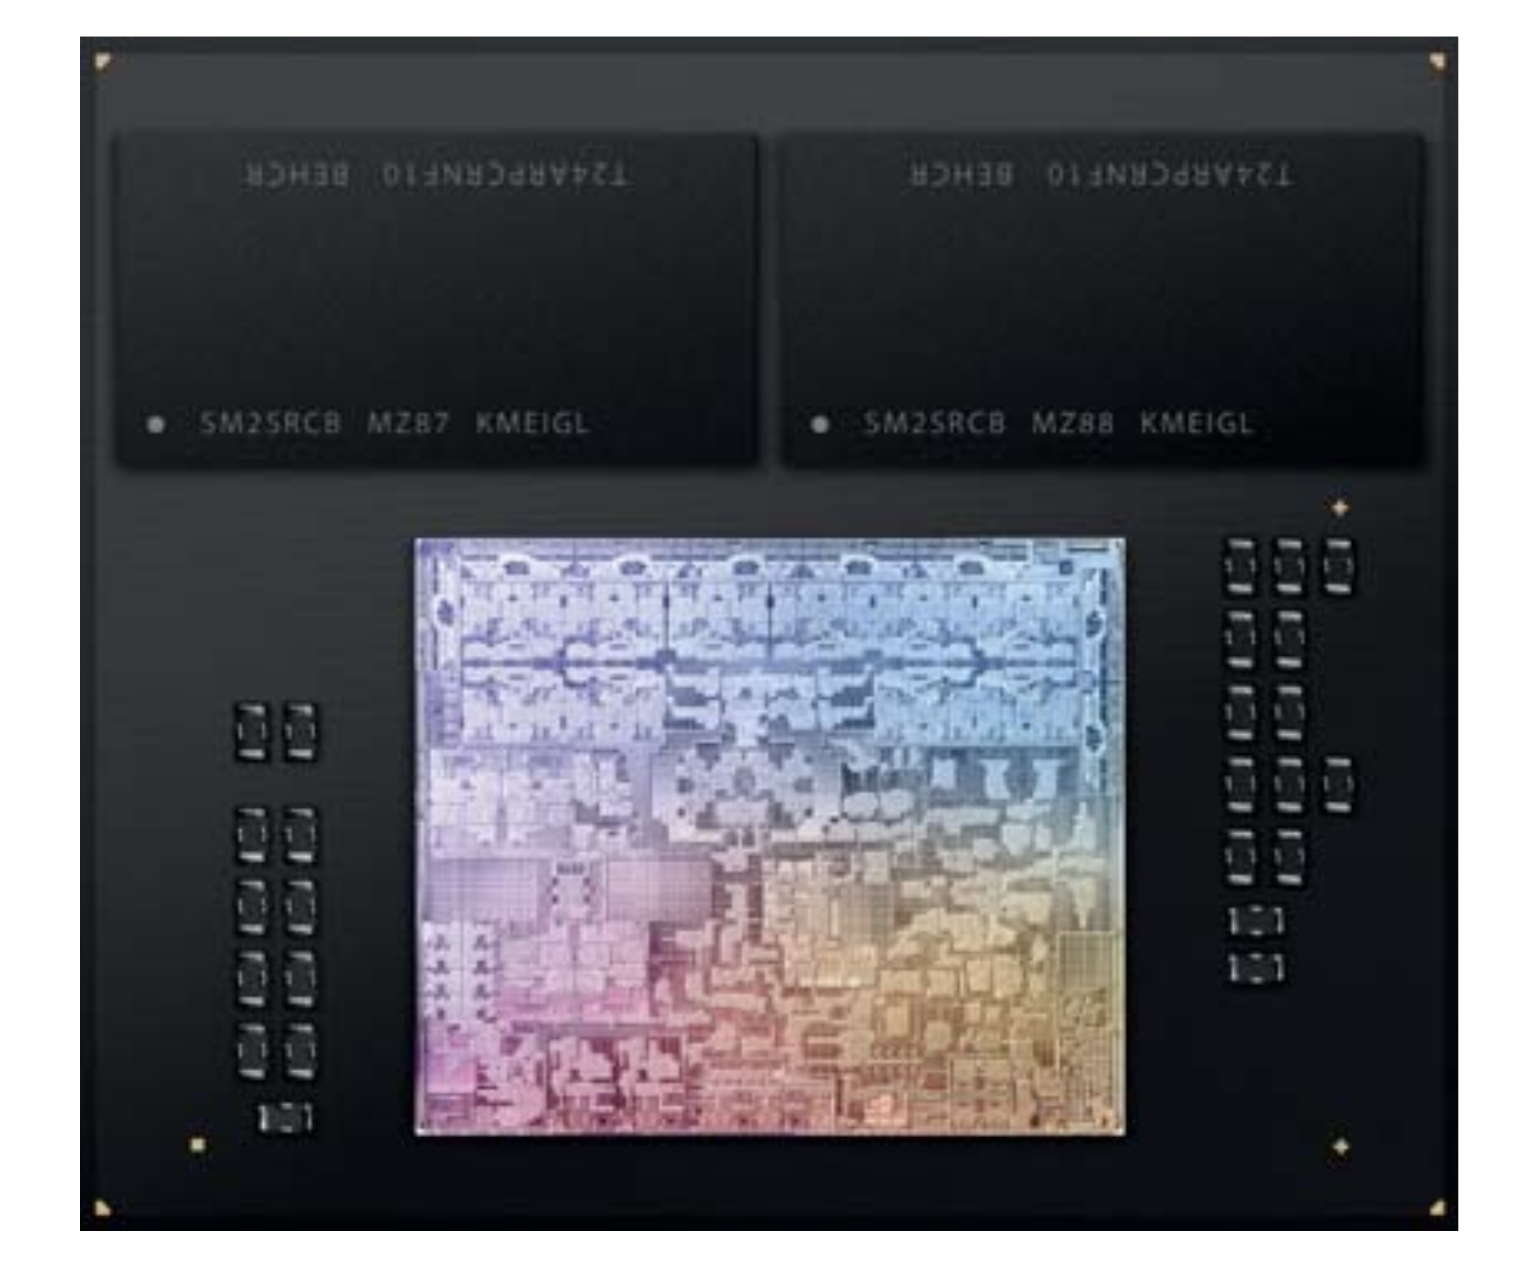
The chip is manufactured in the current 3nm process (N3B) at TSMC and contains 37 billion transistors (-7.5% vs. Apple M2 Pro).

Apple M1 Max

► remove from comparison Apple M1 Max

The Apple M1 Max is a System on a Chip (SoC) from Apple that is found in the late 2021 MacBook Pro 14 and 16-inch models. It offers all 10 cores available in the chip divided in eight performance cores (P-cores with 600 - 3220 MHz) and two power-efficiency cores (E-cores with 600 - 2064 MHz). There is no Turbo Boost for single cores or short burst periods. The cores are similar to the cores in the Apple M1.

The big cores (codename Firestorm) offer 192 KB instruction cache, 128 KB data cache, and 24 MB shared L2 cache (up from 12 MB in the M1). The four efficiency cores (codename Icestorm) are a lot smaller and offer only 128 KB instruction cache, 64 KB data cache, and 4 MB shared cache. CPU and GPU can both use the 48 MB SLC (System Level Cache). The efficiency cores (E cluster) clock with 600 - 2064 MHz, the performance cores (P cluster) with 600 - 3228 MHz.

The unified memory (32 or 64 GB LPDDR5-6400) next to the chip is connected by a 512 bit memory controller (200 GB/s bandwidth) and can be used by the GPU and CPU. This is the main difference to the M1 Pro and the CPU performance is quite similar.

The biggest difference to the M1 Pro is the bigger integrated GPU with 24 or 32 cores (up from 16).

Furthermore, the SoC integrates a fast 16 core neural engine, a secure enclave (e.g., for encryption), a unified memory architecture, Thunderbolt 4 controller, an ISP, and media de- and encoders (including two ProRes engines).

The M1 Pro is manufactured in 5 nm at TSMC and integrates 57 billion transistors. The peak power consumption of the chip was advertised around 30W for CPU intensive tasks. 

Apple M1

► remove from comparison Apple M1

The Apple M1 is a System on a Chip (SoC) from Apple that is found in the late 2020 MacBook Air, MacBook Pro 13, and Mac Mini. It offers 8 cores divided in four performance cores and four power-efficiency cores. The big cores offer 192 KB instruction cache, 128 KB data cache, and 12 MB shared L2 cache. According to Apple the performance of these cores should be better than anything on the market (in late 2020). The four efficiency cores are a lot smaller and offer only 128 KB instruction cache, 64 KB data cache, and 4 MB shared cache. The efficiency cores (E cluster) clock with 600 - 2064 MHz, the performance cores (P cluster) with 600 - 3204 MHz.

The M1 is available in two TDP variants, a passive cooled 10 Watt variant for the MacBook Air and an active cooled faster variant for the MacBook Pro 13 and Mac Mini. Those should offer a better-sustained performance according to Apple.

The integrated graphics card in the M1 offers 8 cores (7 cores in the entry MacBook Air) and a peak performance of 2.6 teraflops. Apple claims that it is faster than any other iGPU at the time of announcement.

Furthermore, the SoC integrates a fast 16 core neural engine with a peak performance of 11 TOPS (for AI hardware acceleration), a secure enclave (e.g., for encryption), a unified memory architecture, Thunderbolt / USB 4 controller, an ISP, and media de- and encoders.

The Apple M1 includes 16 billion transistors (up from the 10 billion of the A12Z Bionic and therefore double the amount of a Tiger Lake-U chip like the i7-1185G7) and is manufactured in 5nm at TSMC.

ModelApple M3 Pro 12-CoreApple M1 MaxApple M1
SeriesApple Apple M3Apple Apple M-SeriesApple Apple M-Series
Series: Apple M-Series
Apple M3 Max 16-Core2.75 - 4.06 GHz16 / 16 cores
Apple M3 Max 14-Core2.75 - 4.06 GHz14 / 14 cores
Apple M3 Pro 12-Core « 2.75 - 4.06 GHz12 / 12 cores
Apple M3 Pro 11-Core2.75 - 4.06 GHz11 / 11 cores
Apple M32.75 - 4.06 GHz8 / 8 cores
Apple M1 Max « 2.06 - 3.22 GHz10 / 10 cores48 MB L3
Apple M1 Pro2.06 - 3.22 GHz10 / 10 cores24 MB L3
Apple M1 Pro 8-Core2.06 - 3.22 GHz8 / 8 cores16 MB L3
Apple M12.06 - 3.22 GHz8 / 8 cores8 MB L3
Apple M1 Max2.06 - 3.22 GHz10 / 10 cores48 MB L3
Apple M1 Pro2.06 - 3.22 GHz10 / 10 cores24 MB L3
Apple M1 Pro 8-Core2.06 - 3.22 GHz8 / 8 cores16 MB L3
Apple M1 « 2.06 - 3.22 GHz8 / 8 cores8 MB L3
Clock2748 - 4056 MHz2060 - 3220 MHz2064 - 3220 MHz
Cores / Threads12 / 12
6 x 4.1 GHz Apple M3 P-Core
6 x 2.7 GHz Apple M3 E-Core
10 / 108 / 8
TDP27 Watt
Transistors37000 Million57000 Million16000 Million
Technology3 nm5 nm5 nm
FeaturesARMv8 Instruction SetARMv8 Instruction SetARMv8 Instruction Set
iGPUApple M3 Pro 18-Core GPUApple M1 Max 32-Core GPUApple M1 8-Core GPU
ArchitectureARMARMARM
Announced
Manufacturerwww.apple.com
L1 Cache2.9 MB2 MB
L2 Cache28 MB16 MB
L3 Cache48 MB8 MB

Benchmarks

Cinebench 2024 - CB24 CPU Single Core
143 Points (99%)
77%
1 M1 +
110 Points (76%)
Cinebench 2024 - CB24 CPU Multi Core
1059 Points (20%)
42%
1 M1 +
444 Points (8%)
Cinebench R23 - Cinebench R23 Multi Core
15106 Points (14%)
min: 12385     avg: 12389     median: 12386 (12%)     max: 12396 Points
52%
M1 +
min: 7409     avg: 7728     median: 7800.5 (7%)     max: 7830 Points
Cinebench R23 - Cinebench R23 Single Core
1977 Points (84%)
min: 1530     avg: 1533     median: 1533 (65%)     max: 1536 Points
77%
M1 +
min: 1496     avg: 1512     median: 1514.5 (64%)     max: 1520 Points
Cinebench R20 - Cinebench R20 CPU (Single Core)
100%
1 M1 Max +
min: 390     avg: 393.3     median: 395 (44%)     max: 395 Points
102%
1 M1 +
min: 401     avg: 403     median: 402.5 (45%)     max: 406 Points
Cinebench R20 - Cinebench R20 CPU (Multi Core)
100%
1 M1 Max +
min: 2735     avg: 2746     median: 2750 (7%)     max: 2753 Points
76%
1 M1 +
min: 1863     avg: 2040     median: 2093.5 (5%)     max: 2109 Points
Cinebench R15 - Cinebench R15 CPU Multi 64 Bit
2163 Points (14%)
min: 1689     avg: 1691     median: 1691 (11%)     max: 1693 Points
50%
M1 +
min: 1020     avg: 1063     median: 1072 (7%)     max: 1087 Points
Cinebench R15 - Cinebench R15 CPU Single 64 Bit
100%
1 M1 Max +
min: 197     avg: 202.3     median: 200 (60%)     max: 210 Points
104%
1 M1 +
min: 206     avg: 207.3     median: 208 (63%)     max: 208 Points
7-Zip 18.03 - 7-Zip 18.03 Multli Thread 4 runs
100%
1 M1 +
34614 MIPS (20%)
7-Zip 18.03 - 7-Zip 18.03 Single Thread 4 runs
100%
1 M1 +
5441 MIPS (65%)
Blender - Blender 3.3 Classroom CPU *
314 Seconds (4%)
91%
1 M1 +
964 Seconds (12%)
Blender - Blender 2.79 BMW27 CPU *
327 Seconds (2%)
min: 187     avg: 188.7     median: 189 (1%)     max: 190 Seconds
98%
M1 +
min: 412     avg: 561     median: 561 (4%)     max: 710 Seconds
R Benchmark 2.5 - R Benchmark 2.5 *
100%
1 M1 +
0.7 sec (16%)
3DMark - 3DMark Sling Shot Extreme (ES 3.1) Unlimited Physics
100%
1 M1 +
2711 Points (32%)
3DMark - 3DMark Sling Shot (ES 3.0) Unlimited Physics
100%
1 M1 +
min: 1956     avg: 3137     median: 3136.5 (36%)     max: 4317 Points
Geekbench 6.2 - Geekbench 6.2 Single-Core
3138 Points (84%)
75%
1 M1 +
2363 Points (64%)
Geekbench 6.2 - Geekbench 6.2 Multi-Core
15480 Points (61%)
56%
1 M1 +
8622 Points (34%)
Geekbench 5.5 - Geekbench 5.1 - 5.4 64 Bit Single-Core
2327 Points (98%)
min: 1764     avg: 1780     median: 1782 (75%)     max: 1795 Points
Geekbench 5.5 - Geekbench 5.1 - 5.4 64 Bit Multi-Core
15298 Points (27%)
min: 12563     avg: 12656     median: 12697 (23%)     max: 12708 Points
Mozilla Kraken 1.1 - Kraken 1.1 Total Score *
376.2 ms (0%)
min: 404.3     avg: 459.2     median: 482.3 (1%)     max: 491.1 ms
100%
M1 +
min: 418     avg: 473.8     median: 483 (1%)     max: 516 ms
Sunspider - Sunspider 1.0 Total Score *
100%
1 M1 +
min: 65.2     avg: 75.9     median: 76.4 (1%)     max: 86.1 ms
Octane V2 - Octane V2 Total Score
96501 Points (87%)
min: 66938     avg: 68647     median: 68029 (61%)     max: 70973 Points
65%
M1 +
min: 62055     avg: 63340     median: 62589.5 (56%)     max: 66974 Points
WebXPRT 4 - WebXPRT 4 Score
100%
1 M1 +
189 Points (54%)
WebXPRT 3 - WebXPRT 3 Score
427 Points (89%)
min: 350     avg: 358.7     median: 360 (75%)     max: 366 Points
66%
M1 +
min: 216     avg: 266.3     median: 280.5 (58%)     max: 304 Points
AnTuTu v8 - AnTuTu v8 UX
100%
1 M1 +
min: 104389     avg: 105297     median: 105297 (88%)     max: 106205 Points
AnTuTu v8 - AnTuTu v8 MEM
100%
1 M1 +
min: 110874     avg: 111266     median: 111266 (90%)     max: 111658 Points
AnTuTu v8 - AnTuTu v8 GPU
100%
1 M1 +
min: 533978     avg: 539206     median: 539206 (99%)     max: 544434 Points
AnTuTu v8 - AnTuTu v8 CPU
100%
1 M1 +
min: 267169     avg: 271808     median: 271808 (98%)     max: 276446 Points
AnTuTu v8 - AnTuTu v8 Total Score
100%
1 M1 +
min: 1017190     avg: 1027580     median: 1027580 (99%)     max: 1037960 Points
Antutu v9 - AnTuTu v9 Total Score
100%
1 M1 +
min: 1040910     avg: 1113810     median: 1113810 (67%)     max: 1186710 Points
Antutu v9 - AnTuTu v9 CPU
100%
1 M1 +
min: 244643     avg: 254253     median: 254252 (70%)     max: 263862 Points
CrossMark - CrossMark Overall
1977 Points (76%)
min: 1586     avg: 1607     median: 1615 (62%)     max: 1621 Points
65%
M1 +
min: 1266     avg: 1301     median: 1283 (49%)     max: 1355 Points
Power Consumption - Prime95 Power Consumption - external Monitor *
100%
1 M1 Max +
50.8 Watt (9%)
Power Consumption - Cinebench R15 Multi Power Consumption - external Monitor *
47.9 Watt (9%)
99%
1 M1 Max +
53 Watt (10%)
104%
1 M1 +
27.2 Watt (5%)
Power Consumption - Geekbench 5.5 Power Consumption 150cd *
100%
1 M1 +
min: 8.23     avg: 8.7     median: 8.5 (4%)     max: 9.49 Watt
Power Consumption - Idle Power Consumption - external Monitor *
5.8 Watt (4%)
96%
1 M1 Max +
11.6 Watt (8%)
102%
1 M1 +
3 Watt (2%)
Power Consumption - Idle Power Consumption 150cd 1min *
7.5 Watt (8%)
105%
1 M1 +
min: 2.29     avg: 2.9     median: 3.1 (3%)     max: 3.22 Watt
Power Consumption - Cinebench R15 Multi Power Efficiency - external Monitor
45.2 Points per Watt (34%)
71%
1 M1 Max +
31.9 Points per Watt (24%)
83%
1 M1 +
37.5 Points per Watt (28%)

Average Benchmarks Apple M3 Pro 12-Core → 100% n=10

Average Benchmarks Apple M1 Max → 83% n=10

Average Benchmarks Apple M1 → 70% n=10

- Range of benchmark values for this graphics card
- Average benchmark values for this graphics card
* Smaller numbers mean a higher performance
1 This benchmark is not used for the average calculation

v1.26
log 01. 20:40:50

#0 checking url part for id 15115 +0s ... 0s

#1 checking url part for id 13843 +0s ... 0s

#2 checking url part for id 12937 +0s ... 0s

#3 not redirecting to Ajax server +0s ... 0s

#4 did not recreate cache, as it is less than 5 days old! Created at Sat, 01 Jun 2024 05:37:57 +0200 +0.001s ... 0.001s

#5 composed specs +0.045s ... 0.046s

#6 did output specs +0s ... 0.046s

#7 getting avg benchmarks for device 15115 +0.002s ... 0.049s

#8 got single benchmarks 15115 +0.007s ... 0.056s

#9 getting avg benchmarks for device 13843 +0.003s ... 0.059s

#10 got single benchmarks 13843 +0.01s ... 0.068s

#11 getting avg benchmarks for device 12937 +0.003s ... 0.071s

#12 got single benchmarks 12937 +0.017s ... 0.088s

#13 got avg benchmarks for devices +0s ... 0.088s

#14 min, max, avg, median took s +0.171s ... 0.259s

#15 return log +0s ... 0.259s

Please share our article, every link counts!
> Expert Reviews and News on Laptops, Smartphones and Tech Innovations > Benchmarks / Tech > Processor Comparison - Head 2 Head
Redaktion, 2017-09- 8 (Update: 2023-07- 1)