Qualcomm Adreno 320 vs Qualcomm Adreno 530 vs Qualcomm Adreno 306
Qualcomm Adreno 320 ► remove from comparison
The Qualcomm Adreno 320 is a GPU for smartphones and tablets that is integrated into Qualcomm SoCs. It was introduced in the end of 2012 and was primarily used for Android devices. The graphics card uses a technology called FlexRender. It can switch "intelligently" switch between TBR (TBR Tile Based Renderer) and the classic direct rendering.
The Adreno 320 has Unified Shaders and supports OpenGL ES 3.0. The performance compared to the Adreno 200-series is supposed to be improved by the factor 3-4.
The Adreno 320 is used in Snapdragon S4 SoCs like the AQP8064 .
Qualcomm Adreno 530 ► remove from comparison
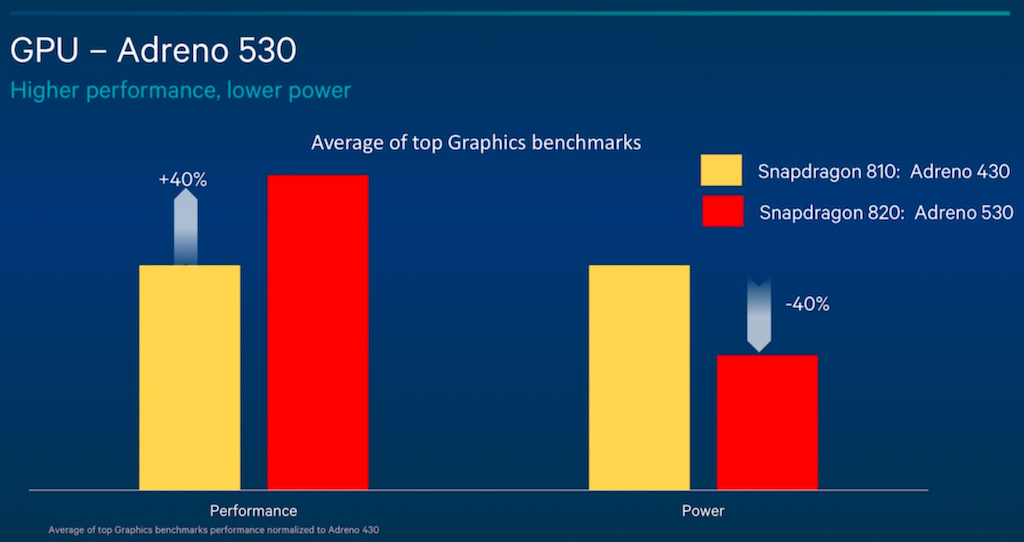
The Qualcomm Adreno 530 is an integrated graphics card for (mostly Android based) smartphones and tablets . It was introduced in the last quarter of 2015 and is integrated in the Qualcomm Snapdragon 820 SoC. It supports OpenGL ES 3.1 and DirectX 11.1.
The GPU uses a still unknown amount of unified shaders clocked at up to 624 MHz. In 2015 it belongs to the fastest GPU for smartphones. Compared to the predecessor Adreno 430 , the 530 is especially faster in demanding benchmarks.
Qualcomm Adreno 306 ► remove from comparison
The Qualcomm Adreno 306 is an integrated graphics unit for smartphones and tablets that is used for mainstream SoCs of the Qualcomm Snapdragon 410-series (e.g., Snapdragon 410 MSM8916 ). According the Qualcomm, the Adreno 306 offers a reduced power consumption compared to the older Adreno 305 .
The performance looks to be on par with the older Adreno 305 (at least in our review of a HTC Desire 510) leading to the assumtion that the technical specifications should be similar.
Qualcomm Adreno 320 Qualcomm Adreno 530 Qualcomm Adreno 306 Adreno 300 Series Pipelines 16 - unified 6 - unified Core Speed 400 MHz 624 MHz 450 MHz Shared Memory yes yes yes API DirectX 9_3, OpenGL ES 3.0 DirectX 11.1, OpenGL ES 3.1 AEP DirectX 9.3, OpenGL ES 3.0 technology 28 nm 14 nm 28 nm Date of Announcement 27.02.2012 15.12.2015 01.09.2012 Features OpenGL ES 3.1 AEP, OpenCL 2.0, Direct3D 11.1 (FL 11_1) Open CL 1.1e, Renderscript
Benchmarks 3DMark - 3DMark Ice Storm Unlimited Graphics
min: 10423 avg: 10644 median: 10644 (1%) max: 10865 Points
min: 24310 avg: 32869 median: 32997 (4%) max: 40761 Points
min: 2190 avg: 3801 median: 3838 (0%) max: 4037 Points
3DMark - 3DMark Ice Storm Extreme Graphics
min: 4928 avg: 5903 median: 5689 (1%) max: 7322 Points
0 Points (0%)
min: 2091 avg: 2184 median: 2190.5 (0%) max: 2234 Points
3DMark - 3DMark Ice Storm Graphics
min: 8859 avg: 10627 median: 10616 (1%) max: 12167 Points
0 Points (0%)
min: 4692 avg: 4772 median: 4758.5 (1%) max: 4915 Points
3DMark - 3DMark Sling Shot (ES 3.0) Unlimited
min: 2649 avg: 3348 median: 3425 (15%) max: 3806 Points
min: 185 avg: 191.5 median: 187.5 (1%) max: 206 Points
3DMark - 3DMark Sling Shot (ES 3.0) Unlimited Graphics
min: 3401 avg: 4503 median: 4661.5 (10%) max: 5006 Points
min: 153 avg: 158.8 median: 156 (0%) max: 170 Points
3DMark - 3DMark Sling Shot Extreme (ES 3.1) Unlimited
min: 2252 avg: 2605 median: 2594.5 (13%) max: 2893 Points
0 Points (0%)
3DMark - 3DMark Sling Shot Extreme (ES 3.1) Unlimited Graphics
min: 2488 avg: 2996 median: 3108 (9%) max: 3253 Points
0 Points (0%)
GFXBench - GFXBench 5.0 Aztec Ruins High Tier Offscreen
min: 7.1 avg: 8.4 median: 7.2 (1%) max: 11 fps
GFXBench - GFXBench 5.0 Aztec Ruins Normal Tier Offscreen
min: 15 avg: 17.7 median: 19 (1%) max: 19 fps
GFXBench - GFXBench Car Chase Offscreen
min: 14 avg: 18.3 median: 19 (2%) max: 20 fps
min: avg: 0 (0%) max: 0 fps
GFXBench 3.1 - GFXBench Manhattan ES 3.1 Offscreen
min: 12 avg: 28.6 median: 31 (1%) max: 34.02 fps
0 fps (0%)
GFXBench 3.0 - GFXBench 3.0 Manhattan Offscreen
4.3 fps (0%)
min: 26 avg: 43 median: 44.5 (3%) max: 49 fps
min: 1.7 avg: 2 median: 1.8 (0%) max: 4.3 fps
GFXBench (DX / GLBenchmark) 2.7 + Qualcomm Adreno 320 GFXBench (DX / GLBenchmark) 2.7 - GFXBench T-Rex HD Offscreen C24Z16
min: 8.3 avg: 12.9 median: 13 (0%) max: 16.5 fps
GFXBench T-Rex HD Offscreen C24Z16 + Qualcomm Adreno 530
min: 47.19 avg: 83.3 median: 88 (1%) max: 96 fps
GFXBench T-Rex HD Offscreen C24Z16 + Qualcomm Adreno 306 min: 2.8 avg: 5.5 median: 5.3 (0%) max: 9.8 fps
AnTuTu 3DRating - 3DRating V4.0 for OpenGL ES 2.0
3180 Points (24%)
AnTuTu 3DRating - Antutu 3DRating Off-screen
min: 1618 avg: 2029 median: 2080 (72%) max: 2511 Points
AnTuTu 3DRating - Antutu 3DRating Score
min: 3555 avg: 5151 median: 5391 (47%) max: 6115 Points
AnTuTu v3 - AnTuTu v3 GPU
min: 5474 avg: 7422 median: 7324 (76%) max: 9072 Points
Basemark ES 2.0 - Basemark ES 2.0
min: 34.79 avg: 47.1 median: 45.8 (76%) max: 60.6 fps
min: 25.31 avg: 37 median: 37 (61%) max: 48.73 fps
Basemark X 1.0 - Basemark X 1.0 Off-Screen
min: 5.836 avg: 7 median: 6.8 (32%) max: 8.298 fps
Basemark X 1.1 - Basemark X 1.1 High Quality
min: 4700 avg: 5400 median: 5400 (12%) max: 6100 Points
min: 21420 avg: 30602 median: 33028 (75%) max: 35449 Points
min: 1839 avg: 1867 median: 1880 (4%) max: 1881 Points
Basemark X 1.1 - Basemark X 1.1 Medium Quality
min: 10600 avg: 11550 median: 11550 (26%) max: 12500 Points
min: 28538 avg: 37215 median: 38353 (85%) max: 41500 Points
min: 3855 avg: 3993 median: 4014 (9%) max: 4087 Points
NenaMark2 - NenaMark2 Score
min: 59 avg: 59.9 median: 59.8 (89%) max: 61.3 fps
min: 54.6 avg: 57.3 median: 57.3 (85%) max: 59.9 fps
PassMark PerformanceTest Mobile V1 - PerformanceTest Mobile V1 2D Graphics Tests
min: 1880 avg: 2327 median: 2421 (2%) max: 2778 Points
min: 4781 avg: 5512 median: 5612.5 (6%) max: 6042 Points
min: 2745 avg: 2822 median: 2792 (3%) max: 2929 Points
PassMark PerformanceTest Mobile V1 - PerformanceTest Mobile V1 3D Graphics Tests
min: 737 avg: 949 median: 935 (2%) max: 1179 Points
min: 1913 avg: 2183 median: 2178.5 (4%) max: 2461 Points
min: 665 avg: 756 median: 791 (1%) max: 811 Points
Smartbench 2012 - Smartbench 2012 Gaming Index
min: 2049 avg: 3032 median: 3024.5 (66%) max: 4213 Points
4410 Points (96%)
min: 2978 avg: 3534 median: 3295 (72%) max: 4266 Points
Average Benchmarks Qualcomm Adreno 320 → 100% n=10 Average Benchmarks Qualcomm Adreno 530 → 358% n=10 Average Benchmarks Qualcomm Adreno 306 → 58% n=10
- Range of benchmark values for this graphics card
- Average benchmark values for this graphics card
* Smaller numbers mean a higher performance
1 This benchmark is not used for the average calculation
Game Benchmarks The following benchmarks stem from our benchmarks of review laptops. The performance depends on the used graphics memory, clock rate, processor, system settings, drivers, and operating systems. So the results don't have to be representative for all laptops with this GPU. For detailed information on the benchmark results, click on the fps number.
175%
Adreno 530:
0 (!) [X] HTC U Ultra Qualcomm Snapdragon 821 MSM8996 Pro 2.4GHz
Adreno 530
30 [X] HTC 10 Qualcomm Snapdragon 820 MSM8996 2.2GHz
Adreno 530
min:
25 fps, max:
32 fps
30 30 30 [X] LG G6 Qualcomm Snapdragon 821 MSM8996 Pro 2.4GHz
Adreno 530
56 58 59 [X] OnePlus 3T Qualcomm Snapdragon 821 MSM8996 Pro 2.4GHz
Adreno 530
59 60 [X] Lenovo Moto Z Qualcomm Snapdragon 820 MSM8996 2.2GHz
Adreno 530
min:
50 fps, max:
61 fps
60 ~ 43 fps
126%
Adreno 306:
30 [X] LG K10 Qualcomm Snapdragon 410 MSM8916 1.4GHz
Adreno 306
30 30 30 35 ~ 31 fps
121%
Adreno 306:
29 31 ~ 30 fps
107%
Adreno 530:
0 (!) [X] HTC U Ultra Qualcomm Snapdragon 821 MSM8996 Pro 2.4GHz
Adreno 530
29 [X] Lenovo Moto Z Qualcomm Snapdragon 820 MSM8996 2.2GHz
Adreno 530
min:
27 fps, max:
30 fps
29 29 30 [X] OnePlus 3 Qualcomm Snapdragon 820 MSM8996 2.2GHz
Adreno 530
30 30 30 [X] OnePlus 3T Qualcomm Snapdragon 821 MSM8996 Pro 2.4GHz
Adreno 530
30 30 30 [X] LG G6 Qualcomm Snapdragon 821 MSM8996 Pro 2.4GHz
Adreno 530
30 30 [X] ZTE Axon M Qualcomm Snapdragon 821 MSM8996 Pro 2.4GHz
Adreno 530
48 [X] HTC 10 Qualcomm Snapdragon 820 MSM8996 2.2GHz
Adreno 530
min:
30 fps, max:
50 fps
~ 29 fps
56%
Adreno 306:
14 15 16 [X] LG K10 Qualcomm Snapdragon 410 MSM8916 1.4GHz
Adreno 306
16 16 ~ 15 fps
205%
Adreno 530:
35 [X] OnePlus 3 Qualcomm Snapdragon 820 MSM8996 2.2GHz
Adreno 530
min:
28 fps, max:
42 fps
51 ~ 43 fps
Average Gaming Qualcomm Adreno 320 → 100% Average Gaming 30-70 fps → 100%
Average Gaming Qualcomm Adreno 530 → 149% Average Gaming 30-70 fps → 172%
Average Gaming Qualcomm Adreno 306 → 101% Average Gaming 30-70 fps → 126%
Qualcomm Adreno 530 low med. high ultra QHD 4K Dead Trigger 2 43 Asphalt 8: Airborne 30 29 Real Racing 3 60 43 < 30 fps < 60 fps < 120 fps ≥ 120 fps 1 1 1 2
Qualcomm Adreno 306 low med. high ultra QHD 4K Dead Trigger 2 31 Asphalt 8: Airborne 30 15 < 30 fps < 60 fps < 120 fps ≥ 120 fps 1 1 1
For more games that might be playable and a list of all games and graphics cards visit our Gaming List
v1.26
log 26. 10:14:51
#0 checking url part for id 3557 +0s ... 0s
#1 checking url part for id 7062 +0s ... 0s
#2 checking url part for id 5961 +0s ... 0s
#3 not redirecting to Ajax server +0s ... 0s
#4 did not recreate cache, as it is less than 5 days old! Created at Thu, 25 Apr 2024 05:40:10 +0200 +0.001s ... 0.001s
#5 composed specs +0.119s ... 0.12s
#6 did output specs +0s ... 0.12s
#7 start showIntegratedCPUs +0s ... 0.12s
#8 getting avg benchmarks for device 3557 +0.036s ... 0.156s
#9 got single benchmarks 3557 +0.034s ... 0.19s
#10 getting avg benchmarks for device 7062 +0.002s ... 0.192s
#11 got single benchmarks 7062 +0.052s ... 0.244s
#12 getting avg benchmarks for device 5961 +0.002s ... 0.246s
#13 got single benchmarks 5961 +0.064s ... 0.31s
#14 got avg benchmarks for devices +0s ... 0.31s
#15 No cached benchmark found, getting uncached values +0.039s ... 0.349s
#16 No cached benchmark found, getting uncached values +0.012s ... 0.362s
#17 No cached benchmark found, getting uncached values +0.024s ... 0.386s
#18 No cached benchmark found, getting uncached values +0.008s ... 0.394s
#19 No cached benchmark found, getting uncached values +0.009s ... 0.403s
#20 No cached benchmark found, getting uncached values +0.004s ... 0.407s
#21 min, max, avg, median took s +0.047s ... 0.453s
#22 before gaming benchmark output +0s ... 0.453s
#23 Got 64 rows for game benchmarks. +0.026s ... 0.48s
#24 composed SQL query for gamebenchmarks +0s ... 0.48s
#25 got data and put it in $dataArray +0.003s ... 0.483s
#26 benchmarks composed for output. +0.017s ... 0.5s
#27 calculated avg scores. +0s ... 0.5s
#28 return log +0.002s ... 0.503s
Please share our article, every link counts!
Redaktion, 2017-09- 8 (Update: 2023-07- 1)
 Deutsch
 English
 Español
 Français
 Italiano
 Nederlands
 Polski
 Português
 Русский
 Türkçe
 Svenska
 Chinese
 Magyar