 Deutsch
 English
 Español
 Français
 Italiano
 Nederlands
 Polski
 Português
 Русский
 Türkçe
 Svenska
 Chinese
 Magyar
Apple A9 vs Apple M3 Pro 11-Core vs Apple M3 Pro 12-Core
Apple A9
► remove from comparison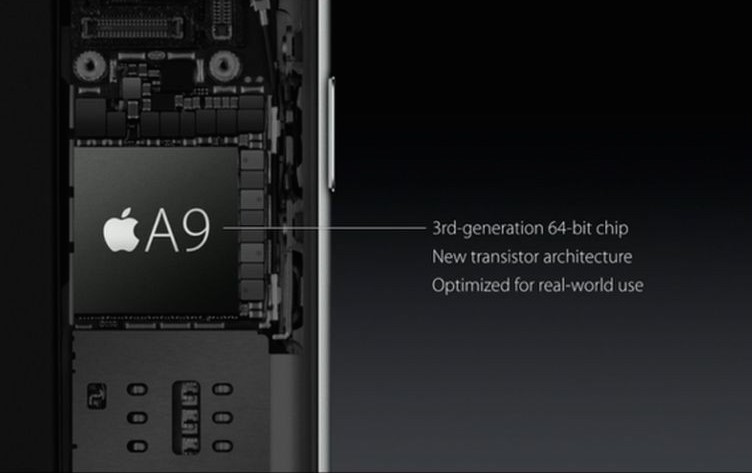
The Apple A9 is a high-end dual-core ARM SoC for smartphones. It was announced in Sept. 2015 in the new iPhone 6s and 6s Plus. Technical details were not published, but the CPU part should be about 70% and the GPU 90% faster than the previous Apple A8. Therefore, the performance should be on par with high-end Android SoCs in 2015.
It is based on the third generation of Apples 64 Bit architectures (Cyclone 3?) and uses a "new transistor technology". It is manufactured at Samsung in 14nm (slightly smaller die) and TSMC at 16nm (both FINFET 3D transistors). A performance difference of both versions are not noticable.
Furthermore, the chip now integrates the M9 motion coprocessor and a 4K video de- and encoder (as the iPhones 6s supports 4K video recording). The integrated graphics card should be still based on PowerVR technology.
The power consumption could be lower than the A8 due to the new process technology and the fact that the iPhones now got a smaller battery (due to the haptic engine part).
Apple M3 Pro 11-Core
► remove from comparison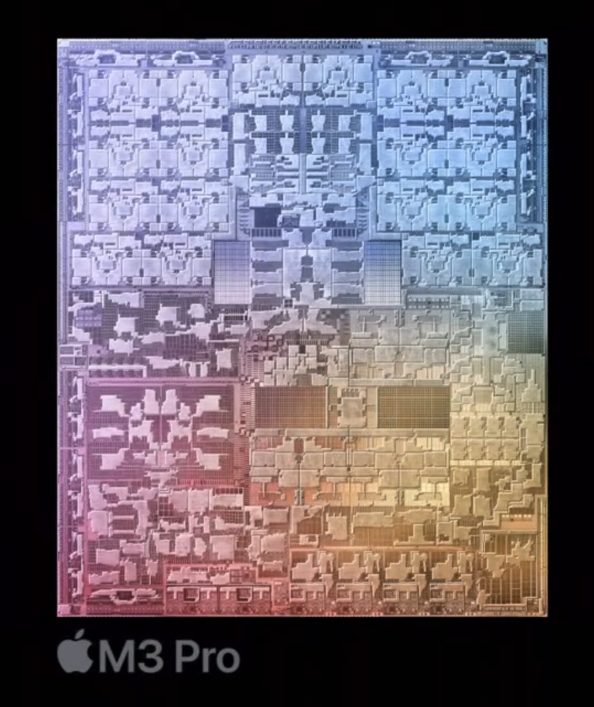
The Apple M3 Pro 11 Core is a system on a chip (SoC) from Apple for notebooks that was introduced late 2023. It integrates 11 of the 12 CPU cores with 5 of 6 performance cores with up to 4.06 GHz and 6 efficiency cores with 2.8 GHz.
Compared to the M2 Pro the M3 Pro has been slimmed down somewhat and swaps two performance cores for efficiency cores. This is due to the changed core configuration, as 6 cores are now used per cluster (the M2 Pro and M3 still have 4 cores per cluster). Furthermore, the memory bus has been reduced from 256 bits to 192 bits (150 GB/s vs. 200 GB/s). Thanks to the new architecture and higher clock rates, the new M3 Pro is still slightly faster.
The M3 Pro also integrates a new graphics card with dynamic caching, mesh shading and ray tracing acceleration via hardware. In the entry-level model, only 14 of the chip's 18 cores are used and support up to 3 displays simultaneously (internal and 2 external).
GPU and CPU can jointly access the shared memory on the package (unified memory). This is available in 18 or 36 GB variants and offers 150 GB/s maximum bandwidth (192 bit bus).
The integrated 16-core Neural Engine has also been revised and now offers 18 TOPS peak performance (compared to 15.8 TOPS in the M2 but 35 TOPS in the new A17 Pro). The video engine now also supports AV1 decoding in hardware. H.264, HEVC and ProRes (RAW) can still be decoded and encoded.
Unfortunately, the integrated WLAN only continues to support WiFi 6E (no WiFi 7), unlike the small M3 SoC thunderbolt 4 is also supported (max 40 Gbit/s).
The chip is manufactured in the current 3nm process (N3B) at TSMC and contains 37 billion transistors (-7.5% vs. Apple M2 Pro).
Apple M3 Pro 12-Core
► remove from comparison
The Apple M3 Pro (12 Core) is a system on a chip (SoC) from Apple for notebooks that was launched in late 2023. It integrates a new 12-core CPU with 6 performance cores with up to 4.06 GHz and 6 efficiency cores with 2.8 GHz. There is also a slimmed-down 11-core variant with a 14-core GPU.
Compared to the M2 Pro the M3 Pro has been slimmed down somewhat and swaps two performance cores for efficiency cores. This is due to the changed core configuration, as 6 cores are now used per cluster (the M2 Pro and M3 still have 4 cores per cluster). Furthermore, the memory bus has been reduced from 256 bits to 192 bits (150 GB/s vs. 200 GB/s). However, thanks to the new architecture and higher clock rates, the new M3 Pro is still slightly faster.
The M3 Pro also integrates a new graphics card with dynamic caching, mesh shading and ray tracing acceleration via hardware. In the top model, all 18 cores of the chip are used and support up to 3 displays simultaneously (internal and 2 external).
GPU and CPU can jointly access the shared memory on the package (unified memory). This is available in 18 or 36 GB variants and offers 150 GB/s maximum bandwidth (192 bit bus).
The integrated 16-core Neural Engine has also been revised and now offers 18 TOPS peak performance (compared to 15.8 TOPS in the M2 but 35 TOPS in the new A17 Pro). The video engine now also supports AV1 decoding in hardware. H.264, HEVC and ProRes (RAW) can still be decoded and encoded.
Unfortunately, the integrated WLAN only continues to support WiFi 6E (no WiFi 7), unlike the small M3 SoC thunderbolt 4 is also supported (max 40 Gbit/s).
The chip is manufactured in the current 3nm process (N3B) at TSMC and contains 37 billion transistors (-7.5% vs. Apple M2 Pro).
| Model | Apple A9 | Apple M3 Pro 11-Core | Apple M3 Pro 12-Core | ||||||||||||||||||||||||||||||||||||||||||||||||
| Series | Apple | Apple Apple M3 | Apple Apple M3 | ||||||||||||||||||||||||||||||||||||||||||||||||
| Codename | Cyclone 3 | ||||||||||||||||||||||||||||||||||||||||||||||||||
| Series: Apple M3 |
|
|
| ||||||||||||||||||||||||||||||||||||||||||||||||
| Clock | 1800 MHz | 2748 - 4056 MHz | 2748 - 4056 MHz | ||||||||||||||||||||||||||||||||||||||||||||||||
| Cores / Threads | 2 / 2 | 11 / 11 5 x 4.1 GHz Apple M3 P-Core 6 x 2.7 GHz Apple M3 E-Core | 12 / 12 6 x 4.1 GHz Apple M3 P-Core 6 x 2.7 GHz Apple M3 E-Core | ||||||||||||||||||||||||||||||||||||||||||||||||
| Technology | 14/16 nm | 3 nm | 3 nm | ||||||||||||||||||||||||||||||||||||||||||||||||
| Features | ARMv8 Instruction Set | ARMv8 Instruction Set | ARMv8 Instruction Set | ||||||||||||||||||||||||||||||||||||||||||||||||
| iGPU | Apple A9 / PowerVR GT7600 | Apple M3 Pro 14-Core GPU | Apple M3 Pro 18-Core GPU | ||||||||||||||||||||||||||||||||||||||||||||||||
| Architecture | ARM | ARM | ARM | ||||||||||||||||||||||||||||||||||||||||||||||||
| Announced | |||||||||||||||||||||||||||||||||||||||||||||||||||
| TDP | 27 Watt | 27 Watt | |||||||||||||||||||||||||||||||||||||||||||||||||
| Transistors | 37000 Million | 37000 Million | |||||||||||||||||||||||||||||||||||||||||||||||||
| Manufacturer | www.apple.com | www.apple.com |
