 Deutsch
 English
 Español
 Français
 Italiano
 Nederlands
 Polski
 Português
 Русский
 Türkçe
 Svenska
 Chinese
 Magyar
AMD A4-1350 vs Intel Atom N270
AMD A4-1350
► remove from comparison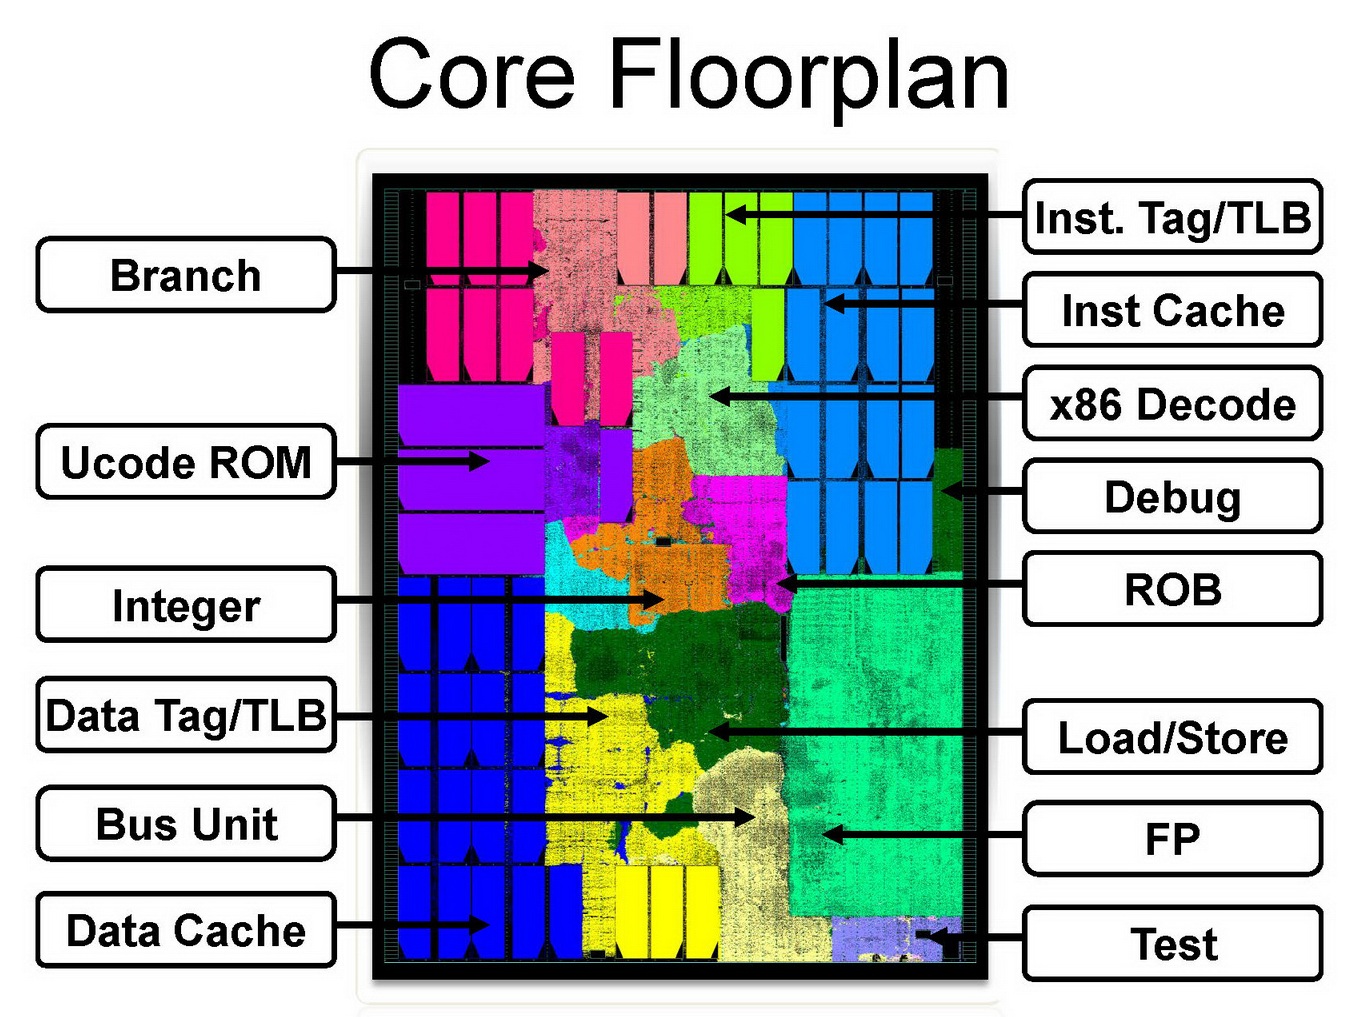
The AMD A4-1350 is a mobile quad-core SoC for compact subnotebooks and tablets introduced in mid-2013. In addition to having 4 CPU cores with a base clock speed of 1.0 GHz (no turbo), the 28nm chip also integrates a Radeon HD 8210 GPU, a single-channel DDR3-1066 memory controller and a Southbridge with various I/O- ports.
Architecture
Both Kabini (for notebooks) and Temash (tablets and compact subnotebooks) are based on AMD's new Jaguar architecture, which replaces the previous Bobcat models (e.g. the E-350). According to AMD, the performance per clock has been increased by about 15 percent. Furthermore, various modern instruction set extensions such as SSE up to version 4.2, AVX and AES are now supported. The finer 28nm production process from TSMC allows lower voltages and/or higher clock rates compared to Bobcat, as well as support for 4 CPU cores.
Performance
Due to the low clock speed of 1.0 GHz, the performance is modest in applications with poor parellization support. In this case, the A4-1350 will hardly surpass the old C-60. However, if all 4 cores are utilized effectively, performance becomes similar to the Sandy Bridge based Pentium 967. For basic office and multimedia tasks, the A4-1350 has sufficient power; however, it will quickly reach its limits in more demanding software.
Graphics
The SoC integrates a Radeon HD 8210 GPU with 128 shaders based on the GCN architecture. Clocked at 300 MHz, the HD 8210 matches a Radeon HD 6430M or Intel HD Graphics (Ivy Bridge). Recent games as of 2013 are therefore hardly playable. However, older and less demanding games will run fluently.
Power Consumption
The power consumption of the entire SoC is rated at 8 watts. Thus, the A4-1350 is suitable for slim subnotebooks or larger tablets.
Intel Atom N270
► remove from comparison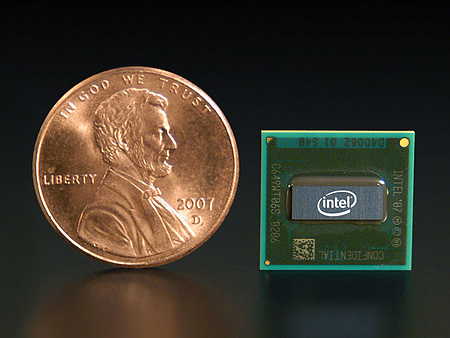
The Intel Atom N270 is a typical netbook single core CPU which is clocked at 1.6 GHz. The Atom core was designed for a low power consumption and cheap production. The downside is the relative low performance per Watt (due to the in-order execution) compared to similar clocked Celeron processors, e.g.. Still the integrated Hyper-Threading (the operating system sees the CPU as a dual core CPU) decreases the penalty of the in-order execution a bit.
The performance of the N270 is only compareable to a 1.2 GHz clocked Celeron M and therfore only sufficient for non demanding applications like Office or web surfing. HD videos, advanced photo editing, video cutting may not run fluently.
Due to the modern 45nm process (in 2009) and the small size, the power consumption is very low (2.5 Watt TDP). Therfore, the CPU does not need a good cooling system and can be used in very small designs (like Netbooks).
Package: 437-Ball-µFCBGA, 22 mm × 22 mm
| Model | AMD A4-1350 | Intel Atom N270 | ||||||||||||||||||||||||||||
| Series | AMD A-Series | Intel Atom | ||||||||||||||||||||||||||||
| Codename | Temash | DiamondVille | ||||||||||||||||||||||||||||
| Series: Atom DiamondVille |
|
| ||||||||||||||||||||||||||||
| Clock | 1000 MHz | 1600 MHz | ||||||||||||||||||||||||||||
| L1 Cache | 256 KB | 56 KB | ||||||||||||||||||||||||||||
| L2 Cache | 2 MB | 512 KB | ||||||||||||||||||||||||||||
| Cores / Threads | 4 / 4 | 1 / 2 | ||||||||||||||||||||||||||||
| TDP | 8 Watt | 2.5 Watt | ||||||||||||||||||||||||||||
| 28 nm | 45 nm, 0.9-1.1625 V | |||||||||||||||||||||||||||||
| Features | SSE (1, 2, 3, 3S, 4.1, 4.2, 4A), x86-64, AES, AVX, Single-Channel DDR3-1066 | MMX, SSE, SSE2, SSE3, SSSE3, HHT, Execute Disable Bit, Enhanced Speedstep, Hyper-Threading | ||||||||||||||||||||||||||||
| iGPU | AMD Radeon HD 8210 (300 MHz) | |||||||||||||||||||||||||||||
| Architecture | x86 | x86 | ||||||||||||||||||||||||||||
| Announced | ||||||||||||||||||||||||||||||
| FSB | 533 | |||||||||||||||||||||||||||||
| Transistors | 47 Million | |||||||||||||||||||||||||||||
| Die Size | 26 mm2 | |||||||||||||||||||||||||||||
| max. Temp. | 90 °C | |||||||||||||||||||||||||||||
| Socket | PBGA437 | |||||||||||||||||||||||||||||
| $44 U.S. | ||||||||||||||||||||||||||||||
| Manufacturer | ark.intel.com |
