Notebookcheck Logo

Apple A15 Bionic vs Qualcomm Snapdragon 888 5G vs Qualcomm Snapdragon 888 Plus 5G

Apple A15 Bionic

► remove from comparison Apple A15

The Apple A15 Bionic is a System on a Chip (SoC) from Apple that is found in the iPhone 13 and iPad Mini (2021) models. It was announced late 2021 and offers 6 cores divided in 2 performance cores and four power efficiency cores. The CPU performance increases only slightly compared to the A14, but GPU (in the higher end models) offers higher gains.

The chip is manufactured in 5nm and integrates 15.8 billion transistors (compared to the 11.8 of the A14).

Qualcomm Snapdragon 888 5G

► remove from comparison Qualcomm SD 888 5G

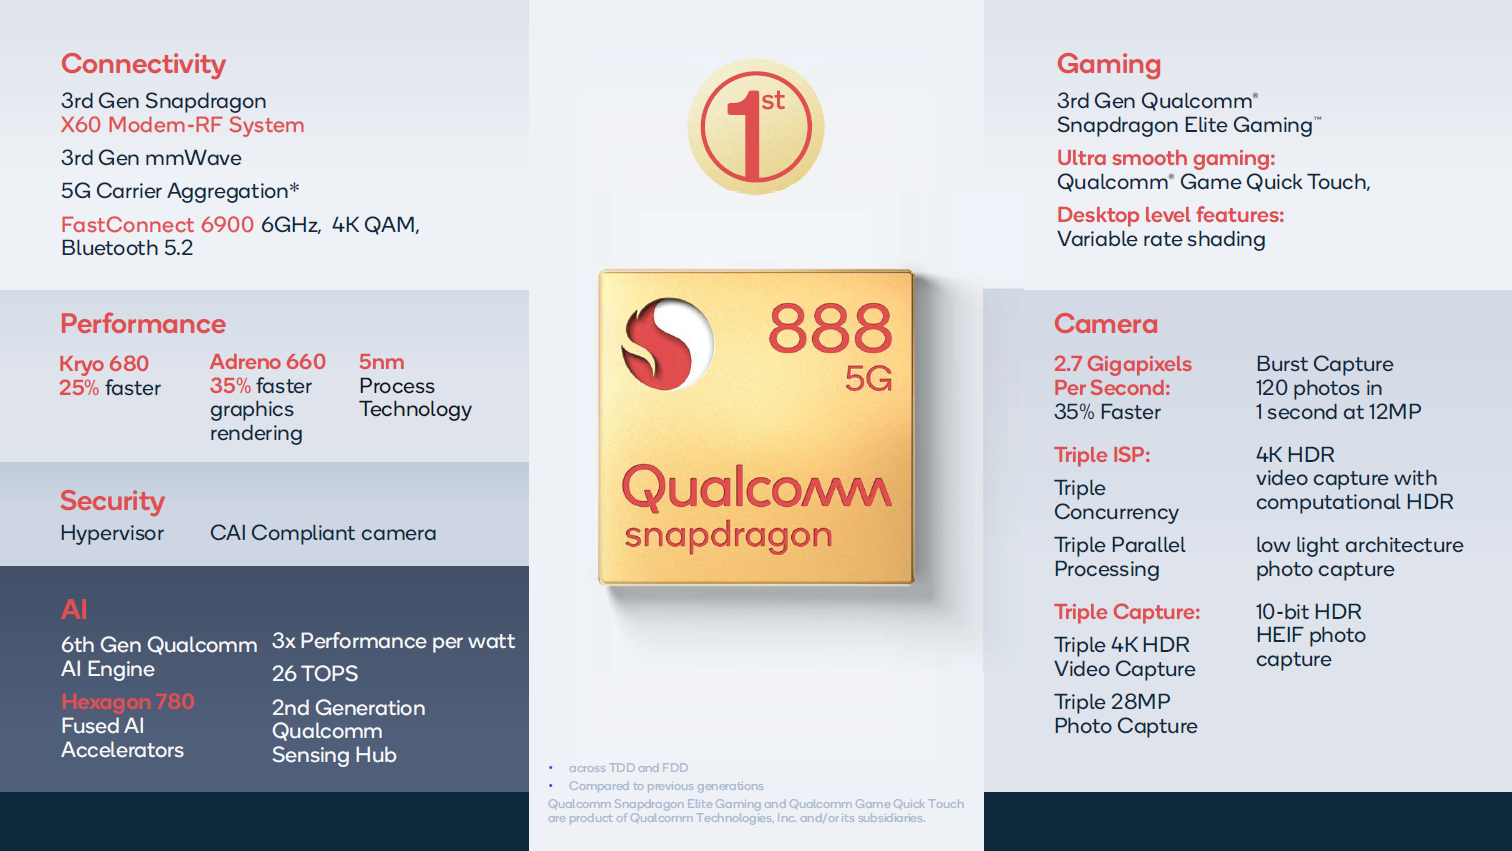
The Qualcomm Snapdragon 888 5G Mobile Platform is a high-end SoC for smartphones that was introduced in late 2020 and manufactured in 5 nm at Samsung. Integrates one “Prime Core” based on a ARM Cortex-X1 architecture clocked at up to 2.84 GHz. Three more performance cores are based on the A78 but clock up to 2.42 GHz. Furthermore, four energy saving cores are integrated that are based on the ARM Cortex-A55 architecture and clock at up to 1.8 GHz. In addition to the processor cores, the SoC integrates a WiFi 6e modem, a Hexagon 780 DSP (up to 26 TOPS of AI performance) and a Spectra 580 ISP. The integrated memory controller now supports faster LPDDR5 memory with up to 3,200 MHz. 5G is now included in the chip with the Snapdragon X60 modem.

The performance of the processor cores should be around 15% better than the old Snapdragon 865+. The integrated Adreon 660 GPU should make a bigger jump by 35% (most likely compared to the SD 865).

Qualcomm Snapdragon 888 Plus 5G

► remove from comparison Qualcomm SD 888+ 5G

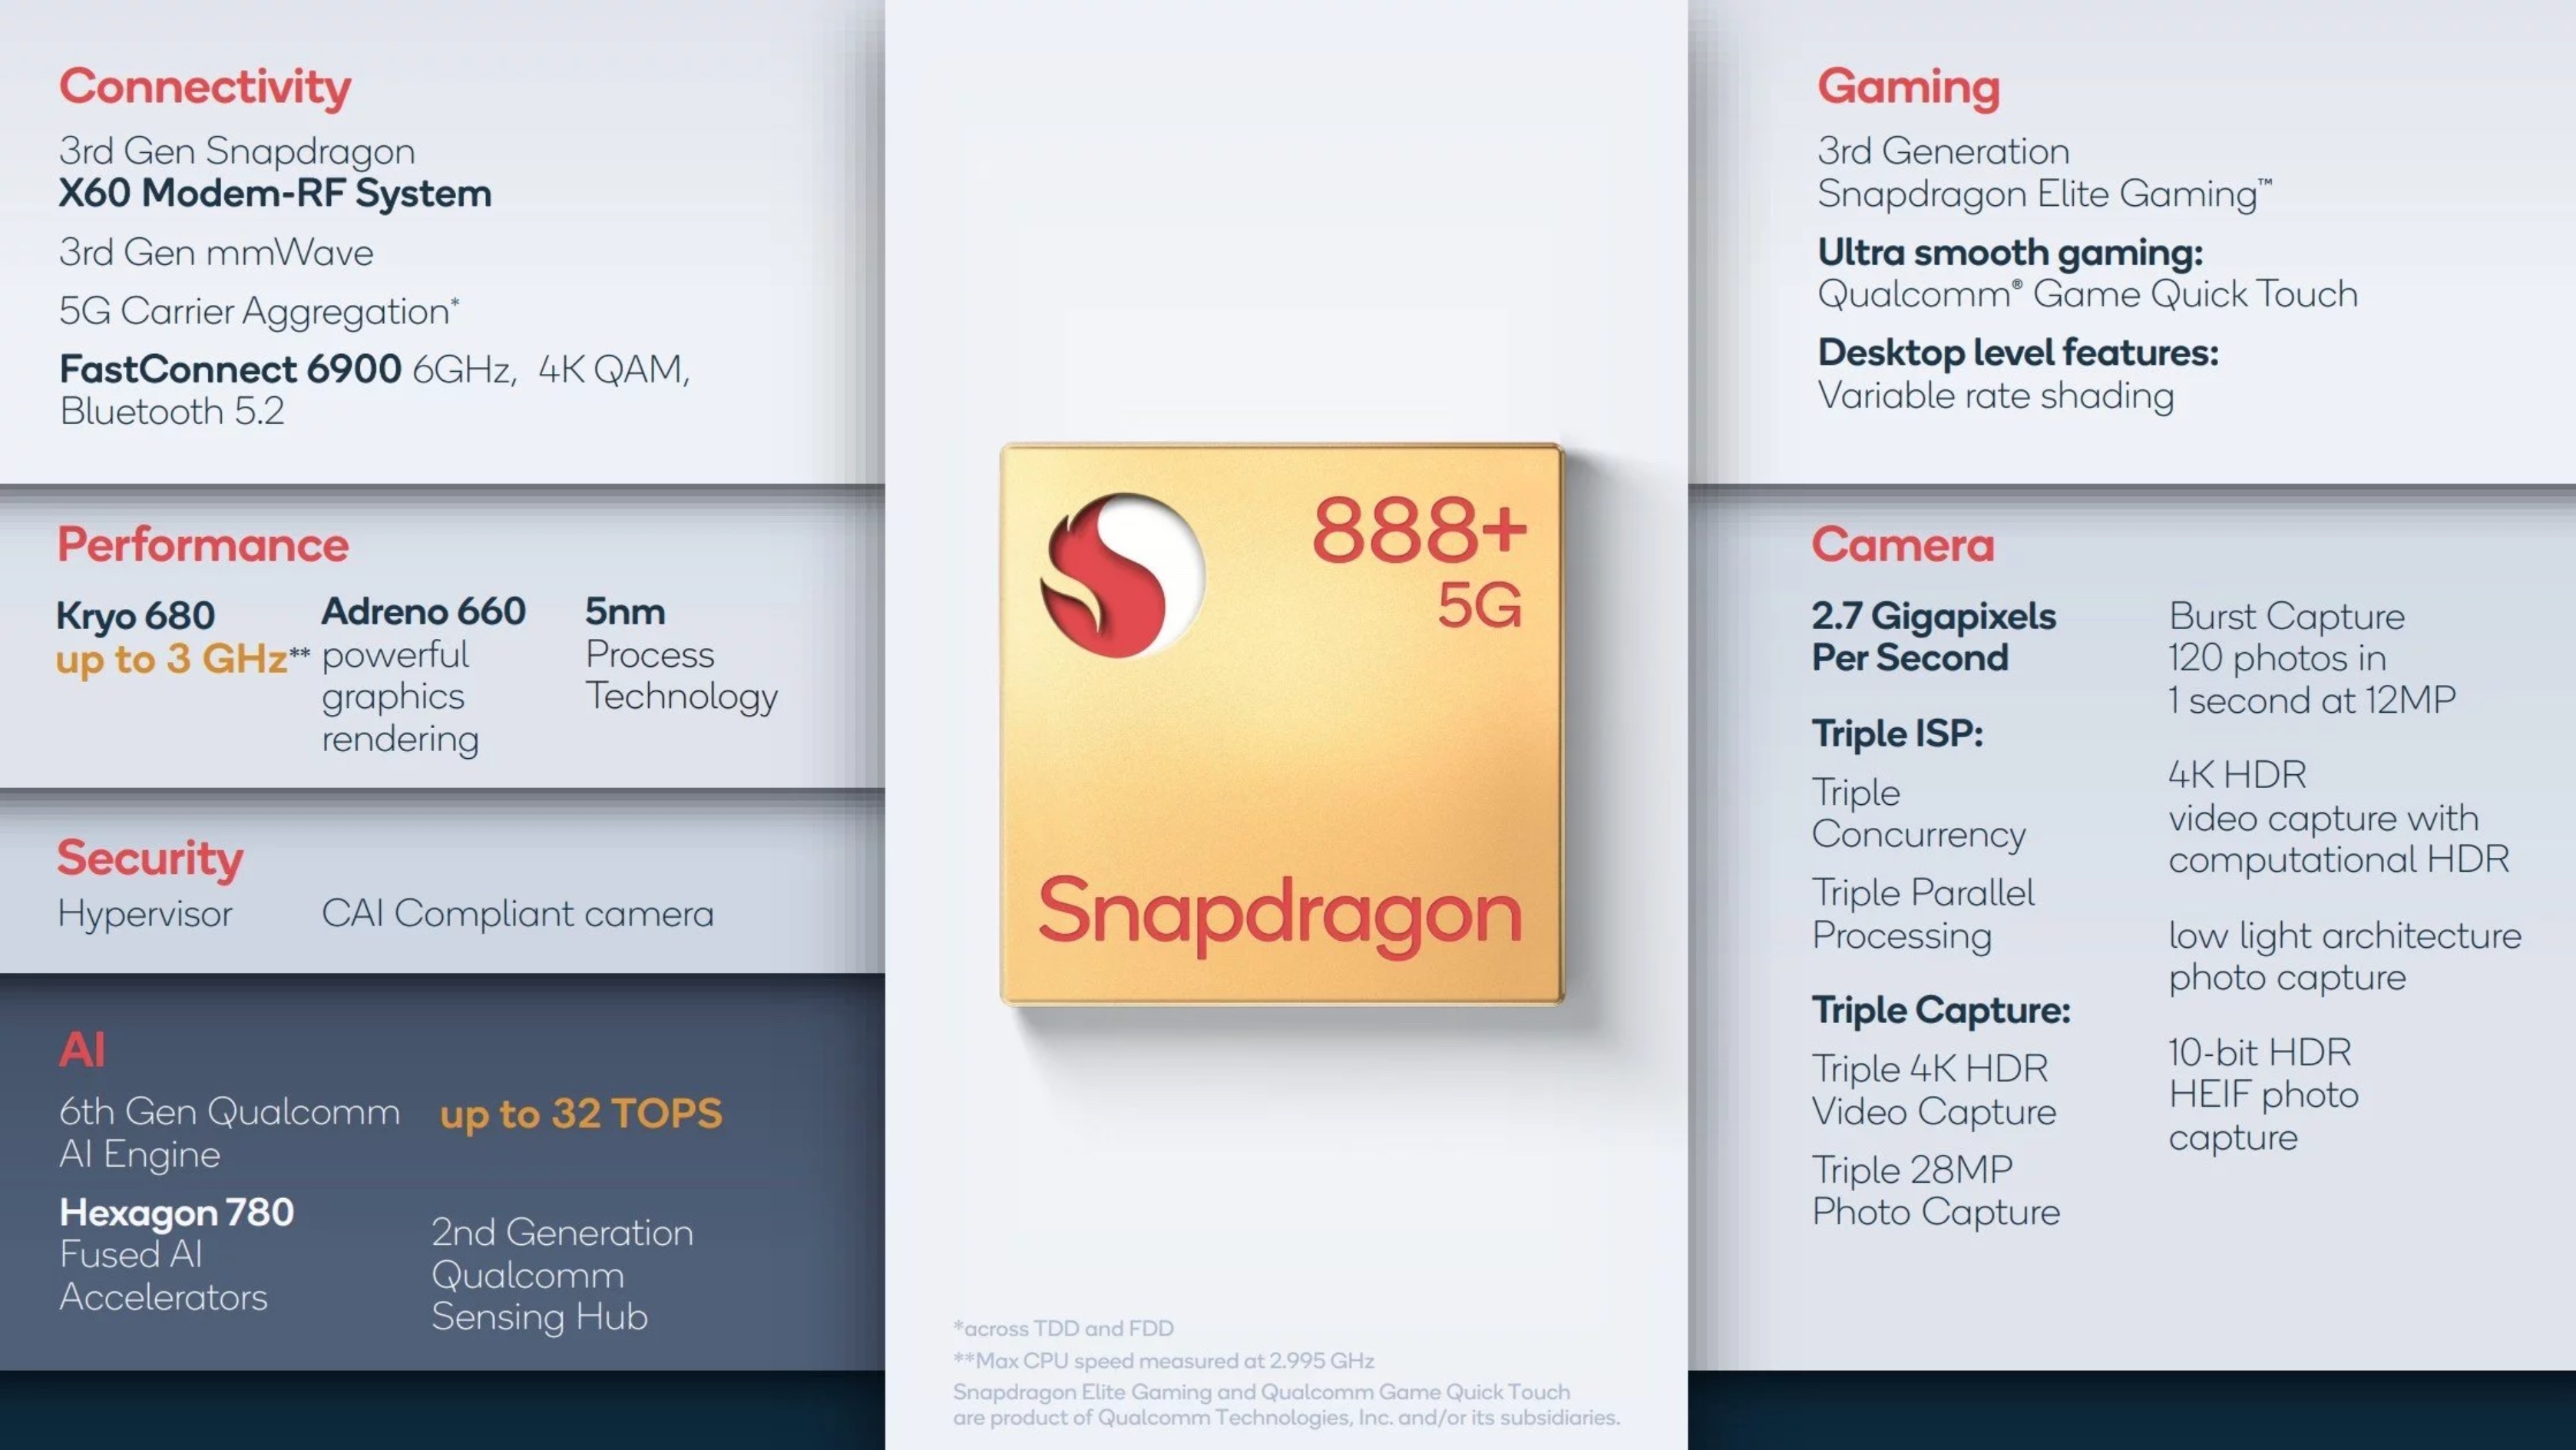
The Qualcomm Snapdragon 888+ (Plus) 5G Mobile Platform is a high-end SoC for smartphones that was introduced in mid 2021 and manufactured in 5 nm at Samsung. 

Integrates one “Prime Core” based on a ARM Cortex-X1 architecture clocked at up to 3 GHz. Three more performance cores are based on the A78 but clock up to 2.42 GHz. Furthermore, four energy saving cores are integrated that are based on the ARM Cortex-A55 architecture and clock at up to 1.8 GHz. In addition to the processor cores, the SoC integrates a WiFi 6e modem, a Hexagon 780 DSP (up to 26 TOPS of AI performance) and a Spectra 580 ISP. The integrated memory controller now supports faster LPDDR5 memory with up to 3,200 MHz. 5G is now included in the chip with the Snapdragon X60 modem.

Compared to the older Snapdragon 888, the 888+ offers a slightly higher clocked prime core (+160 MHz) and a 23% faster Hexagon 790 DSP. Therefore, it is now the fastest Android SoC (at the time of announcement), but still slightly slower (CPU and GPU) than the Apple A14 and A15 Bionic SoCs.

ModelApple A15 BionicQualcomm Snapdragon 888 5GQualcomm Snapdragon 888 Plus 5G
SeriesApple Apple A-SeriesQualcomm SnapdragonQualcomm Snapdragon
Series: Snapdragon Cortex-X1 / A78 / A55 (Kryo 680)
Apple A19 Pro2.6 - 4.26 GHz6 / 6 cores32 MB L3
Apple A192.6 - 4.26 GHz6 / 6 cores12 MB L3
Apple A18 Pro - 4 GHz6 / 6 cores
Apple A18 - 3.8 GHz6 / 6 cores
Apple A15 Bionic « 2.02 - 3.23 GHz6 / 6 cores32 MB L3
Apple A12 Bionic - 2.49 GHz6 / 6 cores
Apple A6x1.4 GHzcores
Apple A61 GHzcores
Qualcomm Snapdragon G3x Gen 11.8 - 3 GHz8 / 8 cores3 MB L3 Cortex-X1 / A78 / A55 (Kryo 680)
Qualcomm Snapdragon 888 Plus 5G1.8 - 3 GHz8 / 8 cores3 MB L3 Cortex-X1 / A78 / A55 (Kryo 680)
Qualcomm Snapdragon 888 5G « 1.8 - 2.84 GHz8 / 8 cores3 MB L3 Cortex-X1 / A78 / A55 (Kryo 680)
Qualcomm Snapdragon 888 4G1.8 - 2.84 GHz8 / 8 cores3 MB L3 Cortex-X1 / A78 / A55 (Kryo 680)
Qualcomm Snapdragon G3x Gen 11.8 - 3 GHz8 / 8 cores3 MB L3 Cortex-X1 / A78 / A55 (Kryo 680)
Qualcomm Snapdragon 888 Plus 5G « 1.8 - 3 GHz8 / 8 cores3 MB L3 Cortex-X1 / A78 / A55 (Kryo 680)
Qualcomm Snapdragon 888 5G1.8 - 2.84 GHz8 / 8 cores3 MB L3 Cortex-X1 / A78 / A55 (Kryo 680)
Qualcomm Snapdragon 888 4G1.8 - 2.84 GHz8 / 8 cores3 MB L3 Cortex-X1 / A78 / A55 (Kryo 680)
Clock2020 - 3230 MHz1800 - 2840 MHz1800 - 3000 MHz
L2 Cache16 MB
L3 Cache32 MB3 MB3 MB
Cores / Threads6 / 68 / 8
1 x 2.8 GHz ARM Cortex-X1
3 x 2.4 GHz ARM Cortex-A78
4 x 1.8 GHz ARM Cortex-A55
8 / 8
1 x 3.0 GHz ARM Cortex-X1
3 x 2.4 GHz ARM Cortex-A78
4 x 1.8 GHz ARM Cortex-A55
Transistors15800 Million
Technology5 nm5 nm5 nm
FeaturesARMv8 Instruction Set, Machine Learning Controller, 16-Core Neural Engine, Secure Enclave, Advanced Image Signal ProcessorAdreno 660 GPU, Spectra 580 ISP, Hexagon 780, X60 5G Modem, FastConnect 6900 WiFi,LPDDR5-6400 / LPDDR4X-4266 MHz Memory Controller (64 Bit)Adreno 660 GPU, Spectra 580 ISP, Hexagon 780, X60 5G Modem, FastConnect 6900 WiFi, LPDDR5-6400 (3200 MHz) Memory Controller (64 Bit)
iGPUApple A15 GPU 5-CoreQualcomm Adreno 660Qualcomm Adreno 660
NPU / AI15.8 TOPS INT8
ArchitectureARMARMARM
Announced
CodenameCortex-X1 / A78 / A55 (Kryo 680)Cortex-X1 / A78 / A55 (Kryo 680)
TDP5 Watt5 Watt
Chip AI26 TOPS INT832 TOPS INT8
Manufacturerwww.qualcomm.comwww.qualcomm.com

Benchmarks

Performance Rating - Geekbench 5.5, PCM Work, Sling Shot Physics, Antutu v8 CPU - SD 888 5G
min: 1.289     avg: 1.3     median: 1.3 (99%)     max: 1.3 pt
Restrict / Search: Model: Max. age: years
Performance Rating - Geekbench 5.5, PCM Work, Sling Shot Physics, Antutu v8 CPU - SD 888+ 5G
1.3 pt (100%)
Restrict / Search: Model: Max. age: years
3DMark - 3DMark Ice Storm Unlimited Physics
44810 Points (36%)
3DMark - 3DMark Sling Shot Extreme (ES 3.1) Unlimited Physics
100%
A15 +
min: 1852     avg: 2027     median: 1913 (18%)     max: 2307 Points
min: 4387     avg: 4898     median: 4952 (47%)     max: 5260 Points
3DMark - 3DMark Sling Shot (ES 3.0) Unlimited Physics
100%
A15 +
2130 Points (24%)
min: 4365     avg: 4994     median: 5260 (60%)     max: 5293 Points
Geekbench 6.5 - Geekbench 6.5 Single-Core
100%
A15 +
2332 Points (56%)
1480 Points (36%)
1265 Points (31%)
Geekbench 6.5 - Geekbench 6.5 Multi-Core
100%
A15 +
5661 Points (22%)
3595 Points (14%)
3343 Points (13%)
Geekbench 5.5 - Geekbench 5.1 - 5.5 64 Bit Single-Core
100%
A15 +
min: 1590     avg: 1723     median: 1734 (66%)     max: 1755 Points
min: 1076     avg: 1143     median: 1157 (44%)     max: 1170 Points
Geekbench 5.5 - Geekbench 5.1 - 5.5 64 Bit Multi-Core
100%
A15 +
min: 4559     avg: 4755     median: 4788 (9%)     max: 4914 Points
min: 3286     avg: 3572     median: 3628.5 (7%)     max: 3675 Points
Geekbench 5.0 - Geekbench 5.0 64 Bit Single-Core
1164 Points (5%)
Geekbench 5.0 - Geekbench 5.0 64 Bit Multi-Core
3699 Points (12%)
Geekbench 4.4 - Geekbench 4.1 - 4.4 64 Bit Single-Core
min: 5033     avg: 5081     median: 5087 (51%)     max: 5099 Points
min: 4754     avg: 4973     median: 4973 (50%)     max: 5192 Points
Geekbench 4.4 - Geekbench 4.1 - 4.4 64 Bit Multi-Core
min: 14023     avg: 14426     median: 14326 (14%)     max: 14895 Points
min: 12433     avg: 13553     median: 13552.5 (13%)     max: 14672 Points
Geekbench 4.0 - Geekbench 4.0 64 Bit Single-Core
5255 Points (58%)
Geekbench 4.0 - Geekbench 4.0 64 Bit Multi-Core
13602 Points (18%)
Geekbench 3 - Geekbench 3 64 Bit Multi-Core
11320 Points (18%)
Geekbench 3 - Geekbench 3 64 Bit Single-Core
3977 Points (60%)
Geekbench 2 - 32 Bit - Geekbench Stream
4421 Points (23%)
3422 Points (18%)
Geekbench 2 - 32 Bit - Geekbench Memory
5565 Points (38%)
5554 Points (38%)
Geekbench 2 - 32 Bit - Geekbench Floating Point
19860 Points (39%)
18052 Points (35%)
Geekbench 2 - 32 Bit - Geekbench Integer
9335 Points (19%)
8716 Points (18%)
Geekbench 2 - 32 Bit - Geekbench Total Score
11578 Points (30%)
10821 Points (28%)
Mozilla Kraken 1.1 - Kraken 1.1 Total Score *
100%
A15 +
min: 413.6     avg: 455.6     median: 451 (1%)     max: 507.3 ms
min: 891     avg: 1319     median: 1321.5 (2%)     max: 1841 ms
min: 1117.9     avg: 1267     median: 1253.5 (1%)     max: 1443 ms
Sunspider - Sunspider 1.0 Total Score *
100%
1 A15 +
77 ms (1%)
342.5 ms (4%)
Octane V2 - Octane V2 Total Score
100%
A15 +
min: 57143     avg: 63305     median: 64026.5 (47%)     max: 65969 Points
min: 23491     avg: 35591     median: 35487.5 (26%)     max: 47543 Points
min: 28695     avg: 38237     median: 37604 (28%)     max: 49046 Points
WebXPRT 4 - WebXPRT 4 Score
100%
1 A15 +
min: 188     avg: 188.3     median: 188 (52%)     max: 189 Points
104 Points (29%)
WebXPRT 3 - WebXPRT 3 Score
100%
A15 +
min: 219     avg: 254.3     median: 250 (45%)     max: 279 Points
min: 103     avg: 143.1     median: 148 (27%)     max: 182 Points
min: 120     avg: 144     median: 147 (26%)     max: 165 Points
AnTuTu v8 - AnTuTu v8 UX
min: 73679     avg: 100640     median: 99442 (83%)     max: 119537 Points
min: 108609     avg: 111028     median: 111506 (93%)     max: 112968 Points
AnTuTu v8 - AnTuTu v8 MEM
min: 72541     avg: 99872     median: 101553 (82%)     max: 124036 Points
min: 97862     avg: 106258     median: 102389 (83%)     max: 118523 Points
AnTuTu v8 - AnTuTu v8 GPU
min: 226319     avg: 296422     median: 307949 (57%)     max: 319439 Points
min: 297329     avg: 308231     median: 306570 (56%)     max: 320795 Points
AnTuTu v8 - AnTuTu v8 CPU
min: 146069     avg: 180815     median: 186398 (67%)     max: 197454 Points
min: 181327     avg: 186005     median: 184740 (67%)     max: 191947 Points
AnTuTu v8 - AnTuTu v8 Total Score
min: 569595     avg: 677749     median: 703138 (68%)     max: 740847 Points
min: 695964     avg: 711522     median: 712952 (69%)     max: 725649 Points
Antutu v9 - AnTuTu v9 Total Score
100%
A15 +
min: 722973     avg: 788523     median: 800415 (39%)     max: 832548 Points
min: 794271     avg: 813105     median: 815115 (40%)     max: 829929 Points
Antutu v9 - AnTuTu v9 CPU
100%
A15 +
min: 192891     avg: 209810     median: 209802 (52%)     max: 227638 Points
min: 196860     avg: 203592     median: 205863 (51%)     max: 208053 Points
PassMark PerformanceTest Mobile V1 - PerformanceTest Mobile V1 CPU Tests
100%
1 A15 +
min: 10349     avg: 10411     median: 10410.5 (1%)     max: 10472 Points
4771 Points (1%)
min: 28905     avg: 32530     median: 31947 (14%)     max: 36738 Points
min: 12136     avg: 15268     median: 15403 (56%)     max: 18567 Points
PCMark for Android - PCM f. Android Computer Vision
min: 6823     avg: 9333     median: 9478.5 (50%)     max: 11551 Points
PCMark for Android - PCM f. Android Storage
0 Points (0%)
PCMark for Android - PCM f. Android Work Score 2.0
min: 10231     avg: 12376     median: 12822.5 (84%)     max: 15027 Points
12692 Points (83%)
PCMark for Android - PCM f. Android Work Score
min: 11823     avg: 14555     median: 14328 (72%)     max: 18942 Points
CrossMark - CrossMark Overall
100%
A15 +
min: 1132     avg: 1156     median: 1145 (43%)     max: 1190 Points
min: 828     avg: 872     median: 872 (33%)     max: 916 Points
Power Consumption - Geekbench 5.5 Power Consumption 150cd *
100%
1 A15 +
min: 4.54     avg: 4.9     median: 5 (2%)     max: 5.64 Watt
min: 4.68     avg: 5.3     median: 5.1 (2%)     max: 6.41 Watt
Power Consumption - Idle Power Consumption 150cd 1min *
100%
1 A15 +
min: 0     avg: 0.7     median: 0.7 (1%)     max: 1.415 Watt
min: 0.943     avg: 1.1     median: 1 (1%)     max: 1.244 Watt

Average Benchmarks Apple A15 Bionic → 100% n=12

Average Benchmarks Qualcomm Snapdragon 888 5G → 97% n=12

Average Benchmarks Qualcomm Snapdragon 888 Plus 5G → 99% n=12

- Range of benchmark values for this graphics card
red legend - Average benchmark values for this graphics card
* Smaller numbers mean a higher performance
1 This benchmark is not used for the average calculation

v1.34
log 14. 21:04:29

#0 ran 0s before starting gpusingle class +0s ... 0s

#1 checking url part for id 13825 +0s ... 0s

#2 checking url part for id 13017 +0s ... 0s

#3 checking url part for id 13833 +0s ... 0s

#4 redirected to Ajax server, took 1760468669s time from redirect:0 +0s ... 0s

#5 did not recreate cache, as it is less than 5 days old! Created at Mon, 13 Oct 2025 05:18:33 +0200 +0s ... 0s

#6 composed specs +0.007s ... 0.007s

#7 did output specs +0s ... 0.007s

#8 getting avg benchmarks for device 13825 +0.001s ... 0.007s

#9 got single benchmarks 13825 +0.007s ... 0.015s

#10 getting avg benchmarks for device 13017 +0.003s ... 0.018s

#11 got single benchmarks 13017 +0.02s ... 0.037s

#12 getting avg benchmarks for device 13833 +0.003s ... 0.04s

#13 got single benchmarks 13833 +0.008s ... 0.047s

#14 got avg benchmarks for devices +0s ... 0.047s

#15 No cached benchmark found, getting uncached values +0.031s ... 0.078s

#16 min, max, avg, median took s +0.004s ... 0.083s

#17 return log +0s ... 0.083s

Please share our article, every link counts!
Mail Logo
> Expert Reviews and News on Laptops, Smartphones and Tech Innovations > Benchmarks / Tech > Processor Comparison - Head 2 Head
Redaktion, 2017-09- 8 (Update: 2023-07- 1)