Notebookcheck Logo

Samsung SSD 970 EVO 500GB vs SK Hynix BC711 HFM256GD3GX013N

Samsung SSD 970 EVO 500GB

► remove from comparison

The Samsung SSD 970 EVO 500 GB (MZ-V7E500BW) is a lower high end M.2 2280 NVMe SSD for Desktops and Laptops. It uses the Samsung Phoenix (S4LR020) Controller with 512 MB LPDDR4 Cache. Samsung specifies 3400 MB/s read and 1500 MB/s write performance and uses 64 Layer 3DNAND TLC from Samsung as memory chips. At the time of announcement in 2018 it was one of the fastest consumer SSDs on the market. The power consumption of the SSD is rated at 9 W (max.), 5.4W (usage), 0.03W (idle), and 0.005W (sleep).

Compared to the SSD 970 Pro, the Evo uses slower TLC memory and is specified with a slightly higher power consumption.

SK Hynix BC711 HFM256GD3GX013N

► remove from comparison  BC711 HFM256GD3GX013N

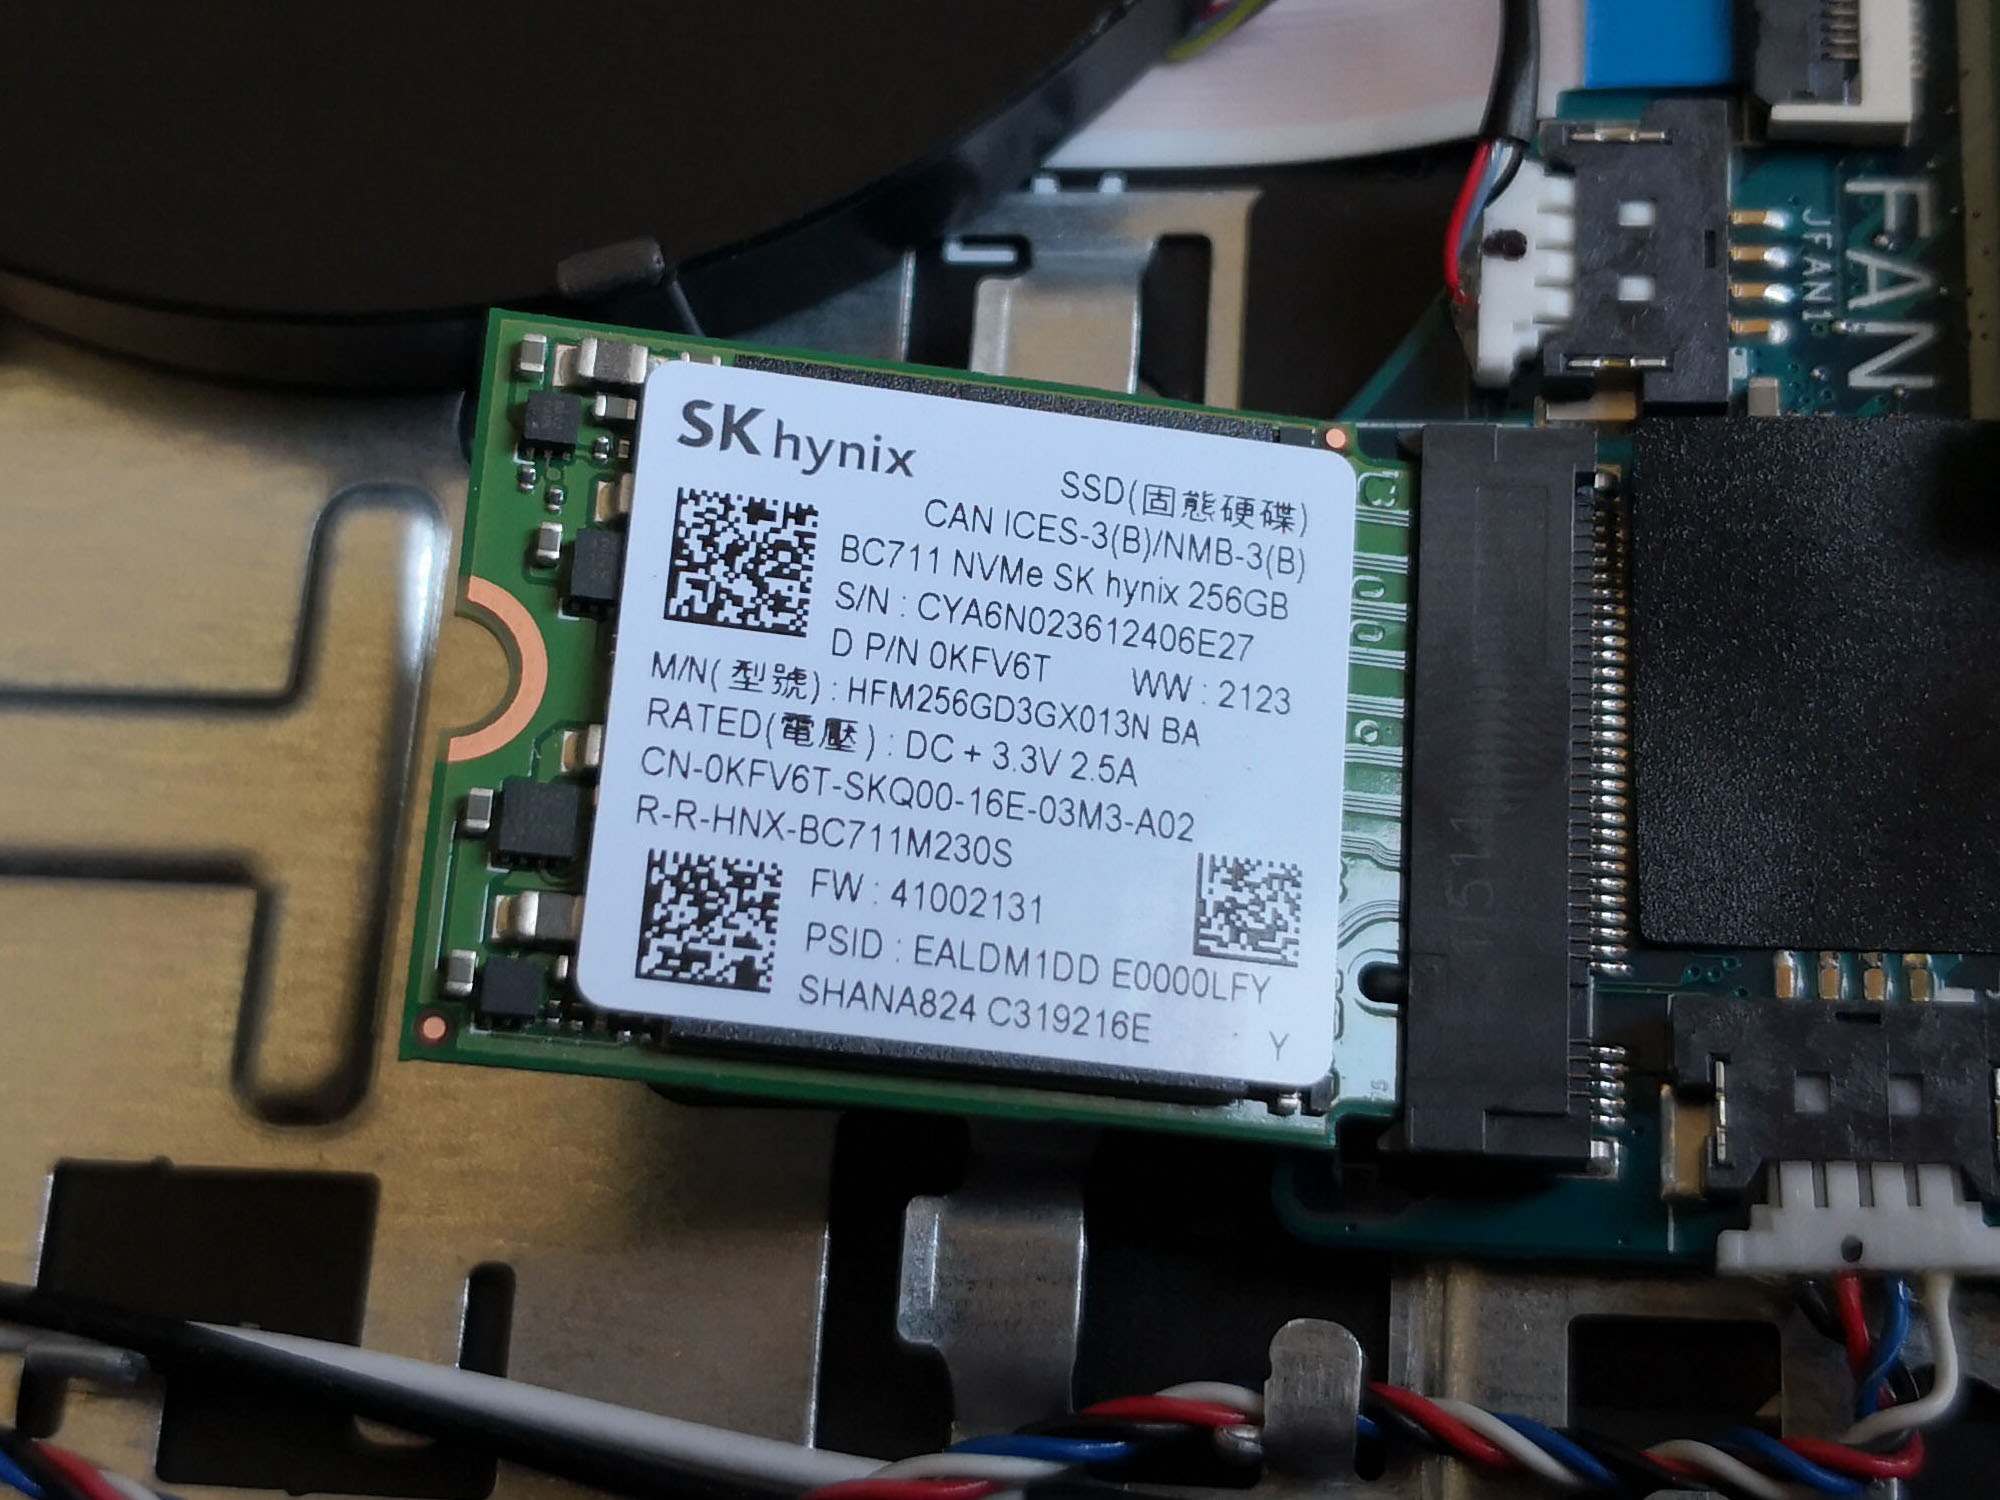
The SK Hynix BC711 HFM256GD3GX013N NVMe Pyrite is a mid range PCIe M.2 2242 drive that was first found in the Dell Inspiron 15 3000 3511 laptop. It uses a PCIe Gen3 x 4 interface and offers 256 GB of storage. We tested with firmware 41002131.

Samsung SSD 970 EVO 500GBSK Hynix BC711 HFM256GD3GX013N
TypeSSDSSD
SizeM.2 2280M.2 2242
Capacity500 GB256 GB
InterfaceNVMeNVMe
Announced24.04.2018 06.01.2021

Benchmarks

Performance Rating - DiskSpd - BC711 HFM256GD3GX013N
19.9 pt (23%)
Seagate ST1000LM014 Solid State Hybrid Drive
0.717 -96%
...
512 GB UFS 4.0 Flash
19.3 -3%
Foresee VP1000F512G
19.4 -3%
19.6 -2%
Lexar NM610 500GB
19.7 -1%
ASint AS806
19.8 -1%
19.8 -1%
19.8 -1%
19.9 0%
19.9 0%
SK Hynix BC711 HFM256GD3GX013N
19.9
20 1%
20 1%
20.1 1%
20.1 1%
Micron 2550 1TB MTFDKCD1T0TGE
20.2 2%
2x Intel SSD 660p 1TB SSDPEKNW010T8 (RAID 0)
20.2 2%
20.2 2%
20.3 2%
Samsung SSD PM981a MZVLB256HBHQ
20.4 3%
...
Kingston Fury Renegade G5 4TB
87.8 341%
0%
100%
Restrict / Search: Model: Max. age: years
AS SSD - Copy Game
951 MB/s (16%)
min: 446.1     avg: 462.8     median: 462.8 (8%)     max: 479.5 MB/s
AS SSD - Copy Program
363.4 MB/s (13%)
min: 268.65     avg: 305.6     median: 305.6 (11%)     max: 342.6 MB/s
AS SSD - Copy ISO
2057 MB/s (8%)
min: 1199     avg: 1429     median: 1429.5 (5%)     max: 1659.9 MB/s
AS SSD - Score Total
min: 3780     avg: 4382     median: 4666 (29%)     max: 4701 Points
min: 2493     avg: 2711     median: 2710.5 (17%)     max: 2928 Points
AS SSD - Score Write
min: 1598     avg: 2012     median: 2200 (31%)     max: 2237 Points
min: 545     avg: 795     median: 794.5 (11%)     max: 1044 Points
AS SSD - Score Read
min: 1442     avg: 1572     median: 1612 (26%)     max: 1661 Points
min: 1279     avg: 1315     median: 1315 (21%)     max: 1351 Points
AS SSD - Access Time Write *
min: 0.029     avg: 0     median: 0 (0%)     max: 0.033 ms
min: 0.032     avg: 0.1     median: 0.1 (0%)     max: 0.096 ms
AS SSD - Access Time Read *
min: 0.041     avg: 0.1     median: 0 (0%)     max: 0.064 ms
min: 0.07     avg: 0.1     median: 0.1 (0%)     max: 0.071 ms
AS SSD - 4K-64 Write
min: 1236     avg: 1655     median: 1836 (31%)     max: 1893 MB/s
min: 280.68     avg: 559     median: 558.8 (9%)     max: 837 MB/s
AS SSD - 4K-64 Read
min: 1141     avg: 1258     median: 1294 (25%)     max: 1339 MB/s
min: 1026.51     avg: 1027     median: 1026.8 (20%)     max: 1027 MB/s
AS SSD - 4K Write
min: 113.4     avg: 123.7     median: 125.8 (25%)     max: 131.9 MB/s
min: 122.4     avg: 161     median: 161 (31%)     max: 199.59 MB/s
AS SSD - 4K Read
min: 52.5     avg: 53.9     median: 53.6 (17%)     max: 55.5 MB/s
min: 49.68     avg: 50.6     median: 50.6 (16%)     max: 51.48 MB/s
AS SSD - Sequential Write
min: 2300     avg: 2328     median: 2325 (21%)     max: 2360 MB/s
min: 644.67     avg: 745     median: 744.8 (7%)     max: 845 MB/s
AS SSD - Sequential Read
min: 2488     avg: 2601     median: 2630 (21%)     max: 2685 MB/s
min: 2023     avg: 2378     median: 2378.3 (19%)     max: 2733.64 MB/s
CrystalDiskMark 3.0 - 4K QD32 Write
555 MB/s (52%)
CrystalDiskMark 3.0 - 4K QD32 Read
648 MB/s (50%)
CrystalDiskMark 3.0 - 4K Write
154.1 MB/s (5%)
CrystalDiskMark 3.0 - 4K Read
67.1 MB/s (1%)
CrystalDiskMark 3.0 - 512K Write
1201 MB/s (13%)
CrystalDiskMark 3.0 - 512K Read
862 MB/s (18%)
CrystalDiskMark 3.0 - Sequential Write
1652 MB/s (16%)
CrystalDiskMark 3.0 - Sequential Read
1910 MB/s (22%)
CrystalDiskMark 5.2 / 6 - CDM 5/6 Write 4K
min: 100.4     avg: 114.9     median: 113.5 (10%)     max: 130.9 MB/s
min: 138.7     avg: 154.9     median: 154.9 (14%)     max: 171.1 MB/s
CrystalDiskMark 5.2 / 6 - CDM 5/6 Read 4K
min: 41.6     avg: 43.3     median: 43.5 (1%)     max: 44.66 MB/s
min: 55.8     avg: 59.1     median: 59.1 (2%)     max: 62.49 MB/s
CrystalDiskMark 5.2 / 6 - CDM 5 Write Seq
min: 1187     avg: 1353     median: 1407 (8%)     max: 1466 MB/s
min: 790     avg: 873     median: 873.5 (5%)     max: 956.9 MB/s
CrystalDiskMark 5.2 / 6 - CDM 5 Read Seq
min: 1190     avg: 1255     median: 1200 (13%)     max: 1376 MB/s
min: 1890     avg: 1950     median: 1950 (21%)     max: 2010 MB/s
CrystalDiskMark 5.2 / 6 - CDM 5/6 Write 4K Q32T1
min: 279.3     avg: 297.4     median: 295.4 (6%)     max: 317.4 MB/s
min: 399     avg: 434.1     median: 434.1 (9%)     max: 469.1 MB/s
CrystalDiskMark 5.2 / 6 - CDM 5/6 Read 4K Q32T1
min: 343.9     avg: 368.9     median: 376.8 (6%)     max: 386.1 MB/s
min: 408.1     avg: 494.7     median: 494.7 (7%)     max: 581.2 MB/s
CrystalDiskMark 5.2 / 6 - CDM 5/6 Write Seq Q32T1
min: 2442     avg: 2483     median: 2498 (17%)     max: 2510 MB/s
min: 869.1     avg: 941     median: 940.6 (6%)     max: 1012 MB/s
CrystalDiskMark 5.2 / 6 - CDM 5/6 Read Seq Q32T1
min: 3524     avg: 3544     median: 3549 (19%)     max: 3560 MB/s
min: 3304     avg: 3361     median: 3361 (18%)     max: 3418 MB/s
DiskSpd - DiskSpd 4k_q1t1_write
min: 141     avg: 151.8     median: 151.8 (35%)     max: 162.5 MB/s
DiskSpd - DiskSpd 4k_q1t1_read
min: 52.3     avg: 53.2     median: 53.2 (15%)     max: 54 MB/s
DiskSpd - DiskSpd 4k_q32t16_write
min: 411     avg: 460.5     median: 460.5 (7%)     max: 510 MB/s
DiskSpd - DiskSpd 4k_q32t16_read
min: 667     avg: 898     median: 897.5 (11%)     max: 1128 MB/s
DiskSpd - DiskSpd seq_write
min: 1606     avg: 1786     median: 1785.5 (17%)     max: 1965 MB/s
DiskSpd - DiskSpd seq_read
min: 1680     avg: 1835     median: 1834.5 (19%)     max: 1989 MB/s
DiskSpd - DiskSpd seq_q8t1_write
min: 863     avg: 878     median: 878 (6%)     max: 893 MB/s
DiskSpd - DiskSpd seq_q8t1_read
min: 3398     avg: 3411     median: 3411 (21%)     max: 3424 MB/s
DiskSpd - DiskSpd Loop seq_q8t1_read
min: 3302     avg: 3343     median: 3343 (21%)     max: 3384 MB/s
- Range of benchmark values for this graphics card
red legend - Average benchmark values for this graphics card
* Smaller numbers mean a higher performance

Average Benchmarks

Samsung SSD 970 EVO 500GB → 100% n=22

SK Hynix BC711 HFM256GD3GX013N → 84% n=22

Average of the median scores above. 1 ... This benchmark is not used for the average calculation

Amazon Logo
  • $164.99
    Samsung 970 EVO Plus SSD 500GB - M.2 NVMe Interface Internal Solid State Drive with V-NAND Technology (MZ-V7S500B/AM)
  • $89.00
    SAMSUNG (MZ-V7E500BW) 970 EVO SSD 500GB - M.2 NVMe Interface Internal Solid State Drive with V-NAND Technology, Black/Red
  • $115.49
    Crucial P310 500GB SSD, PCIe Gen4 NVMe M.2 2280, Up to 6,600MB/s, for Laptop, Desktop (PC), & Handheld Gaming Consoles, Includes Acronis Data Recovery Software, Solid State Drive - CT500P310SSD801
  • $232.49
    Samsung 990 PRO SSD 1TB PCIe 4.0 M.2 2280 Internal Solid State Hard Drive, Seq. Read Speeds Up to 7,450 MB/s for High End Computing, Gaming, and Heavy Duty Workstations, MZ-V9P1T0B/AM
  • $319.00
    SAMSUNG 500GB 970 EVO M.2 PCI-Express 3.0 Solid State Drive

Add one or more devices and compare

In the following list you can select (and also search for) devices that should be added to the comparison. You can select more than one device.

restrict list:
v1.35
log 07. 23:27:36

#0 ran 0s before starting gpusingle class +0s ... 0s

#1 checking url part for id 2868 +0s ... 0s

#2 checking url part for id 3779 +0s ... 0s

#3 redirected to Ajax server, took 1780867656s time from redirect:0 +0s ... 0s

#4 did not recreate cache, as it is less than 5 days old! Created at Sat, 06 Jun 2026 23:00:35 +0200 +0s ... 0s

#5 composed specs +0.002s ... 0.002s

#6 did output specs +0s ... 0.002s

#7 getting avg benchmarks for device 2868 +0.001s ... 0.003s

#8 got single benchmarks 2868 +0.003s ... 0.006s

#9 getting avg benchmarks for device 3779 +0.004s ... 0.01s

#10 got single benchmarks 3779 +0.002s ... 0.012s

#11 got avg benchmarks for devices +0s ... 0.012s

#12 min, max, avg, median took s +0.07s ... 0.083s

#13 return log +0.693s ... 0.776s

Google LogoAdd as a preferred source on Google
Mail Logo
> Expert Reviews and News on Laptops, Smartphones and Tech Innovations > Benchmarks / Tech > HDD/SSD Comparison - Head 2 Head
Redaktion, 2017-09- 8 (Update: 2023-07- 1)