Notebookcheck Logo

Intel Core i7-2600K vs Intel Core i7-9700

Intel Core i7-2600K

► remove from comparison Intel 2600K

The Intel Core i7-2600K is a high-end quad-core desktop processor of the Sandy Bridge generation. It was announced at the beginning of 2011 and was the fastest CPU of this series at that time. However it does not offer all Sandy Bridge features, as vPro, VT-d and Trusted-Execution features are deactivated.

The four processor cores are able to handle 8 threads in parallel (due to Hyperthreading) and offer a base clock rate of 3.4 GHz. Under load, the cores can be overclocked automatically to up to 3.8 GHz with sufficient cooling:

  • 3.8 GHz - 1 core load
  • 3.7 GHz - 2 cores load
  • 3.6 GHz - 3 cores load
  • 3.5 GHz - 4 cores load

As a member of the "K-familiy" the i7-2600K is easily overclockable due to the open multiplicator.

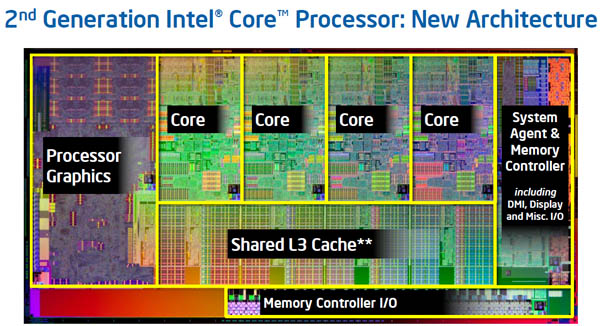
The Die also includes an graphics card called Intel HD Graphics 3000 that clocks with 850 to 1350 MHz (also due to Turbo Boost). Furthermore, an integrated dual channel memory controller is able to handle up to 32 GB of DDR3-1333.

Intel Core i7-9700

► remove from comparison Intel i7-9700

The Intel Core i7-9700 is a high end desktop processor based on the Coffee Lake architecture. It integrates 8 cores (no Hyperthreading therefore also 8 threads) clocked at 3 - 4.7 GHz. Compared to the similar named Core i7-9700K, the 9700 has no open multiplicator for easy overclocking, offers lower clock speeds and offers a reduced TDP.

Compared to the old Core i7-8700, the 9700 offers two more real cores but no Hyperthreading. Therefore, the performance gain is not that big - depending on the app. The single core performance was slightly improved thanks to the higher Turbo clocks. As a high end desktop CPU, the i7-9700 is well suited for demanding tasks and gaming.

The integrated Intel UHD Graphics 630 graphics card is clocked at up to 1.2 GHz and offers no advantage compared to previous generations. As it is a very low end GPU, only some low demanding games like Hearthstone can be played with it (see GPU page for benchmarks).

Intel specifies the TDP at 65 Watt (instead of the 95W of the faster models) and therefore the CPU wont need a high end desktop cooling system.

ModelIntel Core i7-2600KIntel Core i7-9700
CodenameSandy BridgeCoffee Lake-R
SeriesIntel Core i7 (Desktop)Intel Coffee Lake
Series: Coffee Lake Coffee Lake-R
Intel Core i7-2700K compare3.5 - 3.9 GHz4 / 8 cores8 MB L3
Intel Core i7-2600K « 3.4 - 3.8 GHz4 / 8 cores8 MB L3
Intel Core i9-9900KS compare4 - 5 GHz8 / 16 cores16 MB L3
Intel Core i9-9900K compare3.6 - 5 GHz8 / 16 cores16 MB L3
Intel Core i7-9700K compare3.6 - 4.9 GHz8 / 8 cores12 MB L3
Intel Core i7-9700 « 3 - 4.7 GHz8 / 8 cores12 MB L3
Intel Core i5-9600K compare3.7 - 4.6 GHz6 / 6 cores9 MB L3
Intel Core i9-9900T compare2.1 - 4.4 GHz8 / 16 cores16 MB L3
Intel Core i5-9400F compare2.9 - 4.1 GHz6 / 6 cores9 MB L3
Intel Core i3-9100F compare3.6 - 4.2 GHz4 / 4 cores6 MB L3
Clock3400 - 3800 MHz3000 - 4700 MHz
L2 Cache1 MB2 MB
L3 Cache8 MB12 MB
Cores / Threads4 / 88 / 8
TDP95 Watt65 Watt
Transistors995 Million
Technology32 nm14++ nm
Die Size216 mm2178 mm2
max. Temp.72.6 °C100 °C
SocketLGA1155FCLGA1151
FeaturesSSE4.1, SSE4.2, AVX, Turbo Boost (3.80GHz), Hyper-Threading, VT-x, AES-NI, Intel 64, Idle States, EIST, Thermal Monitoring Technologies, Intel Fast Memory Access, Intel Flex Memory Access, XD bit, open MultiplicatorDual-Channel DDR4-2666 Memory Controller, HyperThreading, AVX, AVX2, AES-NI, TSX-NI, Quick Sync, Virtualization, vPro
iGPUIntel HD Graphics 3000 (850 - 1350 MHz)Intel UHD Graphics 630 (350 - 1200 MHz)
Architecturex86x86
$317 U.S.
Announced
Manufacturerark.intel.com
L1 Cache512 KB

Benchmarks

Performance Rating - CB R15 + R20 + 7-Zip + X265 + Blender + 3DM11 CPU - i7-9700
31.3 pt (52%)
Restrict / Search: Model: Max. age: years
Cinebench R20 - Cinebench R20 CPU (Single Core)
100%
1 i7-9700 +
474 Points (52%)
Cinebench R20 - Cinebench R20 CPU (Multi Core)
100%
1 i7-9700 +
2892 Points (7%)
Cinebench R15 - Cinebench R15 CPU Multi 64 Bit
min: 613     avg: 614     median: 613.5 (4%)     max: 614 Points
1254 Points (8%)
Cinebench R15 - Cinebench R15 CPU Single 64 Bit
129 Points (36%)
199 Points (55%)
Cinebench R11.5 - Cinebench R11.5 CPU Multi 64 Bit
6.8 Points (9%)
14.4 Points (19%)
Cinebench R11.5 - Cinebench R11.5 CPU Single 64 Bit
1.5 Points (36%)
2.3 Points (53%)
Cinebench R10 - Cinebench R10 Rend. Single (32bit)
4809 Points (29%)
7473 Points (45%)
Cinebench R10 - Cinebench R10 Rend. Multi (32bit)
18608 Points (13%)
37381 Points (27%)
Cinebench R10 - Cinebench R10 Rend. Multi (64bit)
22897 Points (15%)
49666 Points (32%)
Cinebench R10 - Cinebench R10 Rend. Single (64bit)
6001 Points (7%)
9840 Points (12%)
wPrime 2.10 - wPrime 2.0 1024m *
328 s (4%)
155.8 s (2%)
wPrime 2.10 - wPrime 2.0 32m *
10.5 s (2%)
4.8 s (1%)
wPrime 1.55 - wPrime 1.55 1024m *
100%
1 2600K +
234 s (1%)
wPrime 1.55 - wPrime 1.55 32m *
100%
1 2600K +
7.1 s (4%)
WinRAR - WinRAR 4.0
3486 Points (6%)
6945 Points (11%)
7-Zip 18.03 - 7-Zip 18.03 Multi Thread 4 runs
100%
1 i7-9700 +
33539 MIPS (19%)
7-Zip 18.03 - 7-Zip 18.03 Single Thread 4 runs
100%
1 i7-9700 +
5186 MIPS (61%)
X264 HD Benchmark 4.0 - x264 Pass 2
36.5 fps (1%)
77.6 fps (2%)
X264 HD Benchmark 4.0 - x264 Pass 1
145 fps (4%)
247.5 fps (6%)
HWBOT x265 Benchmark v2.2 - HWBOT x265 4k Preset
100%
1 i7-9700 +
10.5 fps (18%)
TrueCrypt - TrueCrypt Serpent
0.3 GB/s (9%)
0.8 GB/s (23%)
TrueCrypt - TrueCrypt Twofish
0.6 GB/s (10%)
1.3 GB/s (22%)
TrueCrypt - TrueCrypt AES
3.3 GB/s (9%)
7.6 GB/s (20%)
Blender - Blender 2.79 BMW27 CPU *
100%
1 i7-9700 +
388.7 Seconds (3%)
R Benchmark 2.5 - R Benchmark 2.5 *
100%
1 i7-9700 +
0.6 sec (13%)
3DMark 06 - CPU - 3DMark 06 - CPU
100%
1 2600K +
min: 6358     avg: 6649     median: 6669 (14%)     max: 6791 Points
Super Pi mod 1.5 XS 1M - Super Pi mod 1.5 XS 1M *
10.2 s (2%)
8.3 s (2%)
Super Pi mod 1.5 XS 2M - Super Pi mod 1.5 XS 2M *
22.4 s (1%)
18.4 s (1%)
Super Pi Mod 1.5 XS 32M - Super Pi mod 1.5 XS 32M *
560 s (2%)
460.7 s (2%)
SiSoft Sandra Dhrystone (MIPS) - SiSoft Sandra Dhrystone (MIPS)
100%
1 2600K +
118000 MIPS (56%)
SiSoft Sandra Whetstone (MFLOPS) - SiSoft Sandra Whetstone (MFLOPS)
100%
1 2600K +
82400 MFLOPS (63%)
Windows 7 Experience Index - Win7 CPU
100%
1 2600K +
7.6 Points (97%)
3DMark Vantage - 3DM Vant. Perf. CPU no Physx
100%
1 2600K +
min: 22530     avg: 23608     median: 23731 (18%)     max: 24019 Points
3DMark 11 - 3DM11 Performance Physics
min: 7865     avg: 8579     median: 8527 (21%)     max: 9487 Points
13939 Points (34%)
3DMark - 3DMark Ice Storm Physics
min: 40698     avg: 43628     median: 44325 (36%)     max: 44752 Points
79476 Points (65%)
3DMark - 3DMark Ice Storm Extreme Physics
min: 42348     avg: 44674     median: 44674 (36%)     max: 47000 Points
79073 Points (64%)
3DMark - 3DMark Ice Storm Unlimited Physics
min: 44250     avg: 44554     median: 44553.5 (36%)     max: 44857 Points
79079 Points (64%)
3DMark - 3DMark Cloud Gate Physics
min: 6298     avg: 6359     median: 6360.5 (16%)     max: 6434 Points
11688 Points (30%)
3DMark - 3DMark Fire Strike Standard Physics
min: 8740     avg: 8789     median: 8798 (16%)     max: 8832 Points
16387 Points (29%)
3DMark - 3DMark Time Spy CPU
100%
1 i7-9700 +
6867 Points (29%)
Geekbench 5.5 - Geekbench 5.1 - 5.5 64 Bit Single-Core
100%
1 i7-9700 +
1312 Points (50%)
Geekbench 5.5 - Geekbench 5.1 - 5.5 64 Bit Multi-Core
100%
1 i7-9700 +
7060 Points (13%)
Geekbench 5.0 - Geekbench 5.0 64 Bit Single-Core
100%
1 i7-9700 +
1300 Points (6%)
Geekbench 5.0 - Geekbench 5.0 64 Bit Multi-Core
100%
1 i7-9700 +
7060 Points (22%)
Geekbench 4.4 - Geekbench 4.1 - 4.4 64 Bit Single-Core
100%
1 i7-9700 +
5777 Points (58%)
Geekbench 4.4 - Geekbench 4.1 - 4.4 64 Bit Multi-Core
100%
1 i7-9700 +
27040 Points (27%)
Geekbench 3 - Geekbench 3 32 Bit Multi-Core
100%
1 2600K +
min: 11506     avg: 11547     median: 11546.5 (20%)     max: 11587 Points
Geekbench 3 - Geekbench 3 32 Bit Single-Core
100%
1 2600K +
min: 2975     avg: 3015     median: 3015 (39%)     max: 3055 Points
Geekbench 3 - Geekbench 3 64 Bit Multi-Core
100%
1 2600K +
12009 Points (19%)
Geekbench 3 - Geekbench 3 64 Bit Single-Core
100%
1 2600K +
3189 Points (48%)
Geekbench 2 - 32 Bit - Geekbench Stream
100%
1 2600K +
2537 Points (13%)
Geekbench 2 - 32 Bit - Geekbench Memory
100%
1 2600K +
5074 Points (35%)
Geekbench 2 - 32 Bit - Geekbench Floating Point
100%
1 2600K +
9088 Points (18%)
Geekbench 2 - 32 Bit - Geekbench Integer
100%
1 2600K +
9443 Points (19%)
Geekbench 2 - 32 Bit - Geekbench Total Score
100%
1 2600K +
7754 Points (20%)
Mozilla Kraken 1.1 - Kraken 1.1 Total Score *
1297 ms (2%)
790 ms (1%)
Sunspider - Sunspider 1.0 Total Score *
100%
1 2600K +
min: 150.6     avg: 157.3     median: 157.3 (2%)     max: 164 ms
Octane V2 - Octane V2 Total Score
100%
1 2600K +
min: 7883     avg: 15417     median: 15416.5 (11%)     max: 22950 Points
WebXPRT 3 - WebXPRT 3 Score
100%
1 i7-9700 +
232 Points (42%)
Power Consumption - Prime95 Power Consumption - external Monitor *
100%
1 i7-9700 +
143.8 Watt (25%)
Power Consumption - Cinebench R15 Multi Power Consumption - external Monitor *
100%
1 i7-9700 +
141.9 Watt (26%)
Power Consumption - Power Efficiency - Cinebench R15 Multi external Monitor
100%
1 i7-9700 +
8.8 Points per Watt (7%)

Average Benchmarks Intel Core i7-2600K → 100% n=26

Average Benchmarks Intel Core i7-9700 → 184% n=26

- Range of benchmark values for this graphics card
red legend - Average benchmark values for this graphics card
* Smaller numbers mean a higher performance
1 This benchmark is not used for the average calculation

Add one or more devices and compare

In the following list you can select (and also search for) devices that should be added to the comparison. You can select more than one device.

restrict list:
v1.33
log 28. 06:04:47

#0 ran 0s before starting gpusingle class +0s ... 0s

#1 checking url part for id 1574 +0s ... 0s

#2 checking url part for id 12254 +0s ... 0s

#3 redirected to Ajax server, took 1759032287s time from redirect:0 +0s ... 0s

#4 did not recreate cache, as it is less than 5 days old! Created at Sun, 28 Sep 2025 05:17:48 +0200 +0s ... 0s

#5 composed specs +0.004s ... 0.004s

#6 did output specs +0s ... 0.004s

#7 getting avg benchmarks for device 1574 +0.001s ... 0.006s

#8 got single benchmarks 1574 +0.022s ... 0.028s

#9 getting avg benchmarks for device 12254 +0.004s ... 0.032s

#10 got single benchmarks 12254 +0.004s ... 0.036s

#11 got avg benchmarks for devices +0s ... 0.036s

#12 min, max, avg, median took s +0.039s ... 0.075s

#13 return log +0.003s ... 0.077s

Please share our article, every link counts!
Mail Logo
> Expert Reviews and News on Laptops, Smartphones and Tech Innovations > Benchmarks / Tech > Processor Comparison - Head 2 Head
Redaktion, 2017-09- 8 (Update: 2023-07- 1)