 Deutsch
 English
 Español
 Français
 Italiano
 Nederlands
 Polski
 Português
 Русский
 Türkçe
 Svenska
 Chinese
 Magyar
Dell XPS 13 2016 (i7, 256 GB, QHD+) Notebook Review
")
For the original German review, see here.
The testers highly commended the XPS 13 9350 (FHD, i5) in the test: Apart from a few details, there was a very long list of pro arguments in opposition to modest three key points on the con side. Will a negative aspect now be added? Will the pixel monster have an even shorter battery life than the former XPS 13 models?
The Core i7 is also worth a detailed look - after all, the tester praised the fact that the Core i5 model in the XPS 13 did not throttle under high load. Will that also be the case here? Can users retrieve the maximum possible performance that a Core i7-6500U can accomplish?
We will focus on the performance (increase), on any potential differences in emissions, battery life with the Core i7, and of course the QHD+ panel (3200x1800 pixels). More information concerning other aspects can be found in the in-depth review of the Dell XPS 13 (9350, i5, FHD).
Updates:
12/03/2015 – Battery Runtime after BIOS update 1.1.7; rating reevaluated!
02/26/2016 - Brighter display with Content Adaptive Backlight Control (CABC) OFF
Questions Concerning the Test
We would like to answer some questions about the omitted chapters here.
Unstable touchpad - the pad is tightly fitted on its mount, and clicks are performed instantaneously. The review sample, kindly provided to us by Dell Germany, did not exhibit the issue of a "shaky" pad that some devices of the former production lots displayed.
Coil whining - was not audible. We only heard a quiet, consistent crackling. However, we had to place our ear on the vents of the base plate to hear that. Therefore, it would be possible to call it a noiseless device.
Connectivity
We test the performance of the installed card reader with our Toshiba Exceria Pro SDXC 64 GB UHS-II reference SD card. The maximum transfer rate is 209 MB/s when copying large data blocks, while 109 MB/s can be expected with standard JPG image files (approx. 5 MB each). The reader only needed 10 seconds for our 1090 MB image folder. Average readers need 16-25 and many even 60 to 70 seconds (e.g. 15 MB/s in 72 seconds: Acer's Nitro VN7-572G).
The webcam delivers just 1280x720 pixels. That is enough for a Skype video call, but it is actually too little for the upper price range. Not even the image sharpness is accurate. Areas are coarsely blurred, outlines are very pixelated, especially indoors. The latter is much better in the shade or in sunny conditions outdoors; the photos look acceptable at first glance. However, the mentioned noise is again visible when zooming in a bit. The small sensor is definitely not one of the worst that we have encountered in laptops. It is, however, not a premium webcam either, but only one that does its job - and not more and not less.


Display

3200x1800 pixels on 13 inches - that is quite imposing seeing that we are looking at 276 PPI here. This fine resolution is no longer perceptible as pixels to the eye (from about 30 cm/~1 ft), and we thus used our microscope. One pixel is now 0.092 millimeters. Like in the predecessor, the high resolution is combined with a 10-finger multi-touchscreen, namely the SHP1421 LQ133Y1 by Sharp. Unlike the former model (XPS 13-9343, also SHP1421) this is an IGZO panel. Sharp introduced this technology to the market, where amorphous silica (aSi TFTs) replaces indium gallium zinc oxide. That increases the electron mobility many times over, and leads to faster response speeds. That might be theory because the 30 or 40 milliseconds specified under Response Times are not what gamers would expect.
We measure the TFT's brightness using disabled adaptive brightness in a dark room by default. We did not observe visible fluctuation in the base brightness as is common for sensors (ambient light) after disabling this option. However, the sensor in our XPS remained active, which we recorded via different rates depending on whether we covered the sensor beside the webcam (center: 285 cd/m²), left it uncovered (308 cd/m²) or illuminated with a small lamp (323 cd/m²). The brightness thus still has a bit of potential. The screen's brightness no longer corresponds with the good rates of the XPS 13-9343 touch/non-touch, anyway. The reason might be Dell's Content Adaptive Backlight Control (CABC), which is a Firmware-based control of the screen's brightness according to the content. A CABC off option is not in the BIOS.
Upon inquiry, Dell replied that the Content Adaptive Brightness Control (CABC) functioned properly, but there were some inquiries from customers who find that annoying. Dell has a tool for QHD+ XPS 13 systems for disabling CABC for these users - or also for certain application fields. However, Dell had to admit that the trick does not work on XPS 13 FHD devices. Dell could not provide us with it at date of publication, but we will try it when it is available.
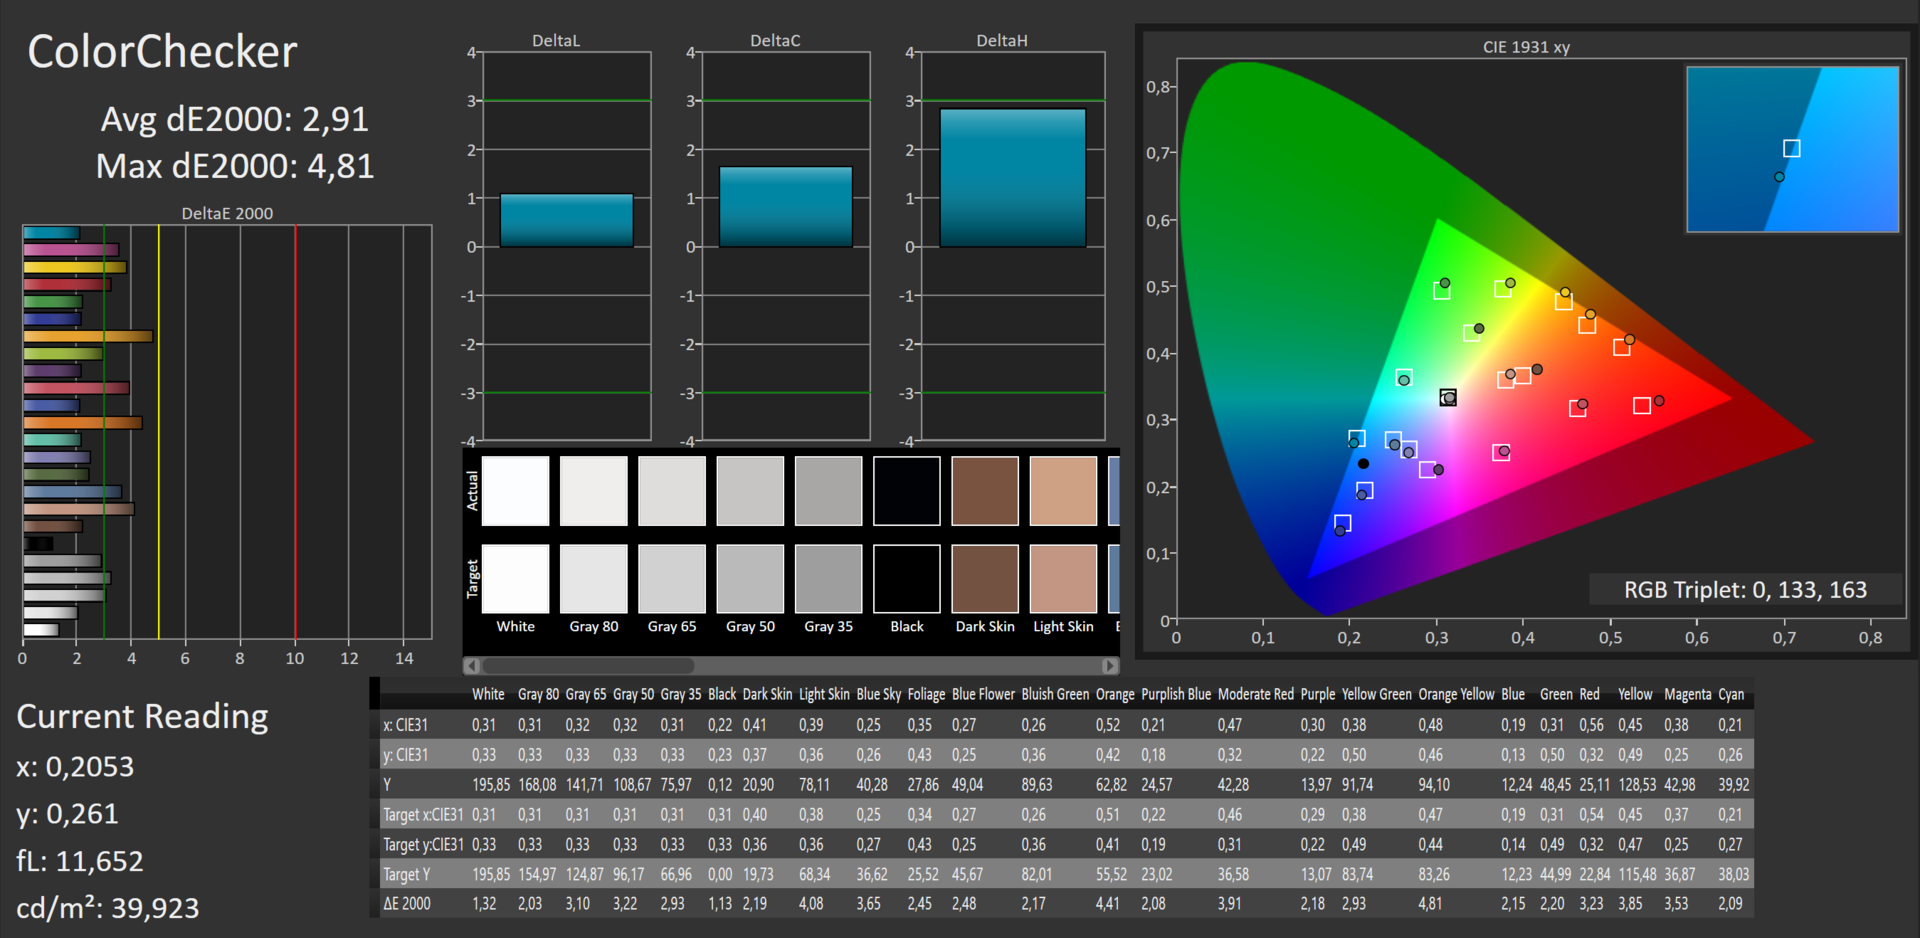
| |||||||||||||||||||||||||
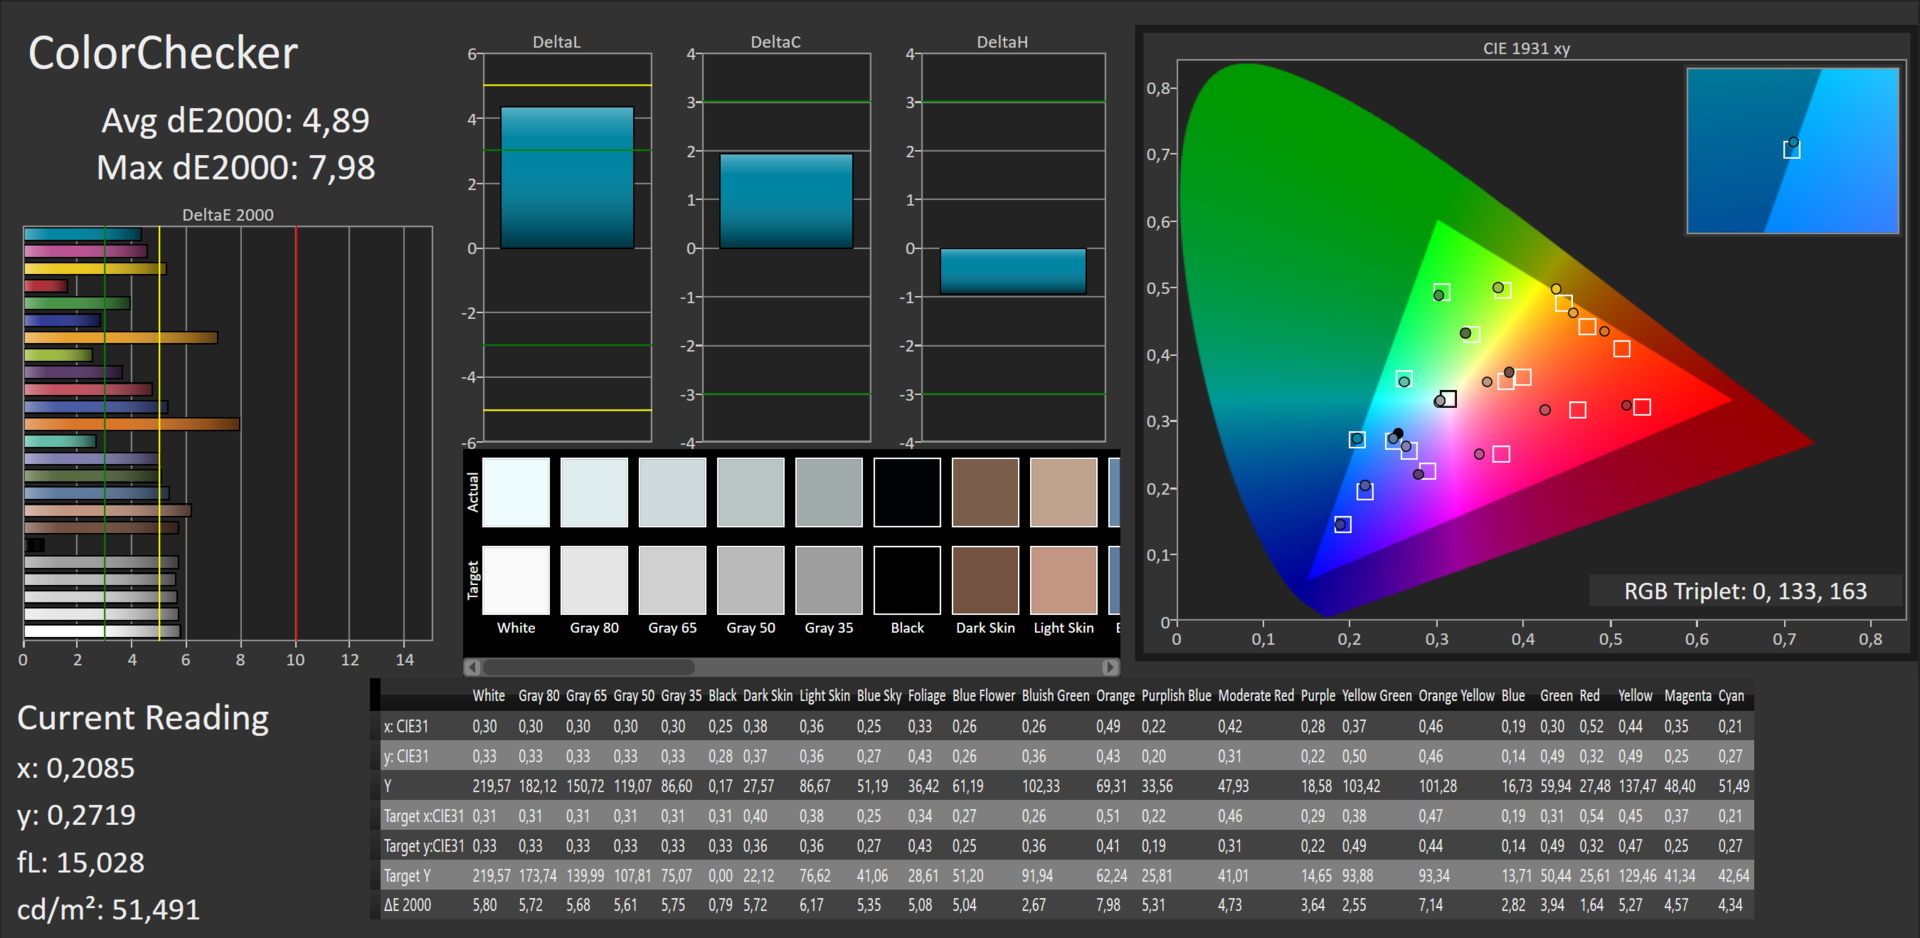
Brightness Distribution: 90 %
Center on Battery: 216 cd/m²
Contrast: 1583:1 (Black: 0.18 cd/m²)
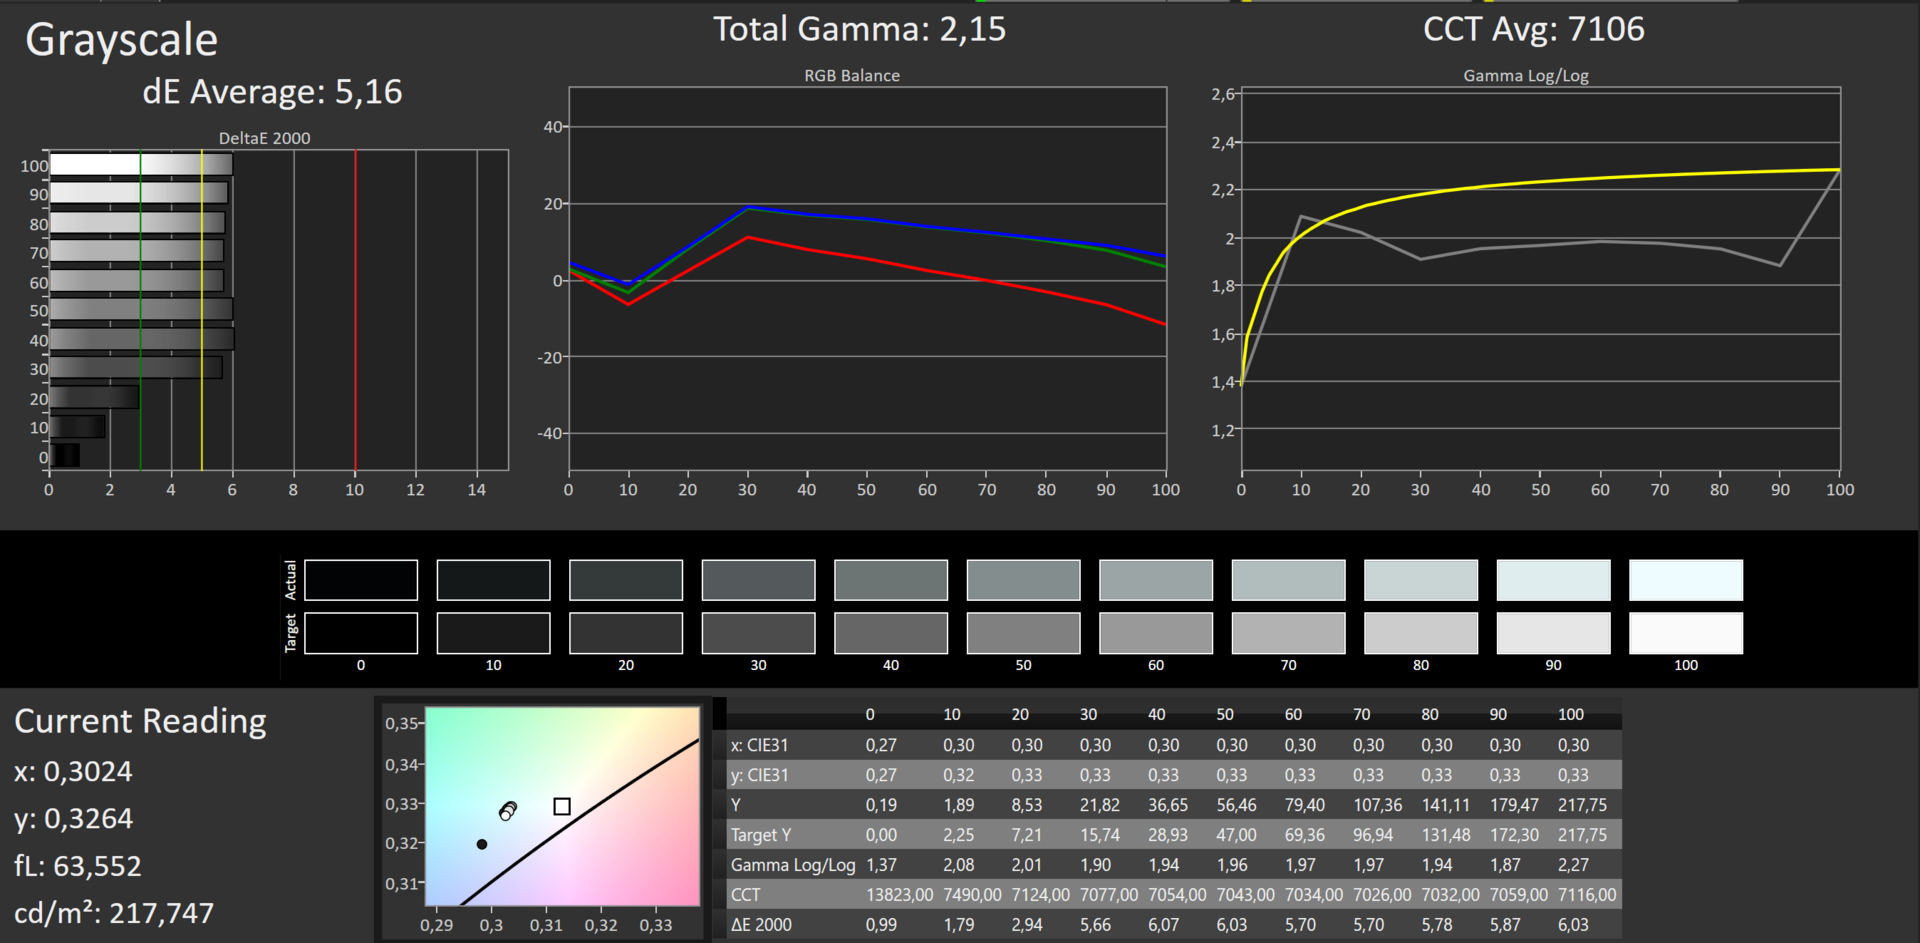
ΔE Color 4.89 | 0.5-29.43 Ø5
ΔE Greyscale 5.16 | 0.57-98 Ø5.3
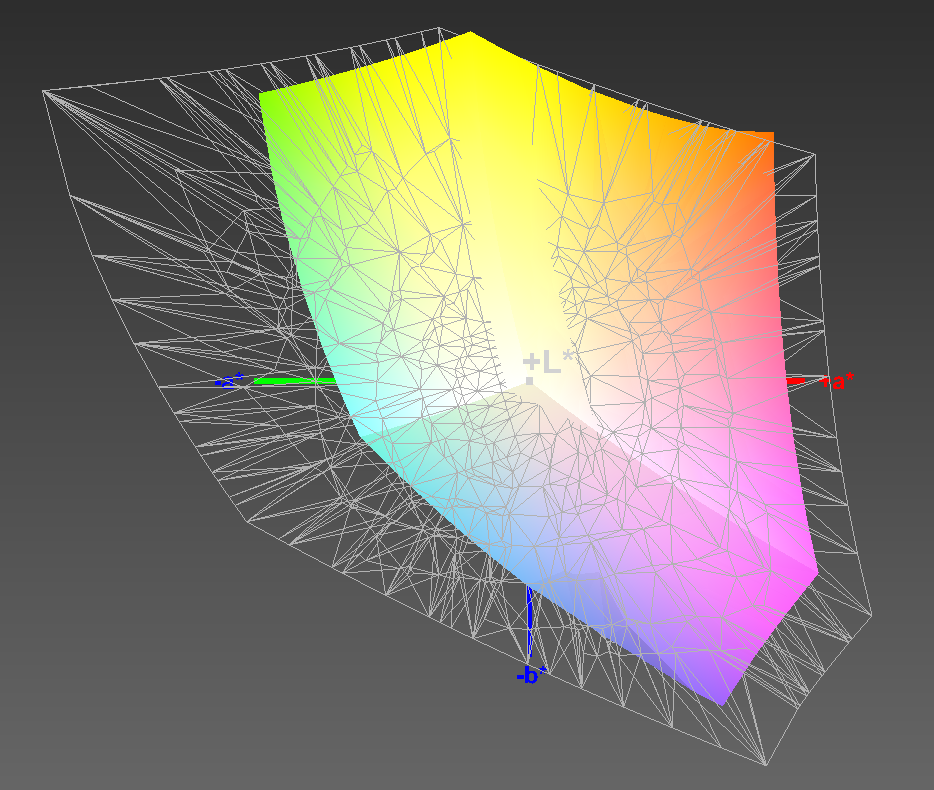
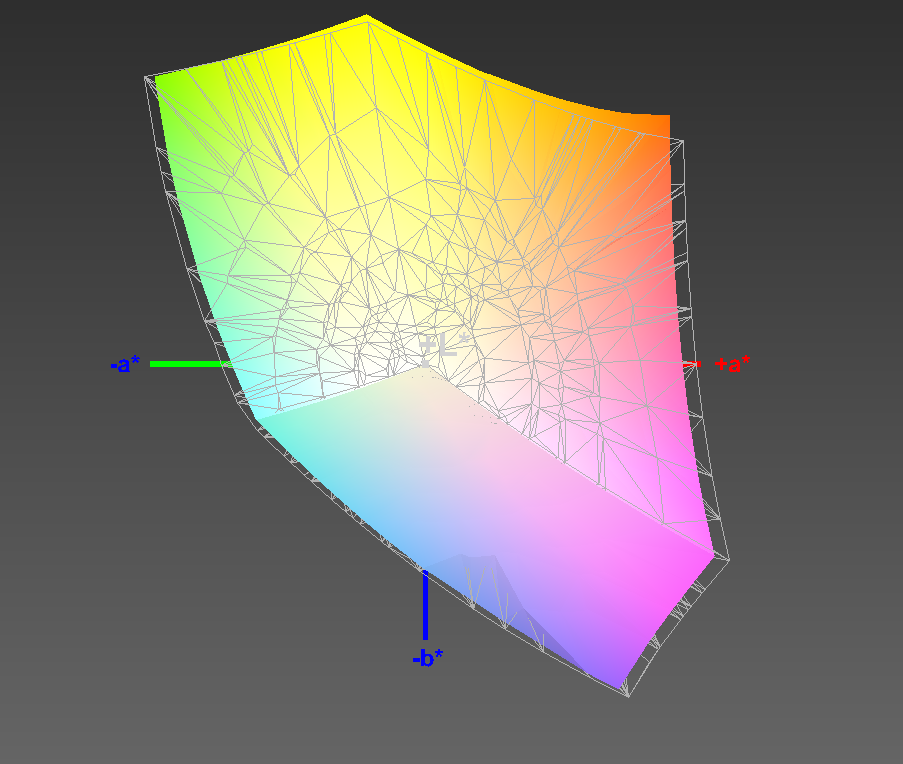
93% sRGB (Argyll 1.6.3 3D)
59% AdobeRGB 1998 (Argyll 1.6.3 3D)
65.5% AdobeRGB 1998 (Argyll 2.2.0 3D)
93.6% sRGB (Argyll 2.2.0 3D)
63.6% Display P3 (Argyll 2.2.0 3D)
Gamma: 2.15
| Dell XPS 13-9350 Touch 13.3 3200x1800 IGZO | Dell XPS 13-9350 Non-Touch 13.3 1920x1080 IPS | Dell XPS 13-9343 Touch 13.3 3200x1800 IPS | Dell XPS 13-9343 Non-Touch 13.3 1920x1080 IPS | Apple MB Air 13 2015-03 13.3 1440x900 TN | MS Surface Pro 4 12.3 2736x1824 IPS | MS Surface Book 13.5 3000x2000 IPS | |
|---|---|---|---|---|---|---|---|
| Display | -30% | 8% | 0% | -37% | 2% | 4% | |
| Display P3 Coverage | 63.6 | 44.53 -30% | 72 13% | 65.9 4% | 40.1 -37% | 65 2% | 67 5% |
| sRGB Coverage | 93.6 | 66.8 -29% | 96 3% | 89.6 -4% | 59.8 -36% | 96.5 3% | 95.8 2% |
| AdobeRGB 1998 Coverage | 65.5 | 45.97 -30% | 71.6 9% | 66.2 1% | 41.51 -37% | 67 2% | 68.9 5% |
| Response Times | -39% | -15% | |||||
| Response Time Grey 50% / Grey 80% * | 40 ? | 46 ? -15% | 48.4 ? -21% | ||||
| Response Time Black / White * | 30 ? | 31.2 ? -4% | 32.8 ? -9% | ||||
| PWM Frequency | 4900 ? | 50 ? -99% | |||||
| Screen | -7% | 8% | -11% | -20% | 3% | 21% | |
| Brightness middle | 285 | 277.5 -3% | 367.3 29% | 409.7 44% | 329 15% | 413 45% | 430.9 51% |
| Brightness | 281 | 276 -2% | 372 32% | 405 44% | 310 10% | 396 41% | 410 46% |
| Brightness Distribution | 90 | 88 -2% | 77 -14% | 93 3% | 82 -9% | 87 -3% | 93 3% |
| Black Level * | 0.18 | 0.191 -6% | 0.178 1% | 0.366 -103% | 0.405 -125% | 0.36 -100% | 0.254 -41% |
| Contrast | 1583 | 1453 -8% | 2063 30% | 1119 -29% | 812 -49% | 1147 -28% | 1696 7% |
| Colorchecker dE 2000 * | 4.89 | 4.88 -0% | 5.92 -21% | 7.67 -57% | 3.96 19% | 3.09 37% | 2.06 58% |
| Greyscale dE 2000 * | 5.16 | 4.26 17% | 4.79 7% | 4.66 10% | 3.51 32% | 3.92 24% | 2.22 57% |
| Gamma | 2.15 102% | 2.59 85% | 2.42 91% | 1.65 133% | 3.83 57% | 2.3 96% | 2.13 103% |
| CCT | 7106 91% | 6562 99% | 7013 93% | 6502 100% | 6711 97% | 7333 89% | 6520 100% |
| Color Space (Percent of AdobeRGB 1998) | 59 | 41.6 -29% | 63 7% | 59.65 1% | 38.4 -35% | 61 3% | 64 8% |
| Color Space (Percent of sRGB) | 93 | 65.79 -29% | 96.4 4% | 59.8 -36% | 97 4% | 96 3% | |
| Colorchecker dE 2000 max. * | 7.51 | ||||||
| Total Average (Program / Settings) | -19% /
-13% | 8% /
8% | -6% /
-8% | -29% /
-24% | -11% /
-6% | 3% /
12% |
* ... smaller is better
The screen from Sharp only covers 93% of the sRGB color space, and AdobeRGB should not even be considered with 59%. Calibrating does not change that, but it improves the color and grayscale accuracy. ColorChecker's DeltaE drops from 2.5 to 2.4, and Grayscale is reduced by 2.0 to 2.9. We use the non-calibrated DeltaE rates for the rating. Owners of the XPS 13 QHD+ can install the ICC profile linked in the box above in color management to achieve a similar improvement. Seen in total, the differences are low so that the naked eye usually will not perceive a difference. Thus, our QHD+ review sample comes close to the outstanding color reproduction of Microsoft's Surface Book when calibrated.

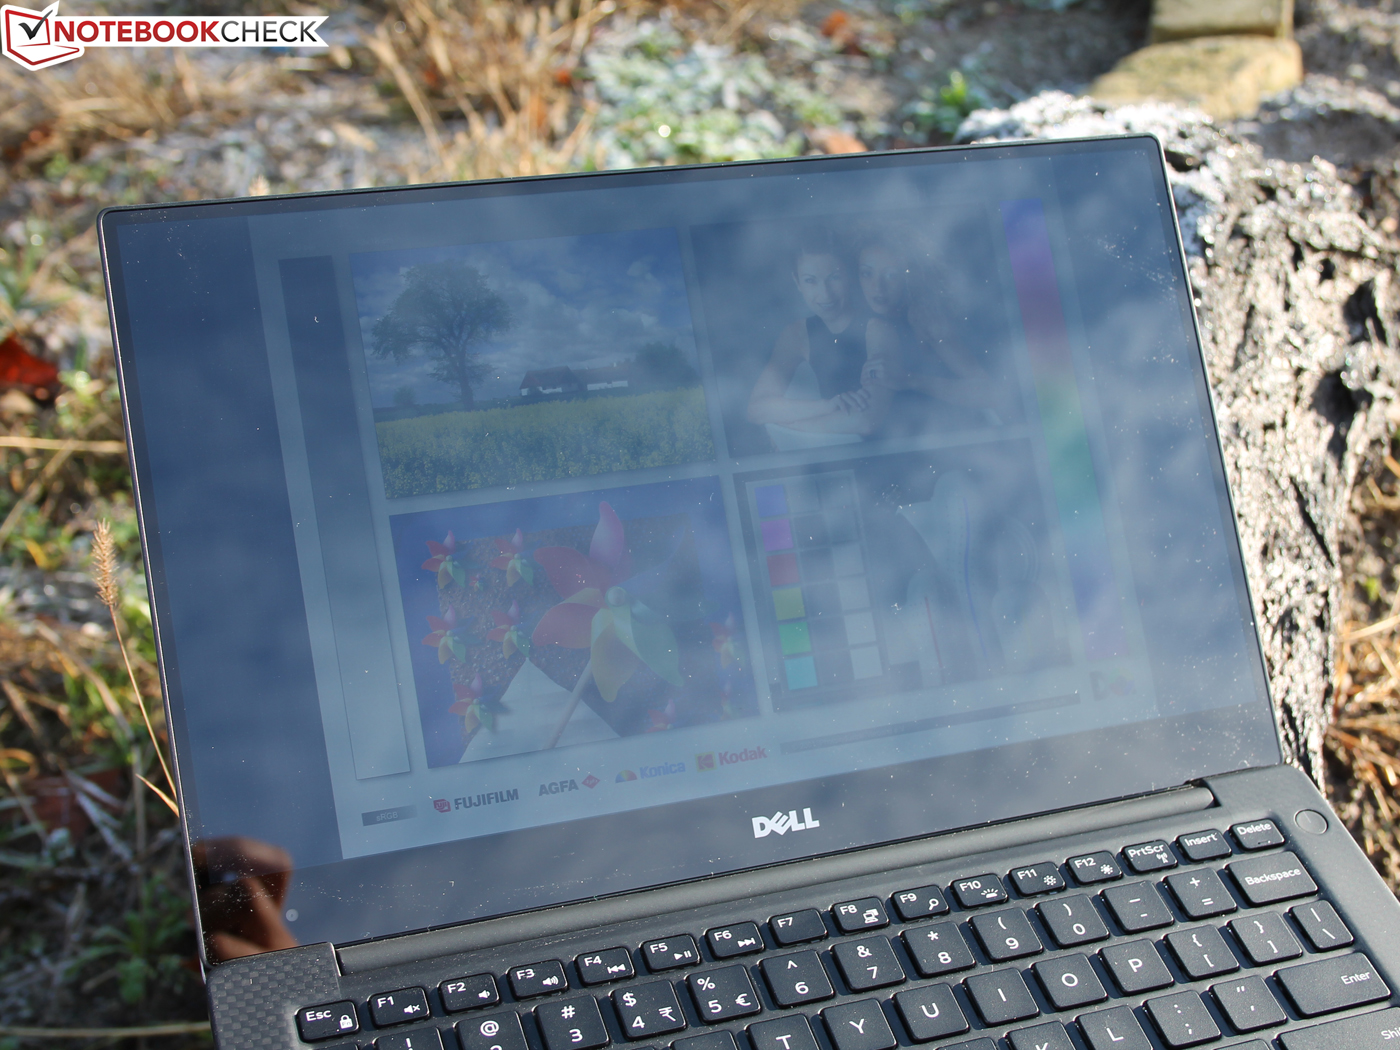
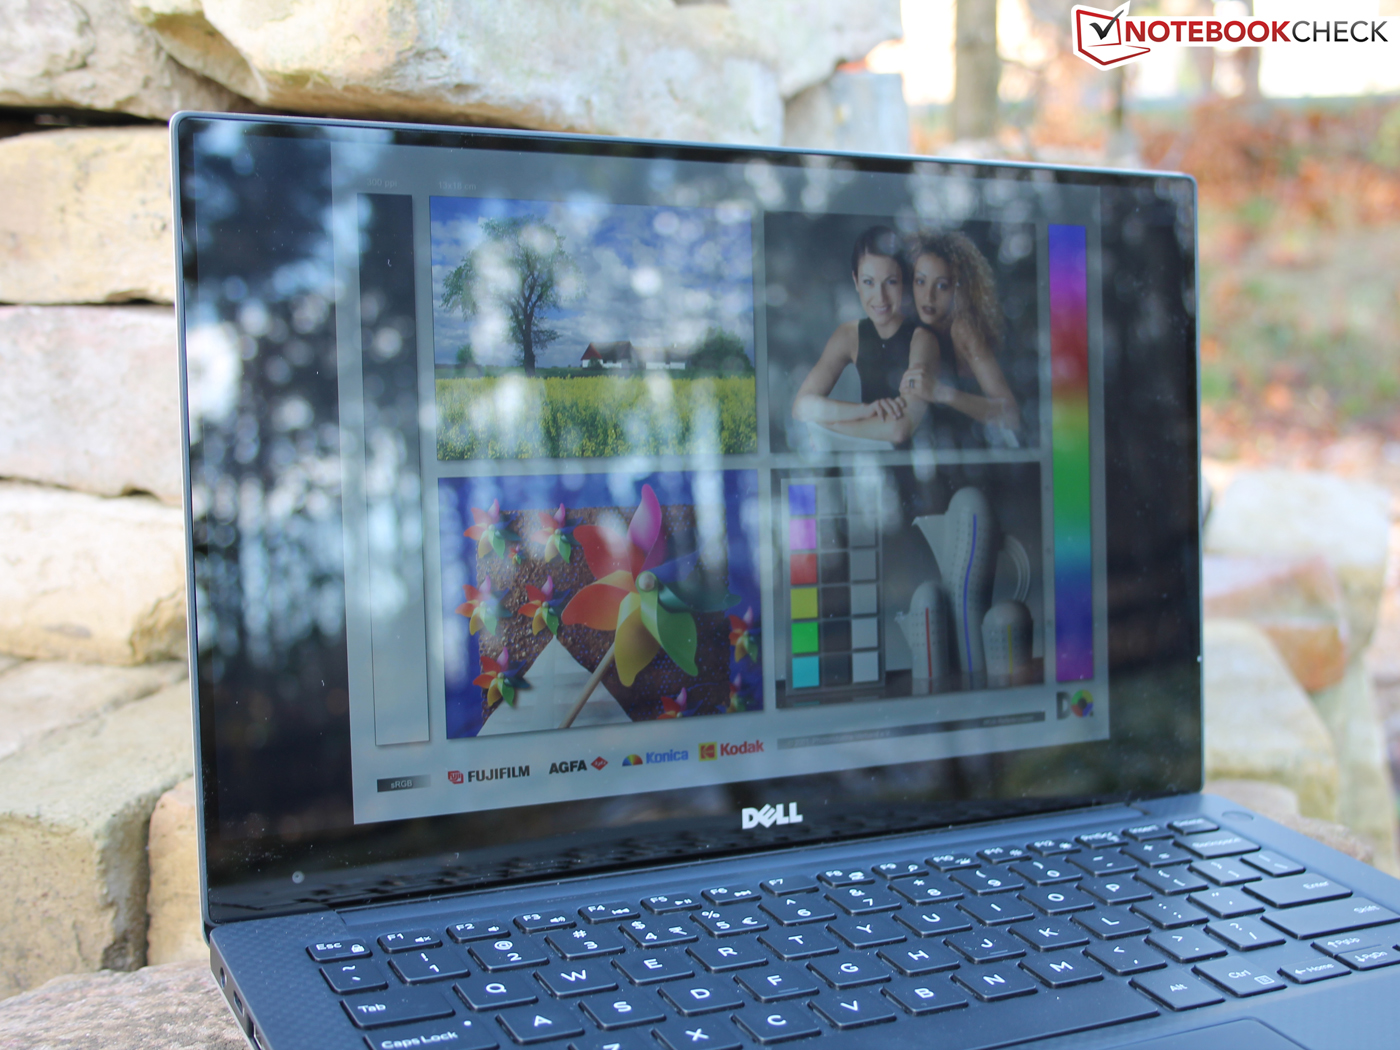
The XPS 13 is not of very much use outdoors. The reflections are simply too strong. The following screenshots were taken using maximum brightness in battery mode. That equals 216 cd/m², which is approximately 70 cd/m² less than in AC mode. Too bad: The "old" FHD XPS 13 had a battery brightness of 410 cd/m² (center); the 2015 QHD touch model achieved 367 cd/m². The matte 2016 FHD looks a bit better outdoors; the tester did not observe dimming in battery mode (Dell XPS 13 9350 FHD battery: 277 cd/m²).
Sun worshipers likely will opt for the FHD version as it does not reduce the brightness in battery mode (maximum is reduced), and it does not present annoying reflections.

Display Response Times
| ↔ Response Time Black to White | ||
|---|---|---|
| 30 ms ... rise ↗ and fall ↘ combined | ↗ 7 ms rise | 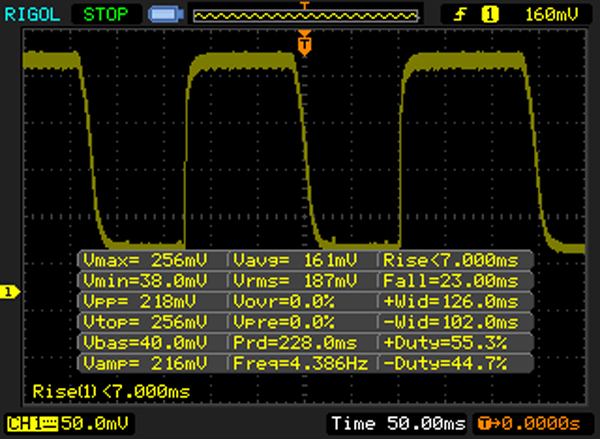 |
| ↘ 23 ms fall | ||
| The screen shows slow response rates in our tests and will be unsatisfactory for gamers. In comparison, all tested devices range from 0.1 (minimum) to 240 (maximum) ms. » 77 % of all devices are better. This means that the measured response time is worse than the average of all tested devices (21.5 ms). | ||
| ↔ Response Time 50% Grey to 80% Grey | ||
| 40 ms ... rise ↗ and fall ↘ combined | ↗ 10 ms rise | 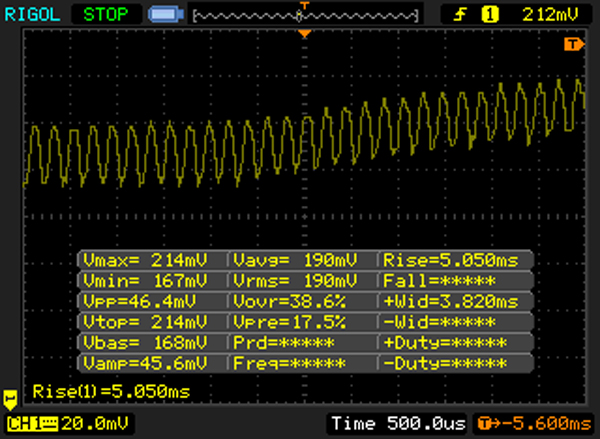  |
| ↘ 30 ms fall | ||
| The screen shows slow response rates in our tests and will be unsatisfactory for gamers. In comparison, all tested devices range from 0.2 (minimum) to 636 (maximum) ms. » 56 % of all devices are better. This means that the measured response time is worse than the average of all tested devices (33.7 ms). | ||
Addendum Response Times 50% gray to 80% gray: PWM flickering causes a thick line (screenshot 2). The beginning of a rise looks like screenshot 1 in a range of 500 microseconds (increase starts here). The measurement was performed in maximum brightness and did not change with/without power supply.
Screen Flickering / PWM (Pulse-Width Modulation)
| Screen flickering / PWM detected | 4900 Hz | ≤ 100 % brightness setting |  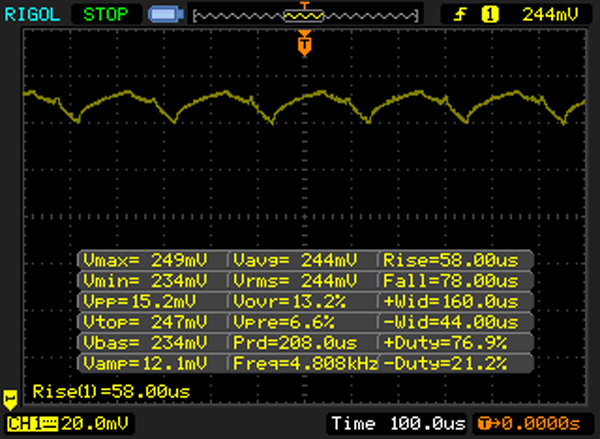 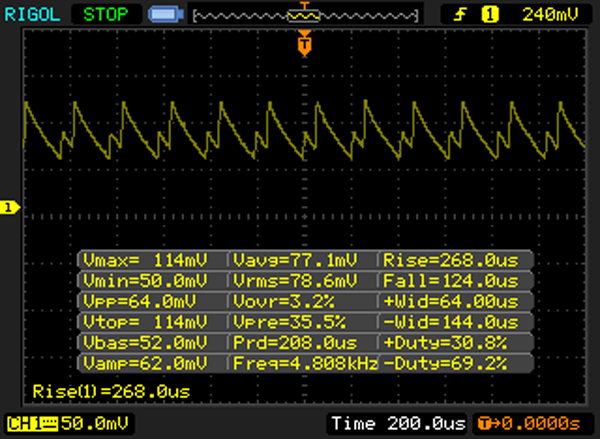 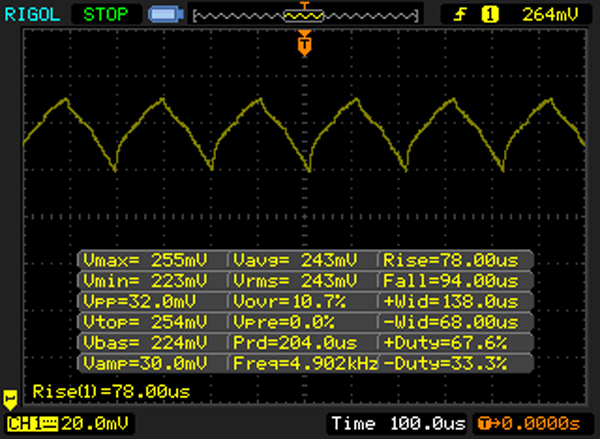 |
The display backlight flickers at 4900 Hz (worst case, e.g., utilizing PWM) Flickering detected at a brightness setting of 100 % and below. There should be no flickering or PWM above this brightness setting. The frequency of 4900 Hz is quite high, so most users sensitive to PWM should not notice any flickering. In comparison: 53 % of all tested devices do not use PWM to dim the display. If PWM was detected, an average of 17903 (minimum: 5 - maximum: 3846000) Hz was measured. | |||
Addendum flickering/PWM: The screen exhibits PWM with and without the power supply in every brightness level including maximum, but at an extremely high frequency of 4800-5000 Hz. That however does NOT occur on a white screen. It rises gradually when increasing the black percentage of the image. In screenshot 4, a black screen covers approximately 80% of the surface. The lower the percentage is (pulling out the window) the flatter the peaks of PWM flickering.
The thick line in screenshot 1 (max. brightness) also exhibits PWM flickering. However, the timeline is too long for recognizing the curves. Screenshot 2 shows the details after zooming in (microsecond range). Reducing the brightness to minimum intensifies the fluctuation (screenshot 3), but the frequency does not change (4800 Hz). We can only explain this very rare PWM phenomenon with Dell's Content Adaptive Backlight Control (CABC), which we - as described above - could not temporarily disable in our review sample.
The viewing angles do not give any reason for complaint. We see a razor-sharp image without color inverting from every perspective. The high contrast takes care of the rest even if it is no longer as high as in Dell's XPS 13-9343 due to the lower brightness.

Performance
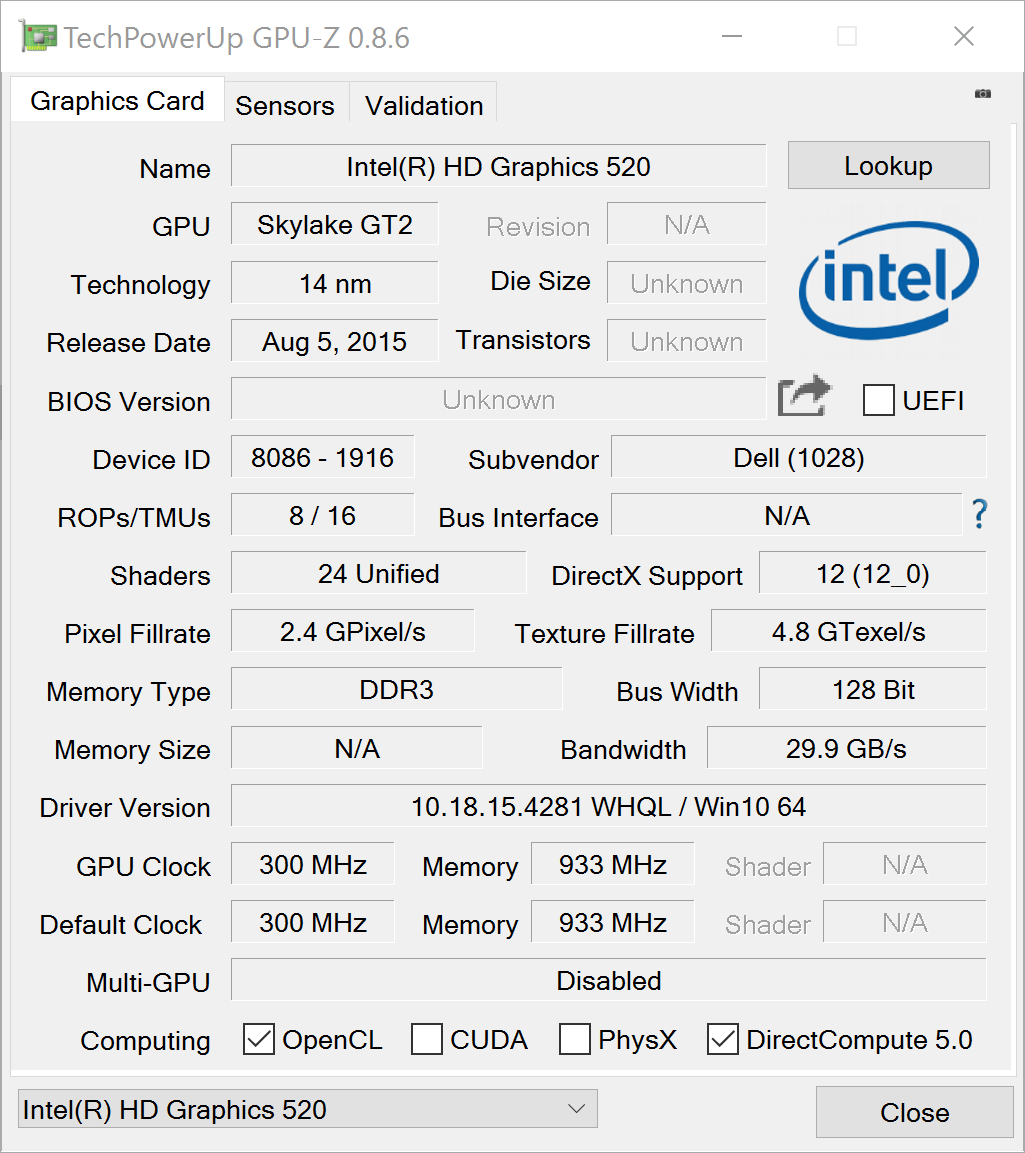
Our XPS 13 is furnished with maximum performance thanks to its Skylake Core i7-6500U (2.5 - 3.1 GHz). Our US colleagues had the XPS 13 9350 with a Core i5-6200U (2.3 GHz) and FHD TFT in the test. The 256 GB NVMe PCIe SSD is identical, just like the integrated HD Graphics 520. The performance based on these components is on the highest Ultrabook level that is presently available in retail. A reason for that is also the ultra-fast NVMe SSD that we examine extensively in the review of the XPS 13 2016 i5.
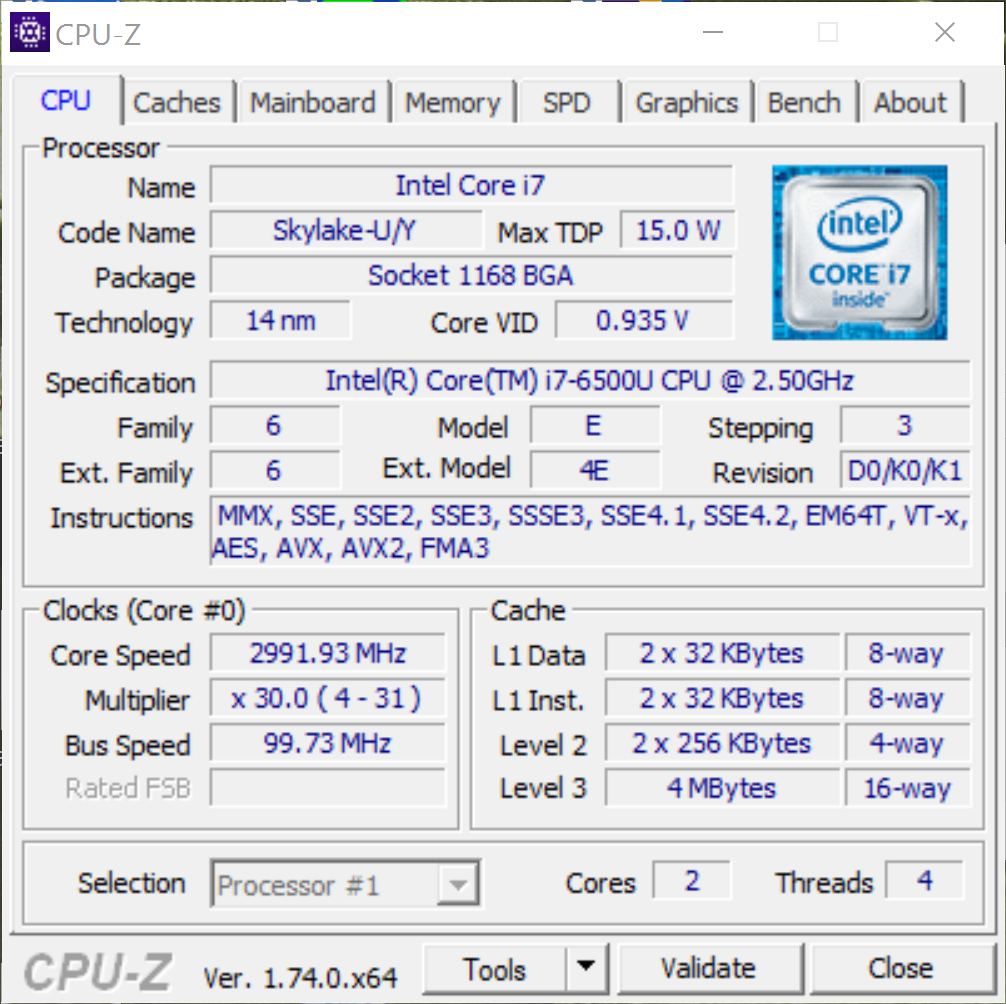

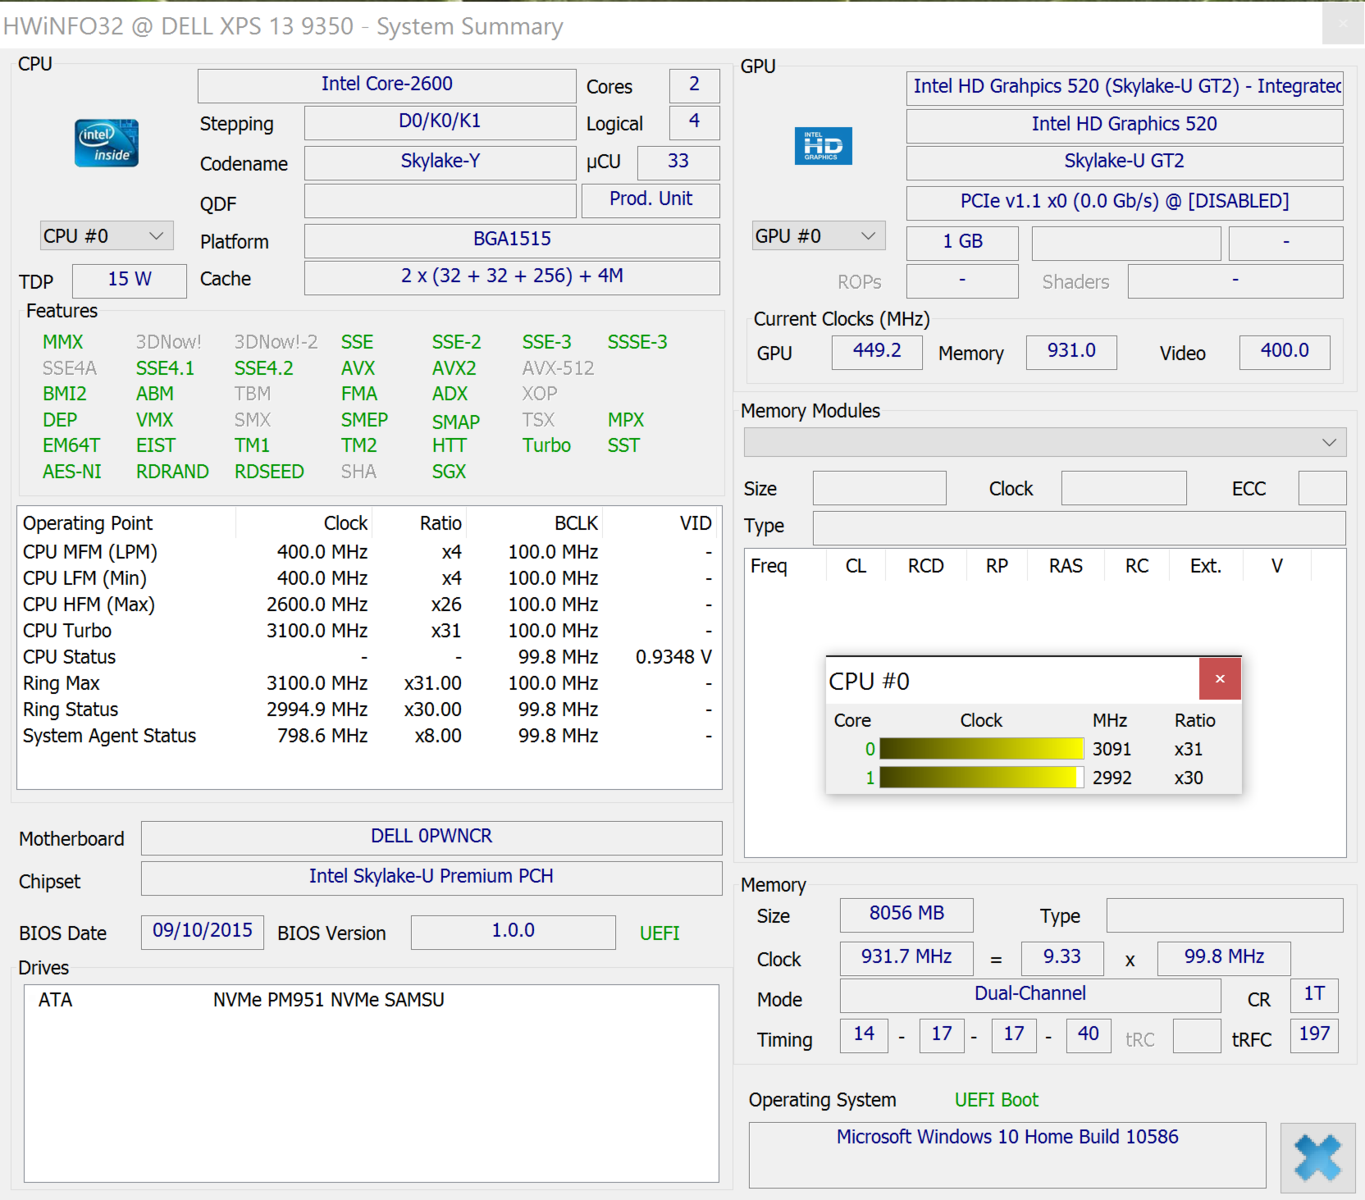
Processor
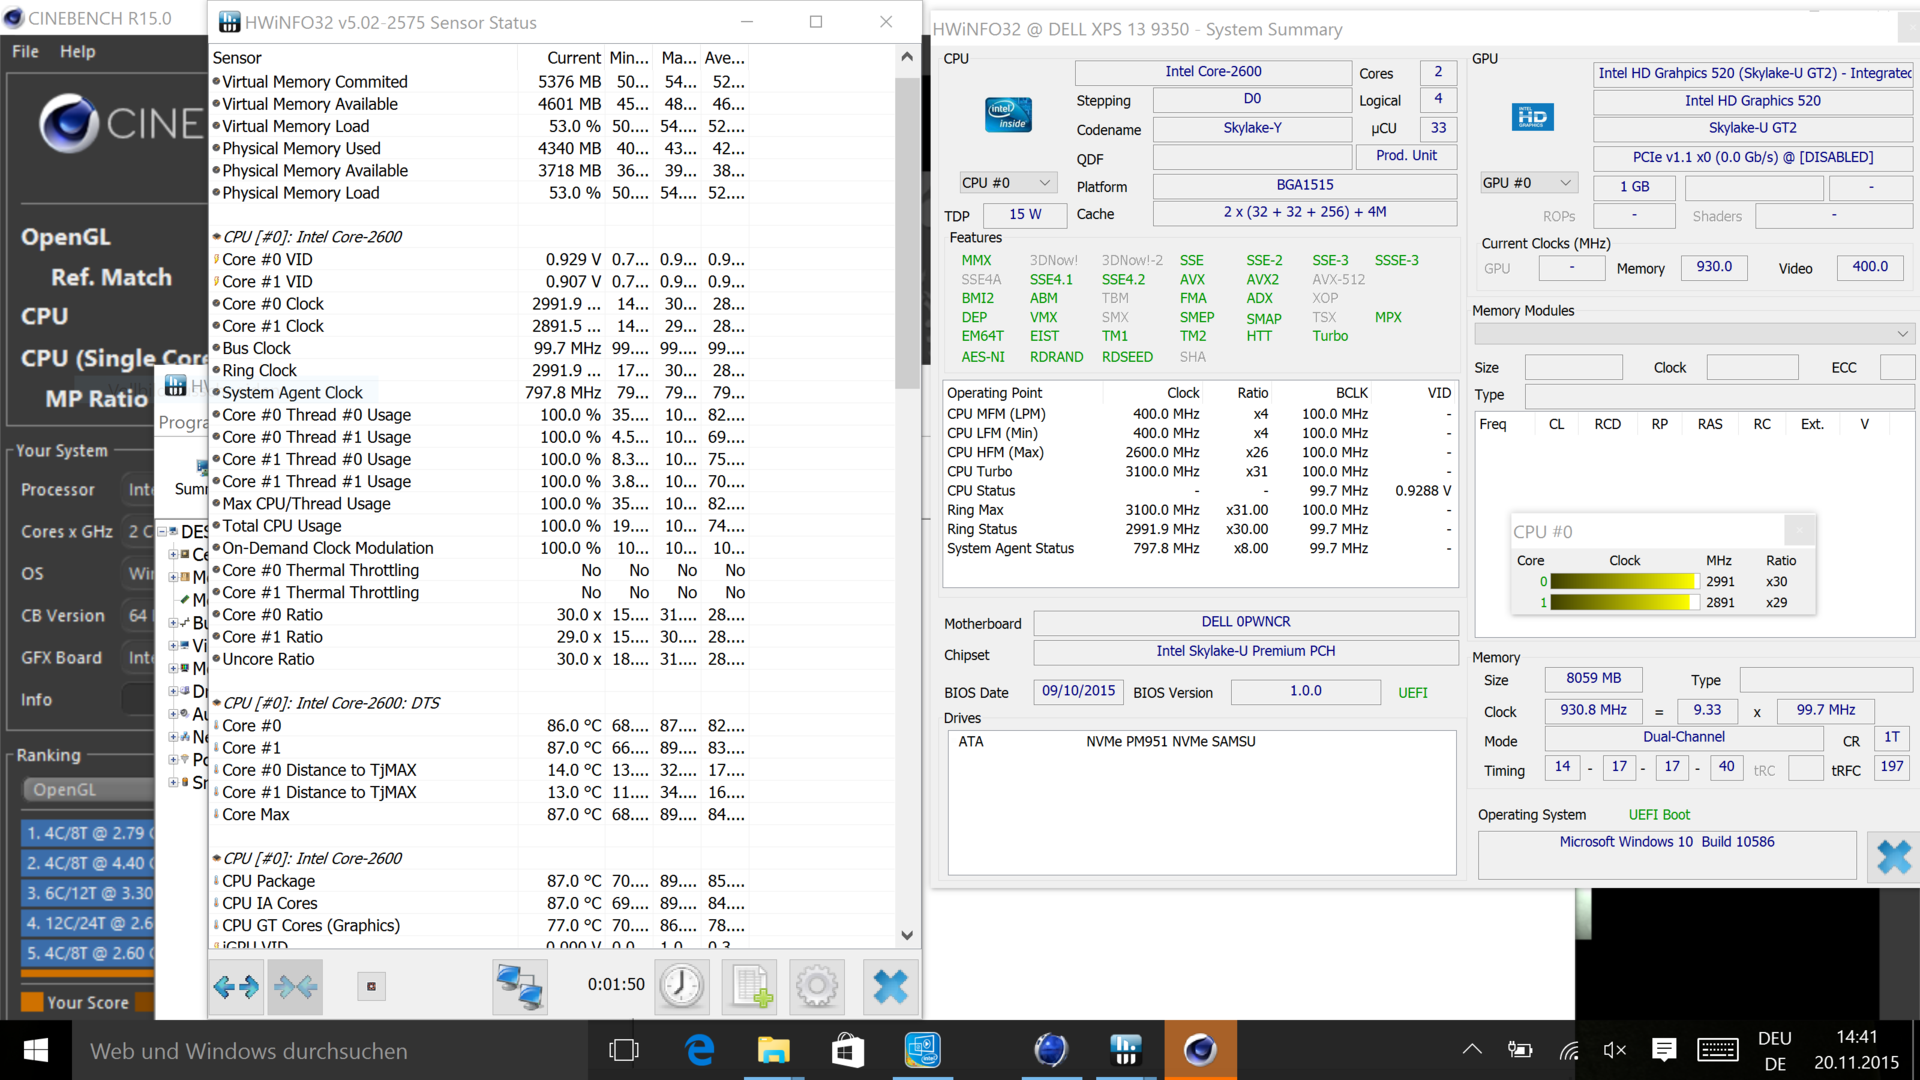
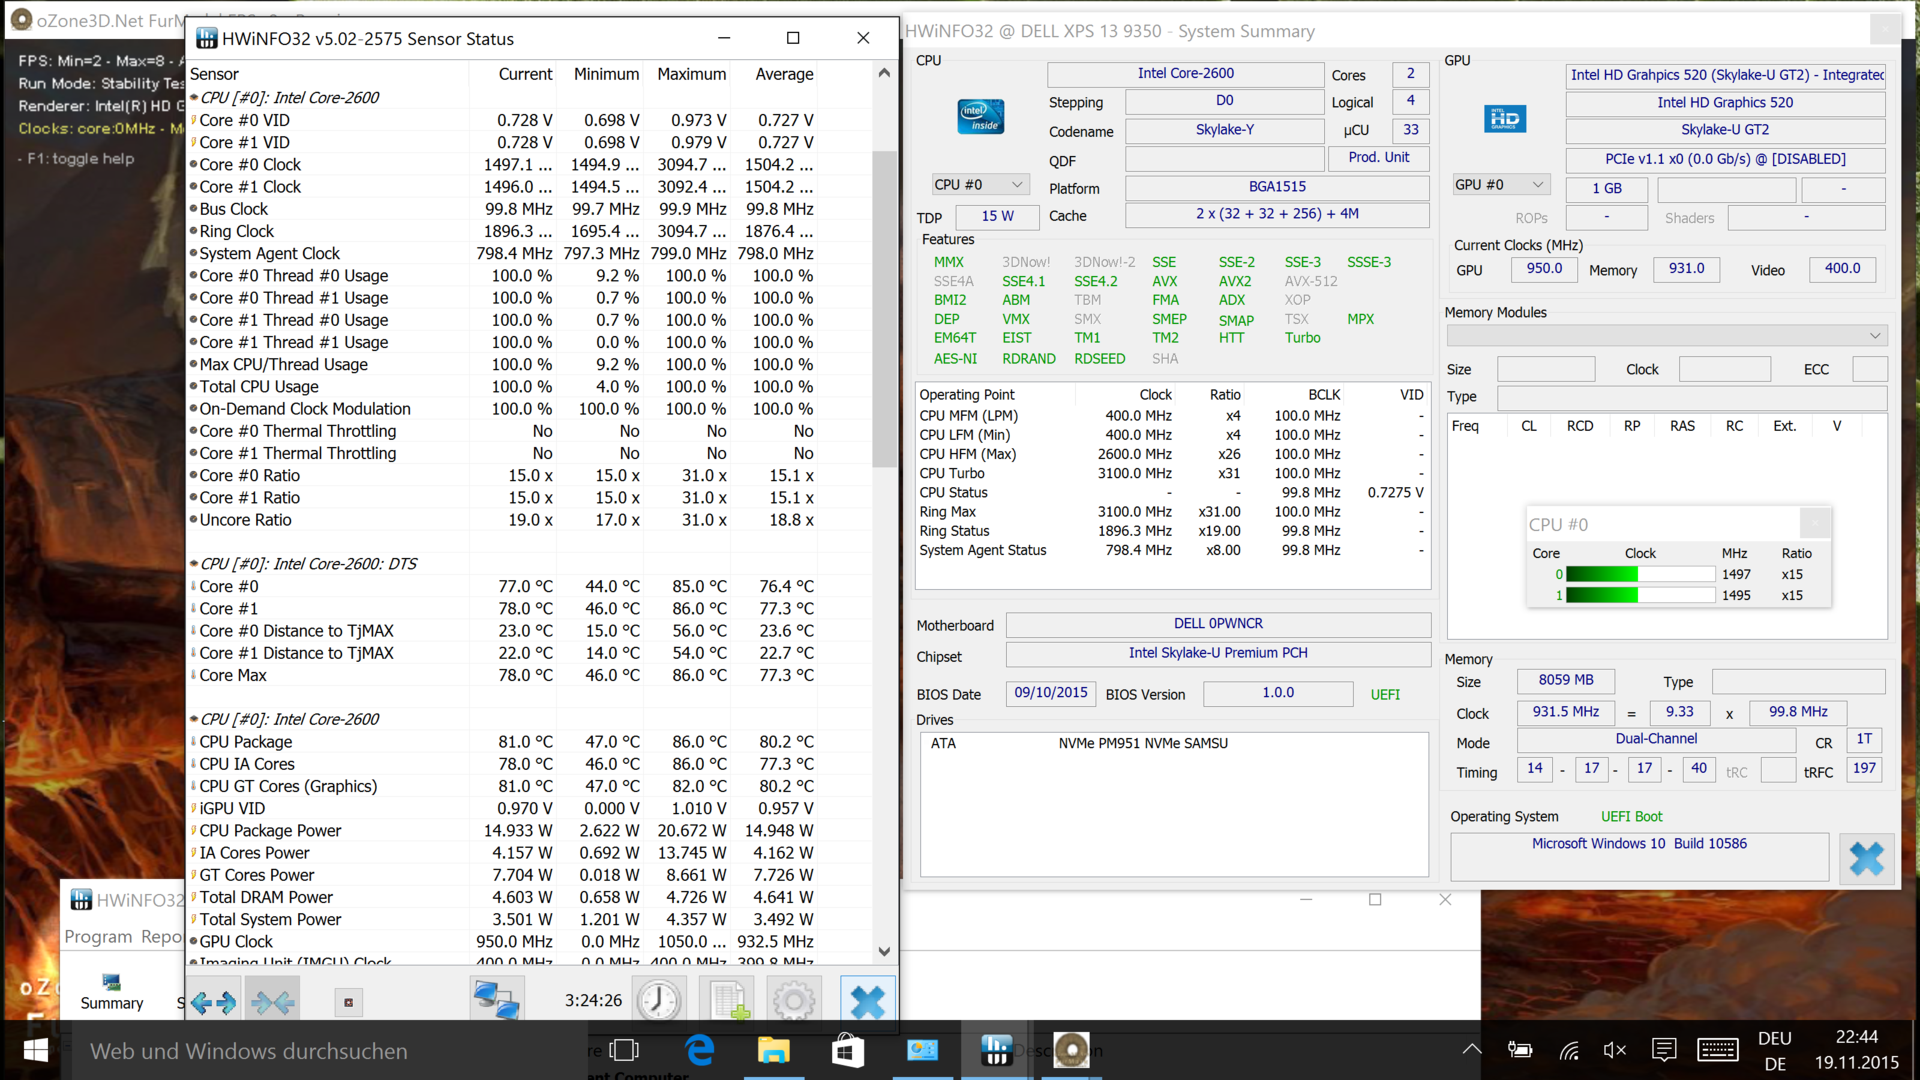
As usual, we look at the clock behavior during multiple Cinebench tests. The dual-core performs the multi-core test at a stable 2.9 GHz, which is clearly within the Turbo range. 3.0 GHz are even sometimes observed at initiation, but only for 20 to 40 seconds depending on casing and ambient temperature. That is an impressive and, above all, stable Turbo utilization at its very best. The SoC even maintains its 2.9 GHz after one hour of looping Cinebench R15. Kudos for such a slim casing.
The Core i5-6200U in the sister model performed these tests at 2.7 GHz (max. Turbo: 2.8 GHz), i.e. also with the best possible multi-core performance. There is nothing to complain about here, which the charts confirm. The 6200U only lags behind the 6500U installed here by 5/9% and 7/12% (R15/R11.5 both multi/single). The advantage in processing performance is very marginal, and thus buying the more expensive Core i7 model is only worthwhile for specific high-performance application fields.
The 2015 XPS 13 with the Broadwell Core i5 (-28/34 multi) is certainly outclassed significantly. The machines from Microsoft with an i5-6300U (2.4 - 3.0 GHz) are on par despite a 100 MHz lower clock (measuring tolerance). Consequently, computing power will hardly be the decisive point for buying.
System Performance
We rely on PCMark 7 and 8 for the application performance. The PCM8 Work Score achieves a 9% better result and the Home Score a 6% better result than the i5 model in the XPS 13. PCMark 7 does not ascertain any difference (score 0% difference). The XPS 13 2015 sometimes lags behind by 9%, but that again is not a significant yardstick. Creative Score Accelerated v2 repeatedly finished at 1450 or 0 points before recurrently crashing. Since this score does not fit in the overall picture at all, we faded them out in the chart.
PCMark 7 generally has a high affinity for SSD systems, and thus all comparison devices are on par here. Somewhat irritating: The NVMe SSDs are not always the winners; the Samsung SSD PM851 M.2 in the XPS 13-9343 leads the comparison together with the NVMe in the Surface Pro 4.
| PCMark 7 Score | 4977 points | |
| PCMark 8 Home Score Accelerated v2 | 2822 points | |
| PCMark 8 Work Score Accelerated v2 | 3735 points | |
Help | ||
Storage Device
The PM951 NVMe SSD in the review sample (MZ-VLV256D) lags behind the identical PM951 in the i5 XPS in throughput rates. That might be due to measuring tolerances; we performed the tests in delivery state in both cases. The Samsung PM852 SSD in the XPS 13-9343 is clearly outperformed. The Lite-On IT L8T-256L9G model keeps up quite well in total. Microsoft is knocked out of the competition here; the Surface Pro and Book can only recovers points in sequential read, but are inferior in other measuring sectors. Unlike Apple's MB Air 13 2015, which keeps the standards high (+ 33%); the throughput rates of its PCIe M.2 SSD are impressive. As seen above, that is also dependent on system performance, which is why Apple's MB Air 13 2015 is second to none for performance geeks.
| Dell XPS 13-9350 Touch Samsung PM951 NVMe MZ-VLV256D | Dell XPS 13-9350 Non-Touch Samsung PM951 NVMe MZ-VLV256D | Dell XPS 13-9343 Touch Lite-On IT L8T-256L9G | Dell XPS 13-9343 Non-Touch Samsung SSD PM851 M.2 2280 128GB | Apple MB Air 13 2015-03 Apple SSD SD0256F | MS Surface Pro 4 Samsung MZFLV128 NVMe | MS Surface Book Samsung MZFLV256 NVMe | |
|---|---|---|---|---|---|---|---|
| CrystalDiskMark 3.0 | -12% | -11% | -40% | 33% | -31% | ||
| Read Seq | 764 | 1097 44% | 489.6 -36% | 526 -31% | 1352 77% | 666 -13% | |
| Write Seq | 311.4 | 307.7 -1% | 424.2 36% | 124.2 -60% | 1111 257% | 154.2 -50% | |
| Read 4k | 42.16 | 38.52 -9% | 34.76 -18% | 27.82 -34% | 21.93 -48% | 28.51 -32% | |
| Write 4k | 121 | 113 -7% | 79.3 -34% | 95.5 -21% | 30.94 -74% | 101.5 -16% | |
| Read 4k QD32 | 485.7 | 244.7 -50% | 354 -27% | 325.7 -33% | 339.5 -30% | 368.3 -24% | |
| Write 4k QD32 | 293.6 | 151.5 -48% | 326.3 11% | 124.5 -58% | 342.9 17% | 153.6 -48% | |
| AS SSD | -22% | -18% | -39% | 41% | -20% | 22% | |
| Seq Read | 735 | 1243 69% | 484.7 -34% | 497.9 -32% | 1212 65% | 832 13% | 1223 66% |
| Seq Write | 301.2 | 152.6 -49% | 416.8 38% | 119.6 -60% | 1001 232% | 142.5 -53% | 275.2 -9% |
| 4K Read | 38.21 | 34.61 -9% | 30.89 -19% | 25.94 -32% | 19.16 -50% | 34.24 -10% | 34.31 -10% |
| 4K Write | 97.6 | 0.98 -99% | 58.8 -40% | 84 -14% | 23.73 -76% | 86.5 -11% | 85 -13% |
| Score Read | 809 | 1147 42% | 425 -47% | 441 -45% | 1281 58% | 645 -20% | 1566 94% |
| Score Write | 391 | 60 -85% | 369 -6% | 184 -53% | 463 18% | 239 -39% | 394 1% |
| Copy ISO MB/s | 317.8 | 283.1 | 643 | 121.9 | 388.2 | ||
| Copy Program MB/s | 149.1 | 157.5 | 245 | 63.5 | 174.1 | ||
| Total Average (Program / Settings) | -17% /
-17% | -15% /
-15% | -40% /
-39% | 37% /
37% | -26% /
-25% | 22% /
22% |

Graphics Card
The HD 520 can clock up to 1050 MHz in Boost, theoretically. However, that is not the case in the review sample. HWinfo reports 950 to 1000 MHz during the OpenGL test. Consequently, the scores are on par with the i5 sister model; the 1% difference is within the range of measuring tolerances. The older HD Graphics 5500 is degraded to second place as it is almost 15% weaker. The HD 520 in MS's Surface Pro 4 also maintains this level. Only the Surface Book can excel thanks to the Maxwell GPU integrated in the keyboard dock (+27%).
Will the games confirm this? A comparison is more difficult due to incomplete data. However, "BioShock Infinite" already falls behind the HD 5500 by 16%. The HD 6000 in Apple's MB Air 13 is almost on par with our HD 520 also in "Tomb Raider". The Maxwell GPU in the Surface Book of course outruns the rivals and reaps in an even much higher advantage in real games than in the synthetic 3DMarks (+27%).
| 3DMark - 1280x720 Cloud Gate Standard Score (sort by value) | |
| Dell XPS 13-9350 Touch | |
| Dell XPS 13-9350 Non-Touch | |
| Dell XPS 13-9343 Touch | |
| Dell XPS 13-9343 Non-Touch | |
| Apple MB Air 13 2015-03 | |
| MS Surface Pro 4 | |
| MS Surface Book | |
| 3DMark 11 Performance | 1556 points | |
| 3DMark Ice Storm Standard Score | 52990 points | |
| 3DMark Cloud Gate Standard Score | 5896 points | |
| 3DMark Fire Strike Score | 847 points | |
Help | ||
Gaming Performance
The integrated Intel graphics will not satisfy gamers; playing in native resolution should not even be considered. However, everything that can be played on the modest level of an HD 520 in accordance with its spec sheet should be possible on the XPS 13.
| Metro 2033 - 1360x768 Normal DX10 AA:A AF:4x (sort by value) | |
| Dell XPS 13-9350 Non-Touch | |
| Dell XPS 13-9343 Touch | |
| BioShock Infinite - 1366x768 Medium Preset (sort by value) | |
| Dell XPS 13-9350 Touch | |
| Dell XPS 13-9350 Non-Touch | |
| Dell XPS 13-9343 Touch | |
| Apple MB Air 13 2015-03 | |
| MS Surface Pro 4 | |
| MS Surface Book | |
| Tomb Raider - 1366x768 Normal Preset AA:FX AF:4x (sort by value) | |
| Dell XPS 13-9350 Touch | |
| Apple MB Air 13 2015-03 | |
| MS Surface Pro 4 | |
| MS Surface Book | |
| low | med. | high | ultra | |
| Tomb Raider (2013) | 71.8 | 36.6 | 24.4 | 11.2 |
| BioShock Infinite (2013) | 51.4 | 27.9 | 24.1 | 7.4 |
| Dirt Rally (2015) | 95 | 23.6 | 12.7 | |
| Metal Gear Solid V (2015) | 43.7 | 28.3 | 11.5 |
Emissions

System Noise
The noise production is restrained during undemanding use; the XPS is only noiseless in permanent idle phases. The fan rarely spins in high performance mode, and strongly depends on the background applications of the operating system. We measured a maximum idling noise of 34.8 dB(A), which is the same as under load. Although the fan has intermediate levels and does not speed up sporadically, we either did not hear anything or just the maximum noise in practice.
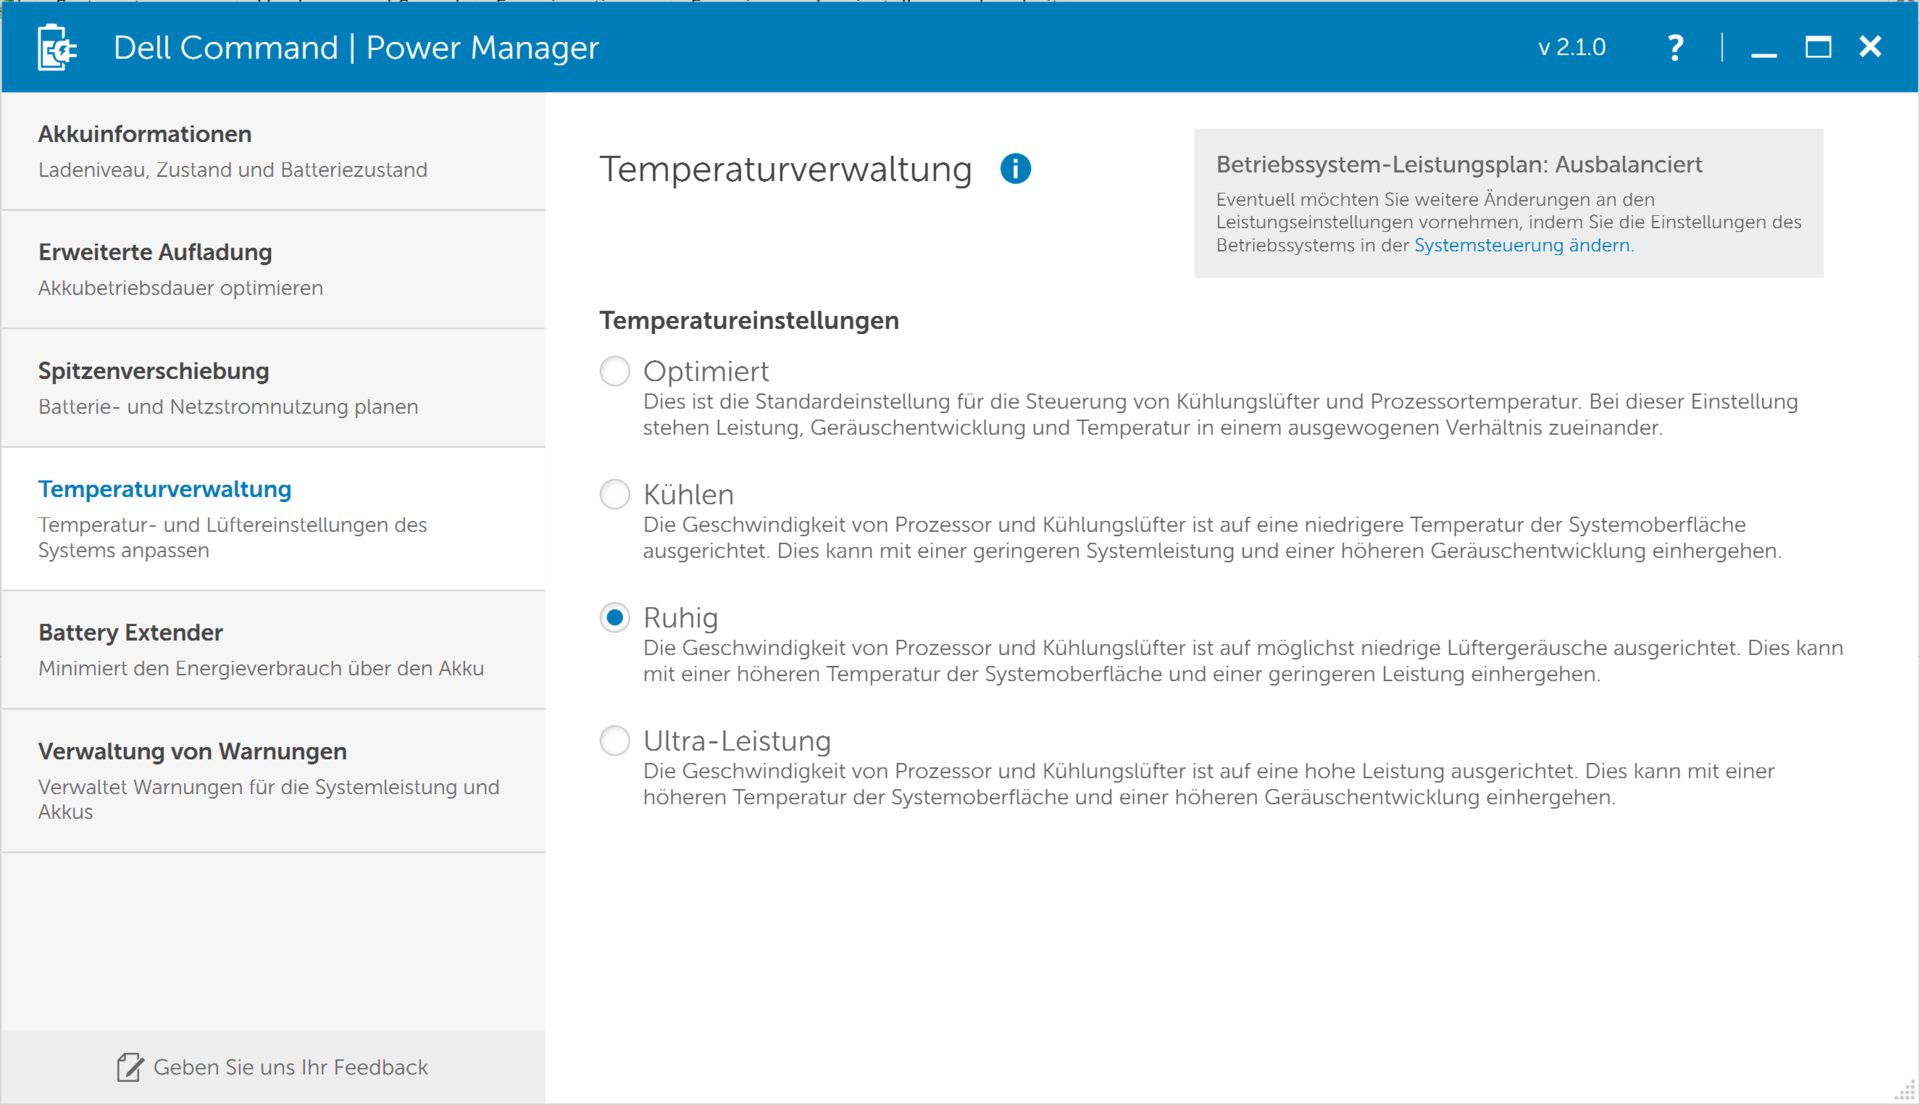
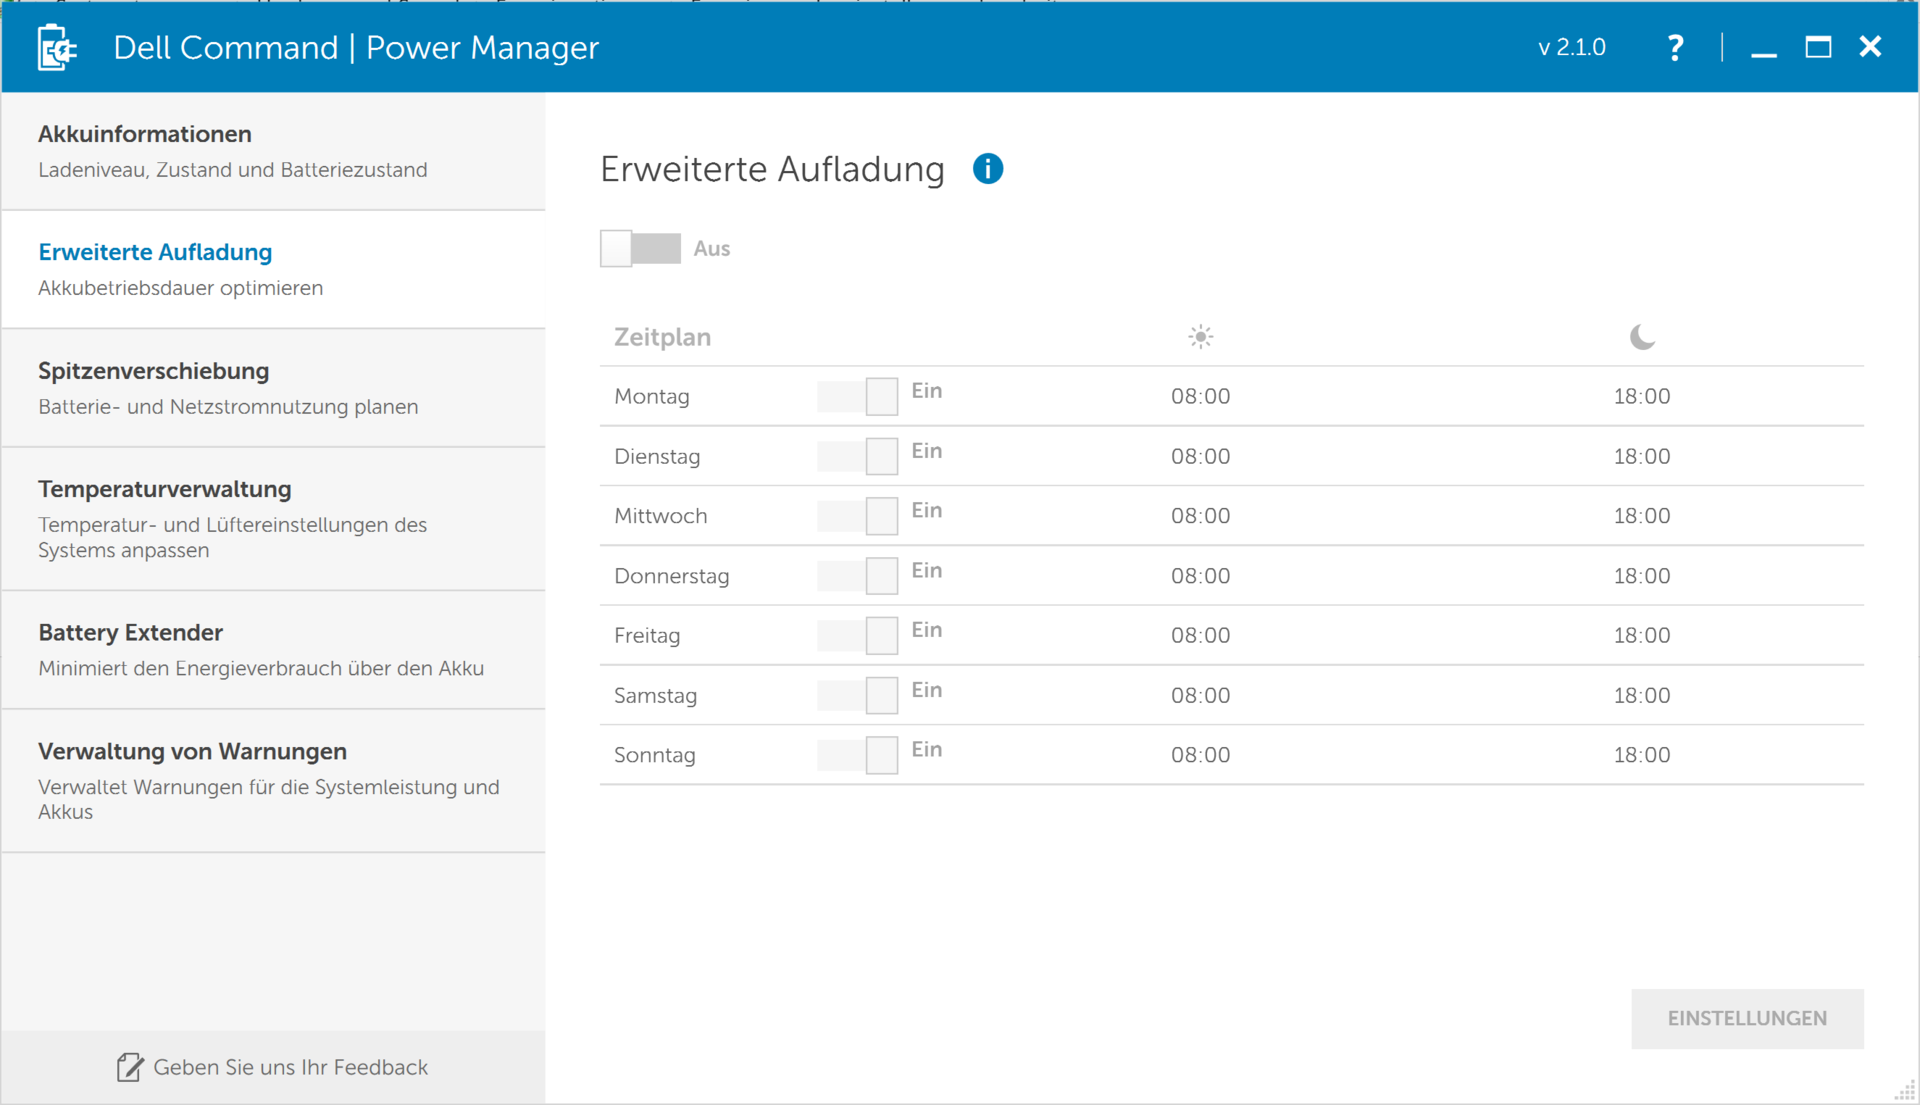
We installed "Dell Command Power Manager" since it was not preloaded on our review sample. In addition to battery specifications, the user will also find a temperature manager. The fan was permanently disabled when we set the "Quiet" mode here and "Passive" under Windows' system cooling policy, but only in balanced / high performance.
The differences to the XPS 13-9350 are due to another measuring environment determined by different base noise (silent = 28.1). 31.8 dB(A) stands for the inactive fan in this test. The maximum increase under load of 2-3 dB(A) is roughly the same in both XPS models.
The chart's brief statement: Dell likely has one of the quietest devices in its lineup with the XPS 13. The "noisy" Surface Pro 4 can take an example from that, not to mention Apple's MB Air 13 2015-03 that roars with 46 dB(A) in the stress test. The screenshot illustrates the minor overhead in the comparison of minimum average idling noise (green) and load noise (avg / max; red / yellow).
| Dell XPS 13-9350 Touch HD Graphics 520, 6500U, Samsung PM951 NVMe MZ-VLV256D | Dell XPS 13-9350 Non-Touch HD Graphics 520, 6200U, Samsung PM951 NVMe MZ-VLV256D | Dell XPS 13-9343 Touch HD Graphics 5500, 5200U, Lite-On IT L8T-256L9G | Dell XPS 13-9343 Non-Touch HD Graphics 5500, 5200U, Samsung SSD PM851 M.2 2280 128GB | Apple MB Air 13 2015-03 HD Graphics 6000, 5650U, Apple SSD SD0256F | MS Surface Pro 4 HD Graphics 520, 6300U, Samsung MZFLV128 NVMe | MS Surface Book Maxwell GPU (940M, GDDR5), 6300U, Samsung MZFLV256 NVMe | |
|---|---|---|---|---|---|---|---|
| Noise | 13% | -3% | 7% | -3% | -4% | 1% | |
| Idle Minimum * | 31.8 | 28.2 11% | 30.2 5% | 29 9% | 29.2 8% | 31.5 1% | 29.5 7% |
| Idle Average * | 31.8 | 28.3 11% | 30.3 5% | 29.1 8% | 29.2 8% | 31.5 1% | 29.6 7% |
| Idle Maximum * | 34.8 | 28.4 18% | 30.4 13% | 29.2 16% | 29.2 16% | 31.5 9% | 29.7 15% |
| Load Average * | 34.8 | 30.2 13% | 34.4 1% | 31.1 11% | 40.2 -16% | 40.5 -16% | 37.5 -8% |
| Load Maximum * | 34.8 | 30.2 13% | 48 -38% | 38.4 -10% | 46.3 -33% | 40.7 -17% | 40.9 -18% |
* ... smaller is better
Noise Level
| Idle |
| 31.8 / 31.8 / 34.8 dB(A) |
| Load |
| 34.8 / 34.8 dB(A) |
 | ||
30 dB silent 40 dB(A) audible 50 dB(A) loud |
||
min: | ||
Temperature
The XPS 13 i7 can get quite warm; we measured as much as 57 degrees Celsius (134.6 Fahrenheit) in some areas on the upper side and underside. We prompted these temperatures with our stress test that demands everything from the components. This test shows what the system does to control the waste heat in the worst case. It cannot be compared with normal use load, for example via video rendering.
The XPS 13 i7 manages this situation like its i5 sister model: The clock is clearly reduced to below the nominal clock of 2.5 GHz - i7 @ 1.5; i5 @ 1.4 GHz. The temperatures on the SoC climbed to just below 90 degrees (194 Fahrenheit) in both devices, and settled to around 80 degrees (176 Fahrenheit) after throttling stopped.
The iGPU only reduced its clock marginally under stress, so to 900 MHz. That is 50 to 100 MHz less than under simple GPU load via a Cinebench OpenGL test. The HD 520 in the XPS 13-9350 with Core i5 performed the stress test at 950 MHz. Consequently, the GPUs in both XPS models remain behind their potential of 1050 MHz in this (rare) application scenario.
The chart illustrates: Apparently, the XPS 13 i5 manages its waste heat a bit better; the rates are lower especially since we assessed the i7 model at a cooler room temperature. The Surface Pro 4 with its active cooling in the tablet unit is roughly on the same increased waste heat level. Some other rivals and the predecessor remain much cooler.
| Dell XPS 13-9350 Touch HD Graphics 520, 6500U, Samsung PM951 NVMe MZ-VLV256D | Dell XPS 13-9350 Non-Touch HD Graphics 520, 6200U, Samsung PM951 NVMe MZ-VLV256D | Dell XPS 13-9343 Touch HD Graphics 5500, 5200U, Lite-On IT L8T-256L9G | Dell XPS 13-9343 Non-Touch HD Graphics 5500, 5200U, Samsung SSD PM851 M.2 2280 128GB | Apple MB Air 13 2015-03 HD Graphics 6000, 5650U, Apple SSD SD0256F | MS Surface Pro 4 HD Graphics 520, 6300U, Samsung MZFLV128 NVMe | MS Surface Book Maxwell GPU (940M, GDDR5), 6300U, Samsung MZFLV256 NVMe | |
|---|---|---|---|---|---|---|---|
| Heat | 15% | 19% | 19% | 20% | -4% | 26% | |
| Maximum Upper Side * | 57 | 45.2 21% | 40.6 29% | 44.6 22% | 43.8 23% | 52.3 8% | 44.2 22% |
| Maximum Bottom * | 56 | 45.2 19% | 41.2 26% | 44.8 20% | 42.1 25% | 51.4 8% | 41.2 26% |
| Idle Upper Side * | 34.1 | 30.4 11% | 31.2 9% | 28.8 16% | 28.5 16% | 43.2 -27% | 26 24% |
| Idle Bottom * | 34.3 | 31.2 9% | 30.6 11% | 28.8 16% | 28.9 16% | 36 -5% | 23.8 31% |
* ... smaller is better
(-) The maximum temperature on the upper side is 57 °C / 135 F, compared to the average of 35.9 °C / 97 F, ranging from 21.4 to 59 °C for the class Subnotebook.
(-) The bottom heats up to a maximum of 56 °C / 133 F, compared to the average of 39.4 °C / 103 F
(+) In idle usage, the average temperature for the upper side is 29.9 °C / 86 F, compared to the device average of 30.7 °C / 87 F.
(±) The palmrests and touchpad can get very hot to the touch with a maximum of 37.5 °C / 99.5 F.
(-) The average temperature of the palmrest area of similar devices was 28.3 °C / 82.9 F (-9.2 °C / -16.6 F).
Speakers
Information about the speakers' sound can be found in the review of the XPS 13 i5.
The microphone recordings are perfect, i.e. static-free and have a relatively stable level no matter whether the speaker is fifty centimeters (~20 in) away from the device or three meters (~10 ft). A better webcam would have made this combination with the dual-array microphone into a showpiece for conferences and calls.
Energy Management
Power Consumption
The power consumption of the i7 review sample was measured with a new instrument (MetraHIT Energy), making the rates in the chart below only conditionally comparable. We did not perform power measurements with the XPS 13-9350 at the time. The chart shows the typically low power consumption only in the load range. The QHD+ model consumes considerably more power when idle than Apple's MB Air 13 and the Surface Pro 4 (MetraHIT measurement), both with similarly high resolutions. The devices' minimum brightness levels vary. The brightness alone cannot, however, explain the minimum idle noise differences.
| Dell XPS 13-9350 Touch 6500U | Dell XPS 13-9350 Non-Touch 6200U | Dell XPS 13-9343 Touch 5500U | Dell XPS 13-9343 Non-Touch 5200U | |
|---|---|---|---|---|
| Power Consumption | -0% | 26% | 24% | |
| Idle Minimum * | 6.8 | 6.6 3% | 2.7 60% | 4.4 35% |
| Idle Average * | 10 | 9.3 7% | 5.7 43% | 9 10% |
| Idle Maximum * | 10.5 | 11 -5% | 6 43% | 10.7 -2% |
| Load Average * | 30.2 | 32.2 -7% | 32.1 -6% | 19.6 35% |
| Load Maximum * | 33.6 | 33.2 1% | 36.2 -8% | 19.9 41% |
* ... smaller is better
| Off / Standby | |
| Idle | |
| Load |
|
Battery Runtime
i7 owners clearly are at a disadvantage in terms of battery life; the Wi-Fi test stopped 35% earlier than with the i5 model (~ 118 minutes). We used the balanced profile at 150 cd/m² without Dell's Command Power Manager features (was not preloaded) for the test. The XPS 13 QHD+ is consequently not on the high level of an Apple MB Air 13 2015 that lasts almost twice as long in the Wi-Fi test. The other tests (idle, load) are proportionate to this test. We performed the idle test a second time using Dell's energy-saving features (Power Manager) and the power-saving mode: A runtime of 9:18 hours is a bit shorter, but is still within the range of measuring tolerances.
Update 12/03/15: Dell frantically unleashes the 1.1.7 BIOS version. Its improvements are to lead to drastically longer battery runtimes. The manufacturer will officially introduce this BIOS update within the next few days. The testers received an unofficial download that we are not permitted to provide here. According to Dell, the present BIOS prevents the new NVMe-based configurations to utilize the Low-Power C-States from Skylake. We took the opportunity the second time around to also update the existing audio, Wi-Fi and VGA drivers. And in fact, the runtimes have improved considerably. The idle runtime increases from previously 9:37 (577 min) to 13:04 hours. Wi-Fi even improves its lead of 5:33 (333 minutes) to decent 7:12 hours. The XPS 13 can thus keep up quite well with its rivals.
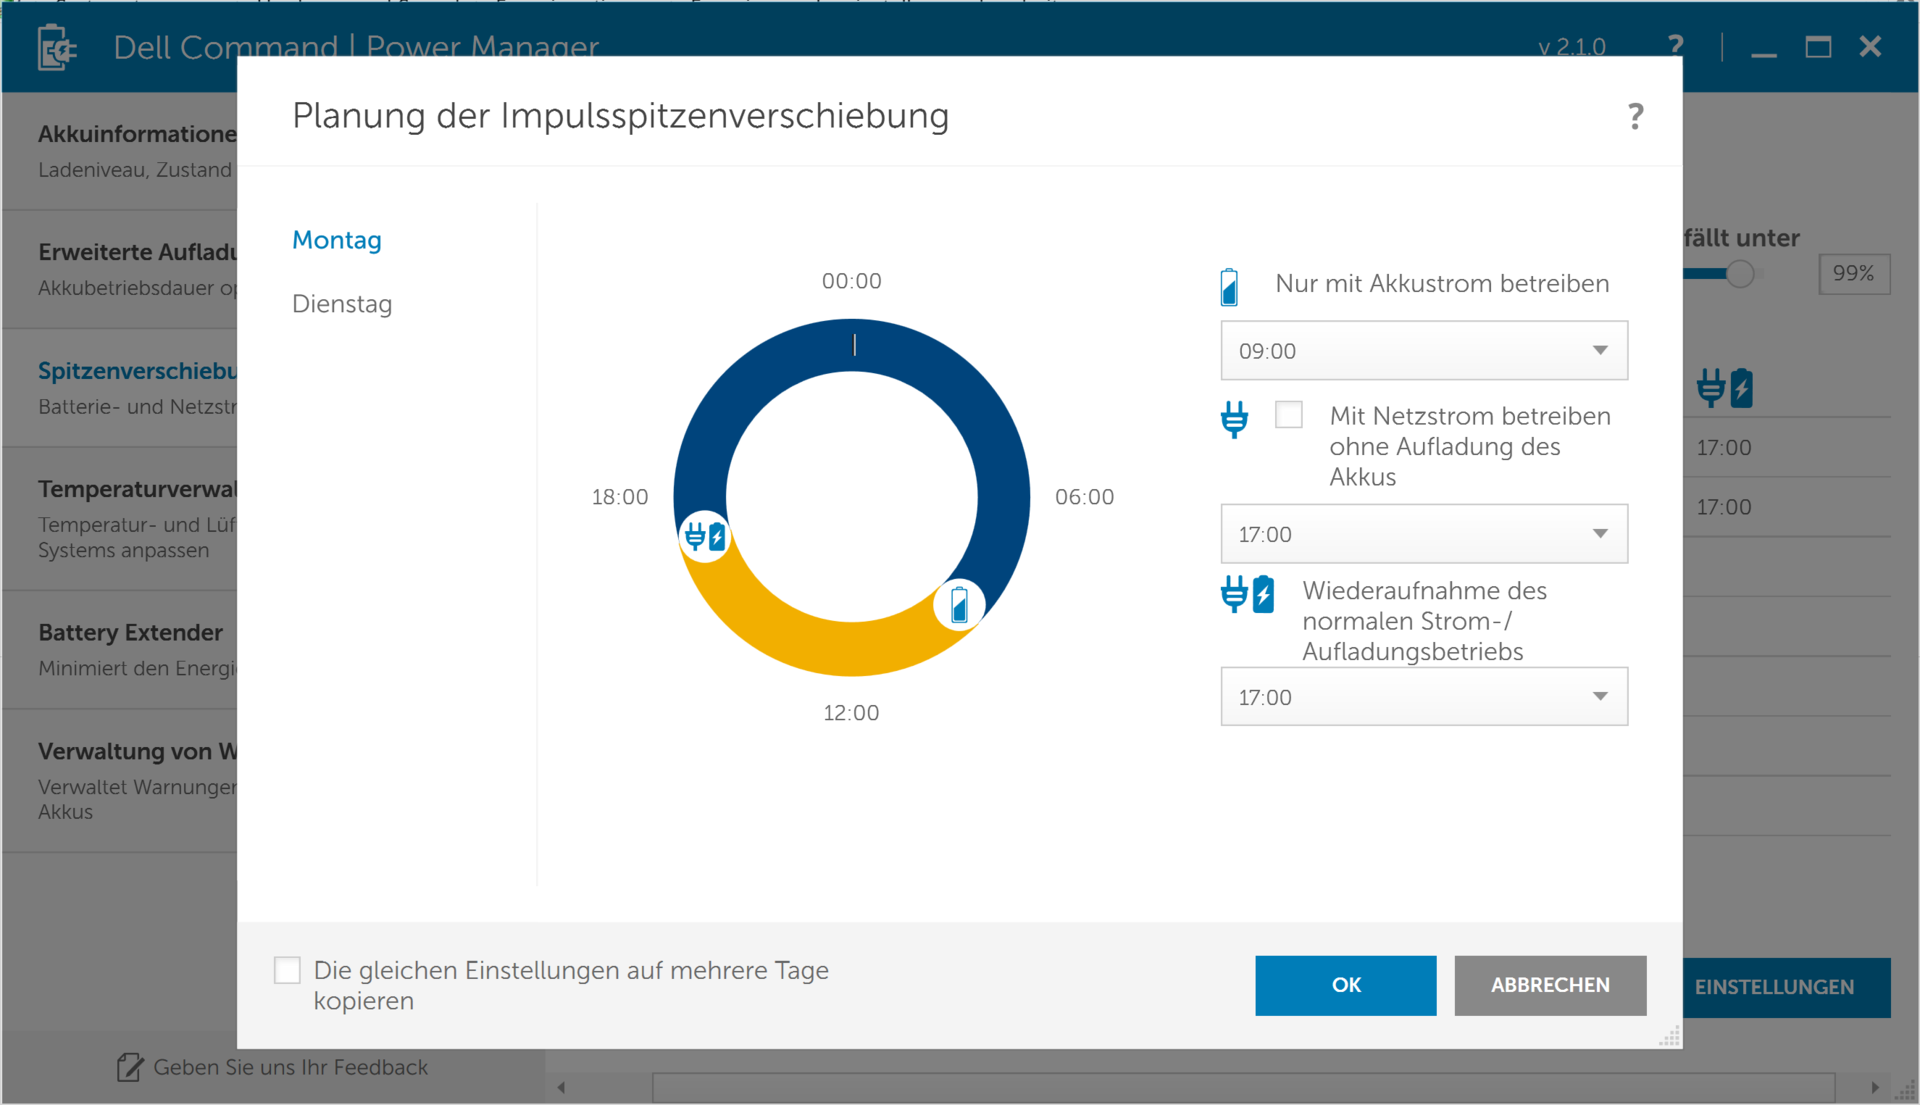
Dell's Command Power Manager enables intervening in the automatic battery charge as well as in the power consumption. Clever users can even prompt battery mode although the device is connected to a power outlet. Of course, it is also possible to disable battery charging at pre-defined times. Dell has apparently designed its device for the decentralized power supply (Smart Power Grid) of the future. Whether the XPS user is at all interested in studying the power consumption to that extent is a personal decision. However, this feature can be seen as useful with a certain background knowledge.
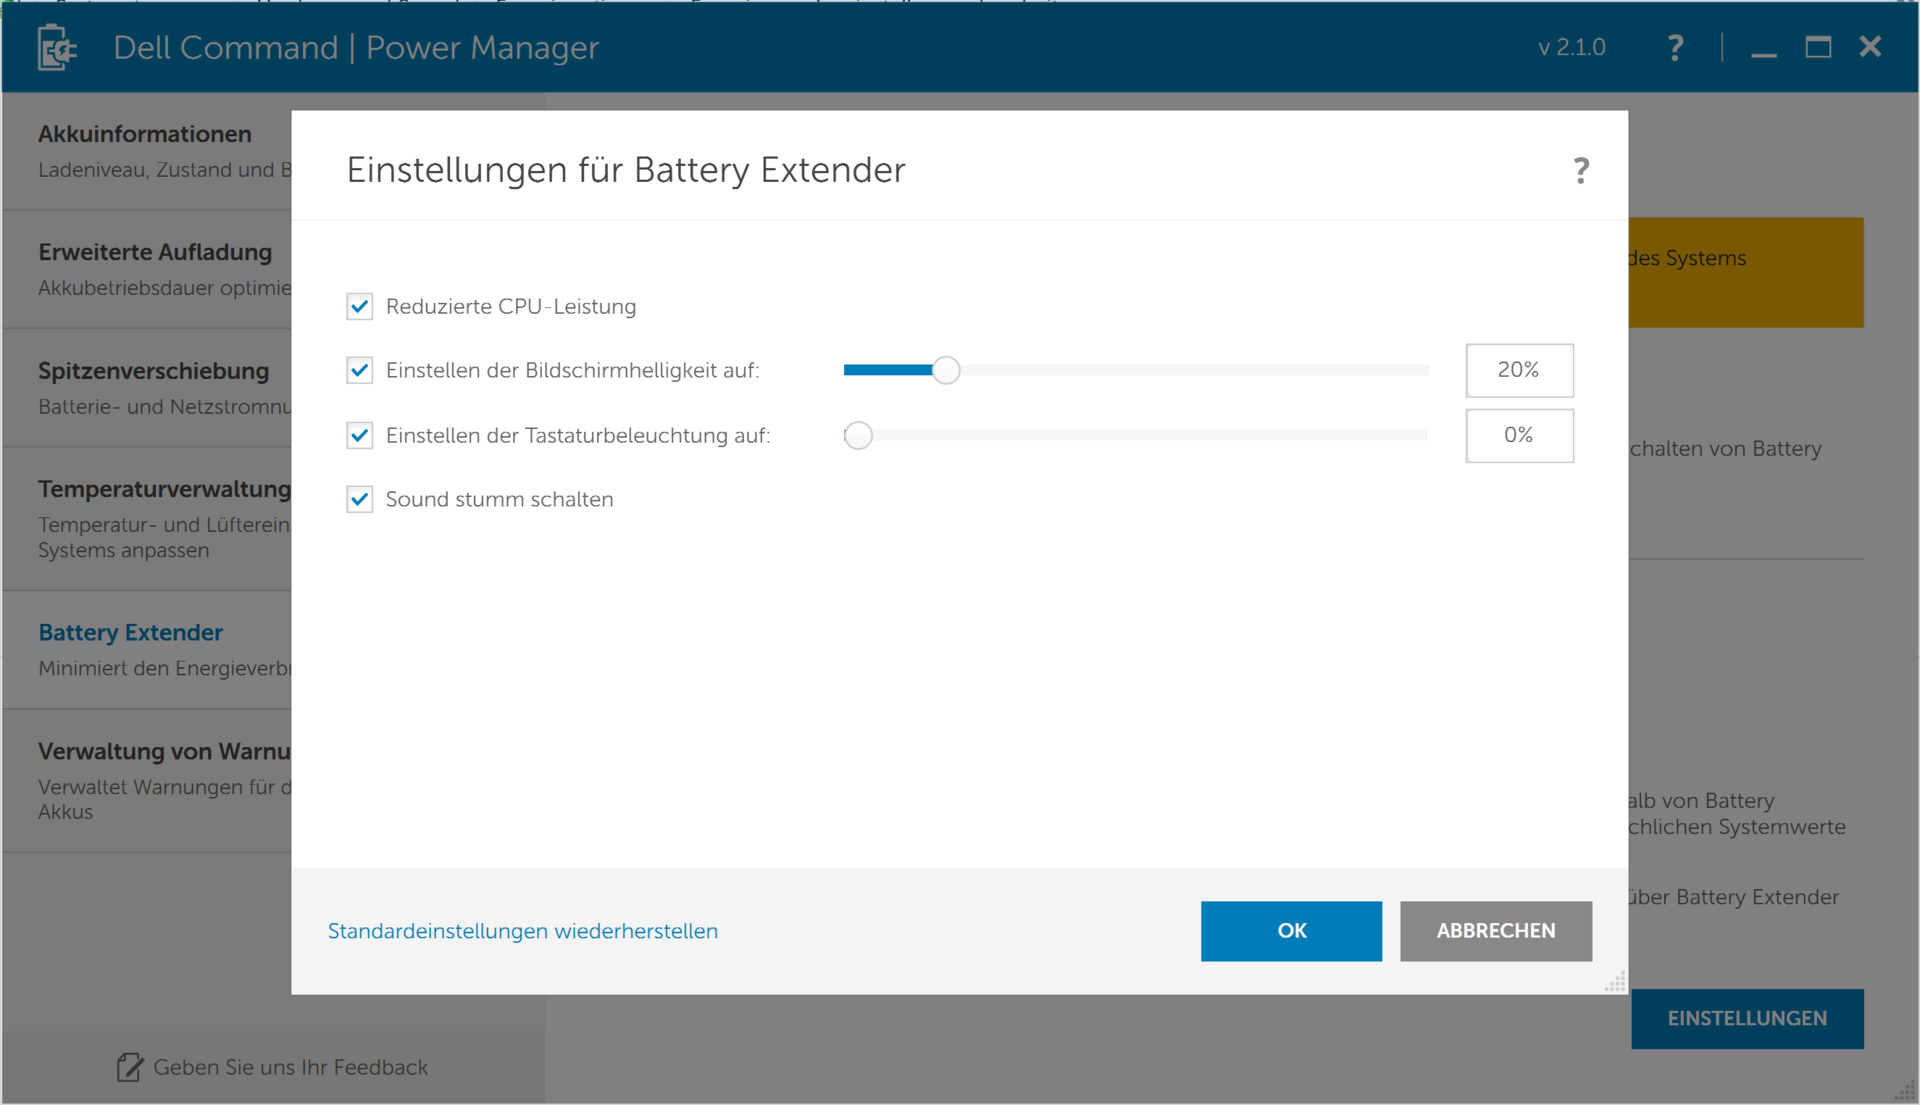
The Battery Extender stores settings that ensure lower power consumption, such as reduced CPU performance or the brightness of the keyboard backlight. The system utilizes the settings made here when the plug is pulled from the outlet.
| Dell XPS 13-9350 Touch 6500U 56Wh | Dell XPS 13-9350 Non-Touch 6200U 56Wh | Dell XPS 13-9343 Touch 5200U 52Wh | Dell XPS 13-9343 Non-Touch 5200U 54Wh | Apple MB Air 13 2015-03 5650U 54Wh | MS Surface Pro 4 6300U 38Wh | MS Surface Book 6300U 69Wh | |
|---|---|---|---|---|---|---|---|
| Battery Runtime | 17% | 26% | 48% | 46% | 7% | 26% | |
| Reader / Idle | 784 | 782 0% | 912 16% | 1295 65% | 1572 101% | 899 15% | 1070 36% |
| WiFi v1.3 | 432 | 451 4% | 598 38% | 620 44% | 427 -1% | 402 -7% | |
| Load | 103 | 150 46% | 140 36% | 145 41% | 97 -6% | 111 8% | 153 49% |
| WiFi | 580 | ||||||
| H.264 | 604 |
Pros
Cons
Verdict
There are plenty of devices to choose from: Should I take the stylish XPS 13 Ultrabook with the razor-thin bezel, or the Surface Pro 4 tablet? Or plainly: XPS 13 FHD vs. XPS 13 QHD? The decision is not dependent on the computing power; both the XPS and Surface compute on the same high level without throttling. The performance difference to the lower priced Core i5 version can be neglected in our opinion.
The shorter runtime of the XPS 13 i7/QHD version compared with the i5/FHD sister model and the comparison to the market speak against it. 5:30 hours are simply too short for a premium-range Ultrabook. Details like ambient brightness control also used by PWM, the poor maintenance options and the poor webcam are certainly worthy of criticism. We will keep our readers updated about insights concerning Content Adaptive Brightness Control (CABC) here.
Many arguments speak for the XPS 13 - including the i5 version - as listed under Pros. The high-quality chassis with the thin bezel is mentioned there, just like the relatively good load performance, the still low noise development, and the high-contrast panel with a high resolution. The potential buyer will have to decide whether or not that is a must. The handling via touch also functions as impeccably as ever, and the same is true for the keys and ClickPad.
For 1549 Euros (~$1653, gross, free of shipping costs, and/or shops), the customer gets a sophisticated subnotebook, which may be one of the best. The former model from 2015 with an i7-5500U and 256 GB SSD is still going strong on the market, and starts at 1500 Euros (~$1601). Although the new version does not sport an extremely faster processor/graphics card, it has Thunderbolt 3 in USB Type C combined with USB 3.1 Gen 2. Thus, not much speaks for buying an older model from 2015; the user is more future-ready with the upcoming docking options via Thunderbolt 3.
Dell XPS 13 2016 i7 256GB QHD
-
02/16/2016 v5(old)
Sebastian Jentsch
Pricecompare
