

Intel Core i7-14700 vs AMD E2-1800 vs AMD E-300
Intel Core i7-14700
► remove from comparison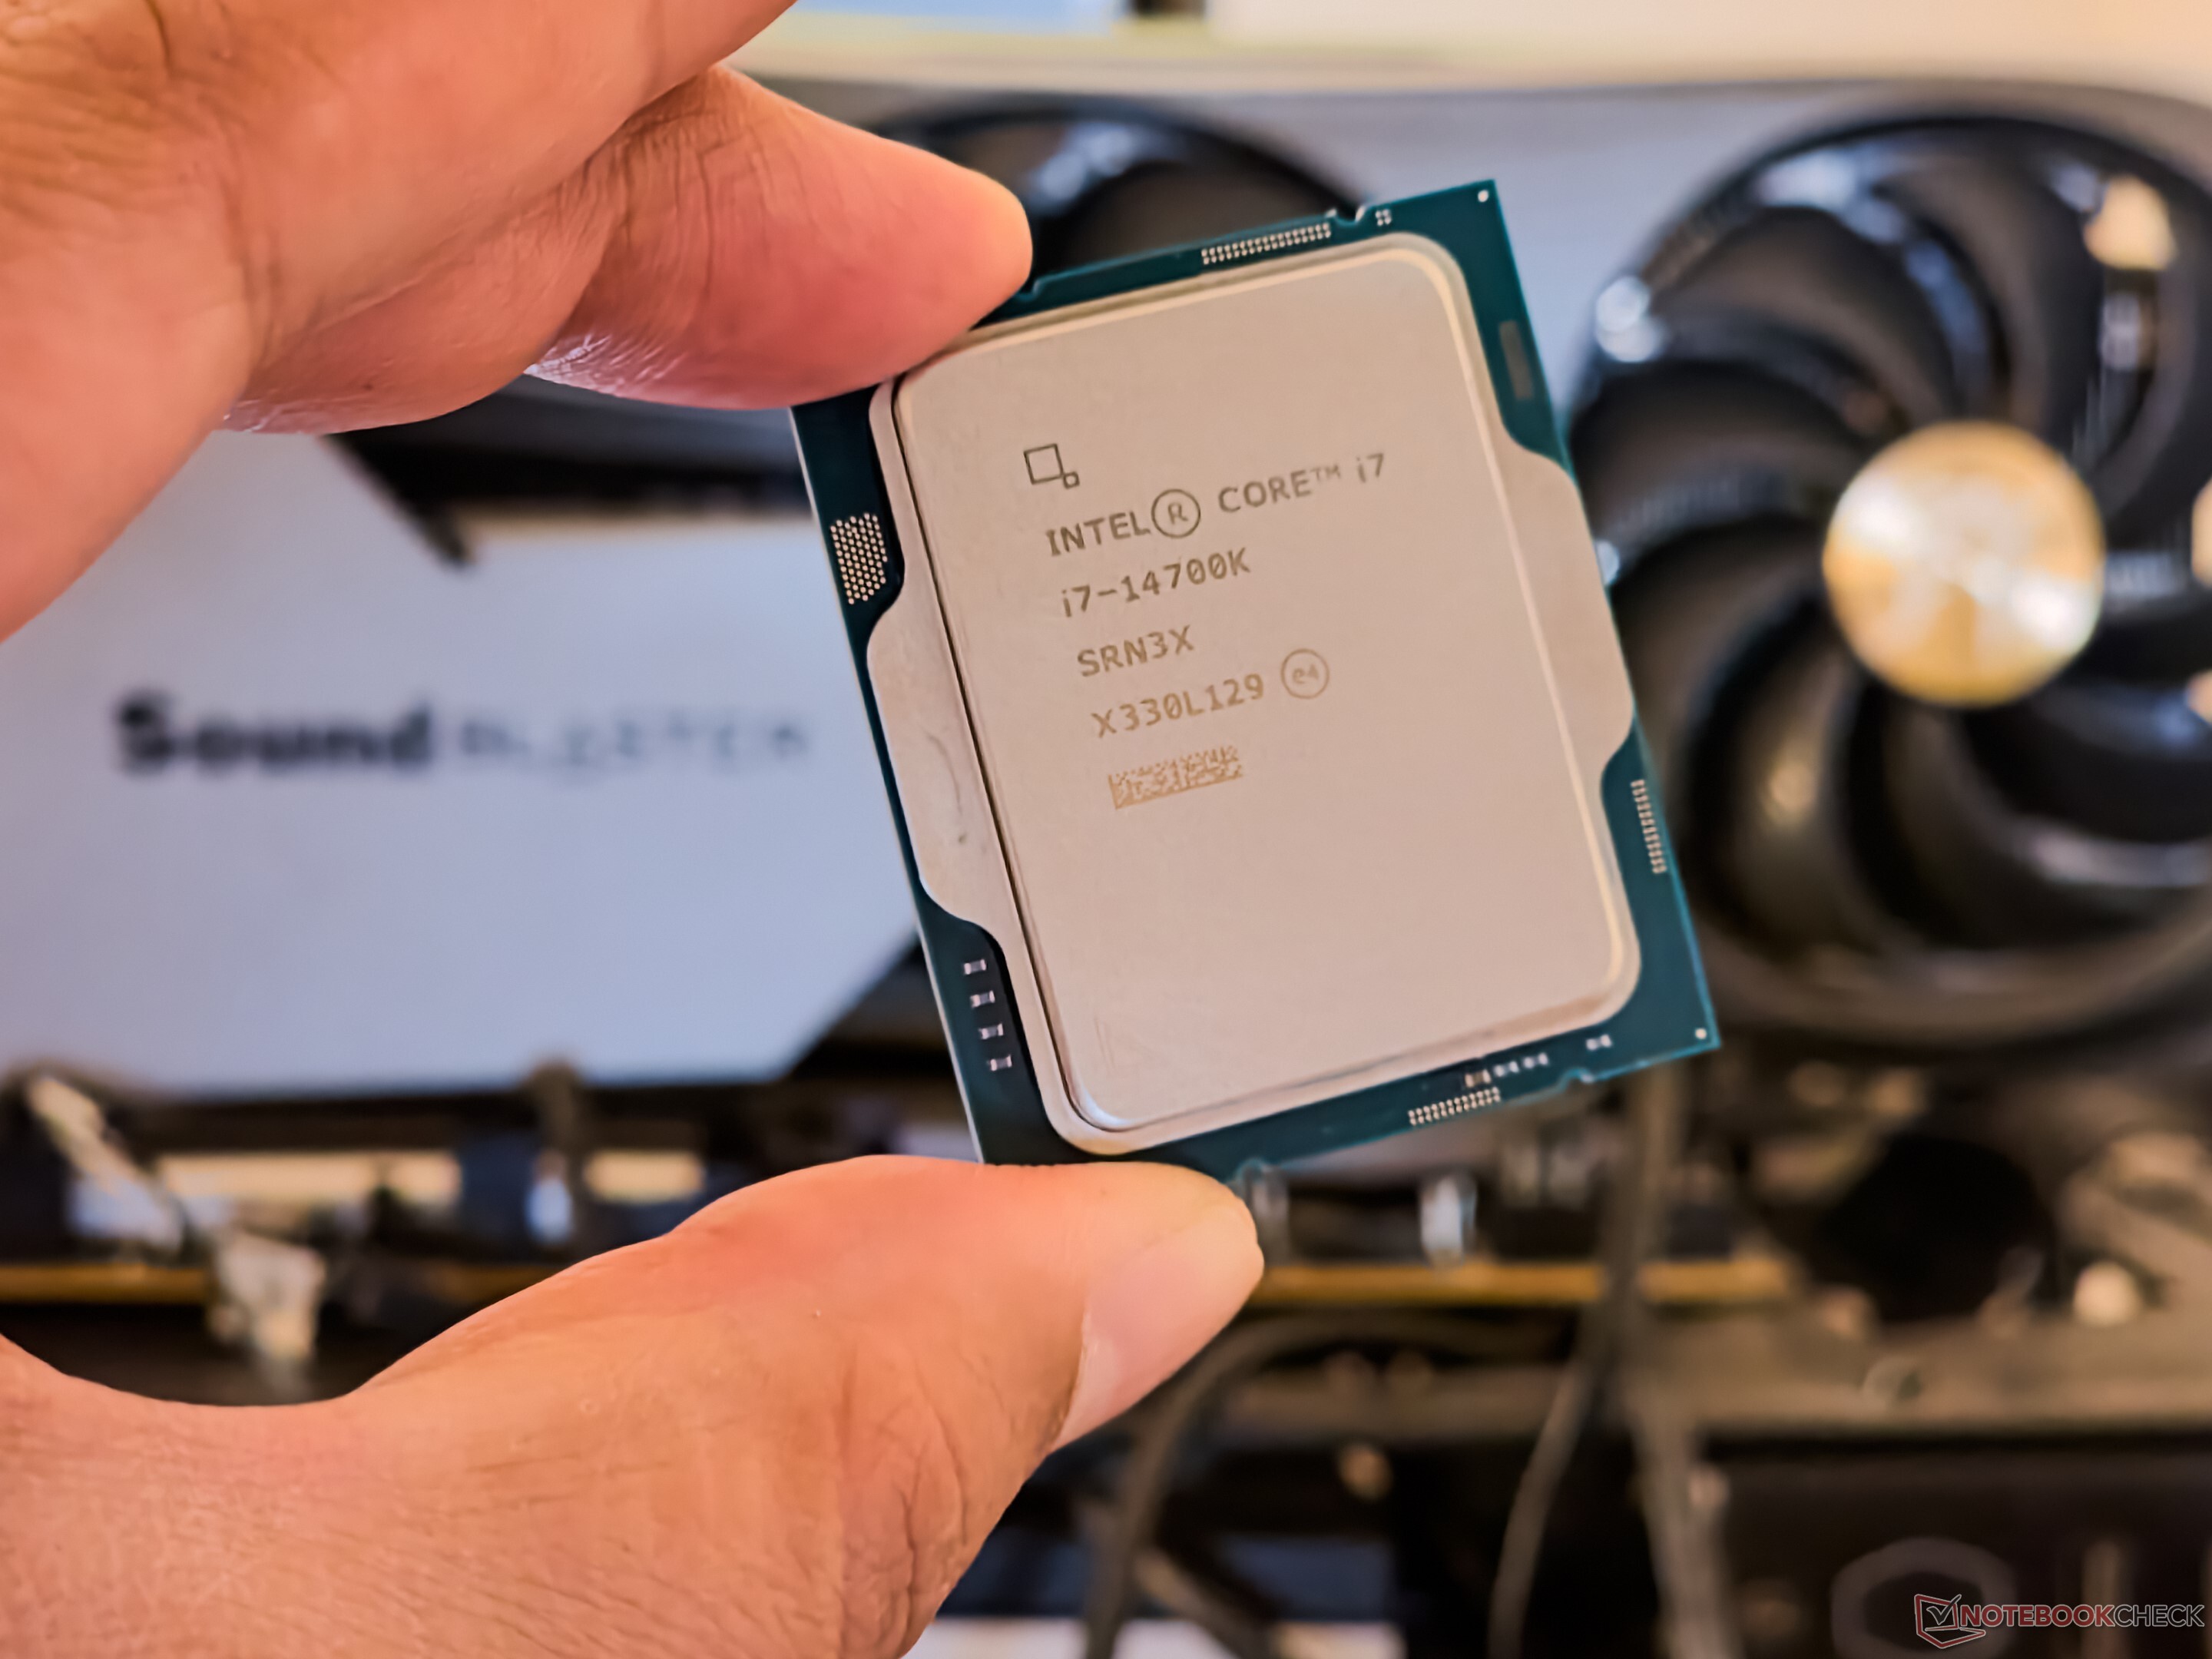
The Intel Core i7-14700 is a desktop processor based on the Raptor Lake architecture, which inherits the 13th generation of Intel Core processors with minor improvements. The processor offers a base clock of 1.5 GHz or 2.1 GHz and reaches up to 5.4 GHz in Turbo. The basic CPU structure remains unchanged. The Intel Core i7-14700 features 8 P-cores and 12 E-cores, allowing up to 28 threads to be processed in parallel. It is also based on the LGA 1700 socket, which was already introduced with Alder Lake.
Graphics unit
Like the Intel Core i7-13700K, the Intel Core i7-14700 also has an integrated graphics unit. The Intel Iris Xe architecture continues to serve as the basis. In terms of performance, however, nothing has changed with the Intel UHD Graphics 770.
Power consumption
The TDP of the Intel Core i7-14700 is 65 watts, with the option of consuming up to 219 watts in Turbo mode.
AMD E2-1800
► remove from comparisonThe AMD E2-1800 (codename Zacate) is a dual core processor for small notebooks and netbooks. It offers a relatively powerful integrated graphics card and a single channel DDR3-1333 memory controller. Compared to the older E-450, the E2-1800 offers only slightly higher CPU (50 MHz) and GPU (20-80 MHz) clock rates.
Inside the E2-1800 two Bobcat cores can access 512KB level 2 cache per core. In comparison to the Atom processors, the Bobcat architecture uses an "out-of-order" execution and is therefore faster at the same clock speed. However, the performance is far worse than similar clocked Penryn (Celeron) or Danube (Athlon II) cores. On average the cpu performance of the E-450 lies a bit beyond a Celeron SU2300 at 1.2 GHz or a Athlon II Neo K325 at 1.3 GHz.
The integrated Radeon HD 7340 graphics card offers 80 shaders and an UVD3 video processor. Compared to the slow GMA 3150 in the Atom processors, the HD7340 offers a lot more performance and is about as fast as the Nvidia ION graphics solution. The difference to the older 6320 in the E-450 is a 20-80MHz higher clock rate.
The power consumption is rated with a TDP of 18 Watt by AMD. According to first reviews of Brazos prototypes the power consumption was between 11 to 29 Watt. This would be on a level of a (much more powerful) 11" MacBook Air using Windows 7.
AMD E-300
► remove from comparisonThe AMD E-300 (codename Zacate) is a low-end dual-core processor designed for the smaller laptops and netbooks. The E-series processor has a relatively fast iGPU and a single channel DDR3-1066 memory controller.
An E-300 has two Bobcat processor cores running at 1.3 GHz, each with the access to 512 KB of Level 2 cache (1 M in total). In comparison to the Atom processors, the Bobcat architecture uses an out-of-order execution and is therefore faster at the same clock speed.
The Radeon HD 6310 iGPU has 80 unified shaders and an UVD3 video processing engine. The iGPU has no trouble outshining the Intel GMA 3150 in the Atom processors, and it does not lag behind the Nvidia ION, either. The Radeon has support for HDMI 1.4a video output.
Performance
The average E-300 in our database is in the same league as the A4-1250, as far as multi-thread benchmark scores are concerned. Which isn't a great result. This is a fairly slow chip, as of mid 2022; expect to see plenty of slowdowns no matter what it is that you are currently doing.
Power consumption
This APU has a default TDP of 18 W, meaning an active cooling solution is a must.
The AMD E-300 is manufactured on a 32 nm process leading to really, really low, as of 2022, energy efficiency.
| Model | Intel Core i7-14700 | AMD E2-1800 | AMD E-300 | ||||||||||||||||||||||||||||||||||||||||||||||||||||||||||||||||||||||||||||||||||||||||||||
| Codename | Raptor Lake | Zacate | Zacate | ||||||||||||||||||||||||||||||||||||||||||||||||||||||||||||||||||||||||||||||||||||||||||||
| Series | Intel Raptor Lake-R | AMD E-Series | AMD E-Series | ||||||||||||||||||||||||||||||||||||||||||||||||||||||||||||||||||||||||||||||||||||||||||||
| Series: E-Series Zacate |
|
|
| ||||||||||||||||||||||||||||||||||||||||||||||||||||||||||||||||||||||||||||||||||||||||||||
| Clock | 1500 - 5400 MHz | 1700 MHz | 1300 MHz | ||||||||||||||||||||||||||||||||||||||||||||||||||||||||||||||||||||||||||||||||||||||||||||
| L2 Cache | 28 MB | 1 MB | 1 MB | ||||||||||||||||||||||||||||||||||||||||||||||||||||||||||||||||||||||||||||||||||||||||||||
| L3 Cache | 33 MB | ||||||||||||||||||||||||||||||||||||||||||||||||||||||||||||||||||||||||||||||||||||||||||||||
| Cores / Threads | 20 / 28 8 x 5.4 GHz Intel Raptor Cove P-Core 12 x 4.2 GHz Intel Gracemont E-Core | 2 / 2 | 2 / 2 | ||||||||||||||||||||||||||||||||||||||||||||||||||||||||||||||||||||||||||||||||||||||||||||
| TDP | 65 Watt | 18 Watt | 18 Watt | ||||||||||||||||||||||||||||||||||||||||||||||||||||||||||||||||||||||||||||||||||||||||||||
| TDP Turbo PL2 | 219 Watt | ||||||||||||||||||||||||||||||||||||||||||||||||||||||||||||||||||||||||||||||||||||||||||||||
| Technology | 10 nm | 40 nm | 32 nm | ||||||||||||||||||||||||||||||||||||||||||||||||||||||||||||||||||||||||||||||||||||||||||||
| max. Temp. | 100 °C | ||||||||||||||||||||||||||||||||||||||||||||||||||||||||||||||||||||||||||||||||||||||||||||||
| Socket | LGA 1700 | FT1 BGA 413-Ball | FT1 (BGA413) | ||||||||||||||||||||||||||||||||||||||||||||||||||||||||||||||||||||||||||||||||||||||||||||
| Features | Intel UHD Graphics 770, max. 192 GB of DDR5 5600 MT/s or DDR4 3200 MT/s | MMX(+), SSE(1,2,3,3S,4A), AMD-V | DDR3-1066 RAM (sin. chan.), PCIe 2 [?], MMX, SSE, SSE2, SSE3, SSSE3, SSE4A, SVM | ||||||||||||||||||||||||||||||||||||||||||||||||||||||||||||||||||||||||||||||||||||||||||||
| iGPU | Intel UHD Graphics 770 (300 - 1600 MHz) | AMD Radeon HD 6310 | |||||||||||||||||||||||||||||||||||||||||||||||||||||||||||||||||||||||||||||||||||||||||||||
| Architecture | x86 | x86 | x86 | ||||||||||||||||||||||||||||||||||||||||||||||||||||||||||||||||||||||||||||||||||||||||||||
| $384 U.S. | |||||||||||||||||||||||||||||||||||||||||||||||||||||||||||||||||||||||||||||||||||||||||||||||
| Announced | |||||||||||||||||||||||||||||||||||||||||||||||||||||||||||||||||||||||||||||||||||||||||||||||
| Manufacturer | www.intel.com | www.amd.com | |||||||||||||||||||||||||||||||||||||||||||||||||||||||||||||||||||||||||||||||||||||||||||||
| L1 Cache | 128 KB | 128 KB | |||||||||||||||||||||||||||||||||||||||||||||||||||||||||||||||||||||||||||||||||||||||||||||
| Die Size | 75 mm2 | 75 mm2 |

Benchmarks
Average Benchmarks Intel Core i7-14700 → 0% n=0
Average Benchmarks AMD E2-1800 → 0% n=0
Average Benchmarks AMD E-300 → 0% n=0
* Smaller numbers mean a higher performance
1 This benchmark is not used for the average calculation