Notebookcheck Logo

Intel Core Ultra 9 285 vs Intel Core Ultra 5 235

Intel Core Ultra 9 285

► remove from comparison Intel Ultra 9 285

The Intel Core Ultra 9 285 is an Arrow Lake-based desktop processor with 24 cores in two clusters. The 8 performance cores clock at up to 5.6 GHz and the 16 smaller efficiency cores at up to 4.6 GHz.

Due to the lower clock rate and the low TDP, the CPU performance is slightly below the Core Ultra 9 285K is positioned.

The Arrow Lake-S chips are composed of several chiplets. The CPU part is manufactured at TSMC in the modern N3B (3nm) process, the GPU also comes from TSMC in the N5P process. The SoC and I/O tile are manufactured in the TSMC N6 process. The base tile is manufactured by Intel in the 22nm process and carries the individual chiplets thanks to Fovero's 3D packaging.

The TDP is specified at 65 watts (long-term) to 182 watts (Turbo).

Intel Core Ultra 5 235

► remove from comparison Intel Ultra 5 235

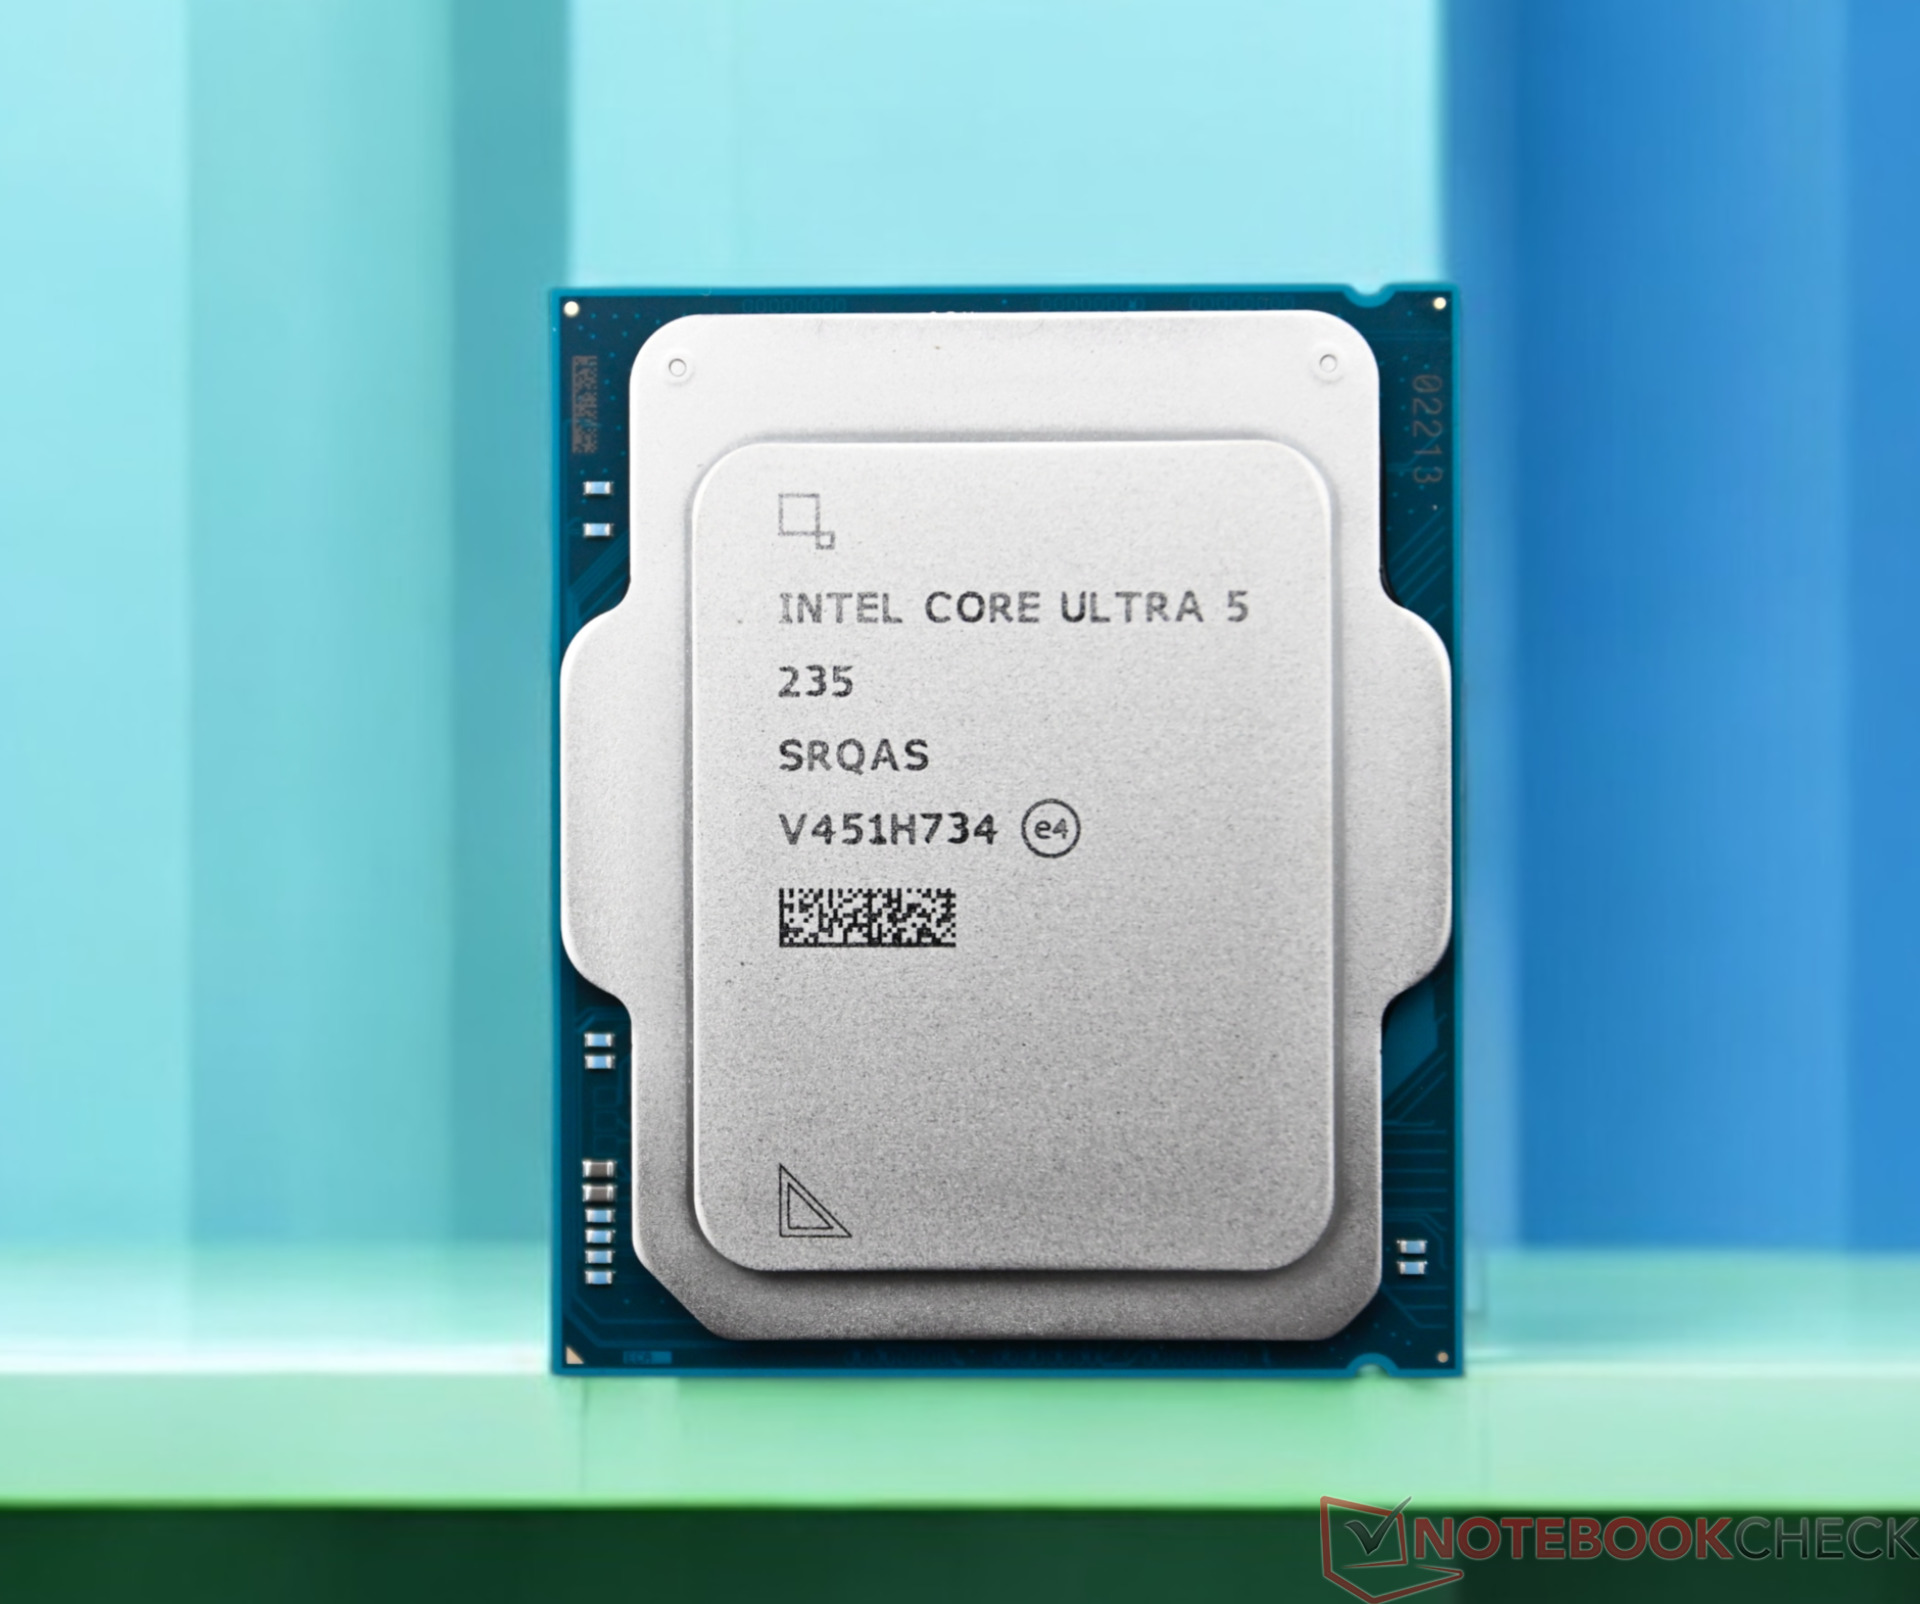
The Intel Core Ultra 5 235 is a desktop processor based on the Arrow Lake-S series that was introduced at the beginning of 2025. It offers 14 cores divided in 6 performance cores with up to 5 GHz and 8 efficiency cores with up to 4.4 GHz.

The CPU performance is comparable to the old Intel Core i5-13600K and therefore well suited for demanding tasks.

The Arrow Lake-S chips are composed of several chiplets. The CPU part is manufactured at TSMC in the modern N3B (3nm) process, the GPU also comes from TSMC in the N5P process. The SoC and I/O tile are manufactured in the TSMC N6 process. The base tile is manufactured by Intel in the 22nm process and carries the individual chiplets thanks to Fovero's 3D packaging.

The TDP is specified at 65 watts (long-term) to 121 watts (Turbo).

ModelIntel Core Ultra 9 285Intel Core Ultra 5 235
CodenameArrow Lake-SArrow Lake-S
SeriesIntel Arrow LakeIntel Arrow Lake
Series: Arrow Lake Arrow Lake-S
Intel Core Ultra 9 285K compare3.2 - 5.7 GHz24 / 24 cores36 MB L3
Intel Core Ultra 9 285 « 1.9 - 5.6 GHz24 / 24 cores36 MB L3
Intel Core Ultra 5 245K compare3.6 - 5.2 GHz14 / 14 cores24 MB L3
Intel Core Ultra 5 245 compare3 - 5.1 GHz14 / 14 cores24 MB L3
Intel Core Ultra 5 2353.4 - 5 GHz14 / 14 cores24 MB L3
Intel Core Ultra 5 225F compare3.3 - 4.9 GHz10 / 10 cores20 MB L3
Intel Core Ultra 9 285K compare3.2 - 5.7 GHz24 / 24 cores36 MB L3
Intel Core Ultra 9 2851.9 - 5.6 GHz24 / 24 cores36 MB L3
Intel Core Ultra 5 245K compare3.6 - 5.2 GHz14 / 14 cores24 MB L3
Intel Core Ultra 5 245 compare3 - 5.1 GHz14 / 14 cores24 MB L3
Intel Core Ultra 5 235 « 3.4 - 5 GHz14 / 14 cores24 MB L3
Intel Core Ultra 5 225F compare3.3 - 4.9 GHz10 / 10 cores20 MB L3
Clock1900 - 5600 MHz3400 - 5000 MHz
L2 Cache39.3 MB26 MB
L3 Cache36 MB24 MB
Cores / Threads24 / 24
8 x 5.6 GHz Intel Lion Cove P-core
16 x 4.6 GHz Intel Skymont E-core
14 / 14
6 x 5.0 GHz Intel Lion Cove P-core
8 x 4.4 GHz Intel Skymont E-core
TDP65 Watt65 Watt
TDP Turbo PL2182 Watt121 Watt
Technology3 nm
max. Temp.105 °C
SocketLGA1851LGA1851
iGPUIntel Graphics 4-Core iGPU (Arc) ( - 2000 MHz)Intel Graphics 4-Core iGPU (Arc) (300 - 2000 MHz)
NPU / AI13 TOPS INT813 TOPS INT8
Architecturex86x86
Announced
Manufacturerwww.intel.comwww.intel.de
$247 U.S.

Benchmarks

Performance Rating - CB R15 + R20 + 7-Zip + X265 + Blender + 3DM11 CPU - Ultra 5 235
43.8 pt (73%)
Restrict / Search: Model: Max. age: years
Cinebench 2024 - Cinebench 2024 CPU Single Core
127 Points (71%)
Cinebench 2024 - Cinebench 2024 CPU Multi Core
1172 Points (22%)
Cinebench R23 - Cinebench R23 Multi Core
21677 Points (20%)
Cinebench R23 - Cinebench R23 Single Core
2057 Points (87%)
Cinebench R20 - Cinebench R20 CPU (Single Core)
795 Points (87%)
Cinebench R20 - Cinebench R20 CPU (Multi Core)
8518 Points (21%)
Cinebench R15 - Cinebench R15 CPU Multi 64 Bit
3642 Points (23%)
Cinebench R15 - Cinebench R15 CPU Single 64 Bit
312 Points (86%)
Cinebench R11.5 - Cinebench R11.5 CPU Multi 64 Bit
44.3 Points (57%)
Cinebench R11.5 - Cinebench R11.5 CPU Single 64 Bit
3.8 Points (90%)
Cinebench R10 - Cinebench R10 Rend. Single (32bit)
11400 Points (69%)
Cinebench R10 - Cinebench R10 Rend. Multi (32bit)
84924 Points (62%)
Cinebench R10 - Cinebench R10 Rend. Multi (64bit)
131431 Points (84%)
Cinebench R10 - Cinebench R10 Rend. Single (64bit)
17602 Points (21%)
wPrime 2.10 - wPrime 2.0 1024m *
77.7 s (1%)
wPrime 2.10 - wPrime 2.0 32m *
2.8 s (1%)
WinRAR - WinRAR 4.0
9883 Points (16%)
7-Zip 18.03 - 7-Zip 18.03 Multi Thread 4 runs
71174 MIPS (41%)
7-Zip 18.03 - 7-Zip 18.03 Single Thread 4 runs
6479 MIPS (76%)
X264 HD Benchmark 4.0 - x264 Pass 2
200.9 fps (5%)
X264 HD Benchmark 4.0 - x264 Pass 1
378 fps (10%)
HWBOT x265 Benchmark v2.2 - HWBOT x265 4k Preset
25 fps (44%)
TrueCrypt - TrueCrypt Serpent
1.4 GB/s (41%)
TrueCrypt - TrueCrypt Twofish
2.8 GB/s (48%)
TrueCrypt - TrueCrypt AES
15.9 GB/s (41%)
Blender - Blender 3.3 Classroom CPU *
278 Seconds (4%)
Blender - Blender 2.79 BMW27 CPU *
168 Seconds (1%)
R Benchmark 2.5 - R Benchmark 2.5 *
0.4 sec (9%)
3DMark 06 - CPU - 3DMark 06 - CPU
19133 Points (41%)
Super Pi mod 1.5 XS 1M - Super Pi mod 1.5 XS 1M *
7.6 s (2%)
Super Pi mod 1.5 XS 2M - Super Pi mod 1.5 XS 2M *
16.7 s (1%)
3DMark Vantage - 3DM Vant. Perf. CPU no Physx
104702 Points (80%)
3DMark 11 - 3DM11 Performance Physics
26990 Points (66%)
3DMark - 3DMark Ice Storm Physics
113507 Points (92%)
3DMark - 3DMark Ice Storm Extreme Physics
114645 Points (93%)
3DMark - 3DMark Ice Storm Unlimited Physics
116826 Points (94%)
3DMark - 3DMark Cloud Gate Physics
24481 Points (62%)
3DMark - 3DMark Fire Strike Standard Physics
37722 Points (67%)
3DMark - 3DMark Time Spy CPU
16138 Points (68%)
Geekbench 6.5 - Geekbench 6.5 Single-Core
3061 Points (74%)
2971 Points (72%)
Geekbench 6.5 - Geekbench 6.5 Multi-Core
19926 Points (77%)
17484 Points (68%)
Geekbench 5.5 - Geekbench 5.1 - 5.5 64 Bit Single-Core
2171 Points (82%)
Geekbench 5.5 - Geekbench 5.1 - 5.5 64 Bit Multi-Core
17696 Points (32%)
Geekbench 5.0 - Geekbench 5.0 64 Bit Single-Core
2127 Points (9%)
Geekbench 5.0 - Geekbench 5.0 64 Bit Multi-Core
17664 Points (56%)
Geekbench 4.4 - Geekbench 4.1 - 4.4 64 Bit Single-Core
9043 Points (90%)
Geekbench 4.4 - Geekbench 4.1 - 4.4 64 Bit Multi-Core
65823 Points (65%)
Mozilla Kraken 1.1 - Kraken 1.1 Total Score *
436 ms (1%)
WebXPRT 4 - WebXPRT 4 Score
313 Points (86%)
WebXPRT 3 - WebXPRT 3 Score
329 Points (59%)
CrossMark - CrossMark Overall
2131 Points (80%)
Power Consumption - Prime95 Power Consumption - external Monitor *
163 Watt (28%)
Power Consumption - Cinebench R15 Multi Power Consumption - external Monitor *
225 Watt (41%)
Power Consumption - Idle Power Consumption - external Monitor *
92.3 Watt (61%)
Power Consumption - Power Efficiency - Cinebench R15 Multi external Monitor
16.2 Points per Watt (12%)

Average Benchmarks Intel Core Ultra 5 235 → 0% n=0

- Range of benchmark values for this graphics card
red legend - Average benchmark values for this graphics card
* Smaller numbers mean a higher performance
1 This benchmark is not used for the average calculation

Add one or more devices and compare

In the following list you can select (and also search for) devices that should be added to the comparison. You can select more than one device.

restrict list:
v1.34
log 08. 03:03:50

#0 ran 0s before starting gpusingle class +0s ... 0s

#1 checking url part for id 18617 +0s ... 0s

#2 checking url part for id 19651 +0s ... 0s

#3 redirected to Ajax server, took 1759885430s time from redirect:0 +0s ... 0s

#4 did not recreate cache, as it is less than 5 days old! Created at Tue, 07 Oct 2025 05:18:31 +0200 +0s ... 0s

#5 composed specs +0.004s ... 0.004s

#6 did output specs +0s ... 0.004s

#7 getting avg benchmarks for device 18617 +0s ... 0.004s

#8 got single benchmarks 18617 +0.001s ... 0.005s

#9 getting avg benchmarks for device 19651 +0.004s ... 0.009s

#10 got single benchmarks 19651 +0.005s ... 0.014s

#11 got avg benchmarks for devices +0s ... 0.014s

#12 No cached benchmark found, getting uncached values +0.021s ... 0.035s

#13 No cached benchmark found, getting uncached values +0.001s ... 0.036s

#14 min, max, avg, median took s +0.007s ... 0.043s

#15 return log +0s ... 0.043s

Please share our article, every link counts!
Mail Logo
> Expert Reviews and News on Laptops, Smartphones and Tech Innovations > Benchmarks / Tech > Processor Comparison - Head 2 Head
Redaktion, 2017-09- 8 (Update: 2023-07- 1)