

Intel Core Ultra 5 235HX vs Apple M4 (9 cores) vs Intel Core Ultra 7 255HX
Intel Core Ultra 5 235HX
► remove from comparisonThe Intel Core Ultra 5 235HX is a fast mid-range mobile CPU for gaming notebooks based on the Arrow Lake architecture. It offers 20 cores consisting of 6 of the 8 fast performance cores with up to 5.1 GHz and 8 of the 16 smaller efficiency cores with up to 4.5 GHz clock speed. The CPU can access 24 MB L2 cache and 26 MB L3 cache and is specified with a TDP of 55 watts.
The SoC integrates a small dedicated NPU called AI Boost with 13 TOPS (Int8) and optionally supports vPro Essentials. The integrated memory controller supports up to 192 GB DDR5-6400 (dual channel, ECC optional). The integrated GPU (iGPU) is a small Intel Graphics graphics card with three of the four Xe cores running at 300 - 1800 MHz.
Performance - High End
Thanks to the improved IPC of the cores (especially the efficiency cores), the CPU should be just before or at the level of the Raptor Lake Core i9-14500HX (6 + 8 cores, max 5 / 3.5 GHz). This makes the CPU very suitable for demanding tasks such as high-end gaming (2024 games) and content creation. The performance difference to the Core Ultra 5 245HX is only slight, as the CPUs only differ in the base clock of the performance cores (2.9 vs 3.1 GHz).
Production - TSMC and Foveros
The Arrow Lake-HX chips are based on the desktop Arrow Lake-S chips and are composed of several chiplets. The CPU part is manufactured at TSMC in the modern N3B (3nm) process, the GPU also comes from TSMC in the N5P process. The SoC and I/O tile are manufactured in the TSMC N6 process. The base tile is manufactured by Intel in the 22nm process and carries the individual chiplets thanks to Fovero's 3D packaging.
Apple M4 (9 cores)
► remove from comparison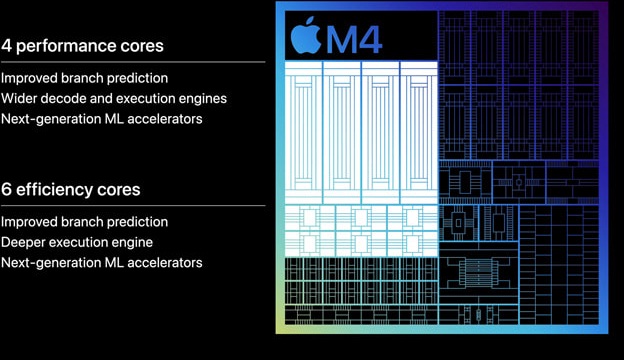
The 9-core Apple M4 is a rather fast ARM architecture processor (SoC) that sports 9 CPU cores, a 16-core neural engine and a 10-core GPU with hardware RT support and other modern features. Wi-Fi 6E and Bluetooth 5.3 as well as Thunderbolt 3 and USB 4 are all onboard, too. The M4 debuted in May 2024 as part of an iPad launch event; it has 3 performance cores running at a clock speed of up to 4.3 GHz and 6 efficient cores running at way under 3 GHz whereas the M3 (10 GPU cores) has 4 performance cores and 4 efficiency cores.
The faster 10-core M4 chip delivers 10% higher multi-thread performance and 15% higher graphics performance, to give you a rough figure. More importantly, the 10-core M4 can be had in systems with an active cooling solution, such as Fall 2024 MacBook Pros, whereas the 9-core one is an iPad Pro exclusive. Systems with a fan deliver much higher sustained performance than the ones without it.
Architecture and Features
The new CPU cores run at faster clock speeds than what the M3 was capable of and they also feature minor architectural improvements. The CPU cores are thought to be based on the ARM v9.4-A microarchitecture to a certain degree. The M4 comes with 16 GB or more (depending on the SKU) of on-package LPDDR5x-7500 RAM whereas the M3 was limited to 6400 MT/s. The updated NPU delivers up to 38 TOPS of performance for AI workloads.
Performance
Single-thread performance, multi-thread performance and NPU performance all got a noticeable boost compared to what we had with the M3 (10 GPU cores). The new processor is about 11% faster than the M3 in short-term multi-thread workloads while besting every M3 series chip possible in single-thread tasks by a comfortable margin. Geekbench 6.2 Multi puts the 9-core M4 right above the Core i9-13900H and the Ryzen 7 7840HS; in fact, the M4 is just 3% slower than Intel's top-of-the-line Core Ultra 9 185H chip. A 13% to 18% single-thread performance improvement over M3 series chips is evident if we look at Mozilla's Kraken test results. Octane V2 seems to think the M4 is just 4% slower than Intel's mighty Core i9-14900HX. CrossMark results suggest the M4 is about as fast as the Core i9-13900H.
The 10-core M4 is about 10% faster in multi-threaded tasks than the 9-core part is. It also delivers just slightly higher single-thread performance.
While Apple undoubtedly deserves some praise for what it managed to do here, it is important to highlight that all of the tests we did involve short-term workloads only. The M4 will suffer from heavy throttling if subjected to long-term workloads as there is no active cooling inside that super-thin iPad Pro case.
Graphics
The M4 GPU (10 cores) has hardware support for ray tracing as well as mesh shading and other modern technologies. It supports external displays with resolutions as high as "8K".
As far as performance is concerned, it appears the 9-core M4's GPU runs at significantly lower clock speeds than the (otherwise the same) GPU built into the 10-core M4 chip. This leads to a disappointing situation where what's supposedly a newer graphics adapter is about 10% slower than the 10-core GPU built into the M3. Still, this M4 GPU delivers very decent benchmark scores that put it in the same ballpark as the Radeon RX 6500M.
Power consumption
The chip's sustained power consumption is limited to ~7 W, with short-term peaks of up to 14 W possible.
The chip is built with a "second generation" 3 nm TSMC process that's still cutting-edge as of late 2024.
Intel Core Ultra 7 255HX
► remove from comparisonThe Intel Core Ultra 7 255HX is a mobile high-end CPU for gaming notebooks based on the Arrow Lake architecture. It offers 20 cores consisting of 8 fast performance cores with up to 5.2 GHz and 12 of the 16 smaller efficiency cores with up to 4.5 GHz clock speed. The CPU has access to 30 MB L2 cache and 36 MB L3 cache and is specified with a TDP of 55 watts.
The SoC integrates a small dedicated NPU called AI Boost with 13 TOPS (Int8) and optionally supports vPro Essentials. The integrated memory controller supports up to 192 GB DDR5-6400 (dual channel, ECC optional). The integrated GPU (iGPU) is a small Intel Graphics graphics card with four Xe cores running at 300 - 1850 MHz.
Performance - High End
Thanks to the improved IPC of the cores (especially the efficiency cores), the CPU should perform just behind or at the level of the Raptor Lake Core i9-14700HX (8 + 12 cores, max 5.5 / 3.9 GHz). This makes the CPU ideal for demanding tasks such as high-end gaming and content creation.
Production - TSMC and Foveros
The Arrow Lake-HX chips are based on the desktop Arrow Lake-S chips and are composed of several chiplets. The CPU part is manufactured at TSMC in the modern N3B (3nm) process, the GPU also comes from TSMC in the N5P process. The SoC and I/O tile are manufactured in the TSMC N6 process. The base tile is manufactured by Intel in the 22nm process and carries the individual chiplets thanks to Fovero's 3D packaging.
| Model | Intel Core Ultra 5 235HX | Apple M4 (9 cores) | Intel Core Ultra 7 255HX | ||||||||||||||||||||||||||||||||||||||||||||||||||||||||||||||||||||||||||||
| Codename | Arrow Lake-HX | Arrow Lake-HX | |||||||||||||||||||||||||||||||||||||||||||||||||||||||||||||||||||||||||||||
| Series | Intel Arrow Lake | Apple M4 | Intel Arrow Lake | ||||||||||||||||||||||||||||||||||||||||||||||||||||||||||||||||||||||||||||
| Series: Arrow Lake Arrow Lake-HX |
|
|
| ||||||||||||||||||||||||||||||||||||||||||||||||||||||||||||||||||||||||||||
| Clock | 2600 - 5100 MHz | 2900 - 4400 MHz | 2300 - 5200 MHz | ||||||||||||||||||||||||||||||||||||||||||||||||||||||||||||||||||||||||||||
| L2 Cache | 24 MB | 4 MB | 30 MB | ||||||||||||||||||||||||||||||||||||||||||||||||||||||||||||||||||||||||||||
| L3 Cache | 26 MB | 36 MB | |||||||||||||||||||||||||||||||||||||||||||||||||||||||||||||||||||||||||||||
| Cores / Threads | 14 / 14 6 x 5.1 GHz Intel Lion Cove P-core 8 x 4.5 GHz Intel Skymont E-core | 9 / 9 3 x 4.4 GHz Apple M4 P-Core 6 x 2.9 GHz Apple M4 E-Core | 20 / 20 8 x 5.2 GHz Intel Lion Cove P-core 12 x 4.5 GHz Intel Skymont E-core | ||||||||||||||||||||||||||||||||||||||||||||||||||||||||||||||||||||||||||||
| TDP | 55 Watt | 9 Watt | 55 Watt | ||||||||||||||||||||||||||||||||||||||||||||||||||||||||||||||||||||||||||||
| TDP Turbo PL2 | 160 Watt | 14 Watt | 160 Watt | ||||||||||||||||||||||||||||||||||||||||||||||||||||||||||||||||||||||||||||
| Technology | 3 nm | 3 nm | 3 nm | ||||||||||||||||||||||||||||||||||||||||||||||||||||||||||||||||||||||||||||
| iGPU | Intel Arc Graphics 3-core GPU (Arrow Lake) (300 - 1800 MHz) | Apple M4 10-core GPU | Intel Graphics 4-Core iGPU (Arc) (300 - 1850 MHz) | ||||||||||||||||||||||||||||||||||||||||||||||||||||||||||||||||||||||||||||
| Architecture | x86 | ARM | x86 | ||||||||||||||||||||||||||||||||||||||||||||||||||||||||||||||||||||||||||||
| Announced | |||||||||||||||||||||||||||||||||||||||||||||||||||||||||||||||||||||||||||||||
| Manufacturer | www.intel.com | www.intel.com | |||||||||||||||||||||||||||||||||||||||||||||||||||||||||||||||||||||||||||||
| Features | Unified Memory LPDDR5X-7500 (120 GB/s), 16-Core Neural Engine, Media Engine (Encoding / Decoding: H.264, HEVC, ProRes, ProRes RAW, AV1 Decoding only) |

Benchmarks

Average Benchmarks Apple M4 (9 cores) → 0% n=0
Average Benchmarks Intel Core Ultra 7 255HX → 0% n=0
* Smaller numbers mean a higher performance
1 This benchmark is not used for the average calculation